Last week was one of the most significant weeks for traders around the world as the markets were expecting the NFP announcement last Friday. As we explained in much detail in the previous week’s Market Outlook, the focus would have been primarily on the major currency pairs and the Canadian Dollar cross pairs because the Bank of Canada was supposed to cut their rates, which they did. Therefore, all the trading scenarios we mentioned last week played out well, as the BoC cut rates to 4.25%. Despite that the NFP was reported as lower than the forecast given, the increase in the number of payrolls added in the US economy compared to the previously reported NFP, and the overall strength of the economic situation in the US based on the reported Average Hourly Earnings, were the clues every trader needs to understand where the US Dollar was about to move during the New York trading session last Friday.
On Monday, the markets usually take time to “digest” last Friday’s moves, and significant news events are usually minimal. Therefore, liquidity and volatility are expected to be normal, and directional moves that started at the end of the previous week are likely to continue this week. During the Asian trading session in Japan, they will report their Trade Balance. As a country that counts a lot on imports and exports, its currency is likely to be affected by the sudden volatility that entered the market during this event’s announcement. Compared to the previous report, the Trade Balance is expected to drop significantly from 556.3B to -424.2B. As for now, the Japanese Yen dominates many of the other currencies on the board. Events like this can cause the markets to enter into retracement phases. At the same time, they will also report the GDP (Gross Domestic Product) in Japan. The forecast shows an unchanged number, staying at 0.8%. Only if the outcome deviates from the forecast report will the Japanese Yen experience a sudden and unexpected directional move. The next event will be the CPI (Consumer Price Index) in China. We always point out that we don’t usually trade the Chinese Yuan, but knowing how it can potentially perform is important as per the current Global events. The CPI in China is expected to increase from 0.5% to 0.7%, and this is likely to be a positive outcome for the Chinese Yuan. The last important event for the day will be the Eurozone’s Investors Confident Index, and an improved number is forecasted for now. The -13.9, as per the current report, is expected to increase to -11. It is not the type of event that creates a lot of “noise” around the Euro, but day trading requires attention when these types of news announcements are released.
On Tuesday, during the Asian session, there won't be any significant news announcements, therefore, the volatility is expected to be normal, as usual. The markets will become more active during the European and London trading session. In Germany, the CPI (Consumer Price Index), which directly affects the Euro, will be reported and is expected to remain at 2% as per the forecast. It is worth mentioning that last week, the Euro was one of the strongest currencies. The next significant event will be the Climant Count Change in the UK. As per the forecast, fewer people are claiming government support compared to the previous report. In the last report, 135K claimed unemployment benefits from the UK’s government. This time, the forecast estimates that only 95K will claim government support. If the forecast confirms the actual report and, at the same time, if the market follows through, Sterling is expected to gain significant strength.
Additionally, the Unemployment Rate in the UK is expected to decrease, which can be seen as a positive outcome for the GBP. Considering the Canadian Dollar’s weakness from last week, if the Sterling strengthens, the GBPCAD might be a good currency pair to look at for long set-ups. The next important event for the day will be the Bank Of Canada Governor Mcleam's speech. Considering that last week the BoC cut their interest rates, and as per the Monetary Policy report after the announcement last Wednesday, now, during his speech, we can get some valuable information about how they are viewing Canada’s economy and how they will likely proceed further with the next interest rates decision. Usually, the Canadian Dollar and the USOIL become more “sensitive” during his speech.
Starting Wednesday, the markets will become more active because of the magnitude of the significant events that will be reported. During the Sydney and Tokyo trading sessions, there won't be any important news that can affect the normal market volatility. The trading activity will become more intense during the London Trading Session because, in the UK, they will report the GDP (Gross Domestic Product). The forecast shows an increase in the country’s GDP by 0.2%. Specifically, the last report was at 0%, and this time is expected to increase to 0.2%. If the actual outcome confirms the forecast and the market follows through, then the strength of the GBP will be noticeable, and it can offer trading opportunities against a weak currency. The next significant news event will be primarily related to the US dollar. In the US, there will be the Presidential Debate and to some extent, this will affect mostly the US Indices. All traders' attention for the day will be on the CPI (Consumer Price Index) announcement in the US. The CPI events usually are followed by enormous volatility. For this report, the forecast estimates a drop from 2.9% to 2.6%. The CPI, as we explained a few times, is among the most important indicators that are highly correlated with inflation. A reported number lower than the previous report and lower than the forecast number is considered a negative for the country’s currency. In this case, if the CPI in the US is reported as per the forecast estimation and if the market follows through, the Greenback will expected to significantly impact negatively, and the US Dollar will weaken. Last week, the Swiss Frank and the Japanese Yen were both much stronger than the US Dollar, and both currency pairs, the USDCHF and the USDJPY, were in downtrends. The CPI can be a catalyst for the downtrends to be continued. The day will end with the Crude Oil inventories report in the US. Since the last report, the number was at -6.9M. If they report fewer barrels this time, it will favour the US dollar as the Crude Oil is priced in US dollars. Additionally, the Crude Oil (or USOIL) is directly correlated with the Canadian Dollar.
The markets are expected to become active early on Thursday morning, as in Japan, right at the start of the Asian Trading Session, they will report their PPI (Producer Price Index). The forecasts estimated a drop from 3% to 2.8%. This can negatively affect the Japanese Yen. Anyhow, all currencies against the Yen are in downtrends. Hence, an event like this can create some corrections or retracement phases for the makers. Usually, it is not the type of event that increases the odds of trend reversals under normal market conditions.
Moving into the London trading session, there won't be any significant news events that they expected to affect the markets with increased volatility, but at the start of New York’s trading session, all trader’s focus will be on the Euro. This is because, in the Eurozone, they will report the Interest Rates. Currency rates are 4.25%, and the forecast shows a significant decrease not only by 25 basis points as usually the central banks do, but they intend to lower them to 3.65%. In case this happens, and simultaneously if the market follows through, we expect not only a highly volatile Euro but also a weak Euro. This event will be enough to affect the Euro negatively, and upon strength in the US Dollar, we can get short trading opportunities on the EURUSD currency pair. Additionally, Euro weakness can also favourable short opportunities on the EURCHF and EURJPY. Traders must always conduct further price chart analysis before initiating any trade.
The last significant event for the day will be the PPI (Producer Price Index) in the US. The forecast shows an increase compared with the previous report. The current number, which is 0.1%, is expected to increase to 0.2%. If the actual confirms the forecast and, at the same time, the markets follow through, this can pair well with the potential weakness of the Euro and strengthen a downward move in the EURUSD. Next will be the Unemployment Claims in the US. This event shows how many people claimed unemployment benefits from the US government for the first time. Currently, the number is 227K, and the consensus estimates an increase to 229K. The last important event for the day will be the ECB (European Central Bank) Press Conference, where we will understand the intentions of the EBC to tighten their monetary policy and proceed with the rate cut. Additionally, we will understand better how to see the future of the eurozone’s economy as it will highly affect the Euro’s performance in the markets.
The week will end with only a few events happening on Friday. The first will be the Eurozone’s Industrial Output. Based on the forecast, it is expected to increase from -3.9% to -2.1%. The last one is the Michigan Consumer Sentiment Index in the US, in which the consensus shows an increase from 67.9 to 68. Both these events don’t usually bring drastic changes to the current market trend. Most of the time, they only affect the short-term volatility while they are reporting.
EUR USD 4H

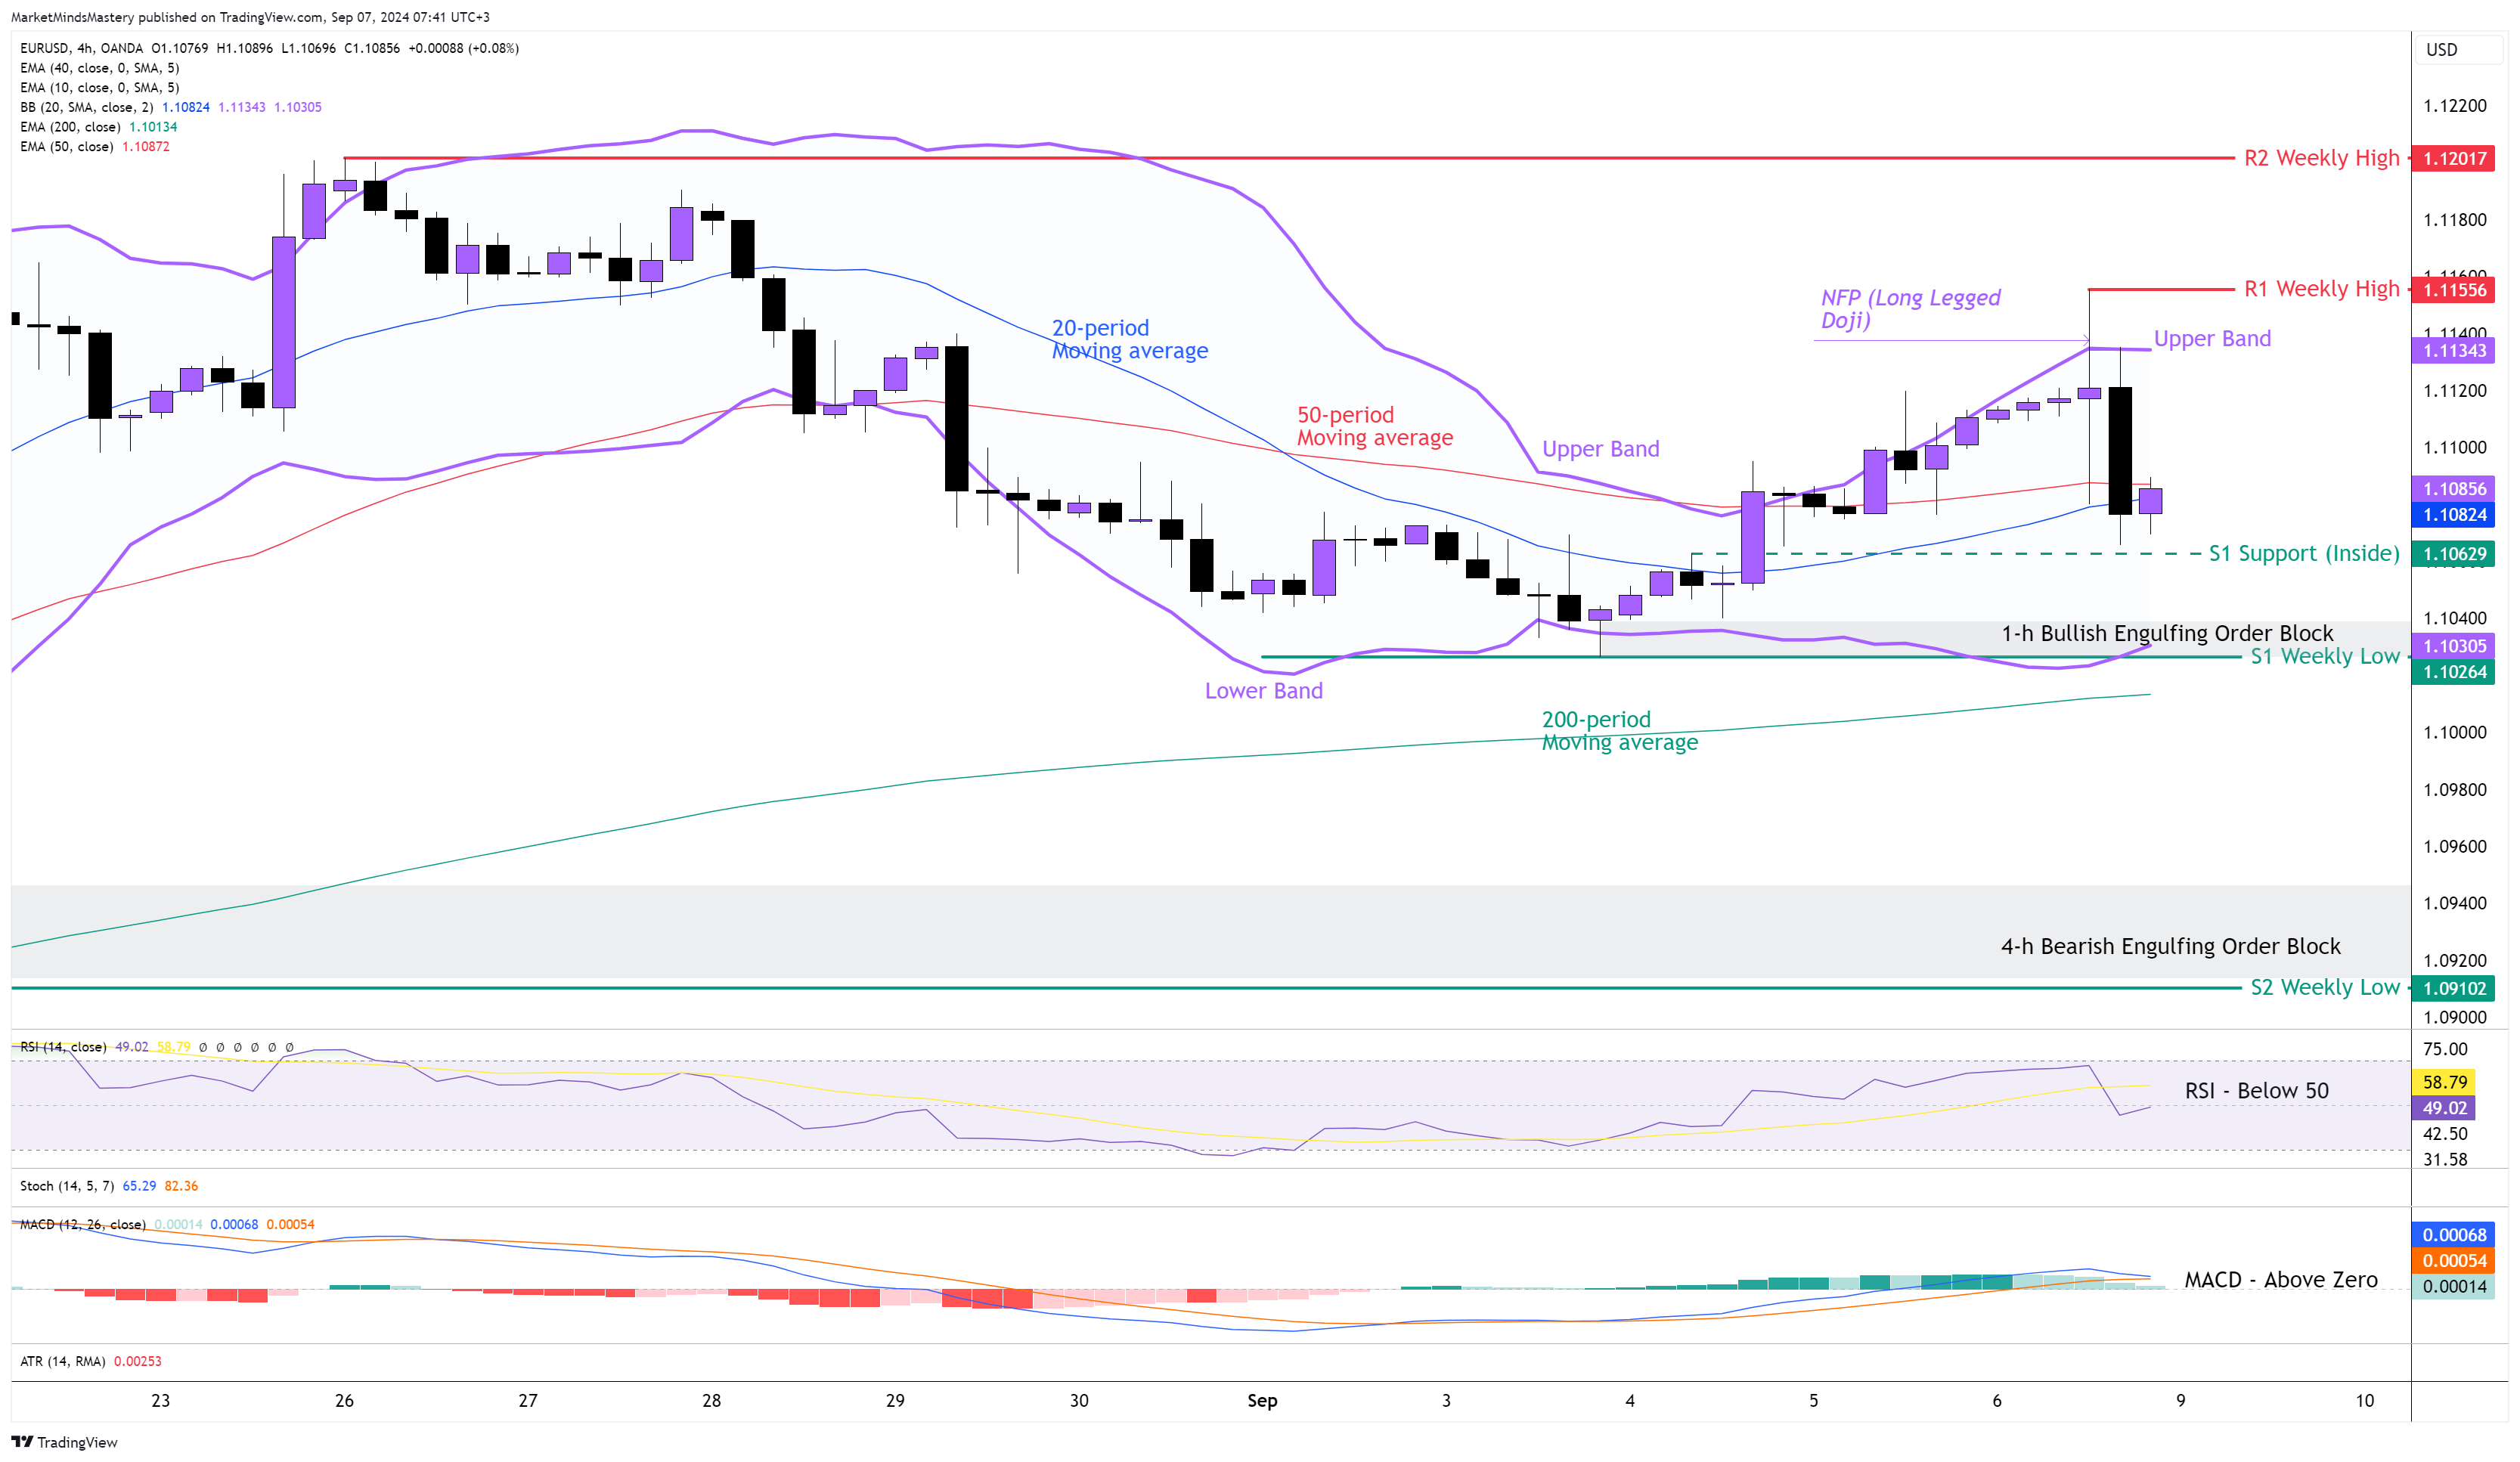
Following the previous week’s Market Outlook, the price of the EURUSD currency pair found support at the S1 weekly low, then it bounced off and moved upwards towards the Order Block and the FVP (Fair Value Price) area we pointed out on the charts. The price action on the weekly chart last week ended as an Inverse Hammer and, at the same time, a Double Inside candle (of the Bullish Marubozu). On the 4-hour chart, the price printed a Long-Legged Doji candle, rejecting the Upper Band of the Bollinger Band indicator after the NFP announcement. The 20-period is below the 50-period moving average, and this is bearish. The RSI Oscillator is below its middle line of 50, and it is a bearish indication. The MACD crossed above its zero line, which has bullish implications. Starting Monday, if the price remains below the 50-period moving average and moves downwards, the first support area will be an Inside support, S1, around 1.10629. If the price penetrates the S1 and declines further, then the next support, S2, will be approximately 1.10264, which is the previous week’s low. This level is considered significant because it coexists with the Lower Band of the Bollinger Band indicator and with the Bullish Engulfing Order Block found on the hourly chart. If the price penetrates the S2 and keeps lowering, the next support area, S3, will be an older weekly low around 1.09102.
Conversely, if the price moves upwards, the first resistance area, R1, will be the previous week’s high, around 1.11556. If the price penetrates the R1 and keeps moving upwards, the next resistance area, R2, will be approximately 1.12017, which is another weekly high price.
GBP USD 4H
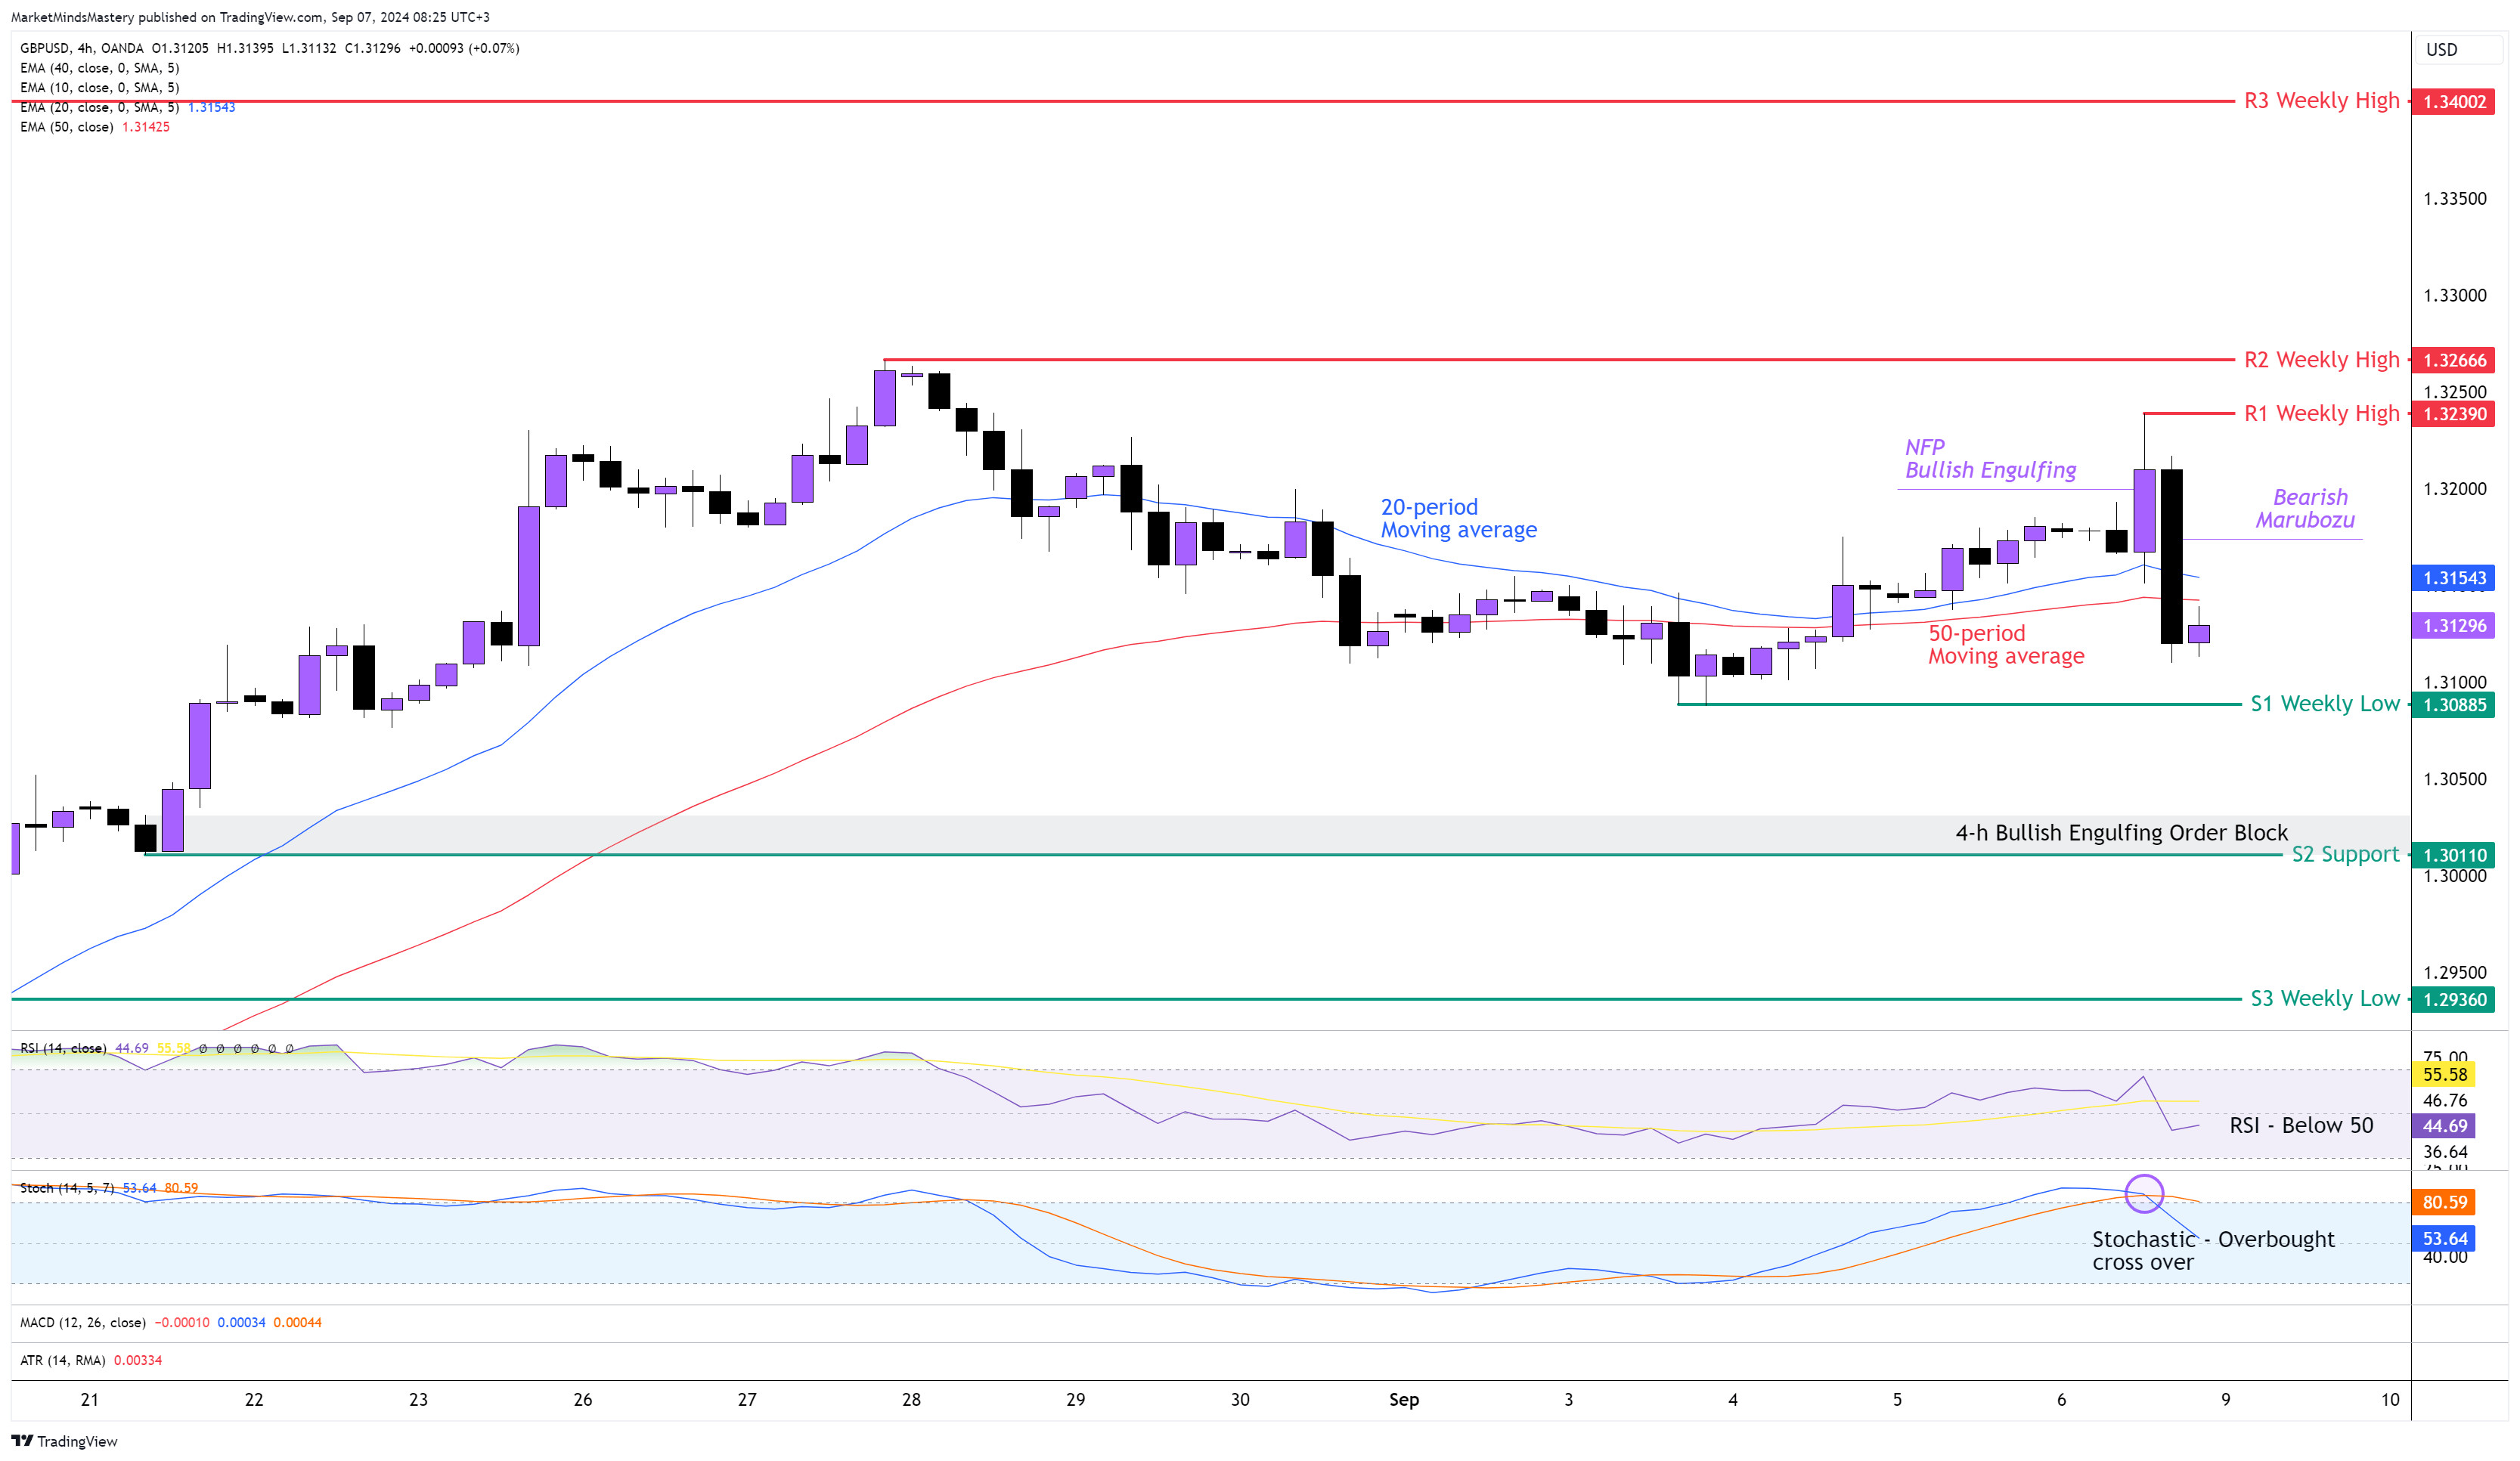
Following the previous week’s market move, the price of the GBPUSD on the weekly chart ended as a Doji candle, with a lower high and a lower low. The major trend, as per the weekly chart, is an uptrend based on the Swing Analysis and the market structure. On the 4-hour chart, last Friday, the price reached the Bearish Engulfing Order Block we pointed out on last week’s Market Outlook and was rejected after the NFP announcement. Usually, the week prior to the NFP announcement, the major pairs tend to move sideways or with a minimal range of price moves. This is the main cause of the small range of movement on the GBPUSD. On the 4-hour chart, the 20-period is above the 50-period moving average, and this has bullish implications. However, the Oscillators show a different picture as they react faster to the price movement. The RSI is below 50, and the Stochastic Oscillator created a Bearish Crossover while it was in an Overbought condition. Those two have bearish implications. Starting Monday, if the price follows the Bearish Marubozu direction and moves downwards, the first support area, S1, will be the previous week’s low at around 1.30885. In case the price penetrates the S1 and keeps lowering, the next support area, S2, will be the area around 1.30000, which is a round number and considered a significant price level for the GBPUSD pair. A few weeks ago, a Bullish Engulfing Order Block was created. Hence, the market participants might see this as a significant value area. A further decline will result in the next significant support area being around 1.29360.
On the other hand, if the price follows the primary trend direction and moves upwards, the first resistance area, R1, will be the previous week’s high, around 1.32390. If the price penetrates the R1 and keeps increasing, the next resistance areas, R2 and R3, will be the 1.32666 and 1.3400 price levels, respectively.
AUD USD 4H
The Australian Dollar, along with the other two major commodity currencies (NZD and CAD), was one of the weakest currencies last week. The price followed the reversal price action of the weekly chart and declined approximately 1300 points (130 pips). The overall swing analysis on the weekly chart indicated a market that is primarily in a trading range. On the 4-hour, the Bearish Marubozu candle followed the NFP report created a new market structure of lower lows and lower highs. This means that now the price developed a downtrend. The 20-period moving average crossed below the 50-period moving average, which is bearish. The RSI is below its middle line of 50 and almost in an Oversold condition. The MACD is below its zero line, with the MACD line (Blue) crossed below the Signal Line (Orange), and this has bearish implications. The price created a Bearish Engulfing Order Block around 0.67600 and another one close to 0.68000. Starting Monday, if the price keeps moving downwards, the first support area, S1, will be the previous week’s low, around 0.66600. In case the price penetrates the S1 and declines further, the next support area, S2, will have an older weekly low of around 0.65640. Oppositely, if the price moves upwards for a retracement, the first resistance area, R1, will be an inside resistance of around 0.67190. This price level is considered significant because it consists of the static horizontal line, the 20-period moving average, which can become a dynamic resistance and the 61.8% Fibonacci retracement known as the “Golden Ratio”. If the price surpasses the R1 and keeps moving upwards, the next resistance area, R2, will be around 0.67674, which is the previous week’s high. If the price penetrates the R2 and keeps increasing, it will change the market structure, and the downtrend will become invalid.
USD JPY 4H
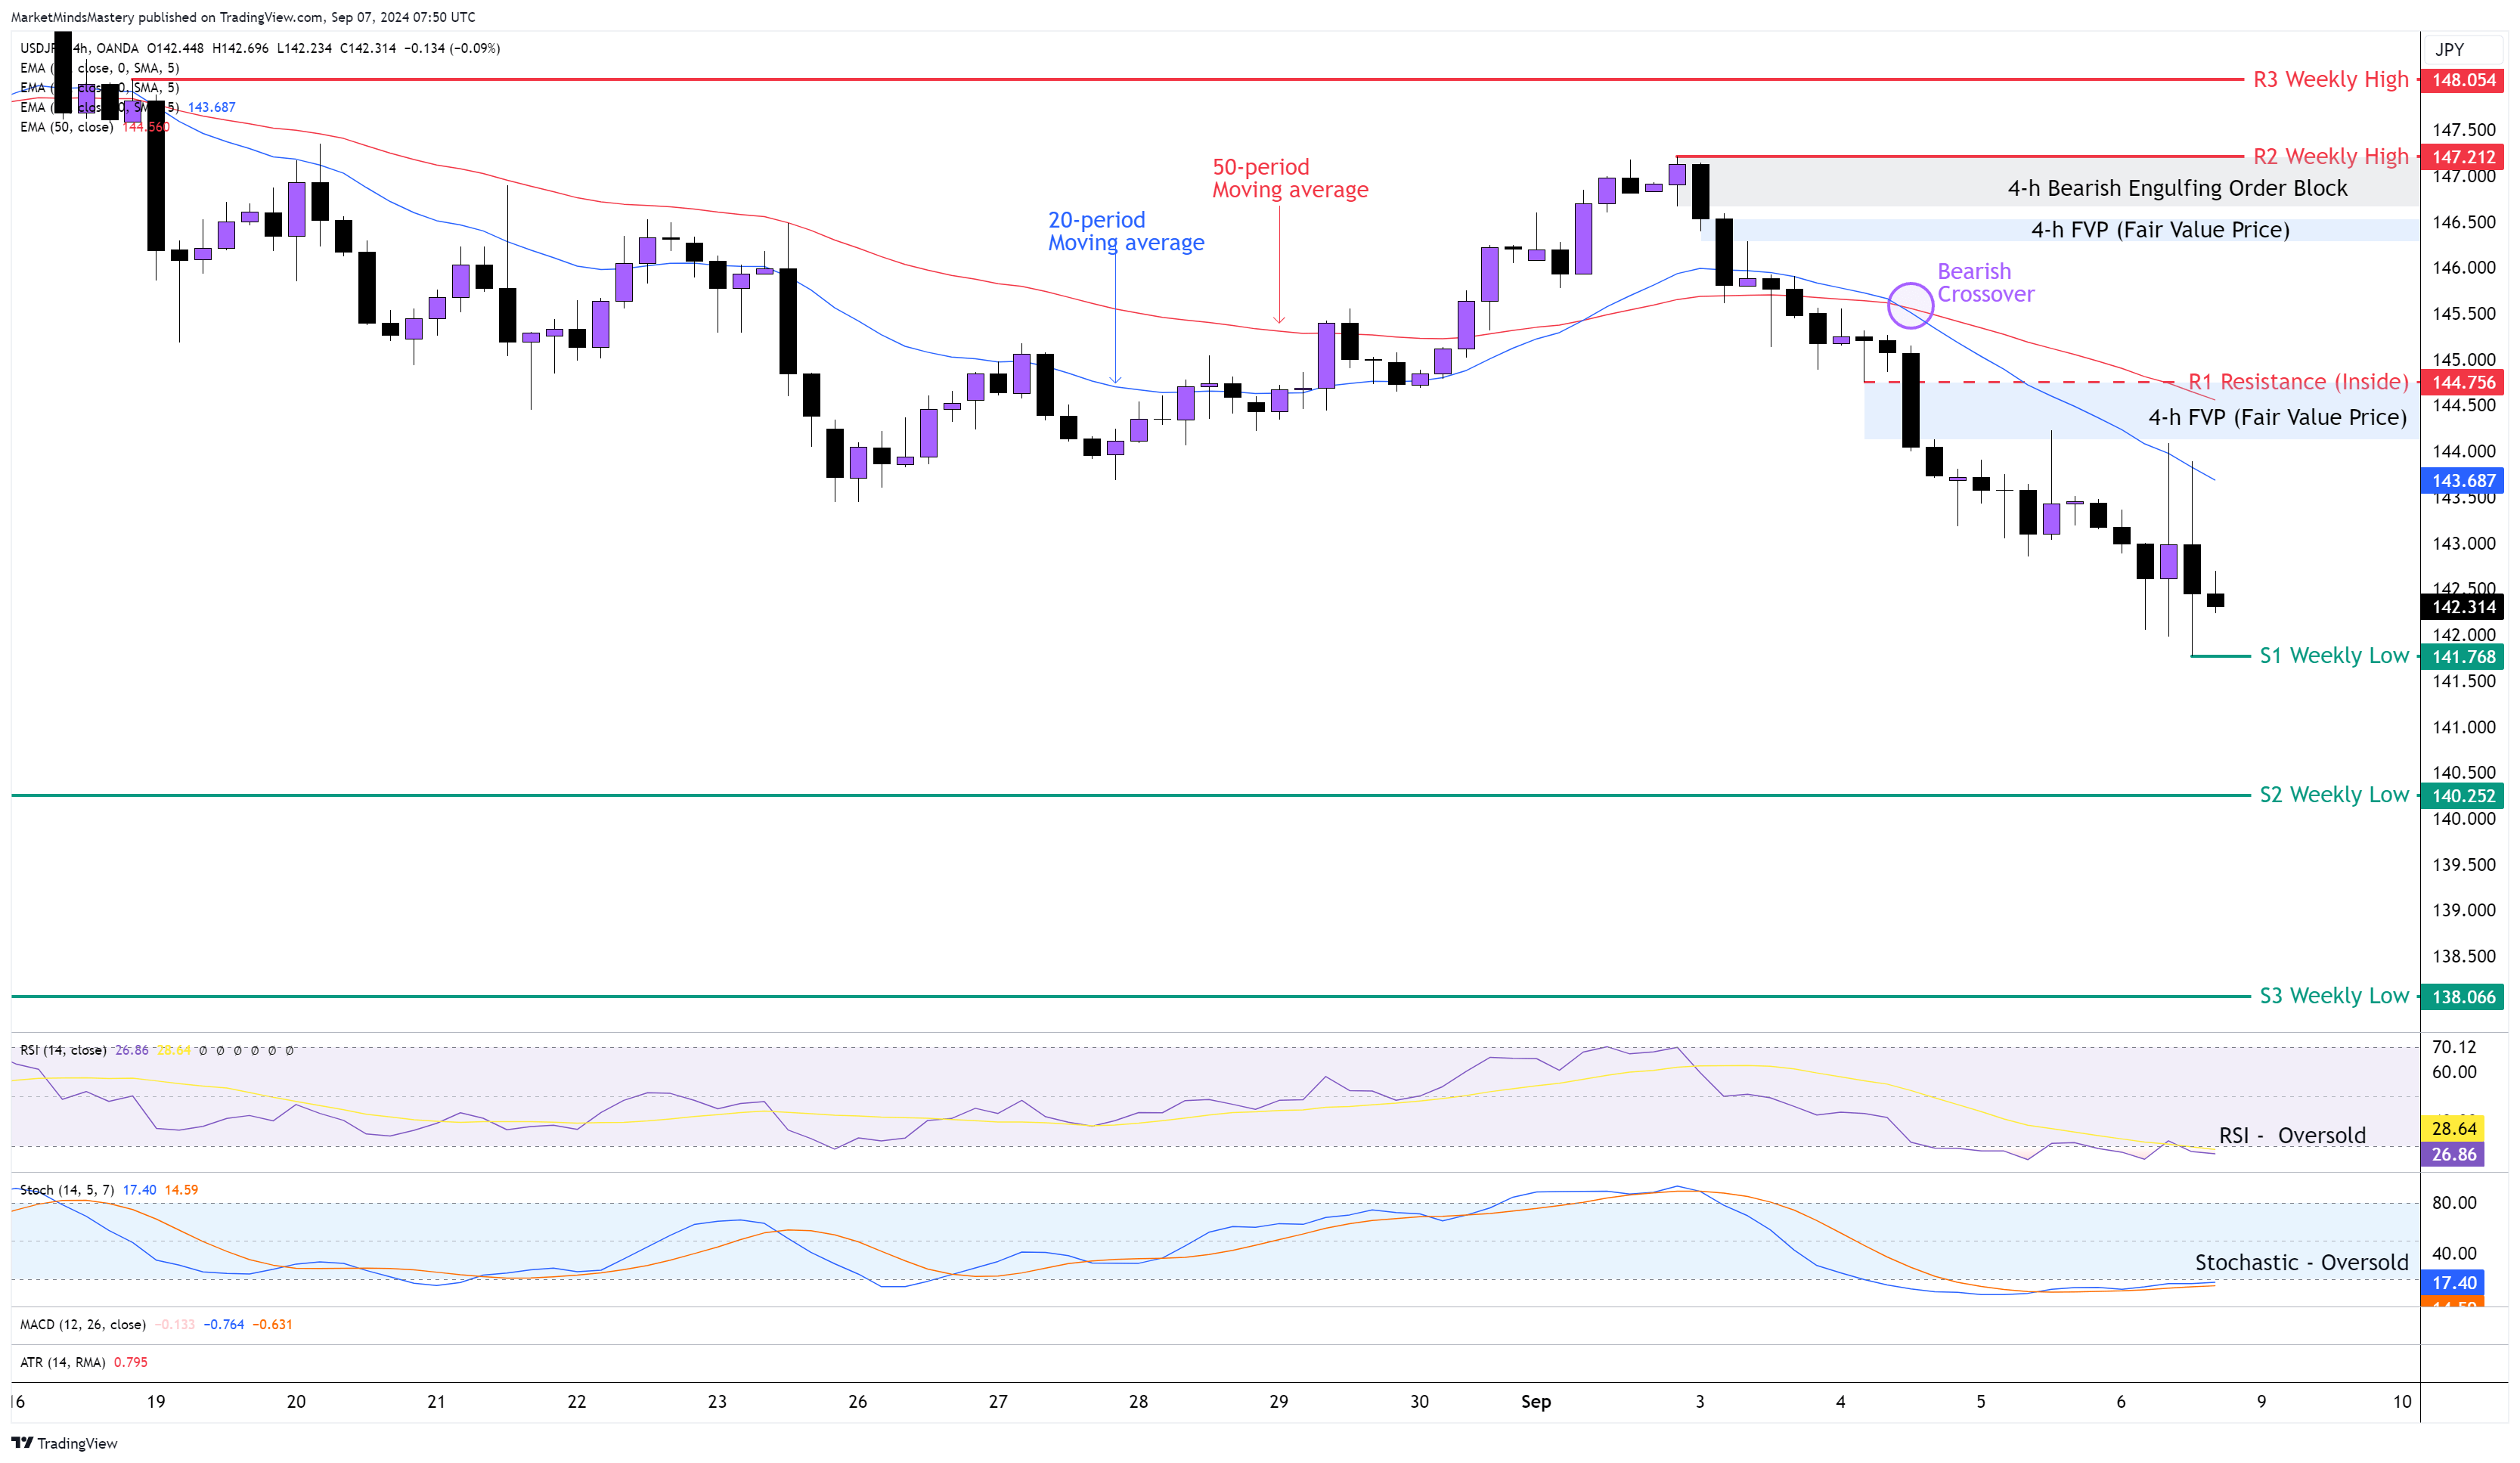
Following the primary downtrend from the weekly chart, the weekly candle ended as a Bearish Engulfing reversal. On the 4-hour chart, last Wednesday, the 20-period crossed below the 50-period moving average, creating a Bearish Crossover. Afterwards, the price resumed the 4-hour downtrend with a series of lower highs and lower lows. The retracements were very shallow as the downtrend was strong. This can be explained by the number of bearish (black) candles compared to the few bullish candles printed during the downward move.
Regarding the Momentum analysis using Oscillators, the RSI is at its Oversold condition, and the Stochastic is also in an Oversold condition but with a Bullish Crossover as the %K Line (Blue) crossed above the %D Line (Orange), while the Oscillator is below its 20 line. Assuming the price continues moving downwards as per the agreement between the primary (weekly) and the 4-hour chart, the first support area, S1, will be around 141.76. This is the low price for the previous week. In case the price goes through the S1 and keeps moving lower, the next support area, S2, will be an older weekly low price of around 140.25. A further downward move will find the next level of support, approximately at 138.06.
On the other hand, if the price bounces off from any support level, it can move upwards until the first key level of resistance R1, approximately at 144.75. This is considered a significant price level as it consists of the FVP (Fair Value Price) and the 50-period moving average, which can act as an additional resistance in this market. If the price penetrates the R1 and keeps moving upwards, the next resistance area, R2, will be around 147.21. Last Tuesday, an FVP (Fair Value Price) of around 146.50 and a 4-hour Bearish Engulfing Order Block of around 147 were both created, and they can act as additional resistance in this market.
USD CHF 4H
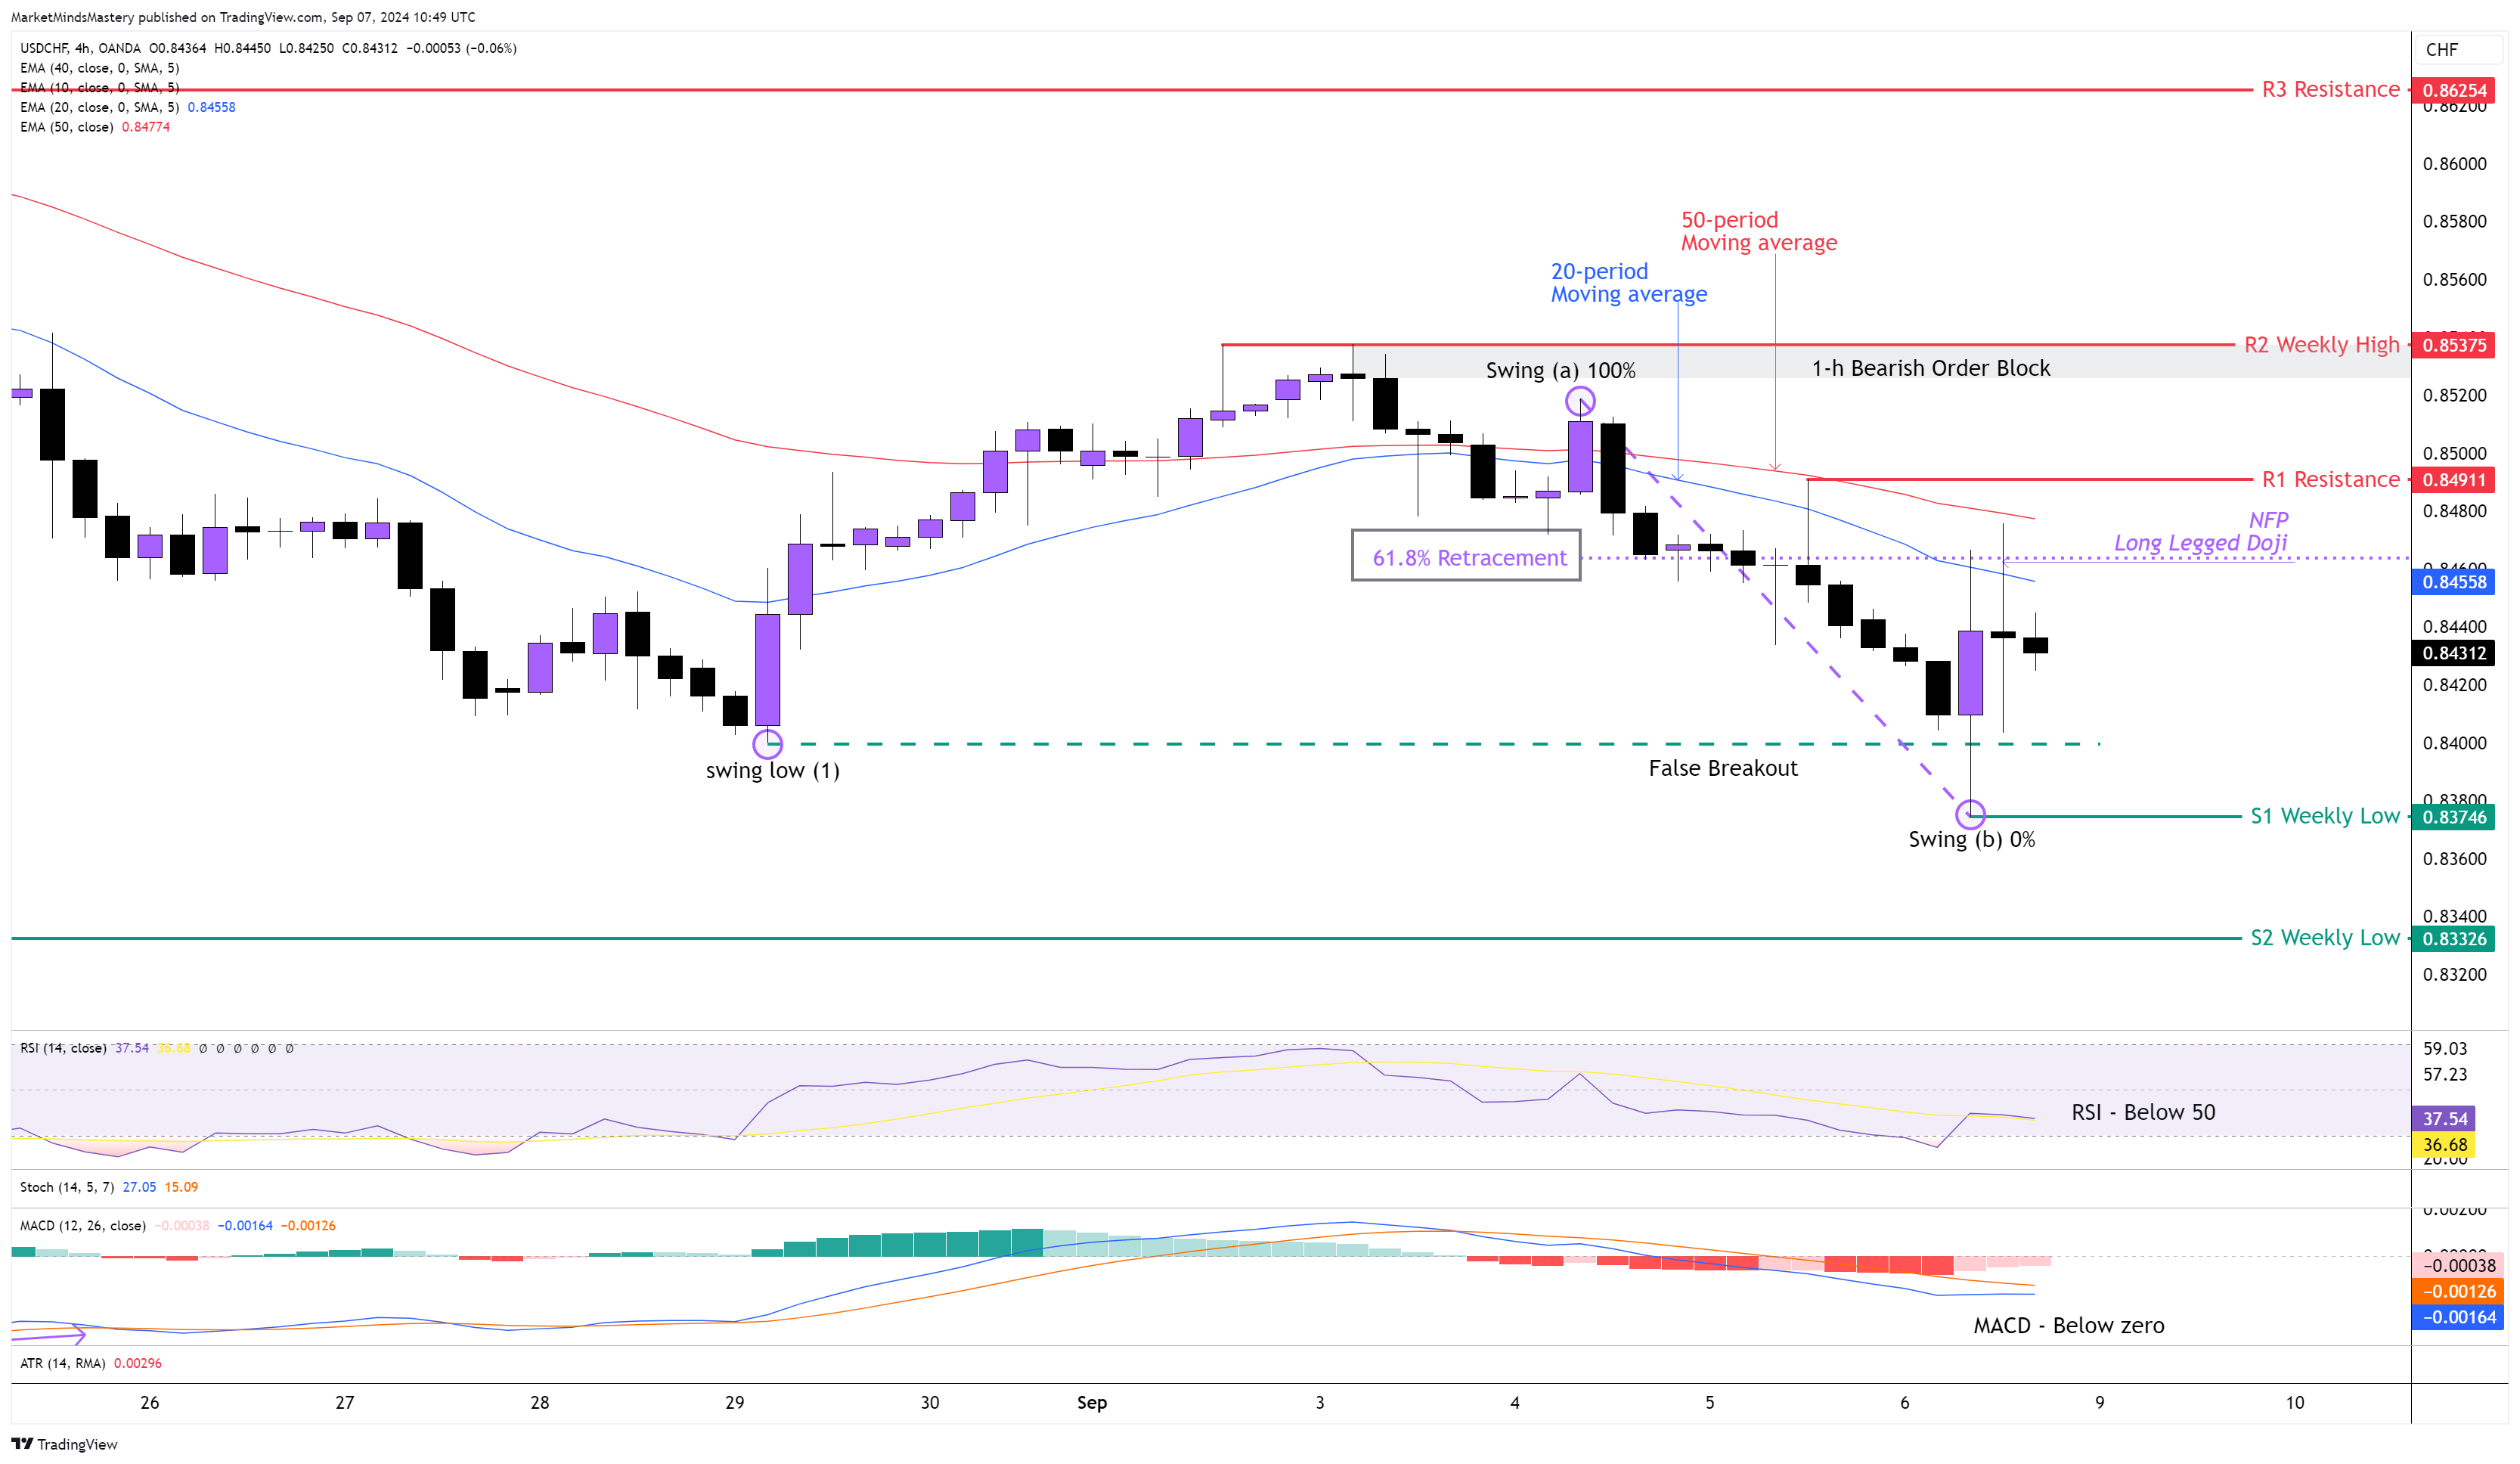
Despite the US Dollar’s overall strength last week, the Swissy (short for the CHF) kept gaining strength, and based on Currency Correlation analysis, it was much stronger than the USD. Hence, the price of the USDCHF since last Tuesday has been declining. On the weekly chart, the price ended as a Bearish Engulfing Reversal candlestick. Looking at the 4-hour chart, the price declined as expected, and at the swing low point (1), as shown on the chart, the price failed to close below it last Friday. Last Tuesday, the price created a Bearish Order Block around 0.8530. As per the moving average analysis, the 20-period is below the 50-period, and this is bearish. The NFP caused the price to create a Long-Legged Doji candle that rejected the 20–period moving average and the 61.8% Fibonacci retracement from point (a) to point (b), and this has bearish implications. The RSI Oscillator is below its middle line of 50, and this is bearish. The MACD is below its zero line, indicating bearishness.
Additionally, the MACD’s Histogram is under the middle line, which has bearish implications. If the price keeps moving downwards, the first support area, S1, will be the previous week’s low, around 0.83746. If the price penetrates the S1 and keeps moving downwards, the next support area, S2, will be approximately 0.83326. On the other hand, if the price bounces off and starts moving upwards, the first resistance area, R1, will be around 0.84911. If the price penetrates the R1 and keeps moving upwards, the next resistance area, R2, will be the previous week’s high at around 0.85375.
GBP JPY 4H
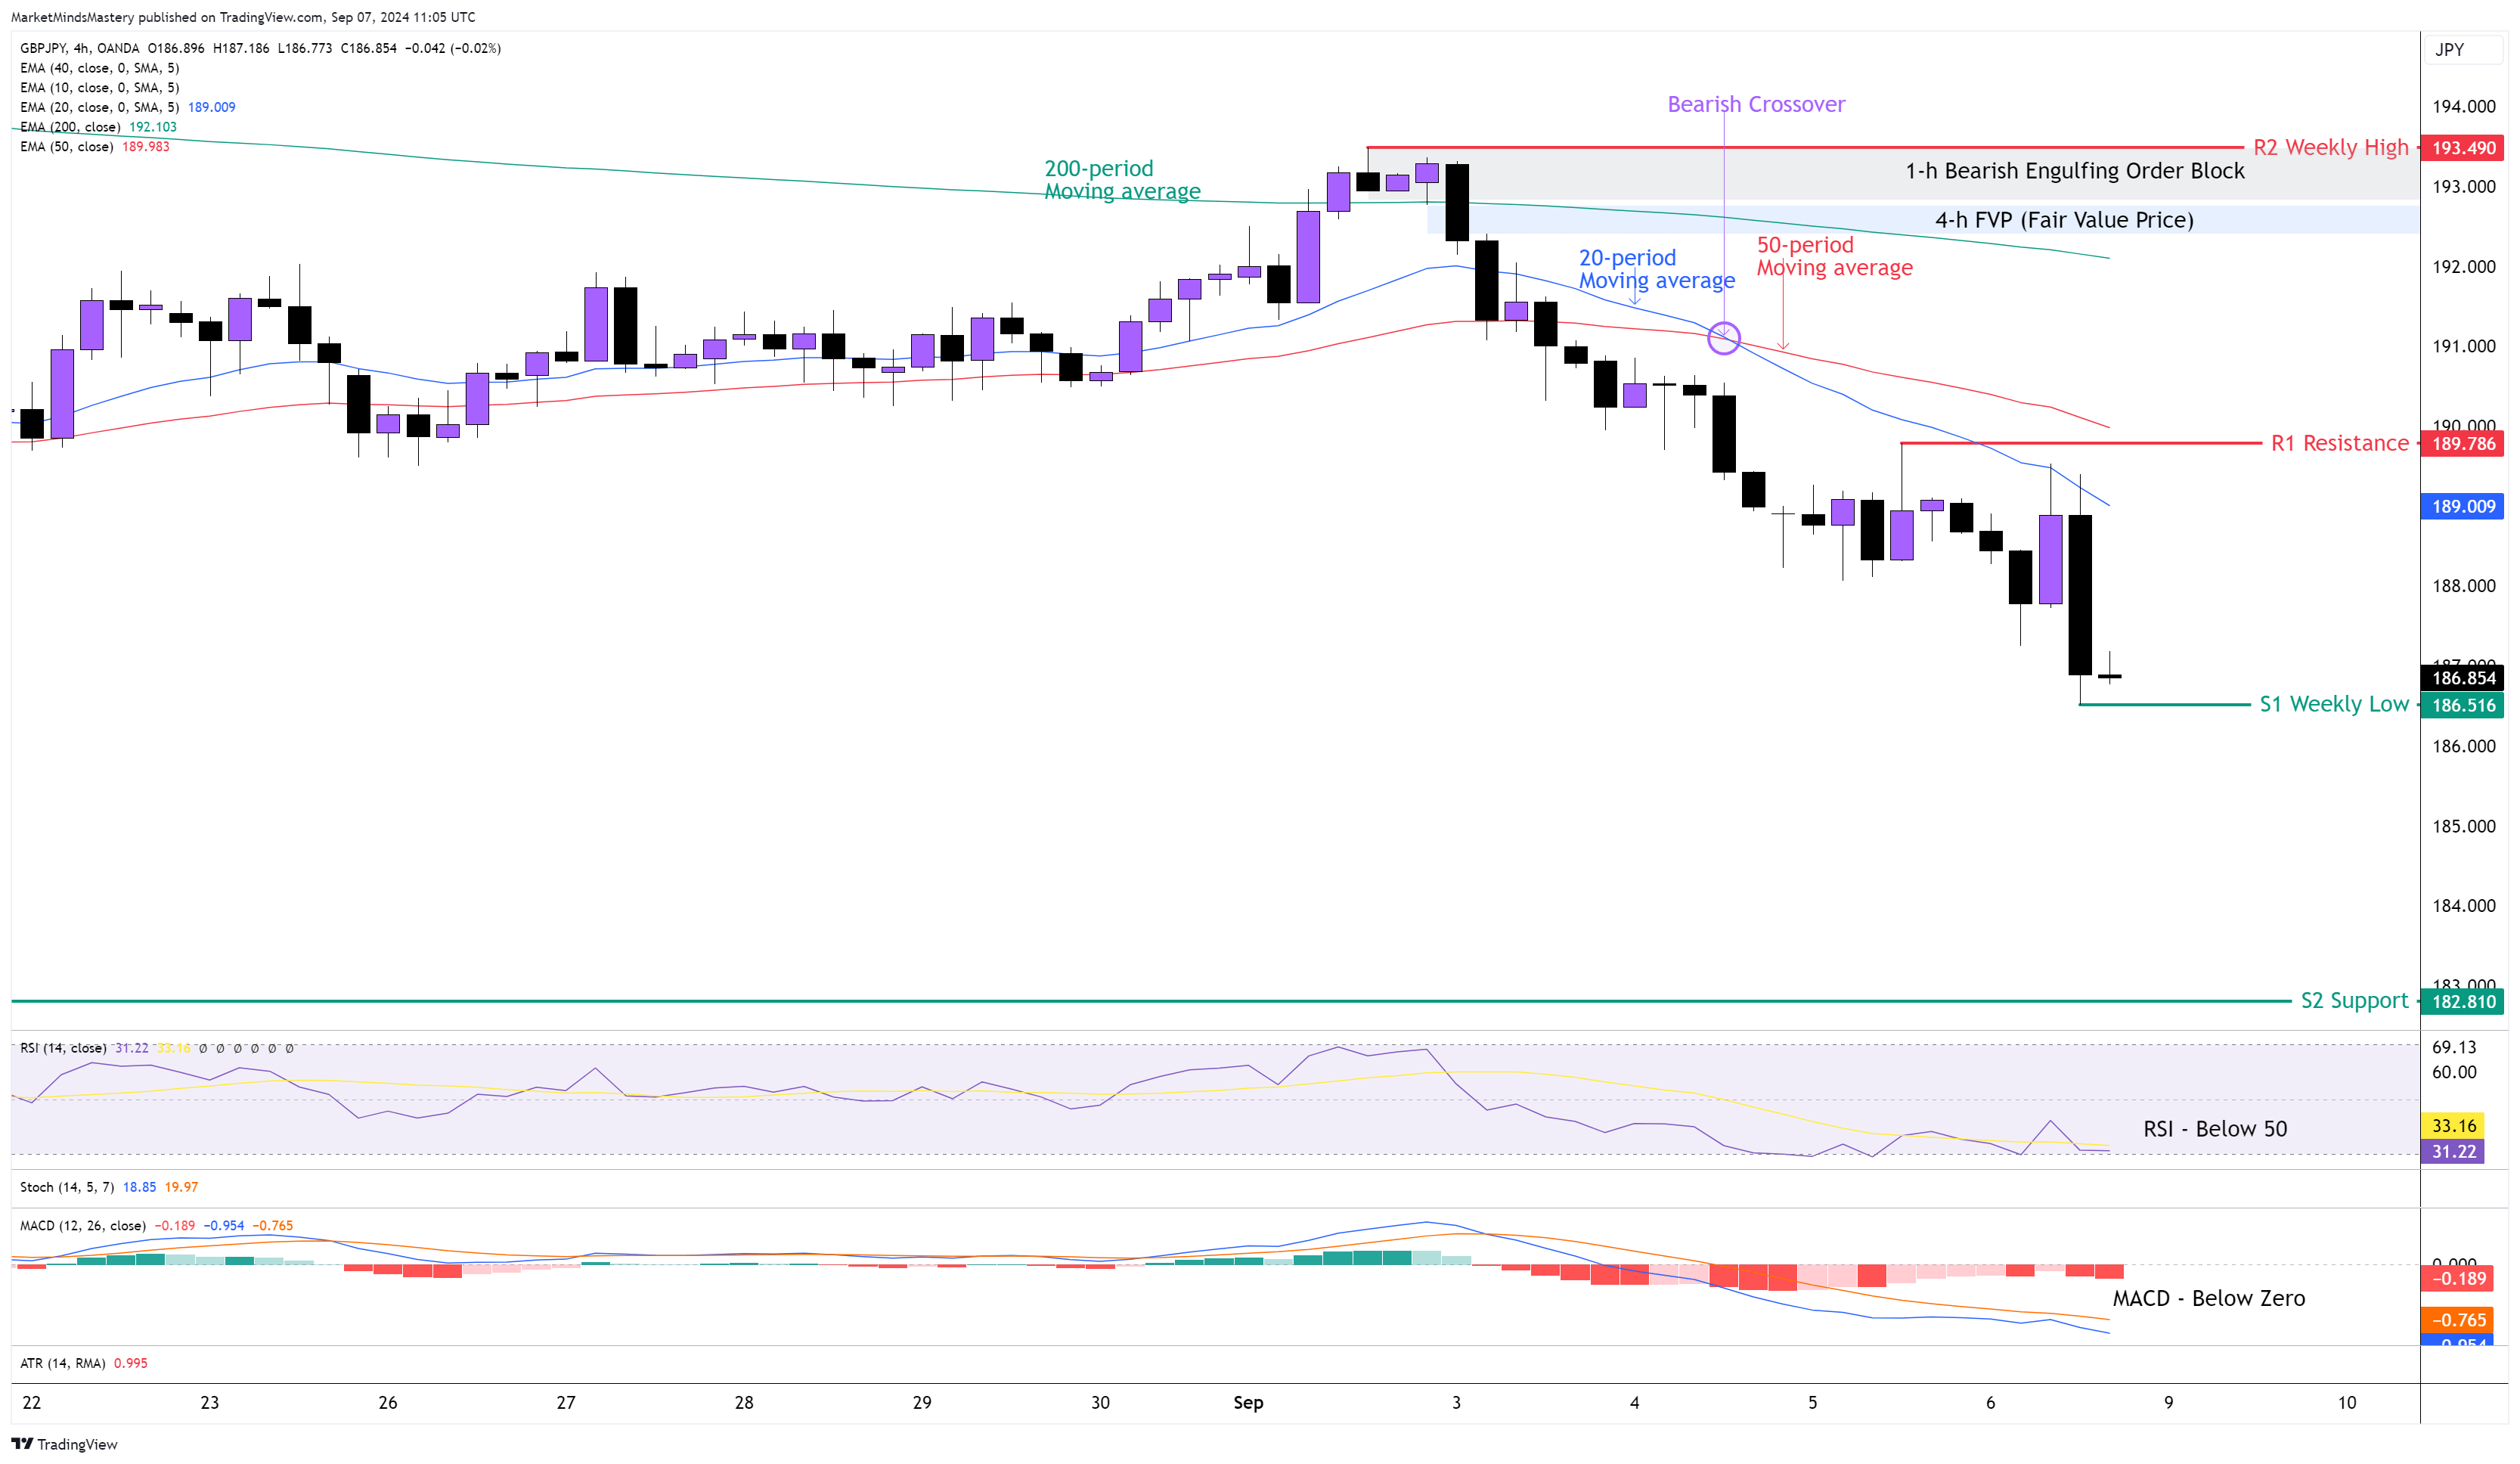
The inside candle on the weekly chart was explained in the previous week’s market Outlook, causing the price to stop moving upwards and decline as expected due to the weekly market structure, which indicates a downward momentum. Last week, the weekly candle of the GBPJPY currency pair ended as a Bearish Engulfing Reversal, rejecting the 10 and the 40 periods moving average (not shown on the chart). Last Wednesday, the 20-period crossed below the 50-period moving average, confirming that the market was in a downtrend. The beginning of a downtrend started last Tuesday, and the price created a Bearish Engulfing Order Block around the 193 level and an FVP (Fair Value Price) of around 192.50. The RSI Oscillator is below its middle line of 50, and this has bearish implications. The MACD is below its zero line, and the MACD Line (Blue) is below the Signal Line (Orange), indicating bearishness. As the price makes lower highs and lower lows, the downtrend is in tacks.
In case the price continues to move downward, the first support area, S1 will be the previous week's low, around 186.51. If the price penetrates the S1 and keeps moving lower, the next support area, S2, will be around 182.81. Oppositely, if the price bounces off and starts moving upwards, the first resistance area, R1, will be around 189.78. If it continues its upward move, it will find the next resistance area, R2, approximately at 193.49, which is the previous week’s high.
GOLD 4H
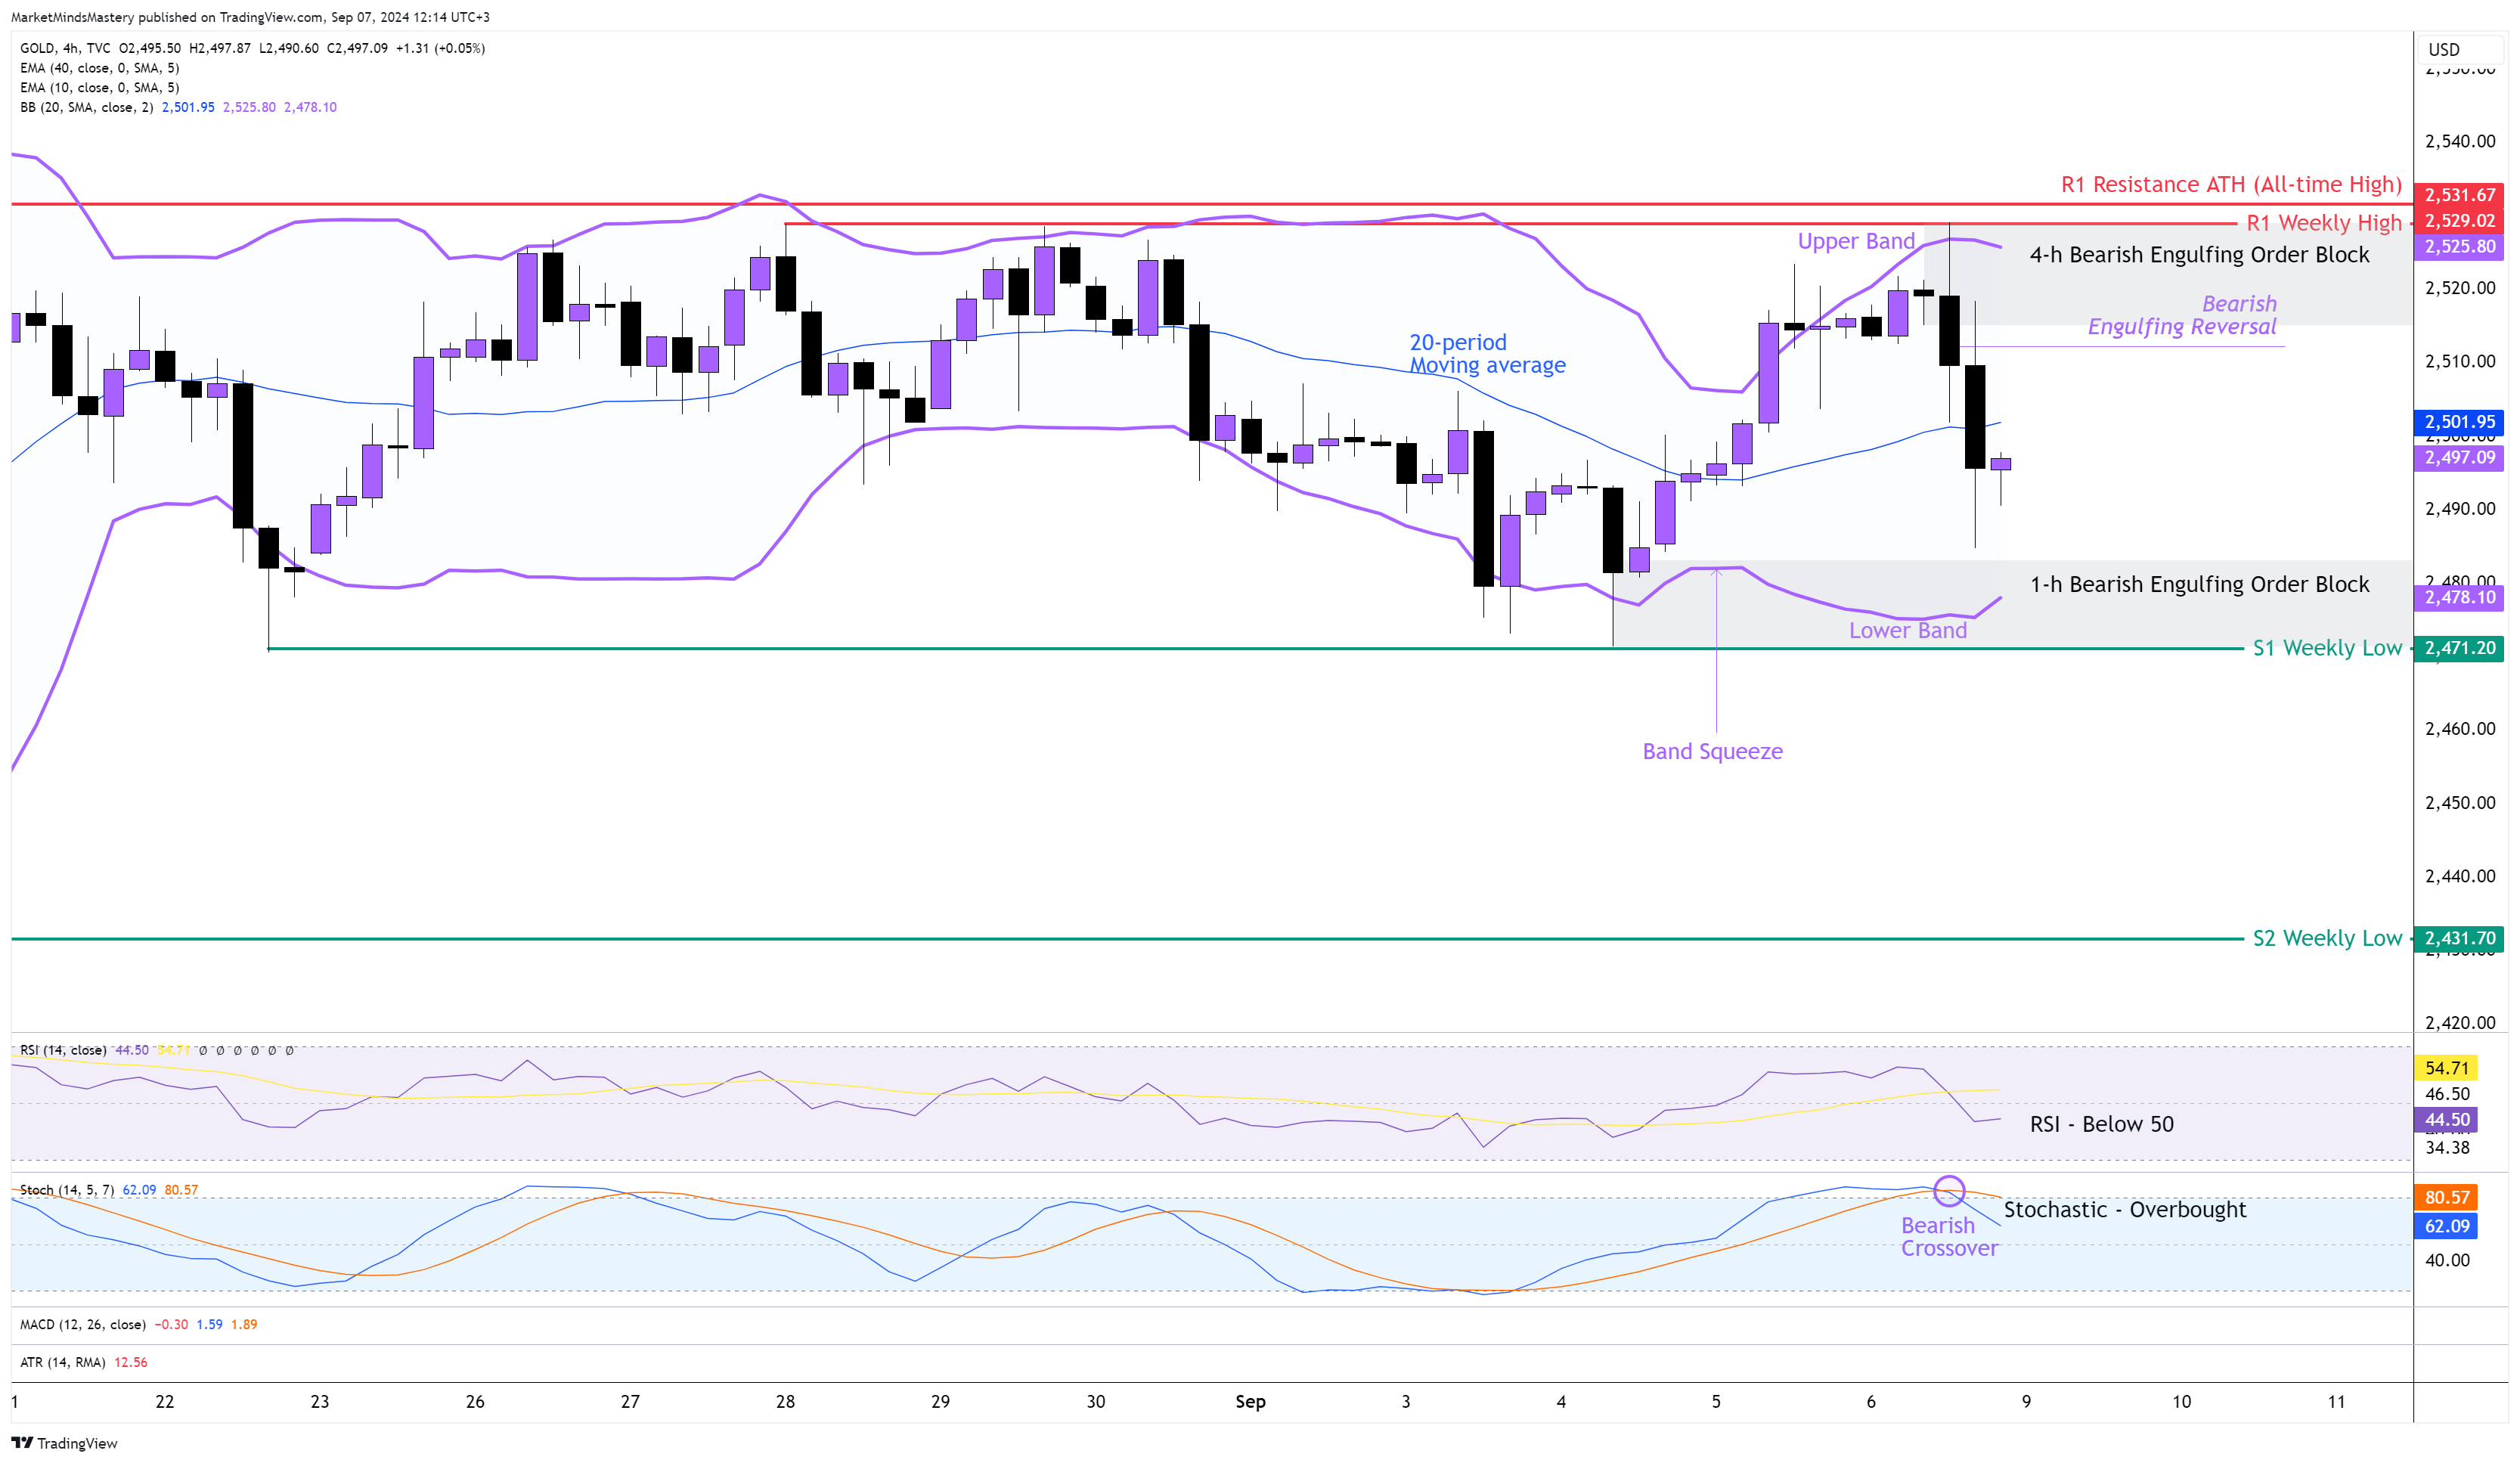
Following the previous week’s Market Outlook, the GOLD price entered into the 4-h Bullish Order Block we pointed out on the chart, tested the S2 support and moved upwards until the $2529, where the Equal Tops price level. Last Friday, the NFP caused the price to print a Bearish Engulfing and set the Gold prices below $2500. The weekly price action ended with a Doji candle. This means that in the lower time frames, the market moves sideways. On the 4-hour chart, the price remains within the trading range that started a few weeks ago, with the top of the range being at $2529 and the bottom around $2470.
The RSI Oscillator is below its middle line of 50, which is a bearish indication. Additionally, the Stochastic Oscillator is in an Overbought condition, and last Friday, it created a Bearish Crossover that indicates an early warning of a possible price decline.
As the prices are trading within a range, we will use the Bollinger Band indicator primarily due to its Upper and Lower bands to determine when a strong direction breakout occurs under an increase in volatility. Currently, the price is below the 20-period moving average, which is in the middle of the Bollinger Band, and this has bearish implications. Starting Monday, if the price keeps being below the 20-period and moves downwards, the first support area will be the previous week’s low, around $2471. This is considered a key level of support because it coexists with the Lower Band of the indicator and the 1-hour Bullish Engulfing Order Block. In case the price penetrates the S1 support and keeps moving downwards, a downtrend will be possible to start, and the next support area, S2, will be around $2431, which is an older weekly low price.
Conversely, if the price bounces off and starts moving upwards, the first resistance area, R1, will be the previous week’s high of approximately $2529. Last week, around this price level, a Bearish Engulfing Order Block was created, and it can be an additional resistance factor in the Gold market. As the ATH (All-Time High) is around $2531, if the price penetrates this area, we expect to see a new ATH in the market.
USOIL 4H
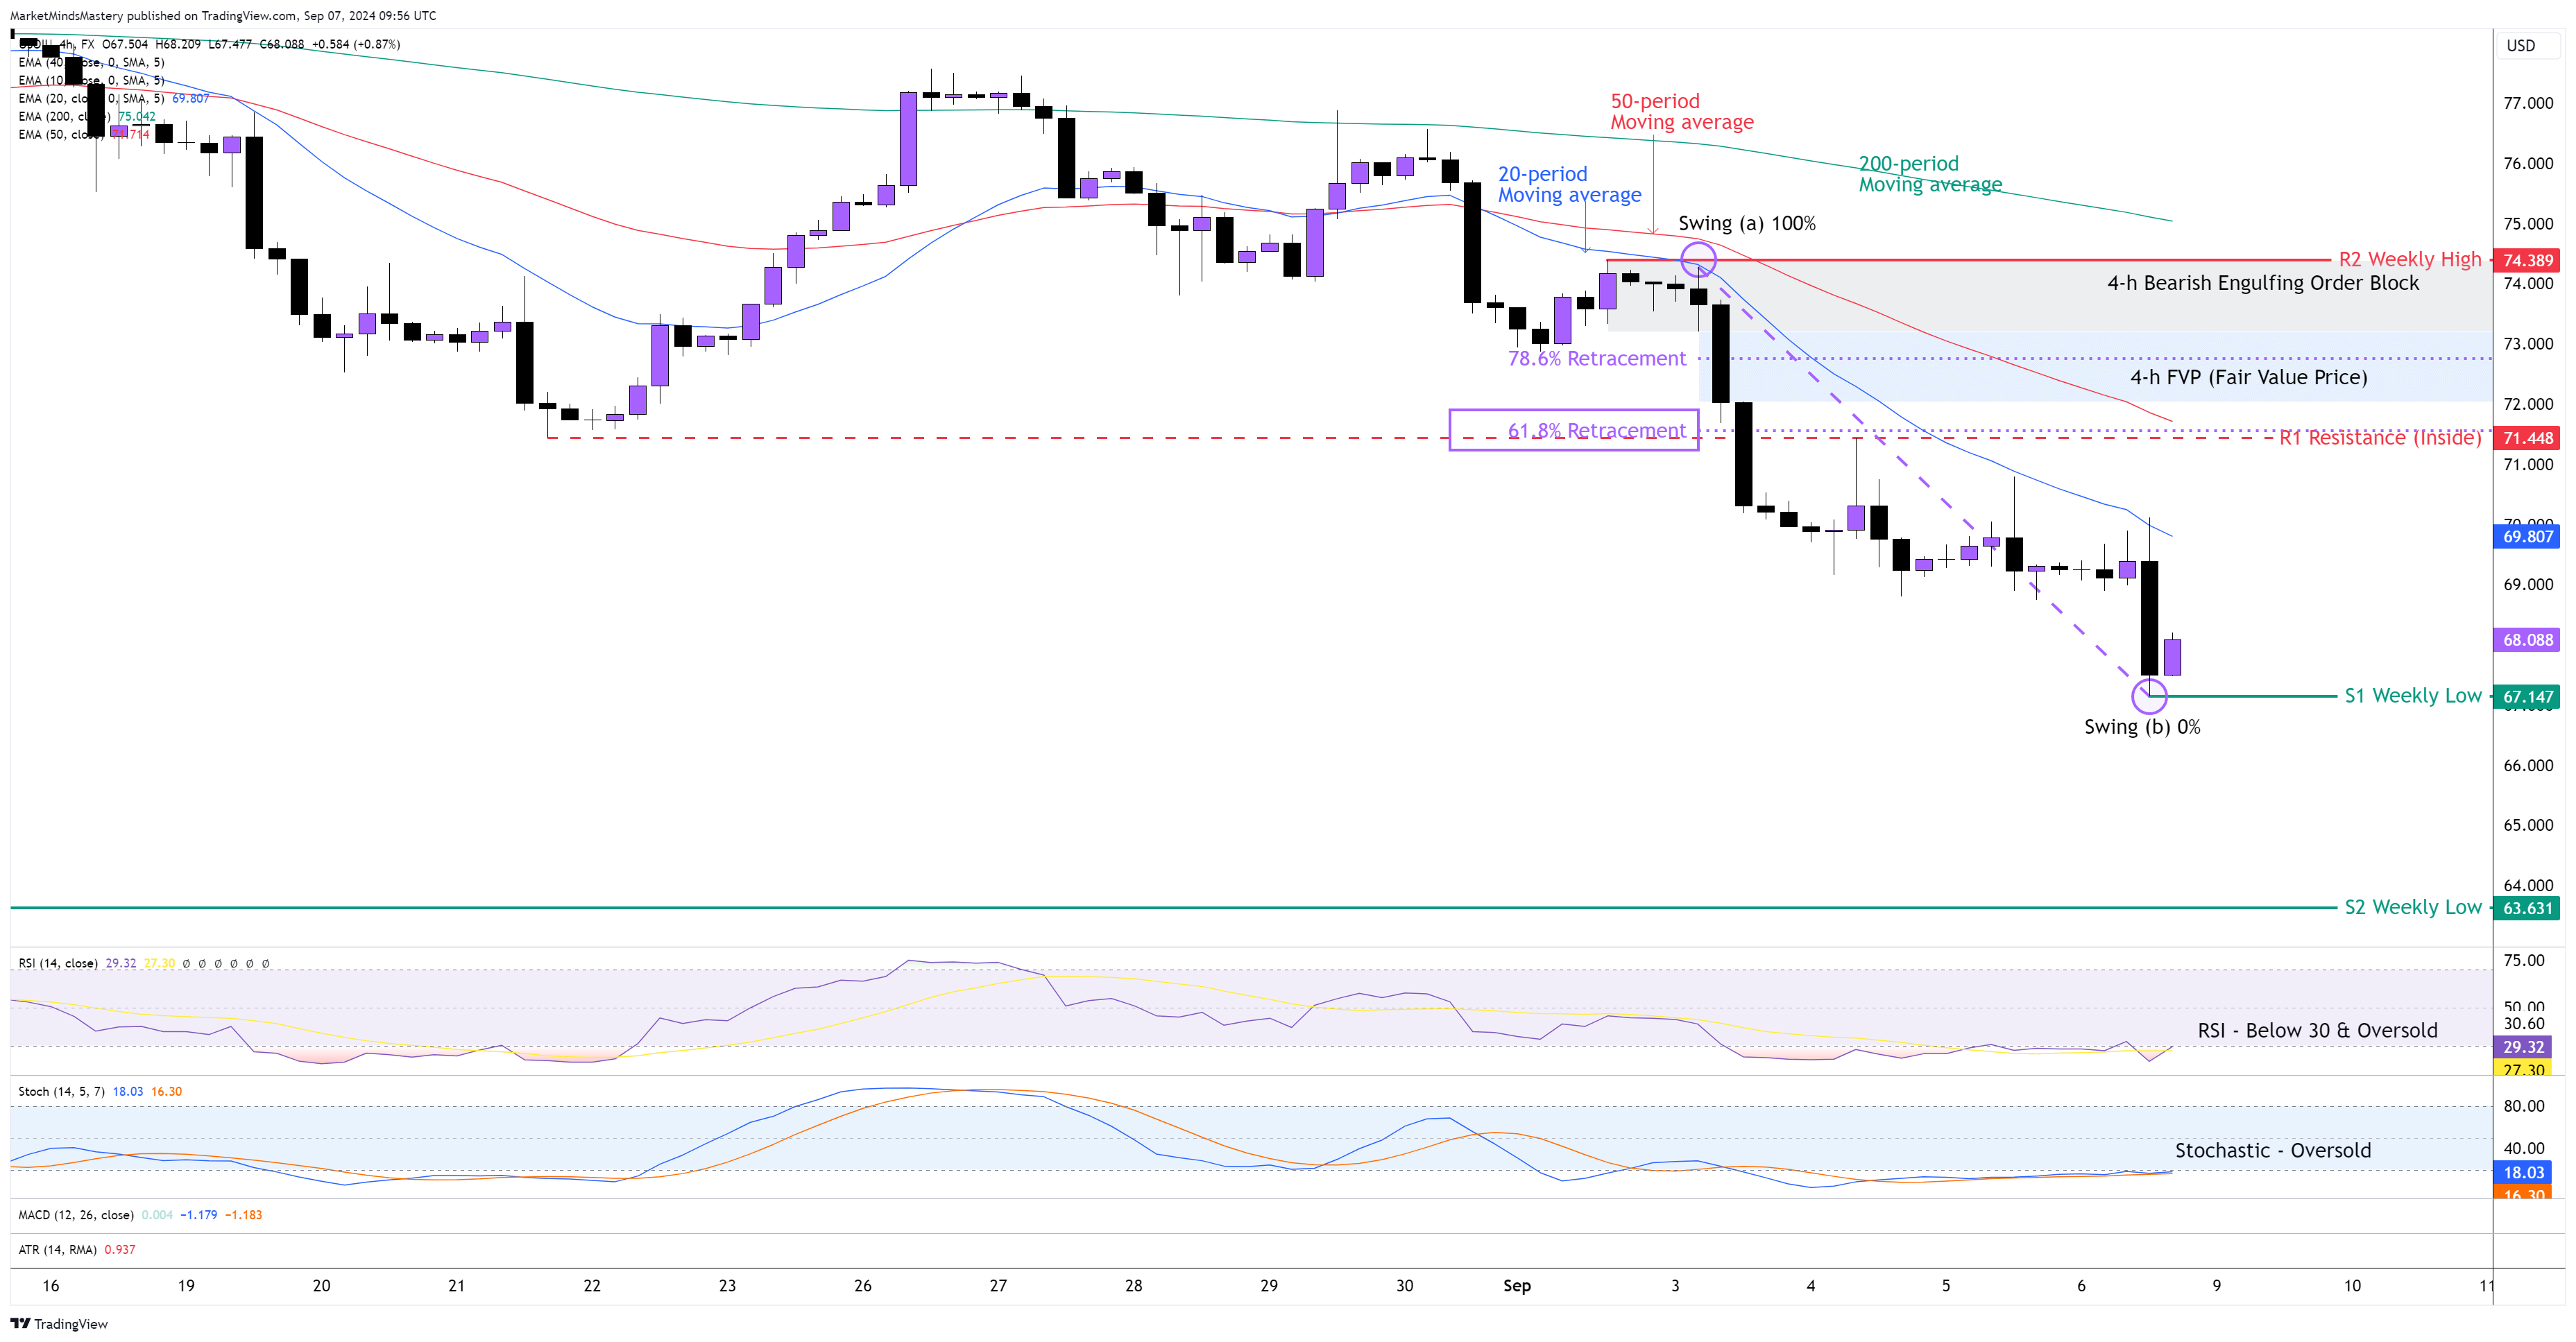
Following the previous week’s market move, the price of the USOIL continued its downward move as expected due to the major downtrend as per the weekly chart, as well as the Bearish reversal price action on the same chart. Last week, the weekly candle ended as a Long, Bearish candle. On the 4-hour chart, the price created a lower high and lower low formation following the major downtrend. The 20-period is below the 50-period moving average, and at the same time, the 50-period is below the 200-period moving average, and this has bearish implications. Since last Tuesday, both Oscillators, the RSI and the Stochastic, entered into their Oversold condition due to the rapid and fast downward move that occurred in the USOIL market during the New York trading session. On the same day, the price created an FVP (Fair Value Price) of around $72 and a 4-hour Bearish Engulfing Order Block of around $74. If the price continues moving downwards, the first support area, S1, will be the previous week’s low, around $67.14. If the price penetrates the S1 and declines further more, the next support level, S2, will be around $63.63, which is an older weekly low price level. Oppositely, if the price bounces off from the S1 level, we can use the Fibonacci retracement tool from the swing at point (a) to the swing at point (b) in order to estimate the levels of retracement. As shown in the chart, the Golden Ratio of 61.8% consists of the R1 Inside resistance around $71.44 and the 50-period moving average. If the price penetrates the R1 and keeps increasing, the next resistance area, R2, will be the previous week’s high, around $74.38.
BTC USD 4H
The descending triangle, which is included in the category of the continuation chart patterns, played out as expected based on the previous week’s Market Outlook analysis. The price on the weekly chart ended as a Bearish candle. At the same time, on the 4-hour chart, the market moved downwards in a series of lower highs and lower lows. The 20-period moving average is below the 50 period, and it's a bearish indication. The price is in a continuous and strong downward move because as soon as it touches the 20-period on every retracement phase, it declines rapidly. The RSI is below its middle line of 50, and it is considered Bearish. The Stochastic Oscillator is in an oversold condition, and the %K Line (Blue) crossed above the %D Line (Orange), which has bullish implications. Currently, the price is in a corrective phase. If the price continues to move downwards, the first support area, S1, will be the previous week’s low, around $52600. If the price penetrates the S1 support and keeps moving downwards, the next support area, S2, will be around $49111, which is an older weekly low price level.
On the other hand, if the price bounces off from any support level, the first resistance area, R1, will be around $57000. Last Friday, a Bearish Engulfing created an Order Block around this level, which the price can use as an additional resistance. In case the price increases the R1 resistance and keeps increasing, it will enter into the FVP (fair Value Price) around $58000. The next resistance area, R2, is above the FVP at $58500. If the price penetrates the R2 resistance and keeps increasing, the next resistance area, R3, will be the previous week’s high of approximately $59773.
SP 500 4H
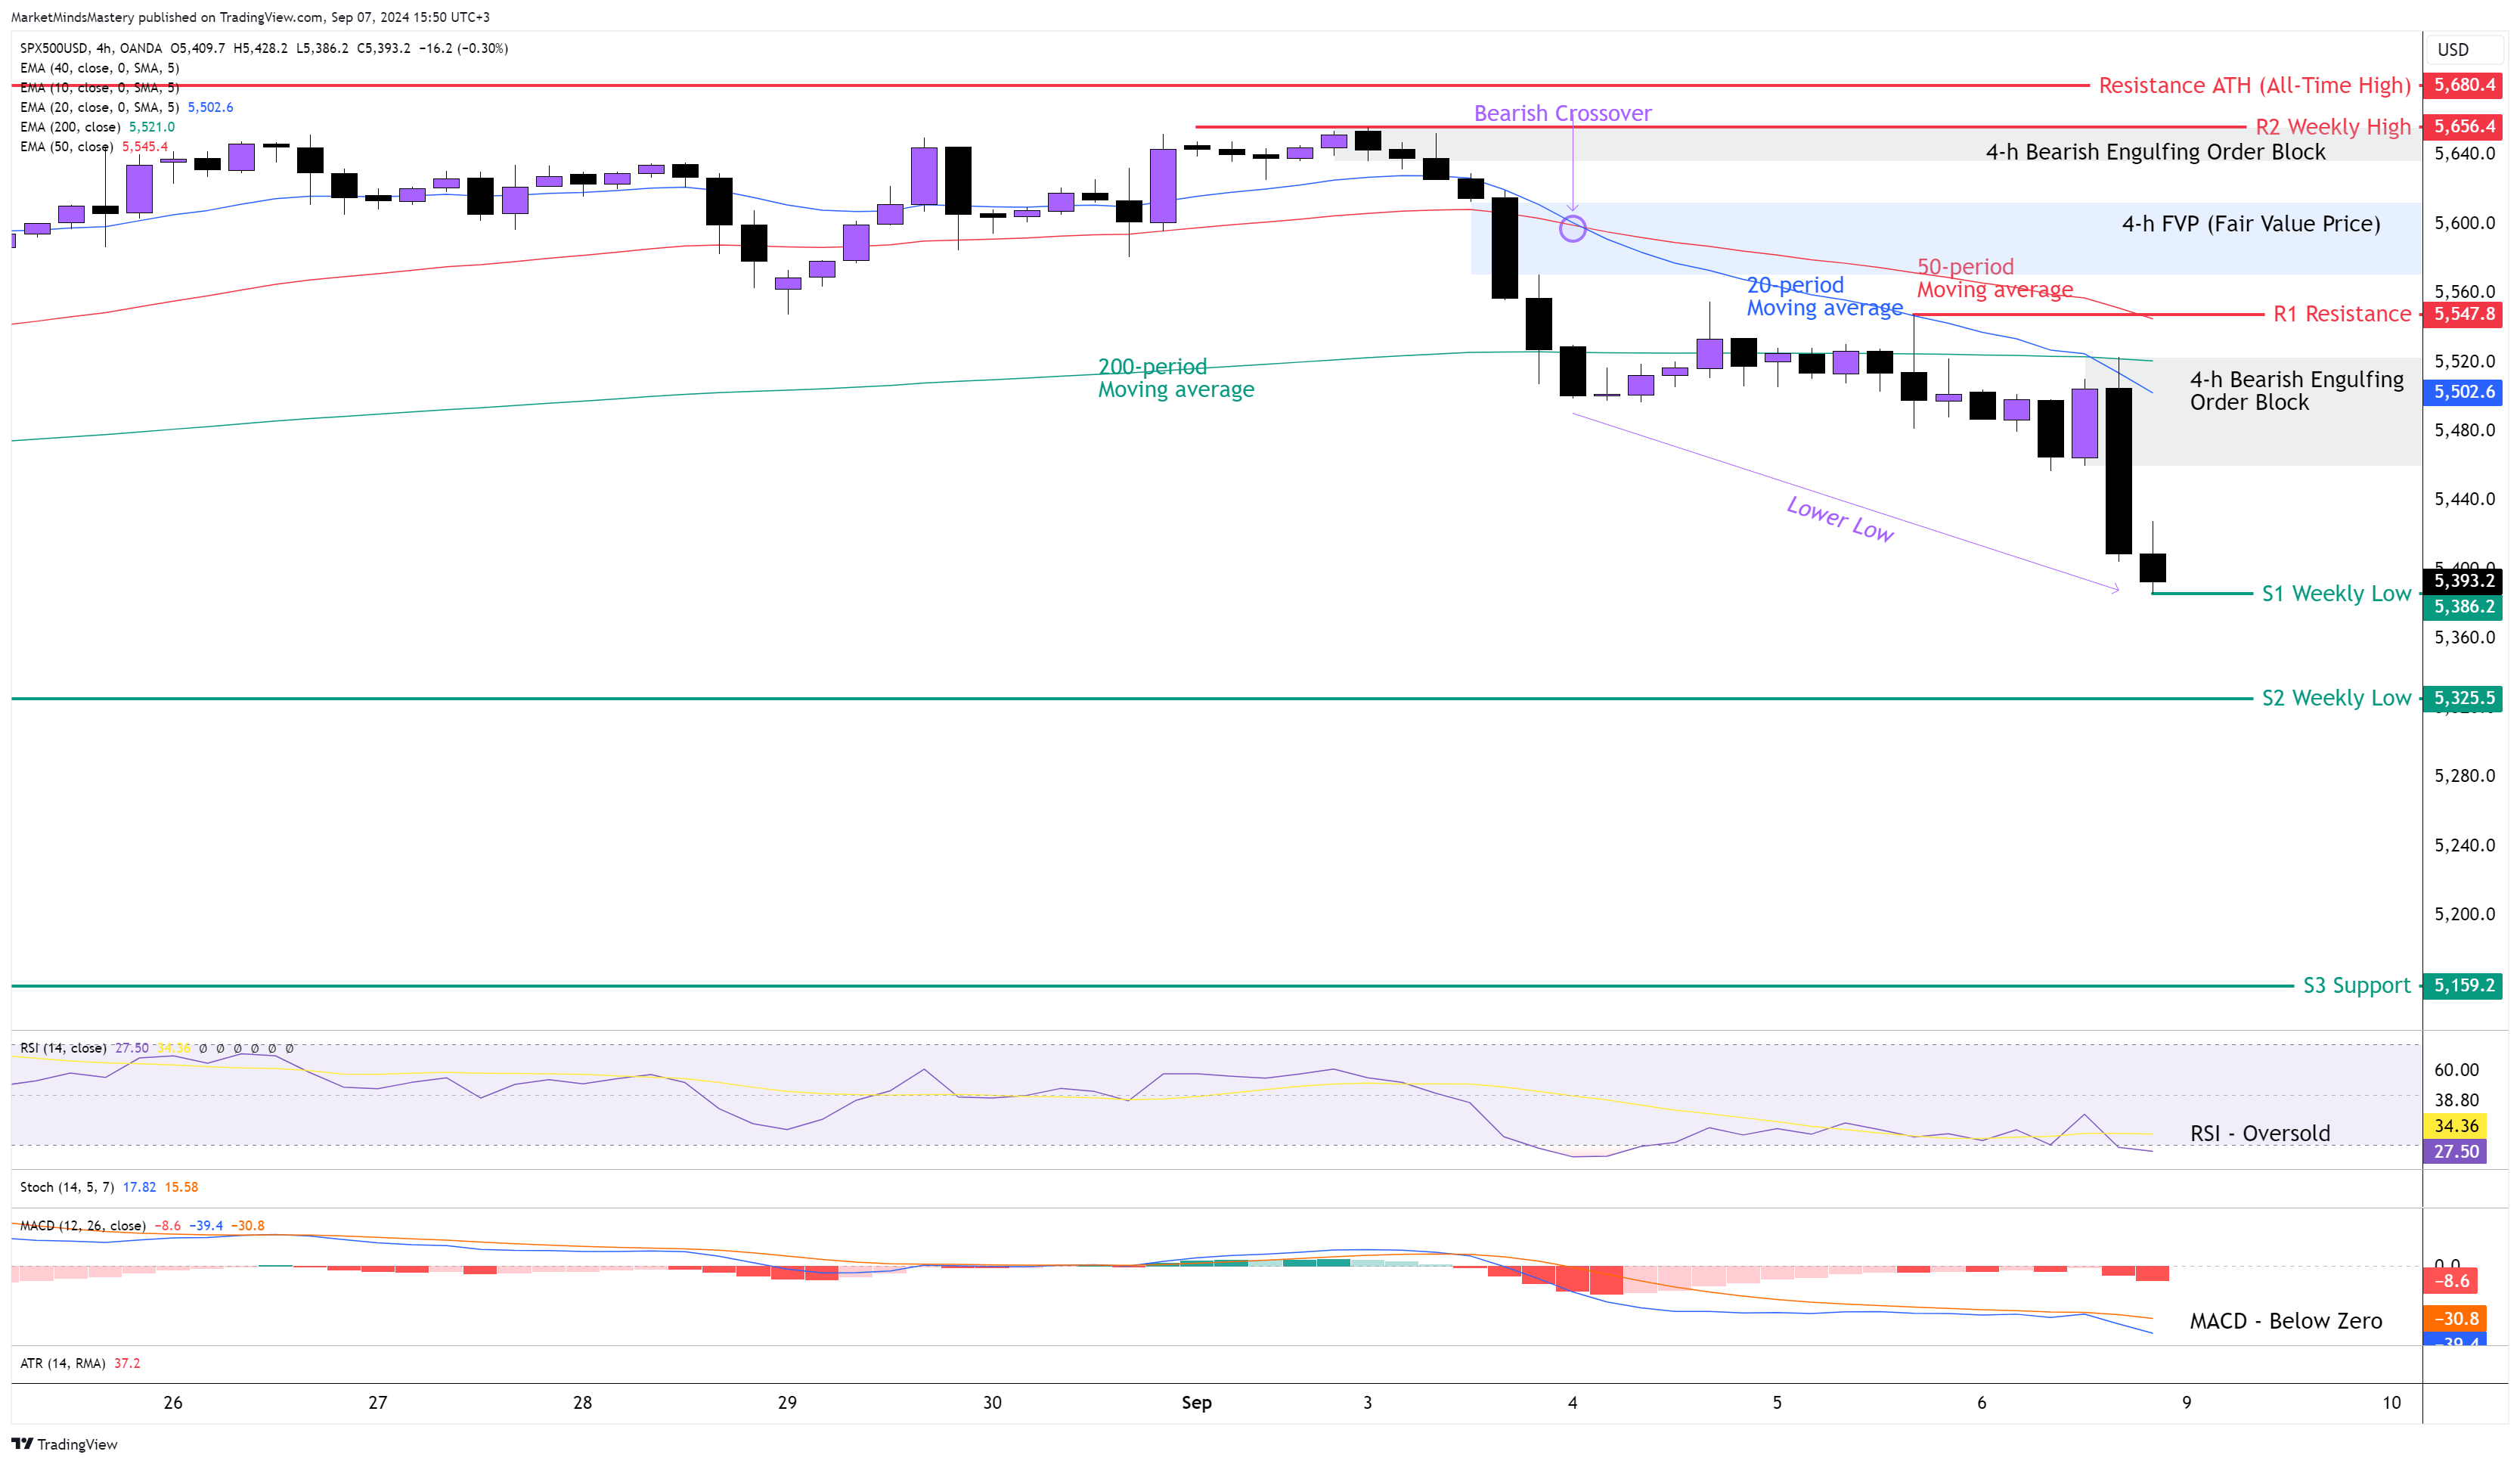
Following the reversal price action of the weekly chart, last week, the price of the US500 declined, creating a Bearish Engulfing Reversal candlestick pattern. On the 4-hour chart, though, the price showed up as a lower high and lower low formation, indicating a downtrend that started. The 20-period is below the 50-period moving average, and this has bearish implications. The RSI Oscillator is in an Oversold condition, which indicates the strength of the sell order in the market. Also, the MACD is below the zero line, which means that the prices are declining rapidly. The MACD’s Histogram is below the MACD 's middle line, and this has bearish implications. Starting Monday, if the price continues moving downward, the first support area, S1, will be the previous week’s low, around $5386. If the price penetrates the S1 and keeps moving downwards, the next support area, S2, will be an older weekly low of around $5325. As it further declines and continues to move downwards, it finds the next support area, S3, approximately $5159.
On the other hand, if the price moves upwards, the first resistance area, R1, will be around $5547. This level is considered significant because it coexists with the 4-hour Bearish Engulfing Order Block, the 200-period and the 50–period moving average, which can all provide additional resistance. If the price penetrates the R1 and keeps moving upwards, the next resistance area, R2, will be around $5656. Around the $5600, the price created an FVP (Fair Value Price) last Tuesday and a Bearish Engulfing Order Block close to $5650. In case the price goes through the R2 resistance, it will reach the ATH (All-Time High) level at $5680.
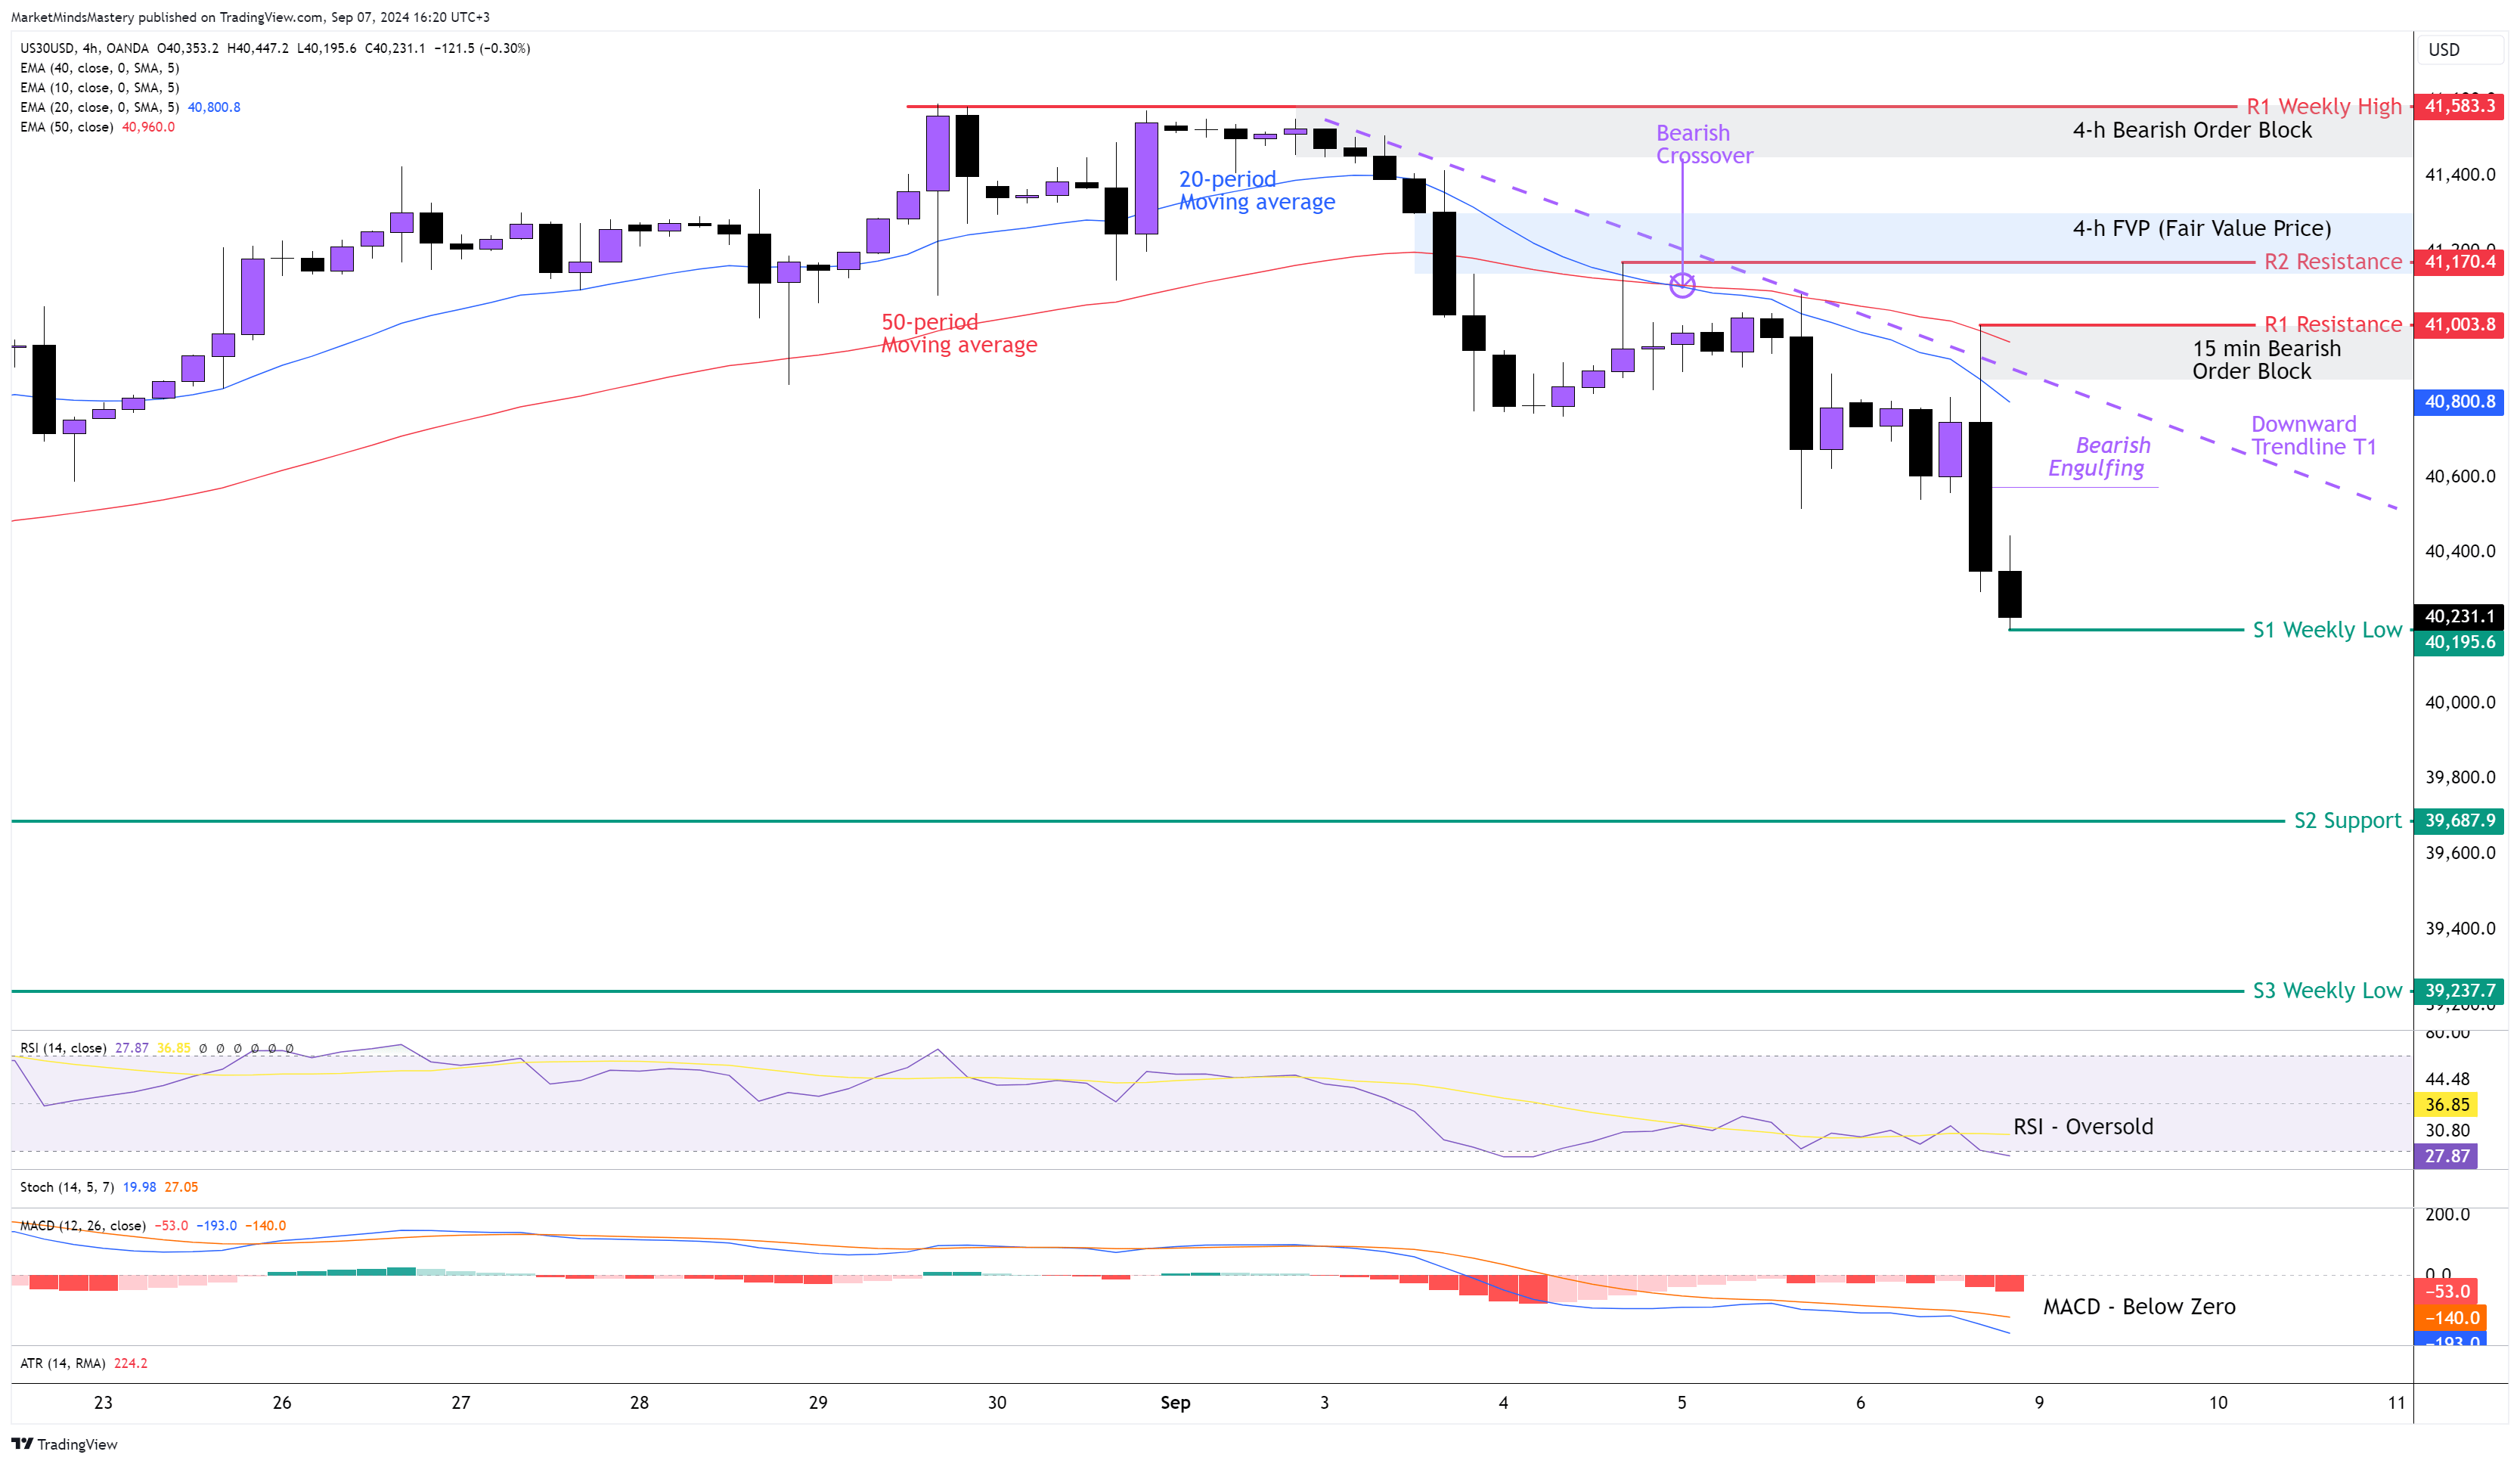
US 30, 4H
Following the price move on the US30, the price created a Bearish Engulfing price action candlestick on the weekly chart and set the market into a corrective phase. On the 4-hour chart, though, this showed a trend reversal. The price stopped making higher highs and higher lows, and instead, it started the formation of lower highs and lower lows. The 20-period crossed below the 50-period moving average last Wednesday, creating a Bearish Crossover. Last Friday, the price created a Bearish Engulfing Order Block of around $41000. Prior to that, last Monday, it created another Bearish Order Block of around $41500 and last Tuesday, it created an FVP (Fair Value Price) of around $41200. The RSI Oscillator followed the rapid price decline, and it entered into an Oversold condition. The MACD crossed below its zero line. Its Histogram is also below the zero line, which shows bearishness. Currently, the price is below the Downward Trendline T1. If it continues moving downwards, the first support area, S1, will be around $40195, which is the previous week’s low. If the price penetrates the S1 and keeps moving lower, the next support area, S2, will be around $39687. In case the price goes through the S2 and keeps lowering, the next support area, S3, will be an older weekly low of around $39237. Oppositely, if the price bounces off and starts moving upwards, the first resistance area, R1, will be the high point of the Bearish Engulfing candle around $41000. If the price surpasses R1 and keeps moving upwards, the next resistance area, R2, will be $41170, and the following resistance, R3, will be the previous week’s high at $41583.
GER 30, 4H
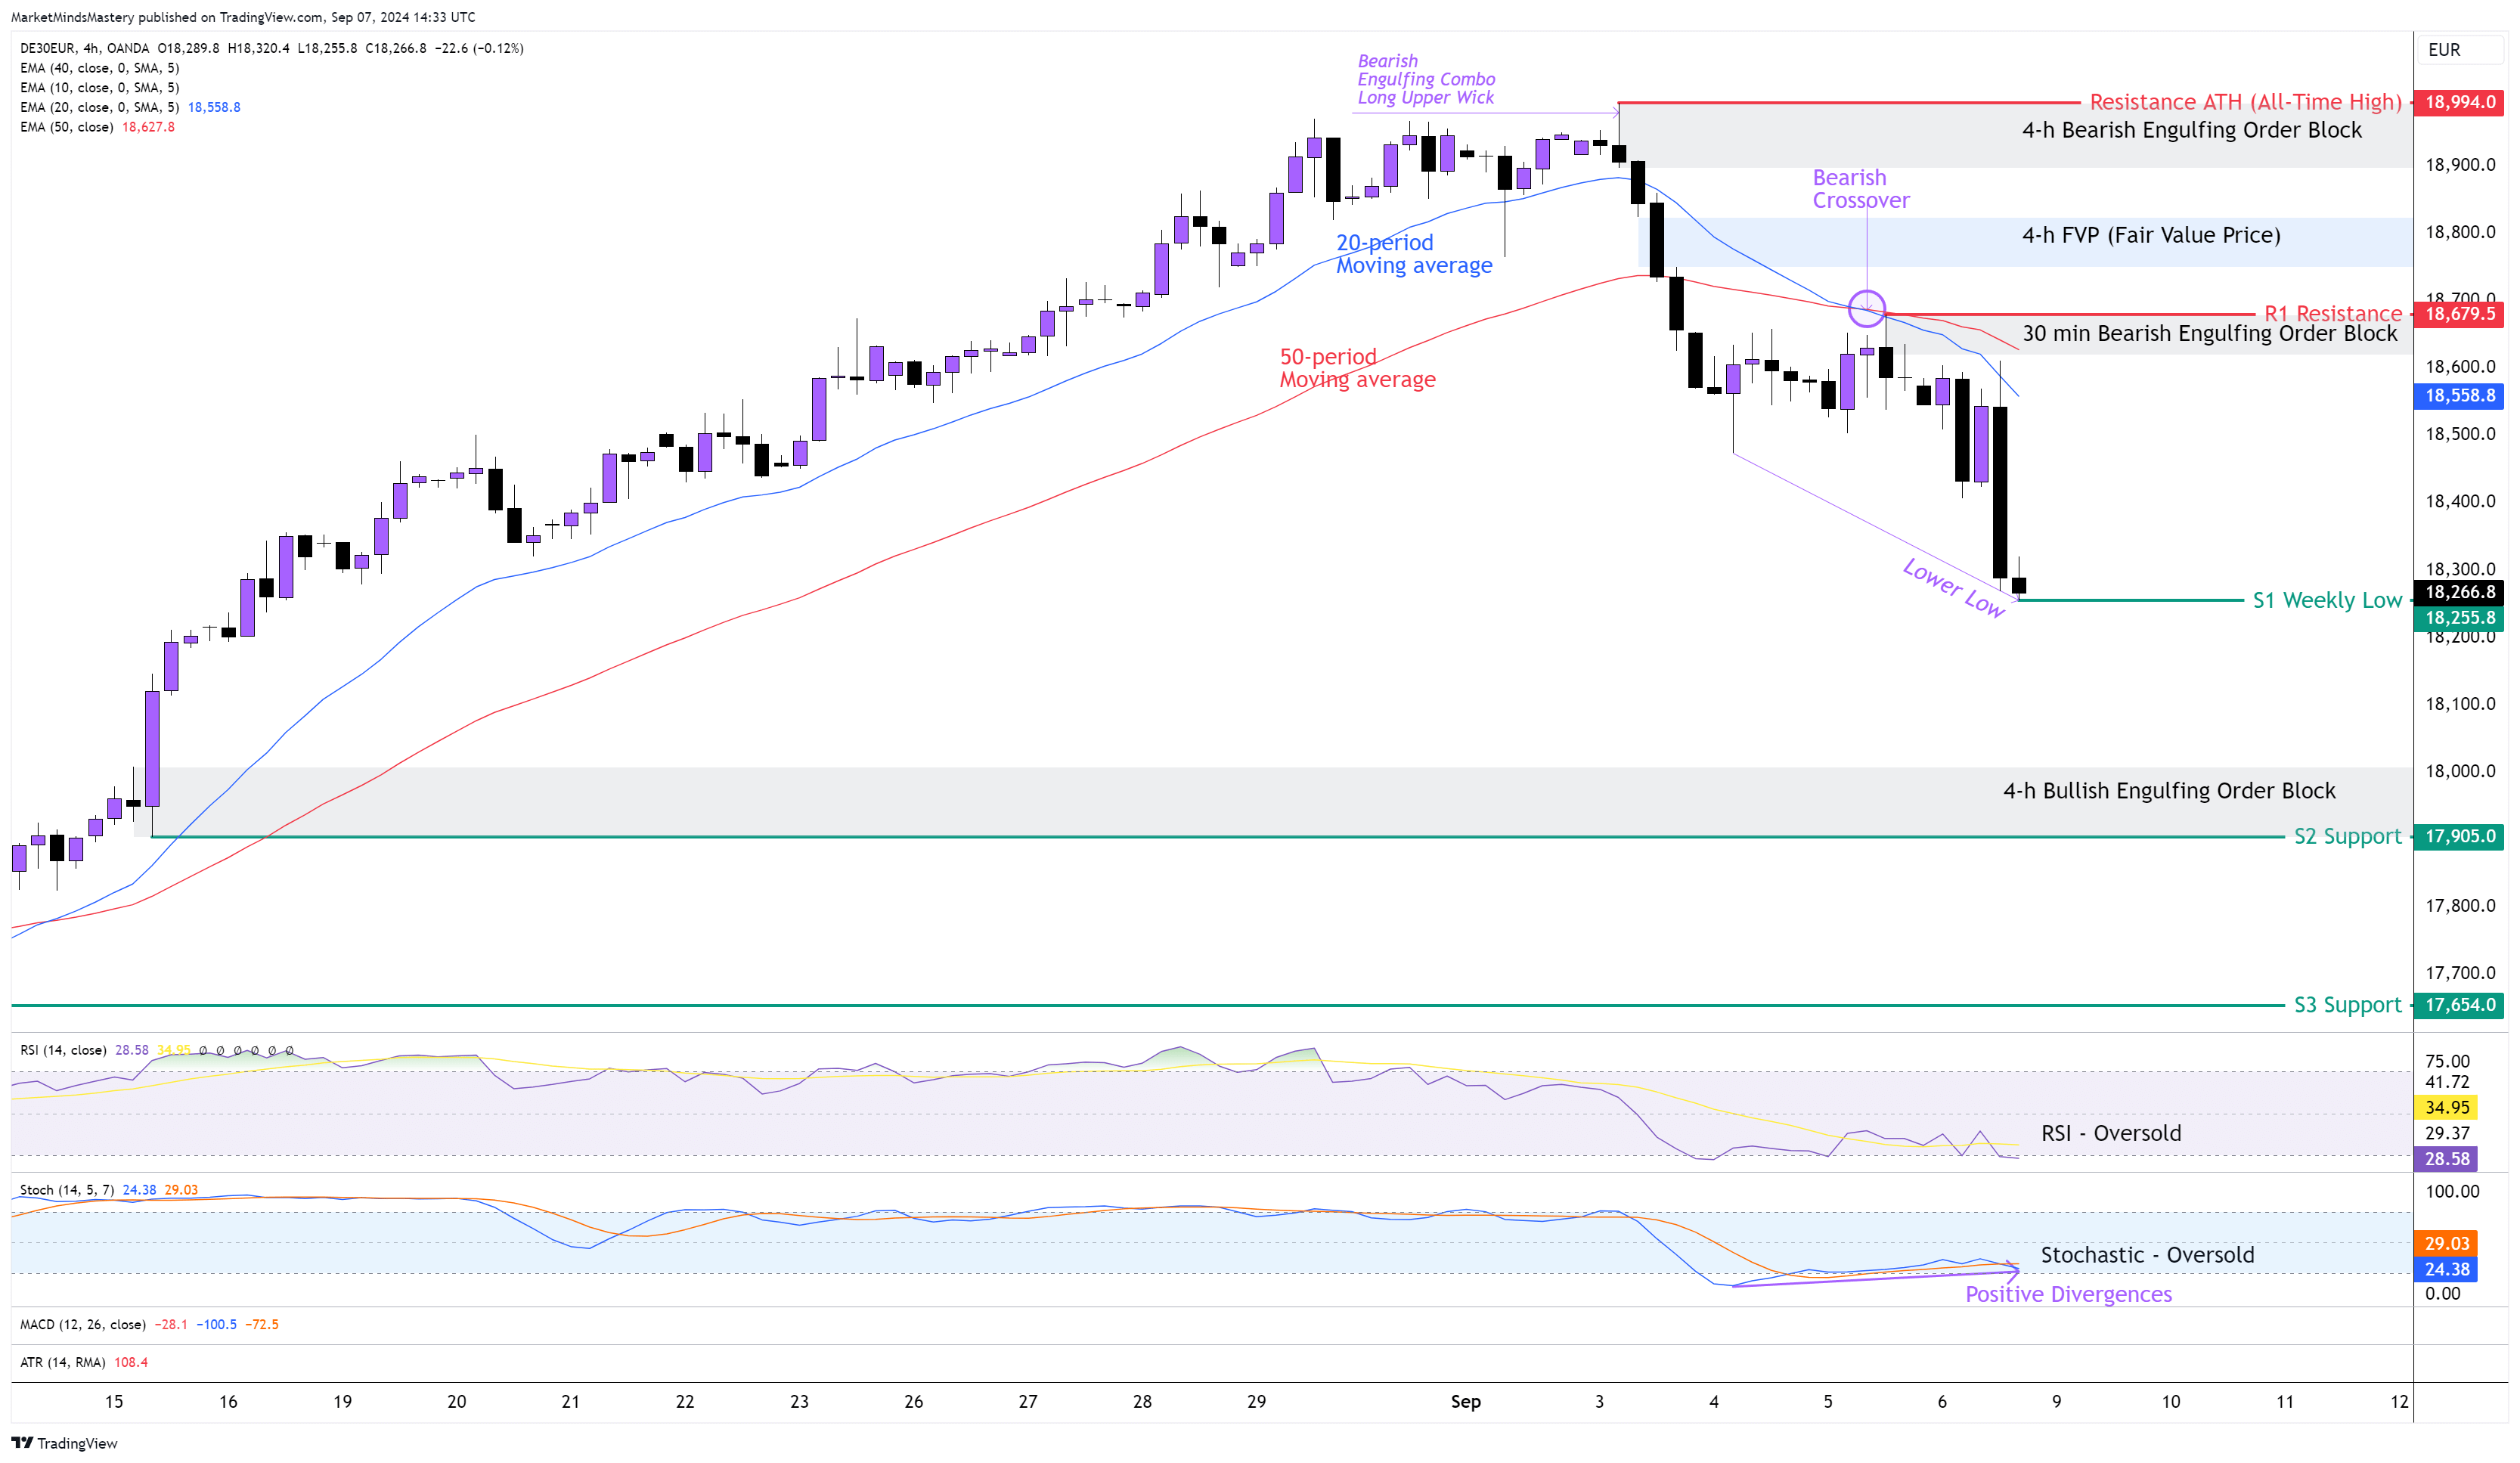
Following the previous week’s Market Outlook, the price of the GER30 was at its ATH (All-Time High) level. Last Tuesday, the price created a New ATH around 19000. However, a Bearish candle with a Long Upper wick caused a False Breakout, and the price then started moving downwards until the end of the week, creating a Bearish Engulfing Reversal Candlestick pattern on the weekly chart. On the 4-hour chart, the price created a lower high and a lower low formation. Last Thursday, a Bearish Crossover occurred once the 20-period moving average crossed below the 50-period moving average.
Additionally, the RSI is in Oversold condition, followed by a downward price momentum. The Stochastic entered into its Oversold area once the Oscillator dropped below its lowest line of 20. At the same time, though, the Oscillator was unable to create a lower low formation, similar to the price. Instead, it created a higher low, showing a Positive Divergences A’ Class as shown in the chart. Currently, the price maintains the lower highs and lower low formation. Therefore, starting Monday, if the price keeps moving downwards, the first support area, S1, will be around 18255, which is the lowest price level of the previous week. If the price penetrates the S1 and keeps moving downwards, the next support area, S2, will be around 17905. A further downward move will find the S3 support area around 17654.
On the contrary, if the price starts a retracement phase and moves upwards, the first resistance area, R1, will be at 18679. This level coexists with the 50-period moving average, which can become a dynamic resistance, as well as a 30-min Bearish Engulfing Order Block created last Thursday. In case the price penetrates the R1 resistance and keeps moving upwards, the next resistance area, R2, will be the ATH around 18994. Last Tuesday, the price created an FVP (Fair Value Price) and a Bearish Engulfing Order Block around 18800 and 18990, respectively.