Last week, the FED kept the Interest Rates unchanged at 5.5%, and the NFP reported much lower than the forecast. The US dollar was expected to weaken. However, the market didn’t follow through with all major currency pairs, and the US dollar dominated the AUD and the Sterling. Sterling’s weaknesses came because the Bank of England dropped the Interest Rates to 5% as forecasted, and the Sterling lost a lot of value afterwards. The negative news for the Australian dollar report continued last week, and the Aussie remained one of the weakest currencies. On the other hand, the positive CPI report in the Eurozone boosted the Euro, and it took advantage of the weak Sterling and the weak Aussie, as shown on the charts of the EURAUD and EURGBP. The Swissy thought it acted very well as a “safe haven” currency, and it gained significant appreciation. The biggest surprise of all was the Japanese Yen. As per the forecast, the Interest Rate was expected to remain between 0.5 - 0.1%, but the Bank of Japan decided to increase it to 1.5%. That strengthened the Yen, and the weakness of the GBPJPY, as well as the AUDJPY, was the most noticeable out of all Japanese Yen pairs.
Banks in Australia and Canada will be closed on Monday due to bank holidays. This means that the volatility and liquidity of both currencies during the Asian Trading Session are expected to be minimal. Usually, Monday follows the NFP (Non-Farm Payroll), and the markets are “digesting” the reported outcomes. As there won't be any significant news events during the Asian and London Trading Sessions, the volatility is expected to be as usual. The markets are expected to become more active during the New York trading session, as the US will report the ISM Services PMI (Purchase Manufacture Index). The Outcome of this announcement is very important because the PMI is highly positively correlated with the GDP (Gross Domestic Product) in the US. It is so because this service sector is a major part of the US economy. Suppose the reported outcome is equal to or higher than the forecast, which is given to be 52. In that case, the US dollar is expected to strengthen and potentially, under normal market conditions, continue the GBPUSD downtrend and the AUDUSD downtrend.
Tuesday will be a significant day for the Australian Dollar. Early in the morning, during the Tokyo Trading Session, the RBA (Reserve Bank of Australia) will report the interest rates. Currently, they are at 4.35%, and the forecast estimates to keep them the same. Usually, if the interest rates remain the same, it has the same impact on the currency as if it dropped. This happens because big investors “lose faith” in the currency, and they believe its performance from now on will negatively affect their investment. Therefore, they usually keep a dovish approach, and either move their deposits to a country that has recently increased interest rates, if there is one. As we commented in the last few weeks, all three major commodity currencies, AUD, NZD, and CAD, are weak against the Euro, Sterling, Yen, Swissy, and Greenback. Still, the weakness of the Australian dollar has been more noticeable. At the same time, Monetary Policy will be released, and one hour after the Interest Rates report, the RBA Press Conference will follow.
Moving forward, the Unemployment Rate will be reported in Switzerland, with the consensus to estimate a rise from 2.4% to 2.5%. This result can negatively affect the value of the Swissy and set currency pairs like the USDCHF and EURCHF for trend retracements. Still, in Switzerland, Retail Sales are expected to improve from 0.4% to 0.5%. The next important report for the day will be the Construction PMI in the UK, which highly affects Sterling’s performance. The forecast shows a drop from 52.2 to 51. However, if the reported number remains above the benchmark of 50, it will still be considered a bullish factor for the Great British Pound. The last significant event of the day will be the Retail Sales in the eurozone. Currently, the number is 0.1%, and as per the forecast, it is expected to drop to -0.2%. This can be a negative factor for the Euro as this event is correlated with inflationary indicators and consumer spending.
It's been a while since we had important news in New Zealand. Still, on Wednesday, the volatility is expected to pick up since the Sydney trading session, which preceded the Asian trading session because of the Unemployment Rate in New Zealand. The unemployment rate is currently at 4.3%, and it is expected to rise significantly, based on the forecast, by 0.4%, which will potentially make it 4.7%. This is considered a significant increase in the unemployment rate because it shows that almost 0.5% of the residents are claiming government support. Therefore, it can be a bearish sign for the NZD. In addition to this, the Employment Rate is expected to increase from -0.2% to -0.3%. If the Kiwi gets weak, it might be a good chance to trade currency pairs like NZDJPY and NZDUSD if both the USD and the Yen continue the downtrends in the short time frames against the New Zealand Dollar. The rest of the trading day is expected to continue under normal volatility as there won't be any major news events either during the London trading session or during New York.
On Thursday, early morning in Japan, the Trade Balance report will be announced. A significant increase in the number is expected. Currently, the Trade Balance in Japan is at 1108.9B, and the forecast shows an increase to 344.4 B. If you have been reading the Weekly Market Outlook for a while now, you should know that the Trade Balance is the net difference between the imports and exports of any goods and services in the country. Therefore, a positive report is usually a favourable outcome for the currency, especially in countries like Japan, which are very dependent on imported goods. This is one of the events that usually attracts a lot of attention. For this week, based on the forecast, there is positivity around the Japanese Yen. What remains afterwards is the market to follow through in case the actual reports confirm the forecast reports.
Next, Governor Bullock will give a speech on behalf of the RBA. Usually, a few days after the RBA's Interest Rate report, the Governor gives a speech explaining how they see the economic future in Australia. They already gave some hints about what they will be looking to do with next month’s interest rates. Especially during Bullock’s speech, it will be good to pay attention because of the latest drop in the Australian dollar's value.
Next will be the RBNZ (Reserve Bank of New Zealand) turn, but this time, it will be with the Inflation Expectations for the 3rd quarter. Kiwi is also among the weakest currencies across the currencies board, and Inflation reports will reveal significant insides about the future performance of the currency as next week it will be the RBNZ's turn to represent their interest rates. The last significant event on this trading day will be Unemployment Claims in the US. Currently, the unemployment claims in the US are 249K, and the forecast estimates a drop to 245K. If the actual will confirms the forecast, or if it drops even lower, then the US Dollar is expected to gain strength because fewer people in the US will receive government support.
Friday is the last trading day of this week, and the market is expected to move under normal volatility as there are only a few significant news events, and they are not the type of events that create trend reversals. Although we don't trade the Chinese Yuan, the CPI (Consumer Price Index) in China is expected to increase from 0.2% to 0.3%, and the PPI (Purchase Price Index) is expected to drop from -0.8% to -0.9%. Both these events will happen during the early Asian Trading Session, and they will primarily affect the price of the Chinese Yuan.
The only important event during the London trading session will be the CCI (Consumer Confidence Index) in Switzerland. If the actual number is reported higher than the current -36.6, it will most likely boost the Swissy’s performance even more. Currency The Swiss Franc is among the top three strongest currencies, with an established downtrend on the AUDCHF, NZDCHF, CADCHF, GBPCHF and EURCHF. The first three, AUD, NZD and CAD, are all commodities currencies, and their weakness against the Swissy’s strength made them, for the last few weeks, among the top performance tradable currency pairs. The last event to end this week will be the Unemployment Rate in Canada. As it currently is at 6.4%, if the report is less than that and if, at the same time, the market follows through, we will likely see some strength on the Loonie (short for Canadian Dollar). Oppositely, if the unemployment rate is reported to be higher, it will add more weight to the Canadian dollar’s weakness.
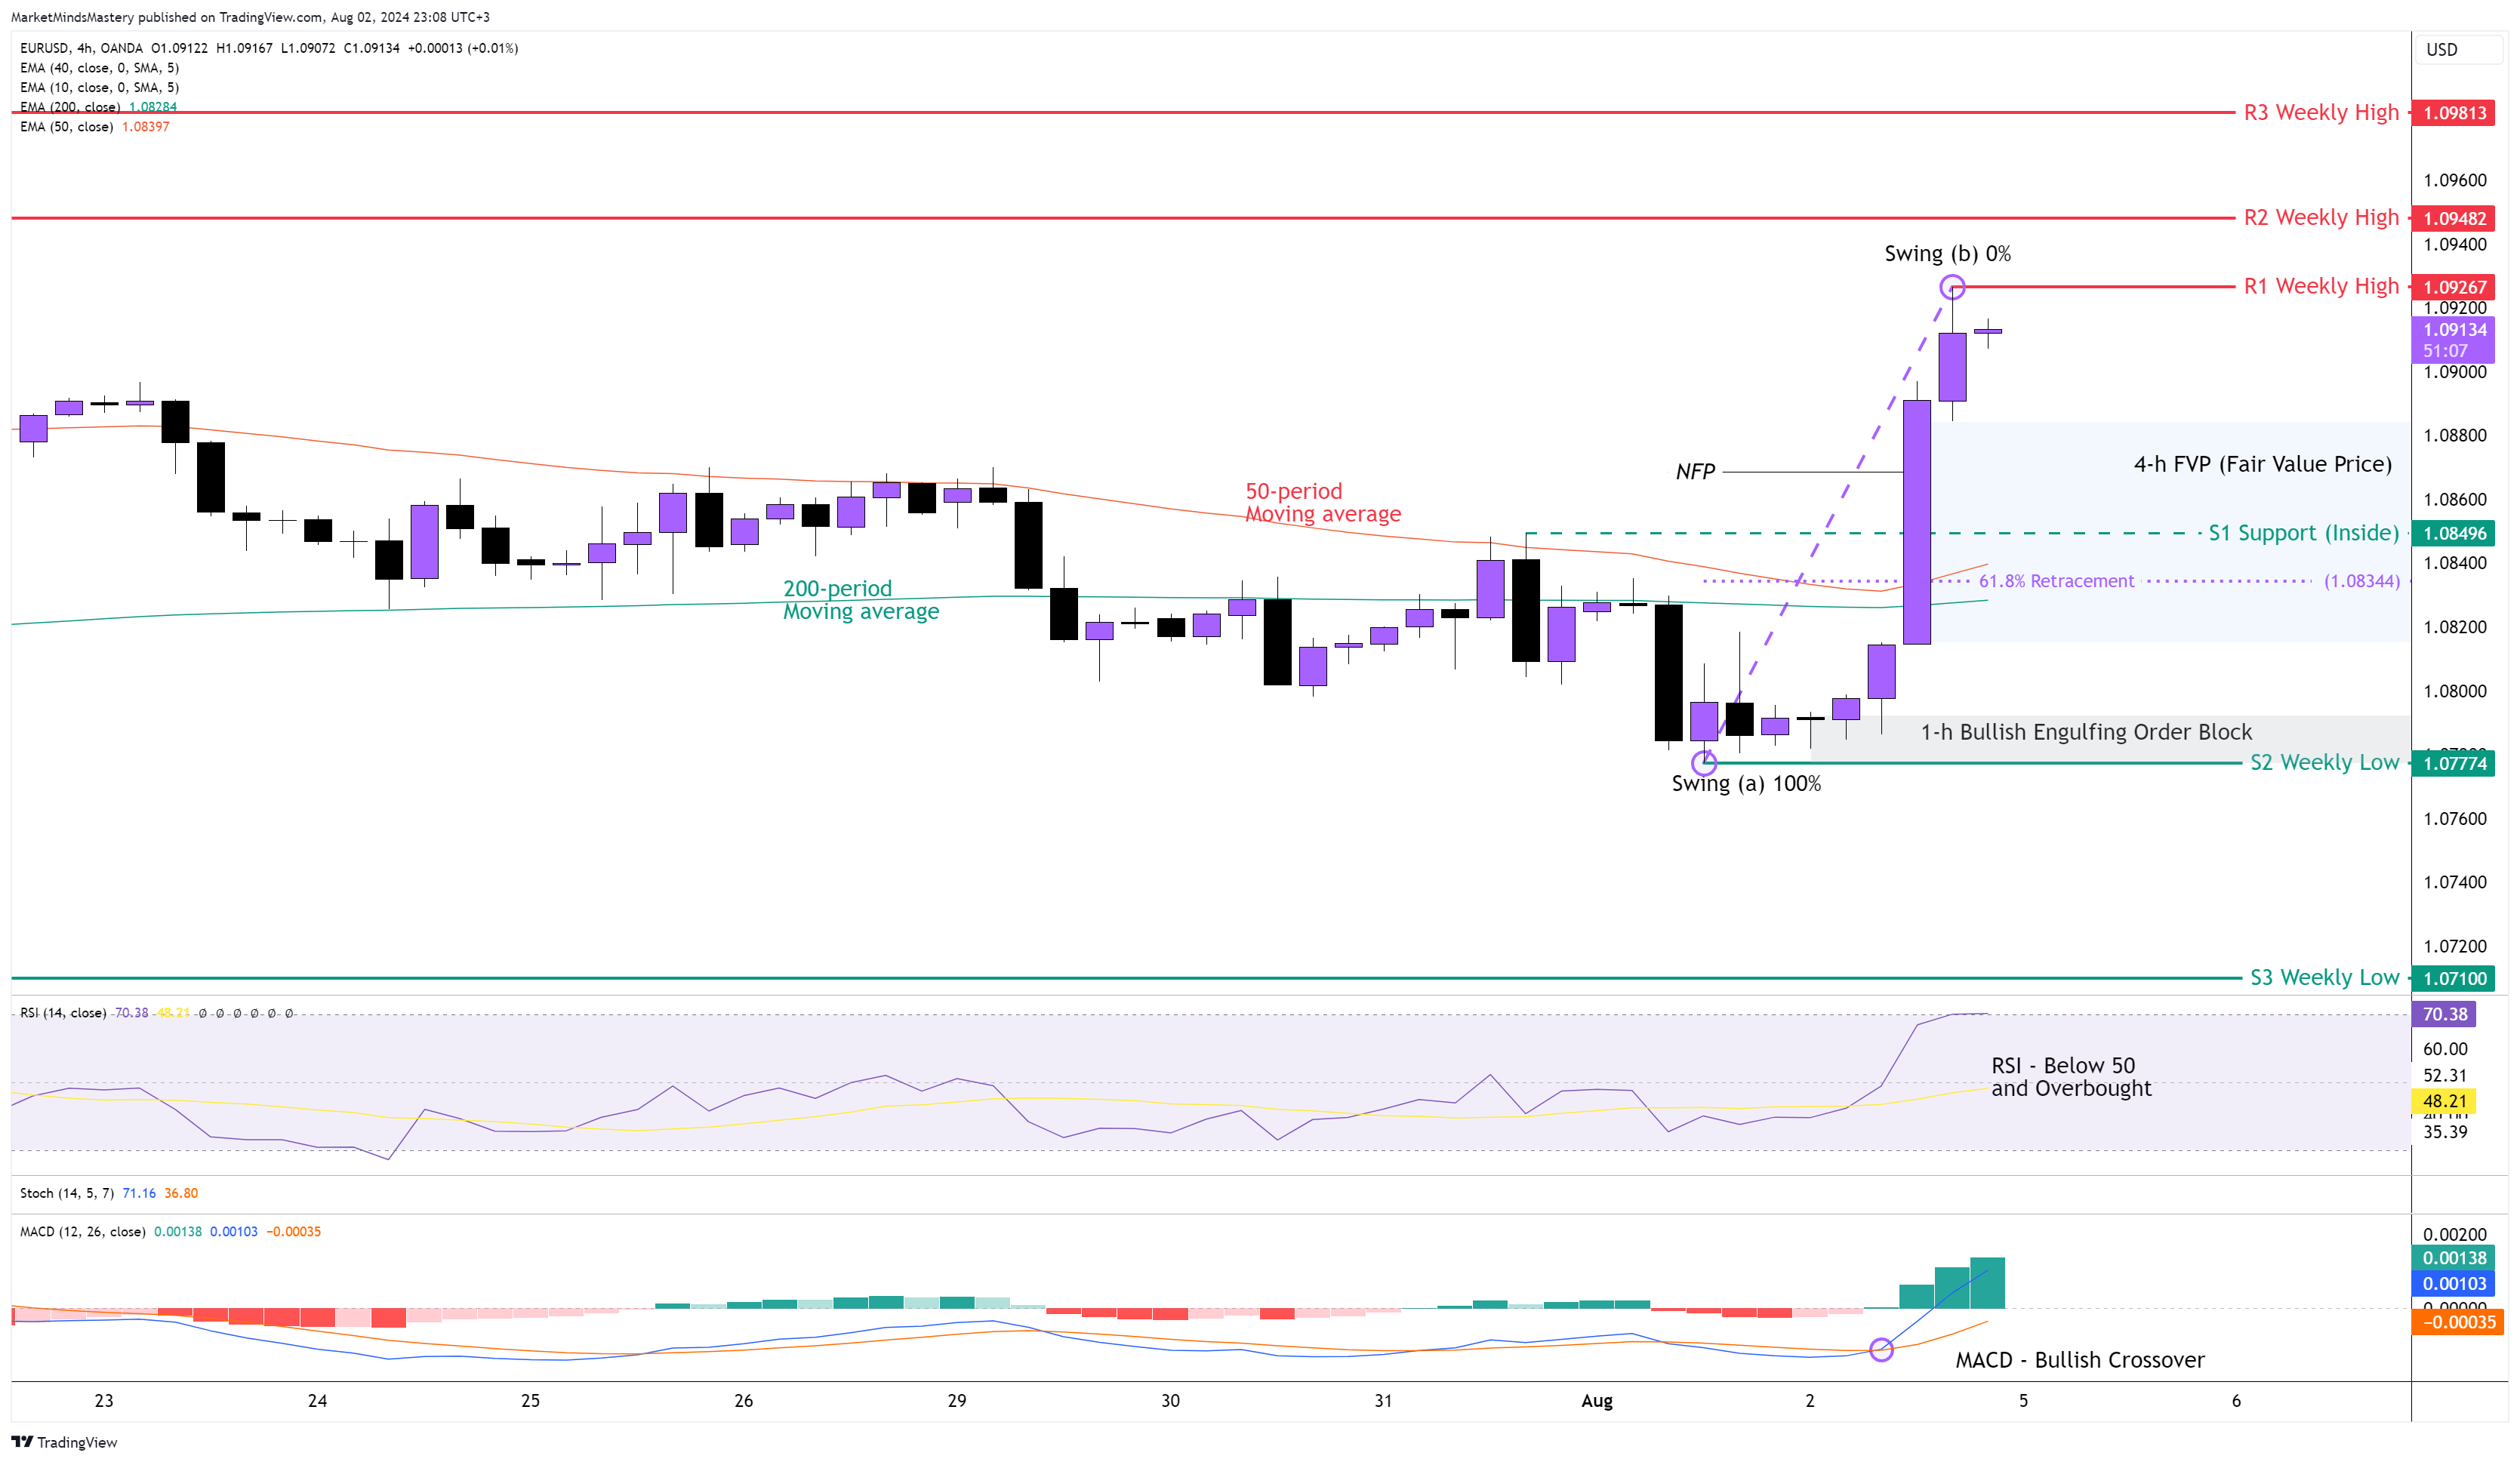
EUR USD 4H

As we explained in the previous week’s Market Outlook, the EURUSD was expected to reveal its direction after the NFP last Friday. The fact that the FED kept Interest Rates at 5.5% in the US, the NFP actual number was lower than the forecast, and the CPI report in the Eurozone was positive gave an upward boost to the EURUSD. The weekly candle ended as a Bullish Engulfing candle, and the 4-hour chart printed a Bullish Marubozu candle after the NFP announced. On the chart is marked as the NFP candle.
The 50-period is above the 200-period moving average, and this is Bullish. The RSI Oscillator is in an Overbought condition, signalling the strength of the upward move. The MACD, on the other hand, created a Bullish crossover while both the MACD Line and the Signal Line were below zero. The MACD’s Histogram now shows a Bullish upward move. During the upward move last Friday, the price created a Bullish Engulfing Order Block and FVP (Fair Value Price). There are significant areas on the price charts. Starting Monday, if the price continues its upward move, the first resistance area, R1, will be the previous week’s high of approximately 1.09267. If the price penetrates the R1 and continues to move upwards, the next resistance area, R2, will be another weekly high, around 1.09482. In higher time frames, it is considered a significant supply zone. A further upward move finds the R3 resistance area, around 1.09813.
Conversely, if the price declines and moves downwards, the first support area, S1, will be Inside support around 1.08496. This level coexists with the area of 61.8% Fibonacci retracement and is within the FVP. In case the price declines further, the next support area, S2, will be around 1.07774. As we see on the chart, it's another weekly low, which makes it a significant level of support.
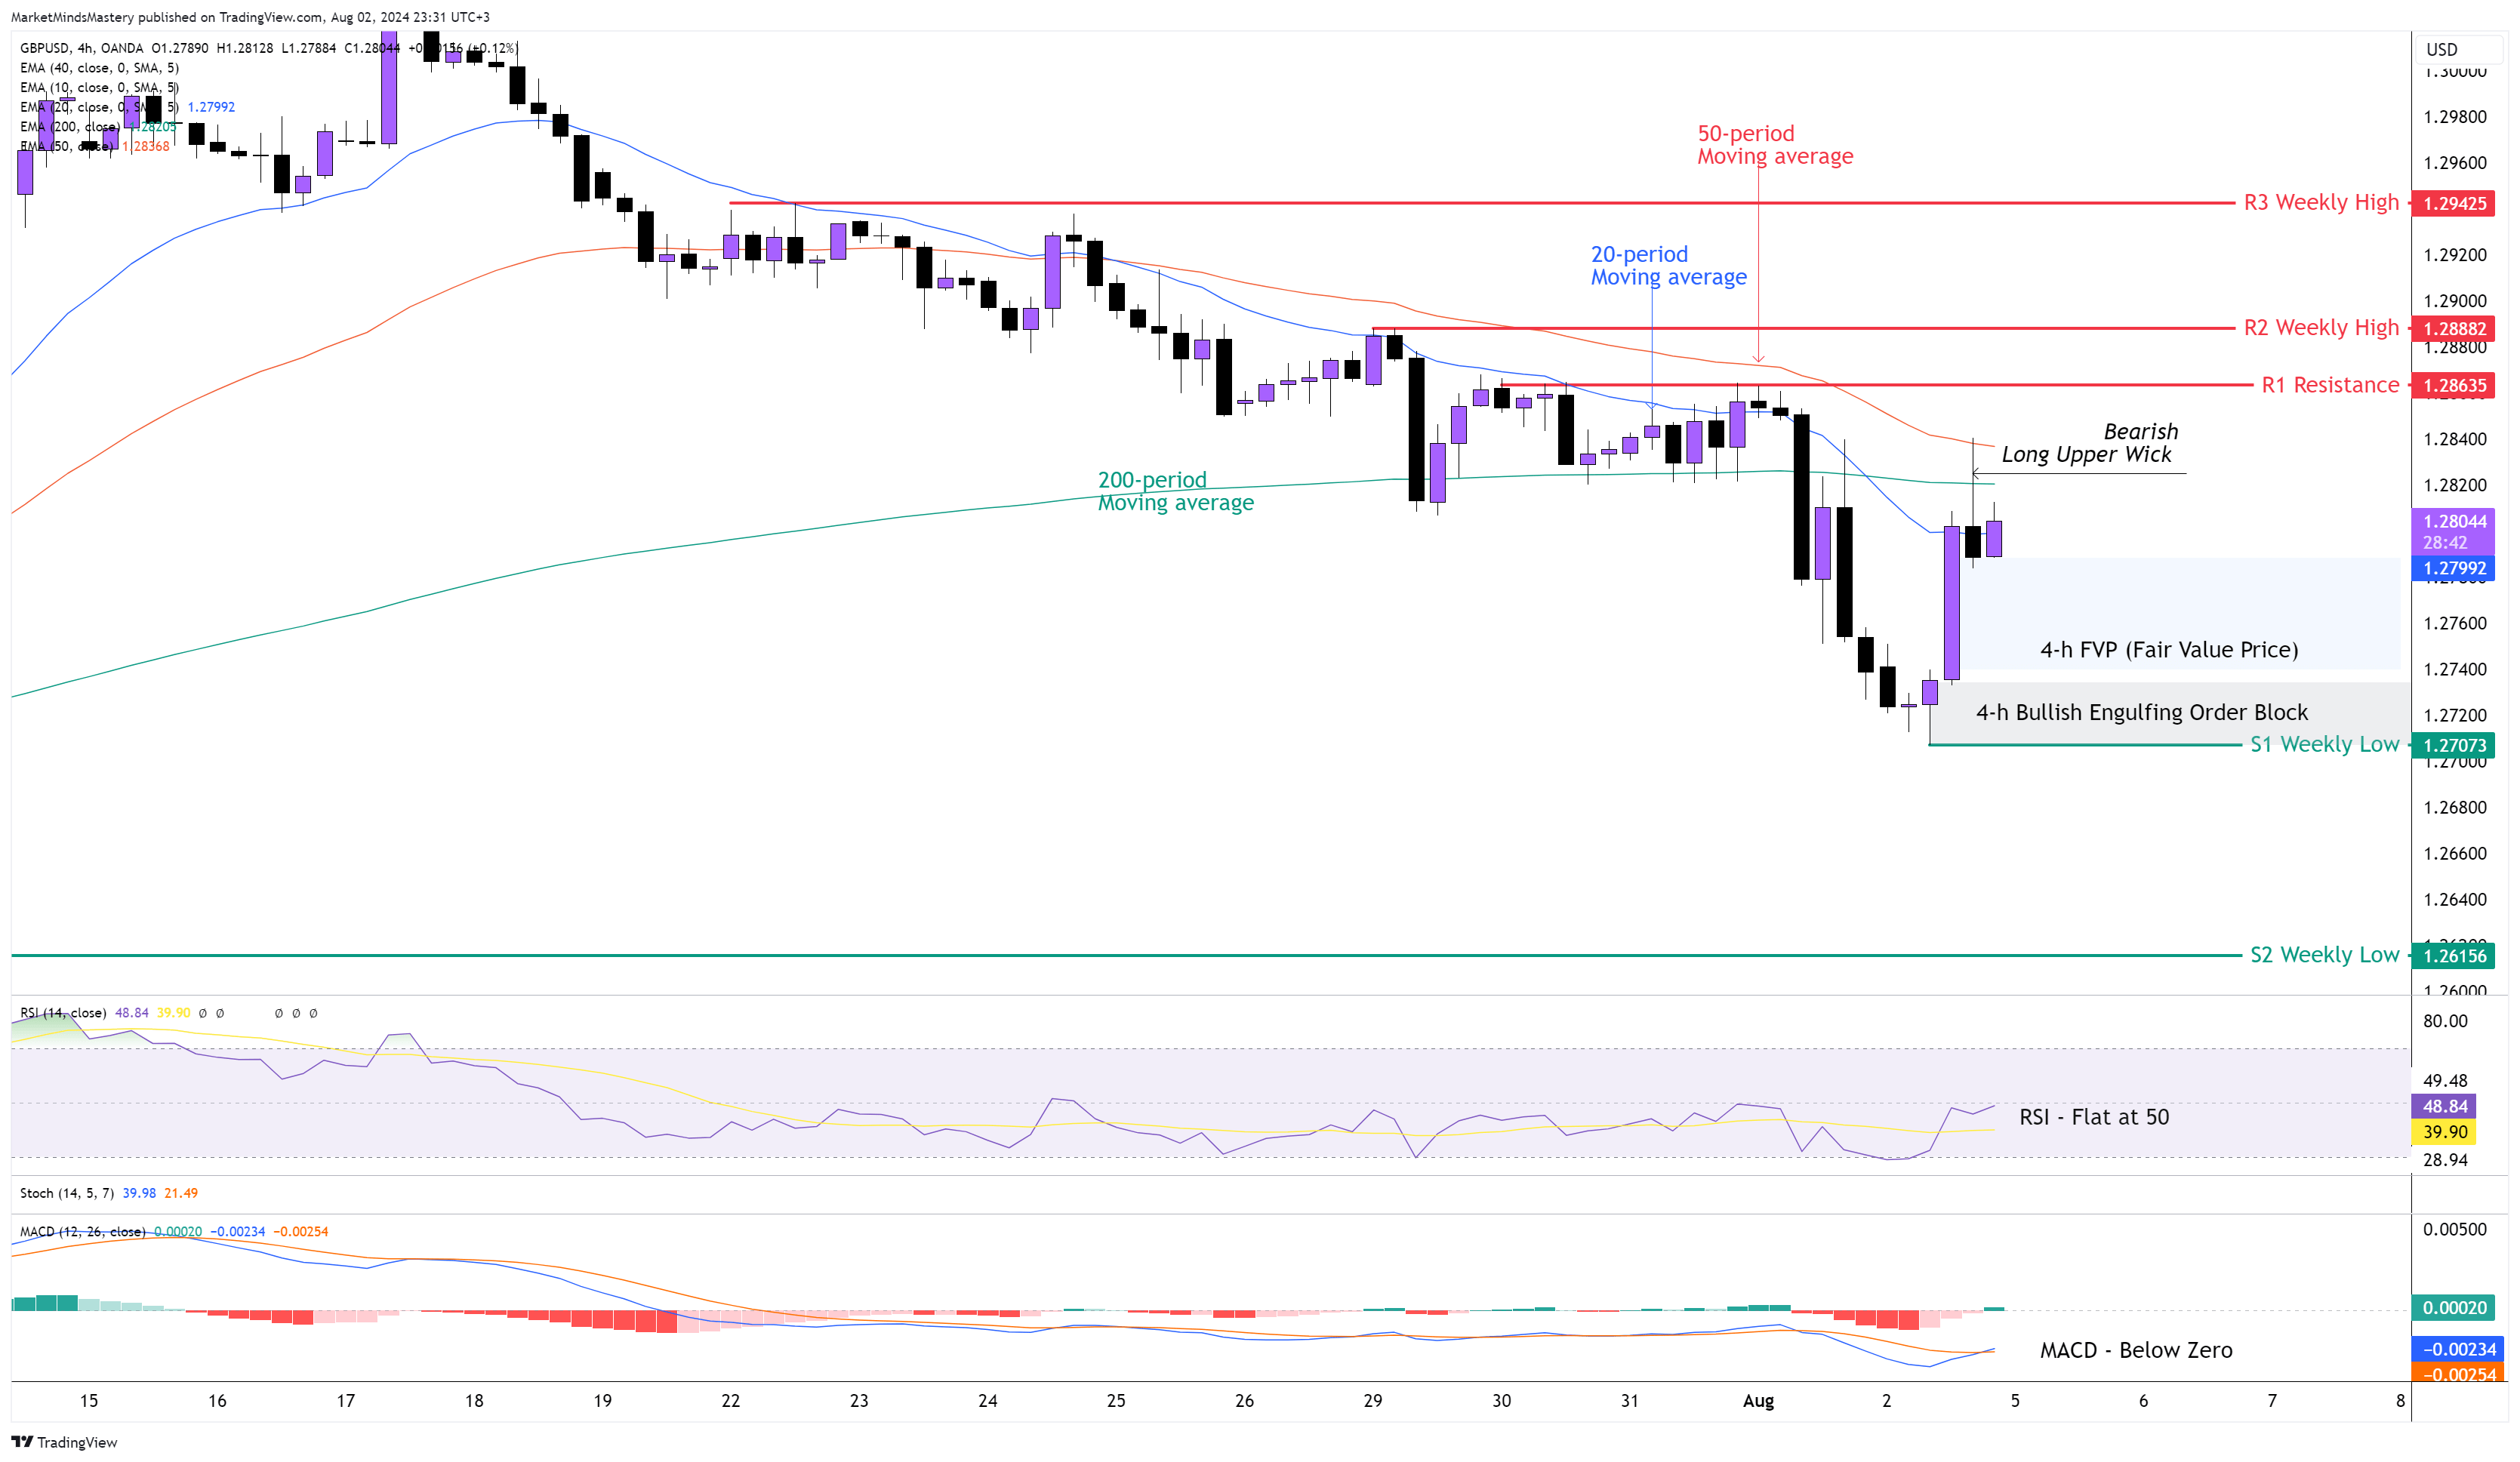
GBP USD 4H
Last week, the Sterling was considered one of the most undervalued currencies as the BoE reported interest rates at 25 basis points less than the previous. A drop in the Interest Rates in the UK caused the Pound to depreciate, and the price chart shows a downtrend in the GBPUSD currency pair. On the 4-hour chart, the price maintains the lower highs and lower lows. The 20-period moving average is below the 50 period, and this is a bearish indication. The slow 200-period moving average is below the 50-period, which is a bullish indication. The RSI Oscillator is flat at around 50, and the MACD is below zero, but with a bullish crossover as the MACD Line (Blue) just now crossed above the Signal Line (Orange). Some of these indications are bullish, and some of them are bearish. The critical part of this currency pair is the Bearish candle with the Long Upper wick, which rejected the 50-period and the 200-period moving average last Friday, which, if will creates a new market structure next week, will resume the downtrend.
In case the market follows through with this Bearish Long Upper Wick candle, and the price declines, the first support area, S1, will be approximately 1.27073. This price level is the lowest of the previous week, and it is considered a significant level in the market. If the price penetrates the S1 and declines further, the next support area, S2, will be another weekly low around 1.26156. Conversely, if the price finds support and moves upwards, the first resistance area, R1, will be 1.28635. This level is close to the previous week’s high R2, at 1.28882, which the price will meet in case the price penetrates through the R1. A further upward move will find the R3 approximately at 1.29425.
AUD USD 4H
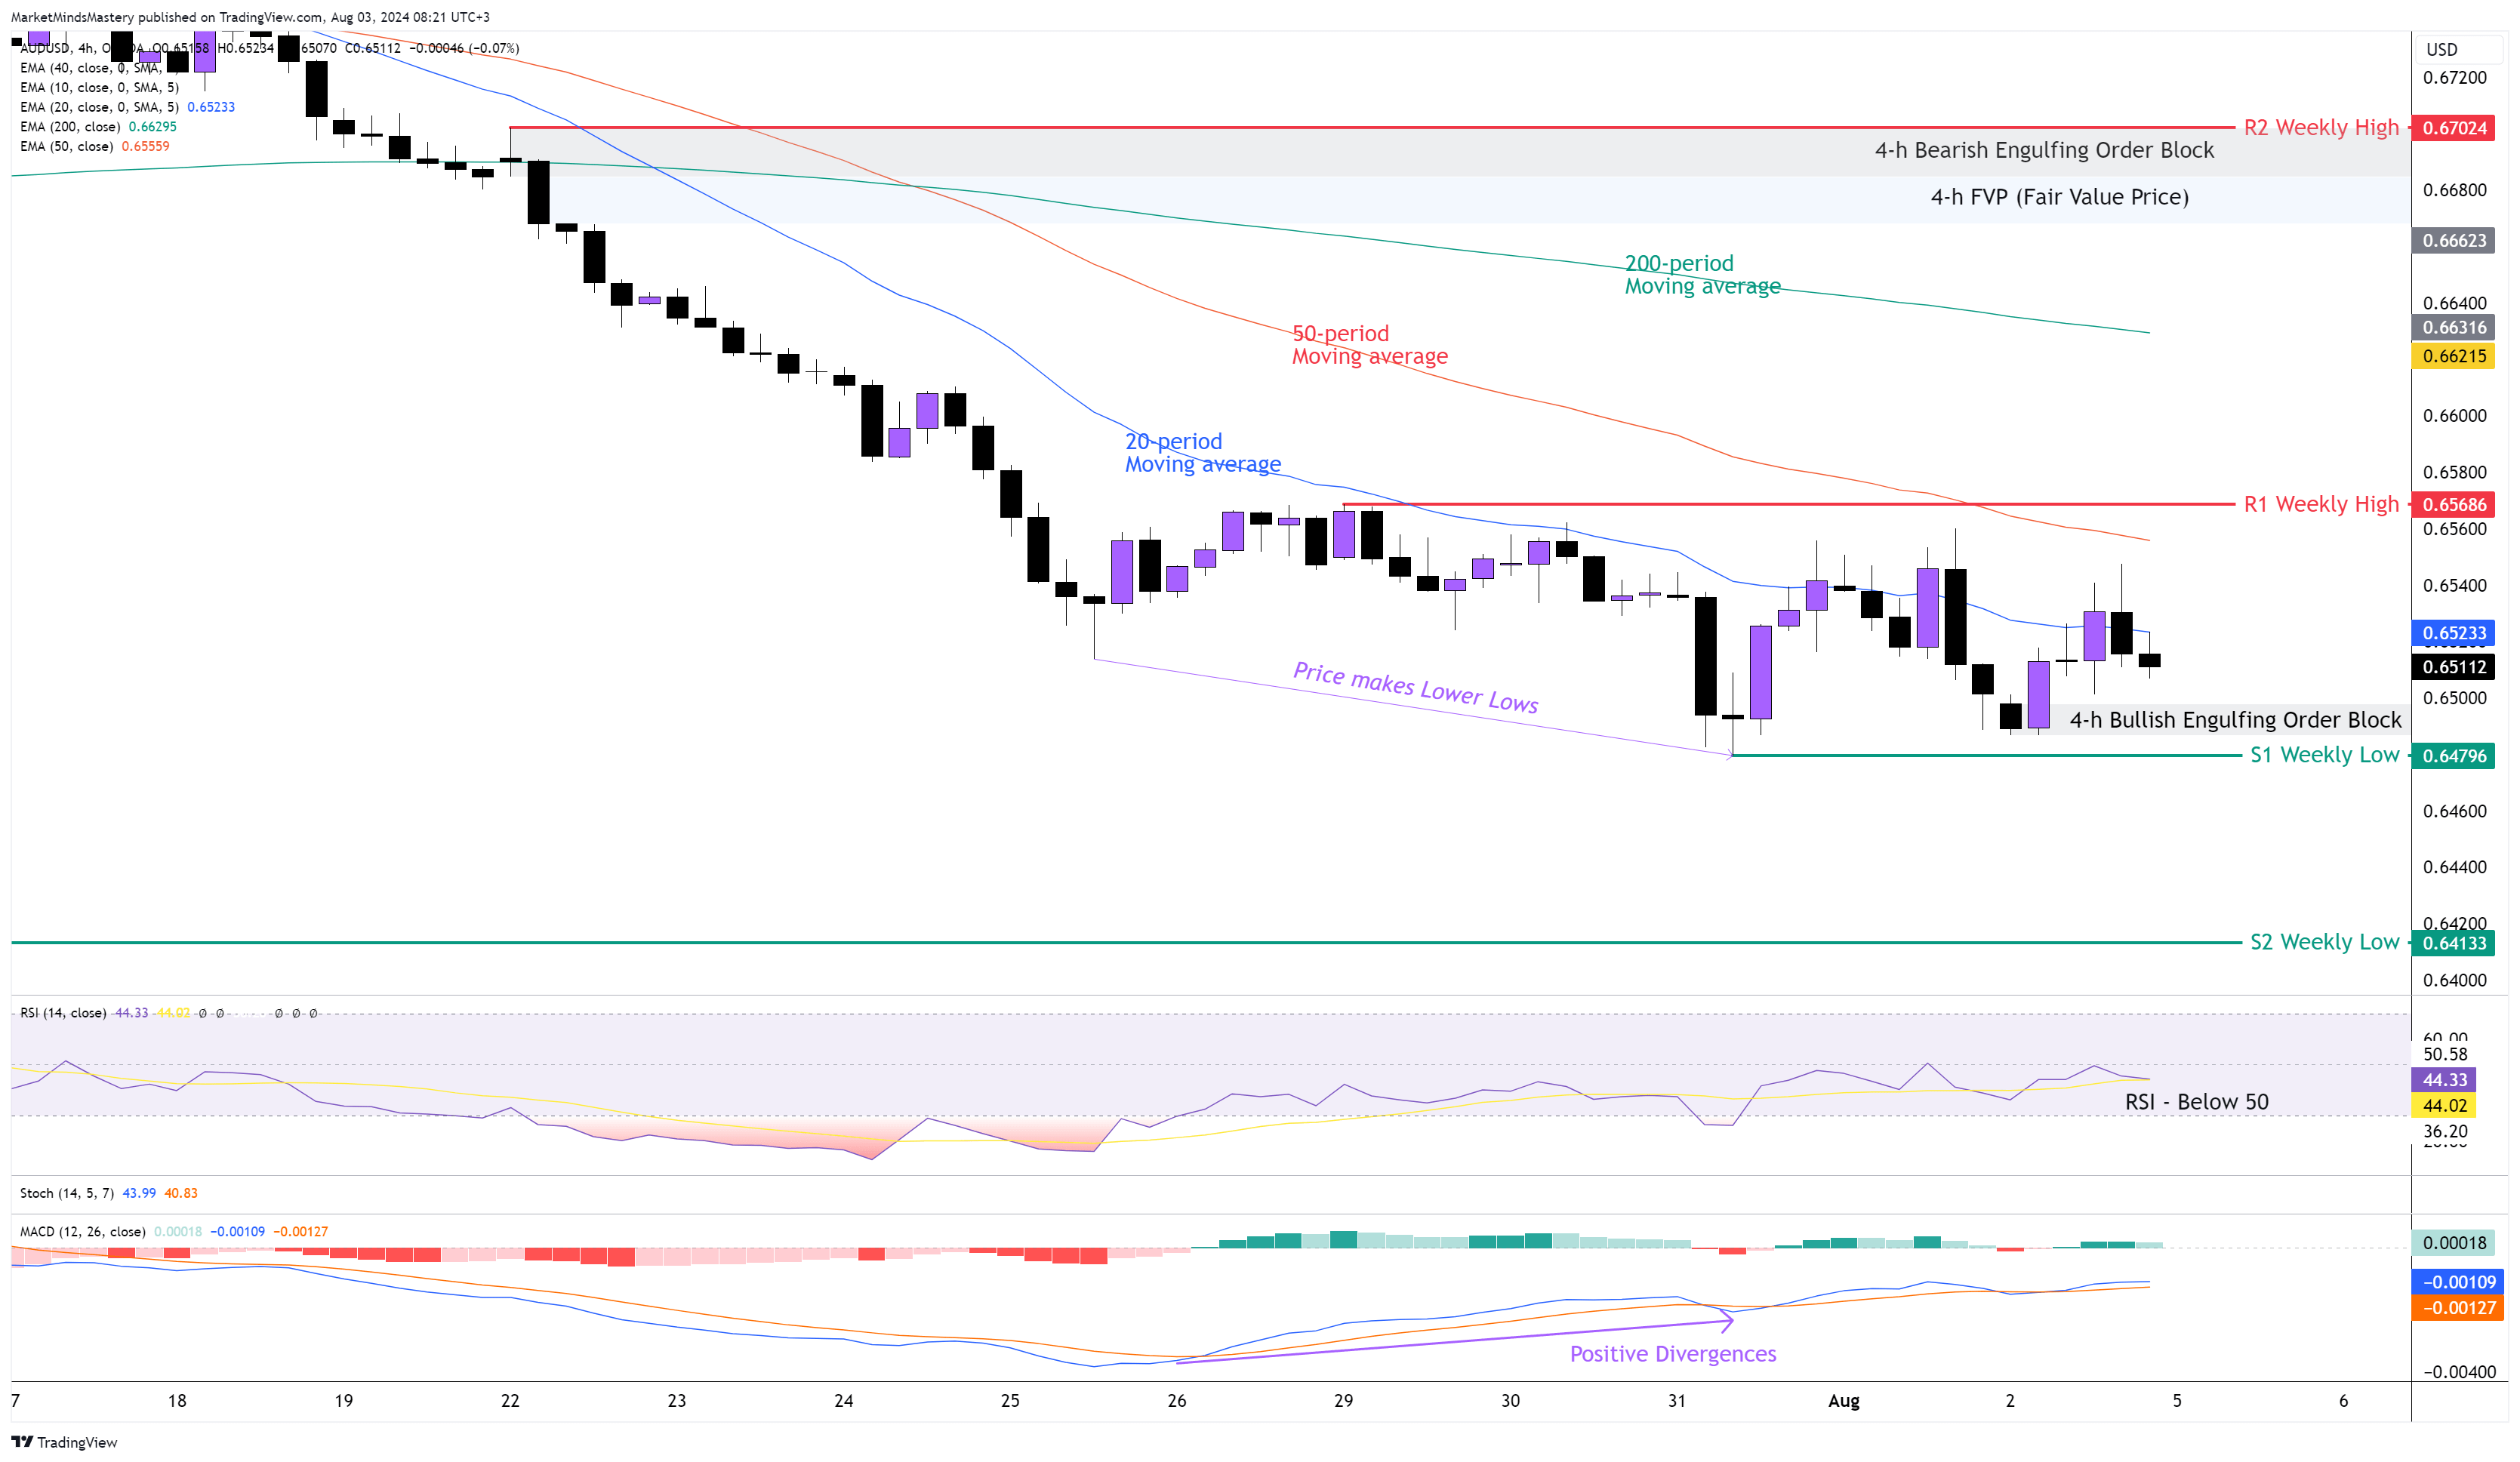
Following last week’s Market Outlook, the price of the AUDUSD kept declining primarily due to the negative CPI (Consumer Price Index) in Australia. Even though the US Dollar weakened on Friday because of the NFP outcome, the Aussie didn’t find a way to push the price higher. On the 4-hour chart, the price created a lower low formation, but under the disagreement of the MACD, which printed Positive Divergence, this has bullish implications. The price afterwards kept consolidation without any upward or downward breakout move, and this is a sign of potential market accumulation. The 20-period is below the 50-period moving average. The 200-period moving average is above both the 20 and the 50, and this shows a weak market. The RSI is below 50, and this is bearish. Starting Monday, if the price declines and moves downwards, the first support area, S1, will be the previous week’s low, approximately 0.64796. At this level, a Bullish Engulfing Order Block was left behind last Friday, which can provide additional support in a subsequent price decline. If the price penetrates the S1 and declines further, the next support area, S2, will be a weekly price low of around 0.64133.
On the other hand, if the price bounces off and moves upwards, the previous week’s high, R1, around 0.65686, will be the determining factor for trend reversal. If the price surpasses the R1 and keeps moving upwards, then the next resistance area will be approximately 1300 points (130 pips) away. This means that the downtrend will end, and the consolidation phase of the previous week will be the beginning of a new uptrend.
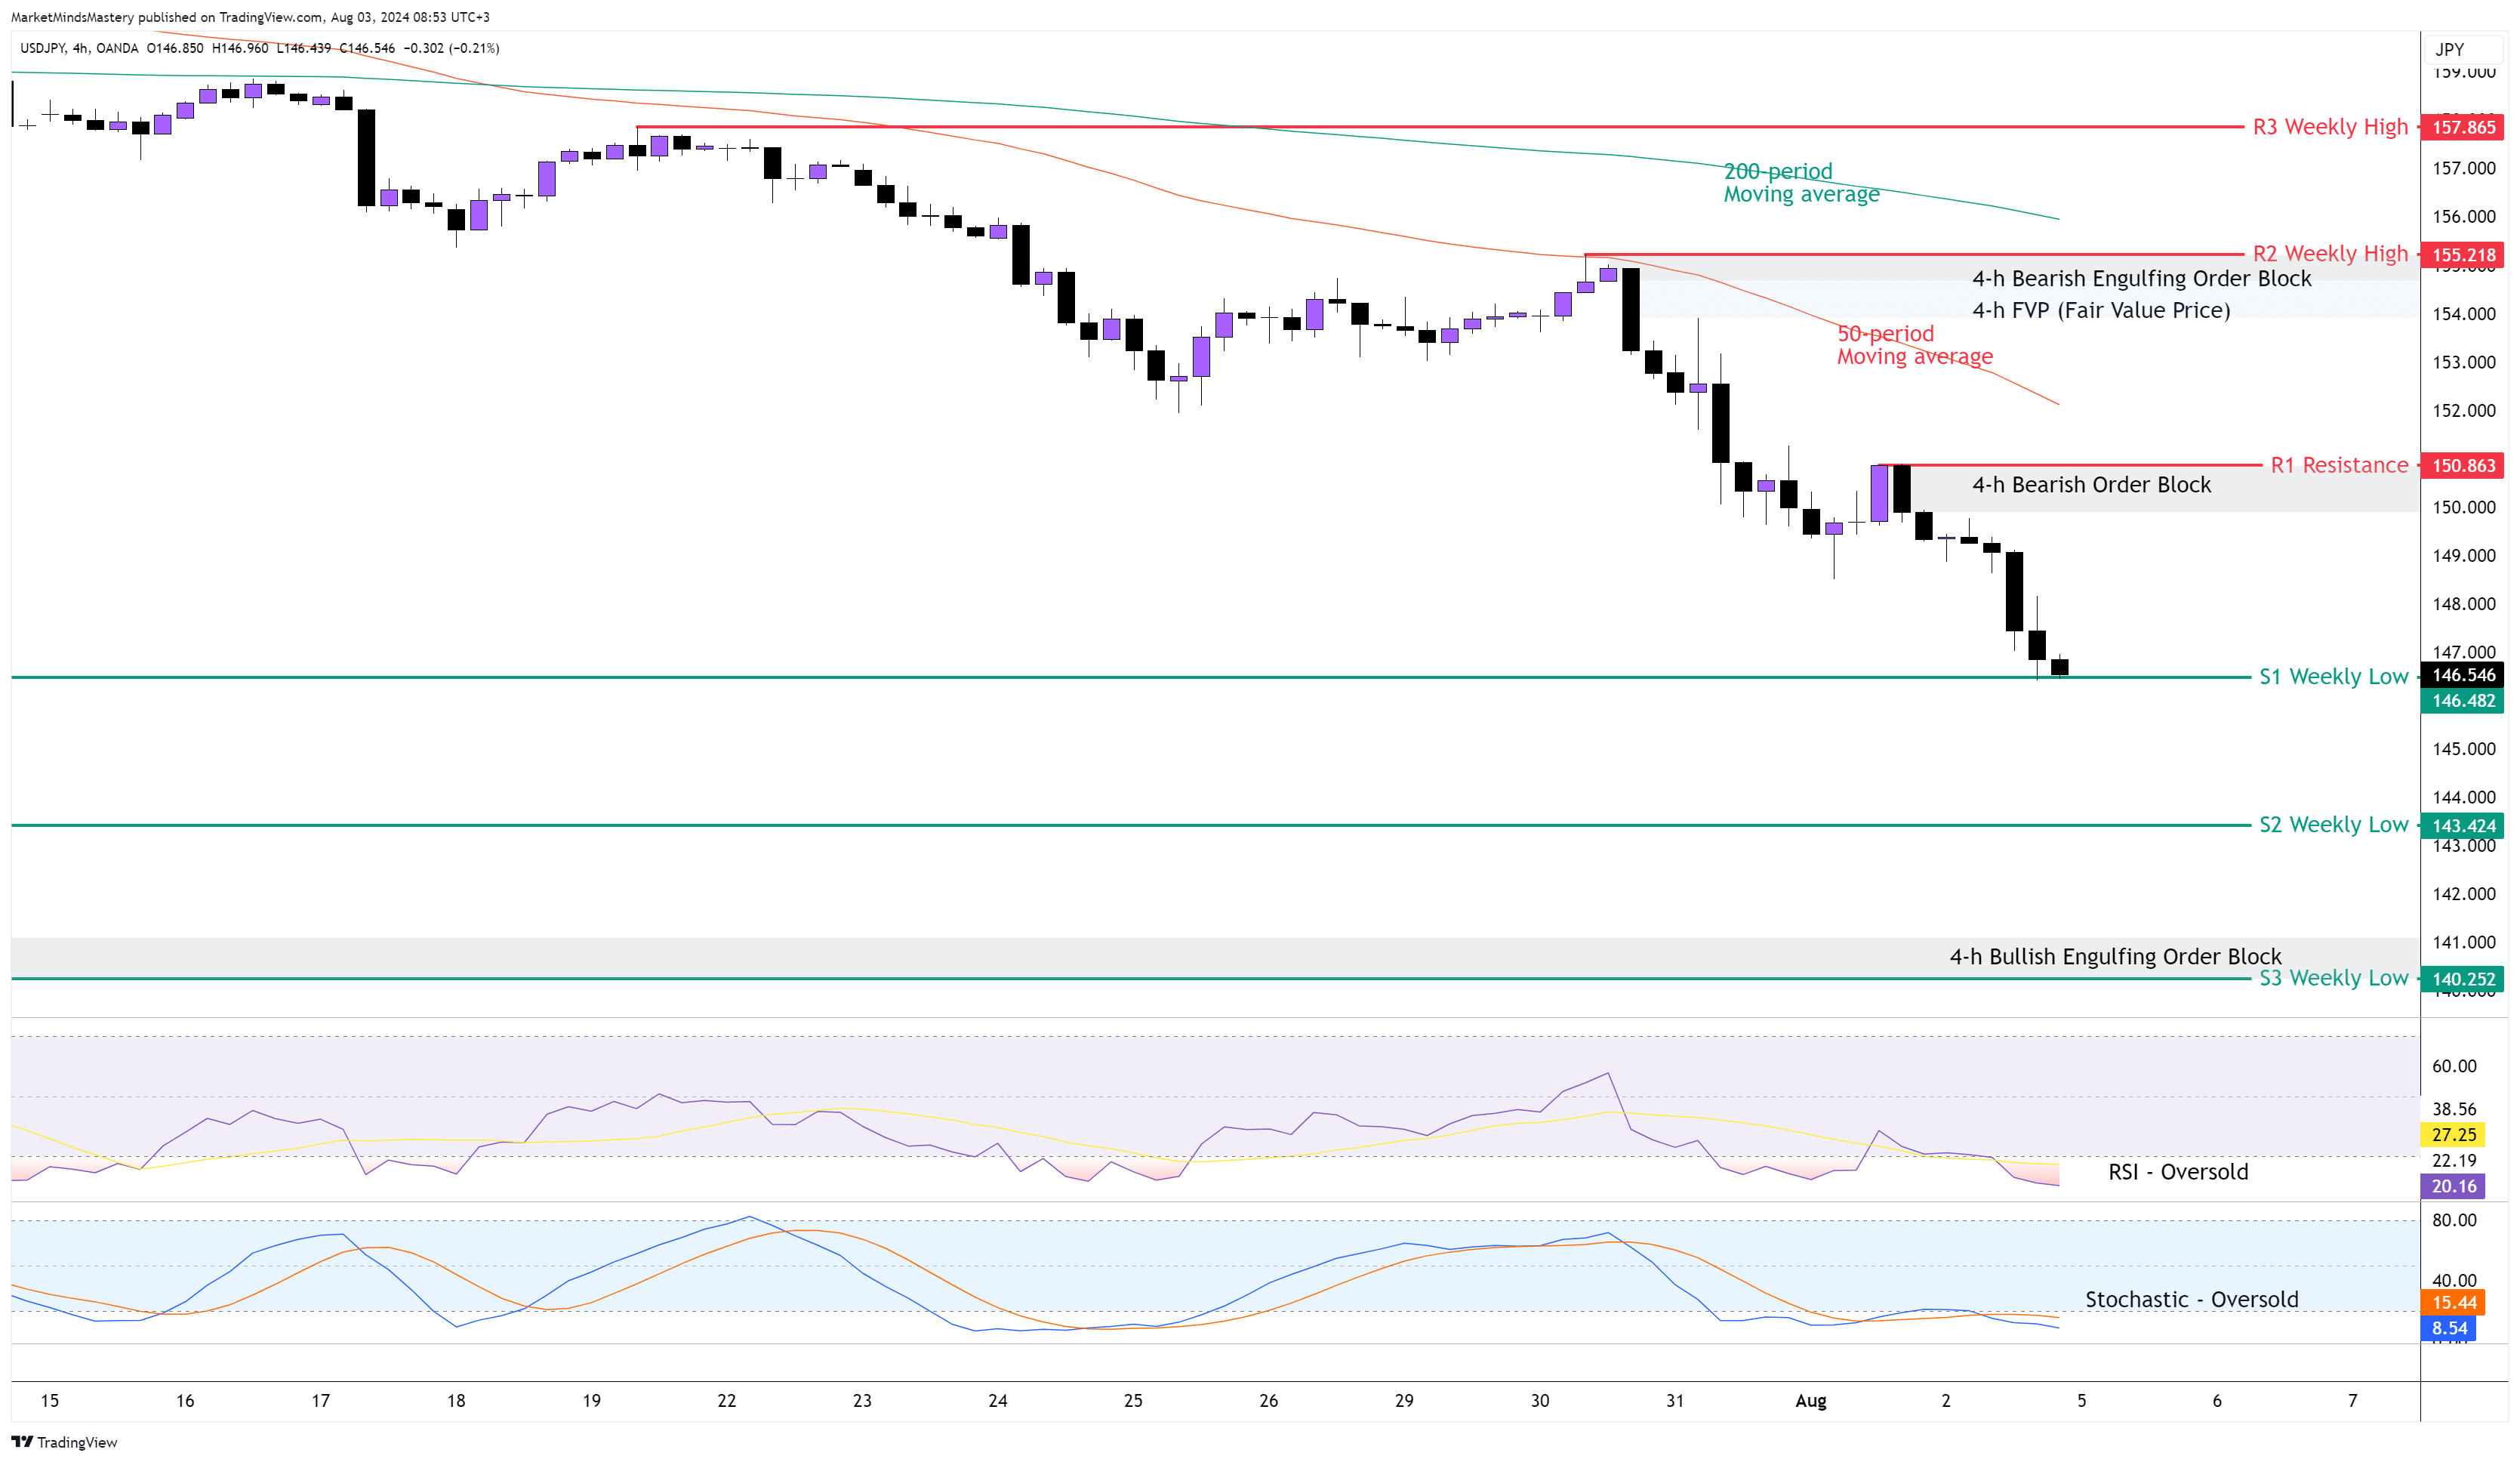
USD JPY 4H
Following the previous week’s price decline, the price entered into the FVP (Fair Value Price) we pointed to on the previous week’s Market Outlook and then declined under a strong downtrend. Observing the candlesticks on the 4-hour chart, we see the black candles( Bearish) being much more and the Bullish candles also having a longer price range. This is an indication of a strong downtrend. This massive price drop of almost 900 pips over the week occurred in the first place once the Bank of Japan decided to increase their interest rates at the same time when all the other major banks dropped or kept unchanged their deposit rates. The 50-period is below the 200-period moving average, and this is bearish. The RSI and the Stochastic Oscillators are both in an Oversold condition, indicating a strong price fall. The price keeps making lower highs and lower lows, and as per the swing analysis, the downtrend is still intact. Last Friday, the price didn’t create a reversal candle or a swing low. Therefore, it is not possible to measure a potential Fibonacci retracement at the moment. If the price keeps moving downwards, the first support area, S1, will be the previous week’s low, around 146.48. This is almost the same price level as the previous week’s candle’s closed price. If the price penetrates the S1 and declines further, the next support area, S2, will be another weekly low, around 143.42.
Conversely, if the price bounces off and moves upwards, the first resistance area, R1, will be around 150.86, with the presence of a Bearish Order Block that was created last week. If the price surpasses the resistance R1 and moves higher, the next resistance area, R2, will be the previous week’s high, around 155.21. The R2 price level coexists with the FVP and the Bearish engulfing Order Block, both significant factors that can provide additional market resistance.
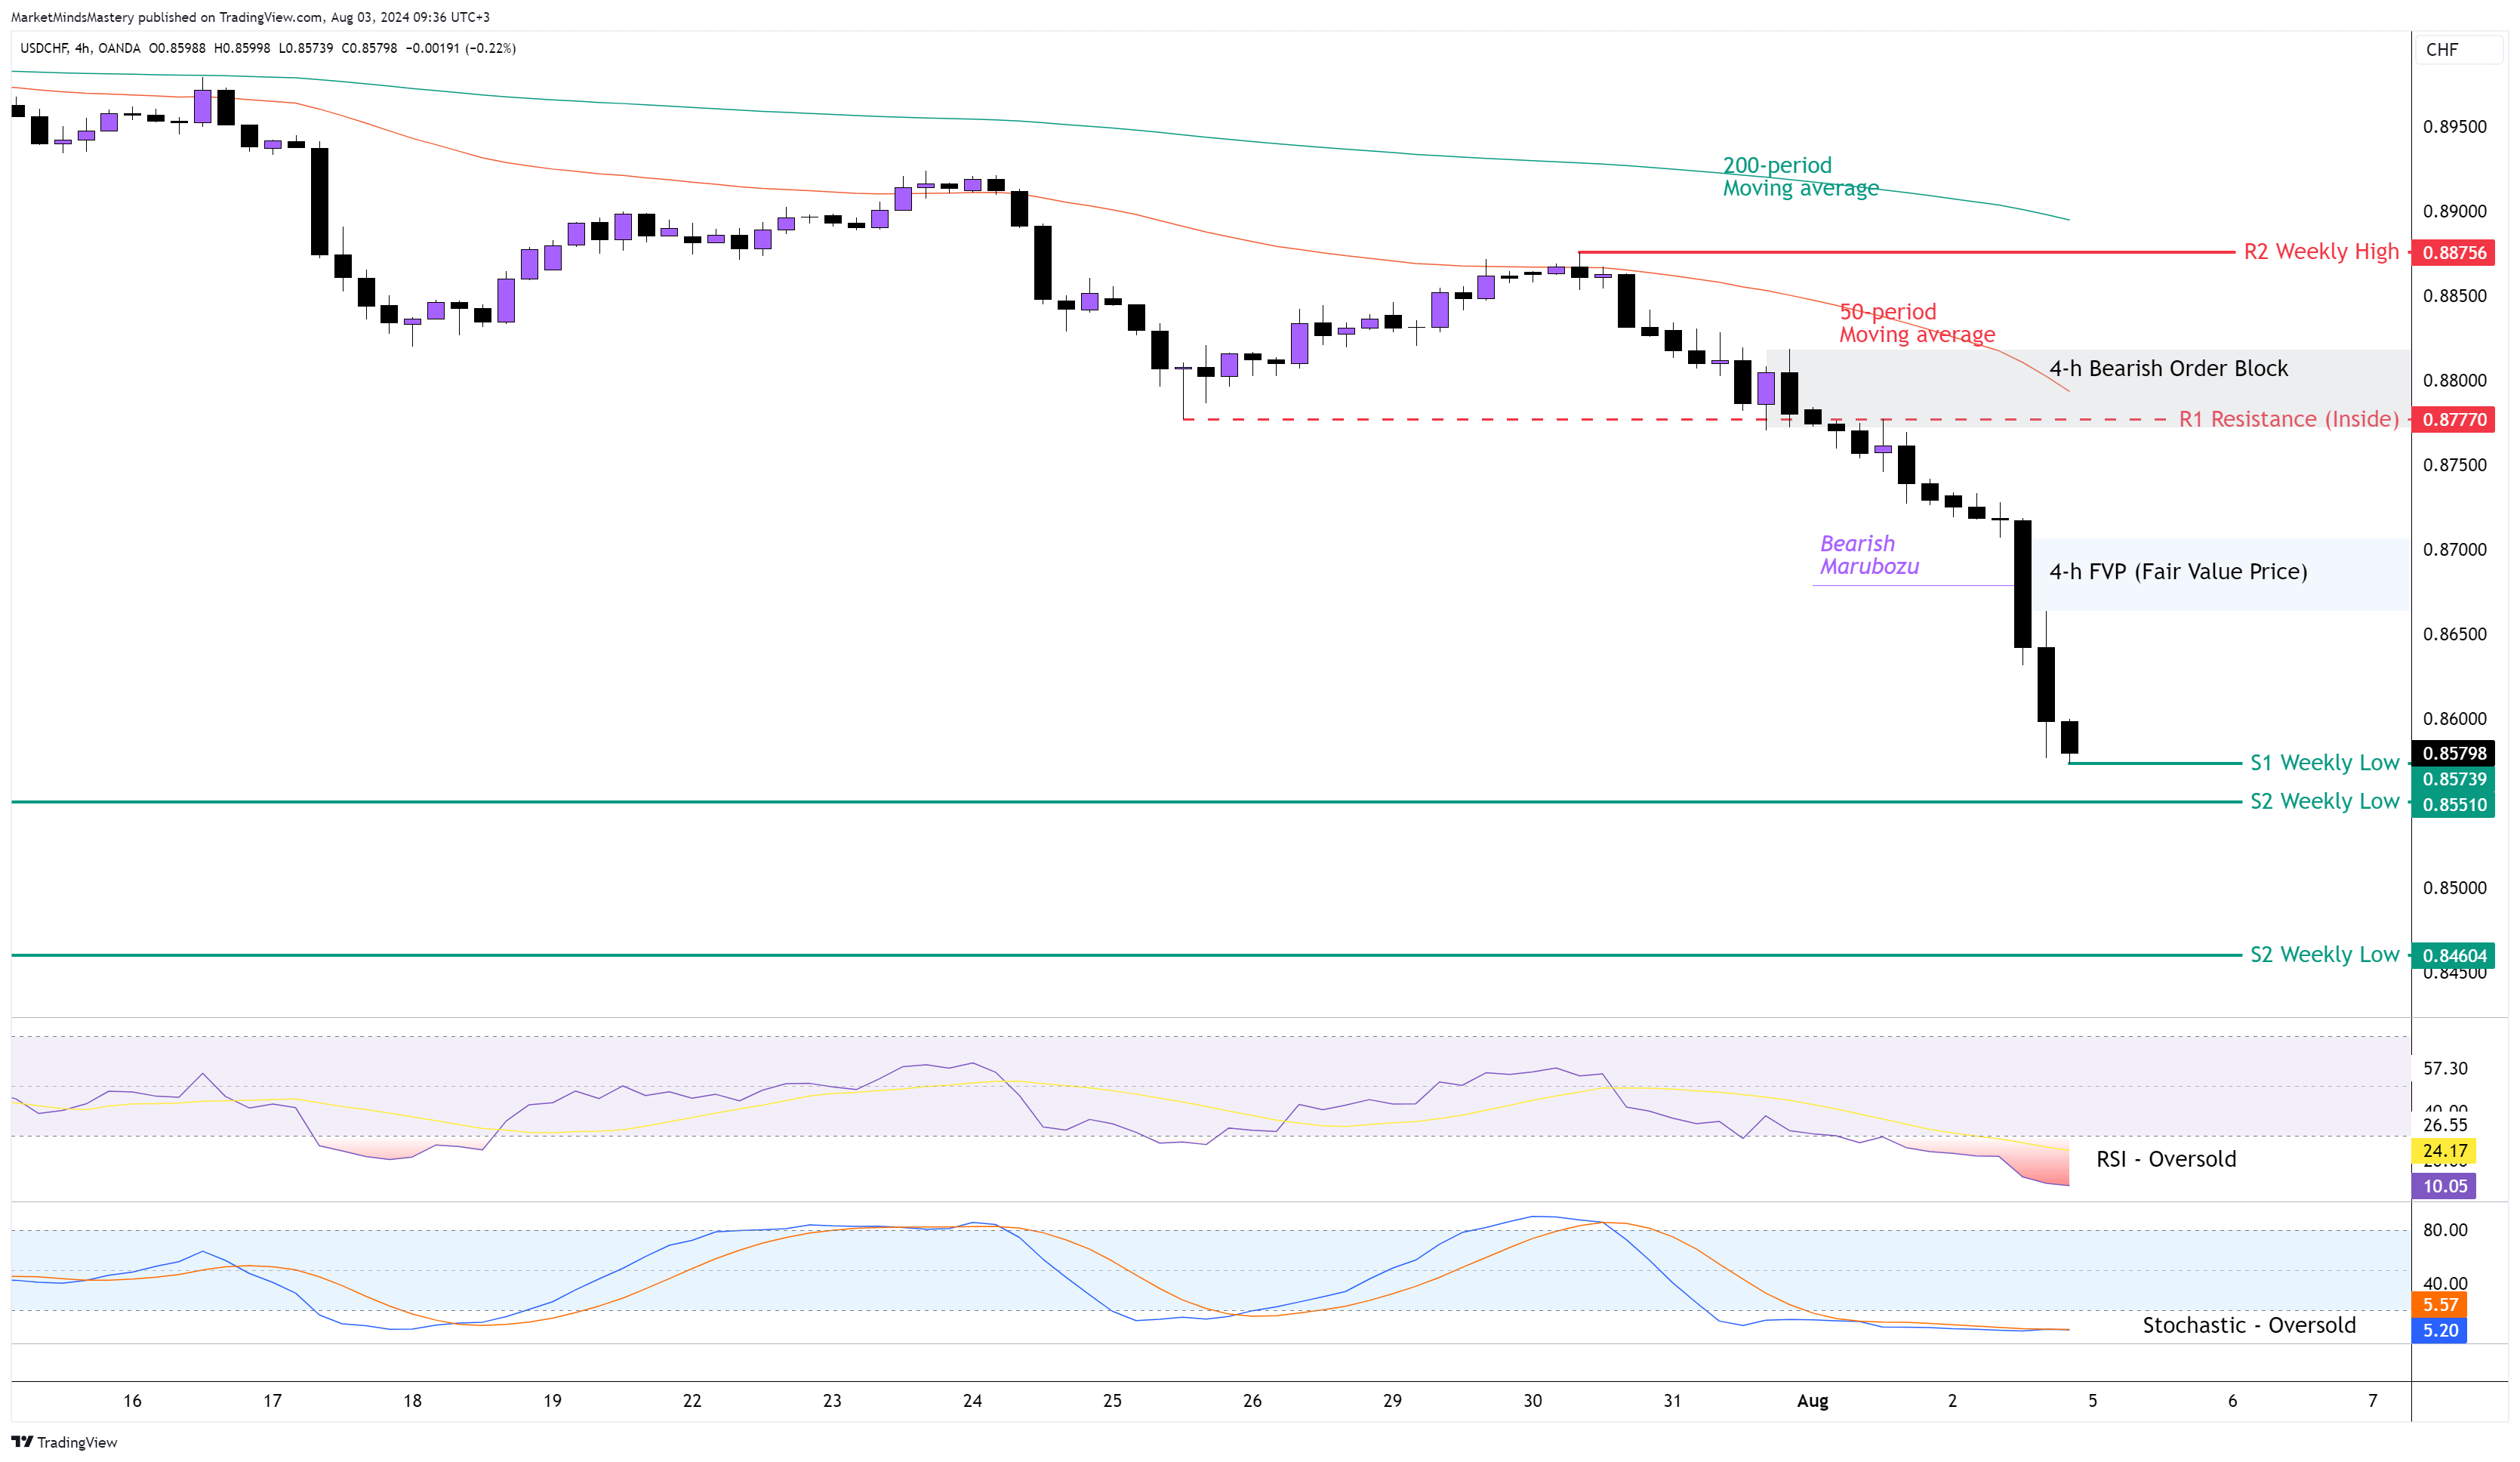
USD CHF 4H
The Swissy’s appreciation last week set the USDCHF to drop significantly on Friday after the NFP was reported. The currency pair was in a well-defined downtrend, and the negative news in the US was the determining factor in the price decline. As per the swing analysis, the price makes lower highs and lower lows, and the downtrend is still valid. The 50-period is below the 200-period moving average, and the distance between them widens, and the price falls under heavy trading volume. The Bearish Marubozu candle was created last Friday at the NFP announcement, caused the creation of an FVP(Fair Value Price). The RSI and the Stochastic Oscillators are both in an Oversold Condition, and this has bearish implications.
Starting Monday, if the price keeps declining, the first support area, S1, will be the previous week’s low, approximately 0.85798. Due to the strong price decline last Friday, the weekly candle close and low points are around the same price. In case the price penetrates the S1 and declines further, the next support area, S2 and S3, are at 0.85510 and 0.84604, respectively.
On the other hand, if the price starts a corrective phase and moves upwards, the first resistance area, R1, will be Inside resistance around 0.87770. This price level coexists with the 50-period moving average, which can provide dynamic resistance among with the Bearish Order Block shown on the chart. If the price surpasses the R1 resistance and moves upwards, the next resistance area, R2, will be the previous week’s high, around 0.88756.
GBP JPY 4H
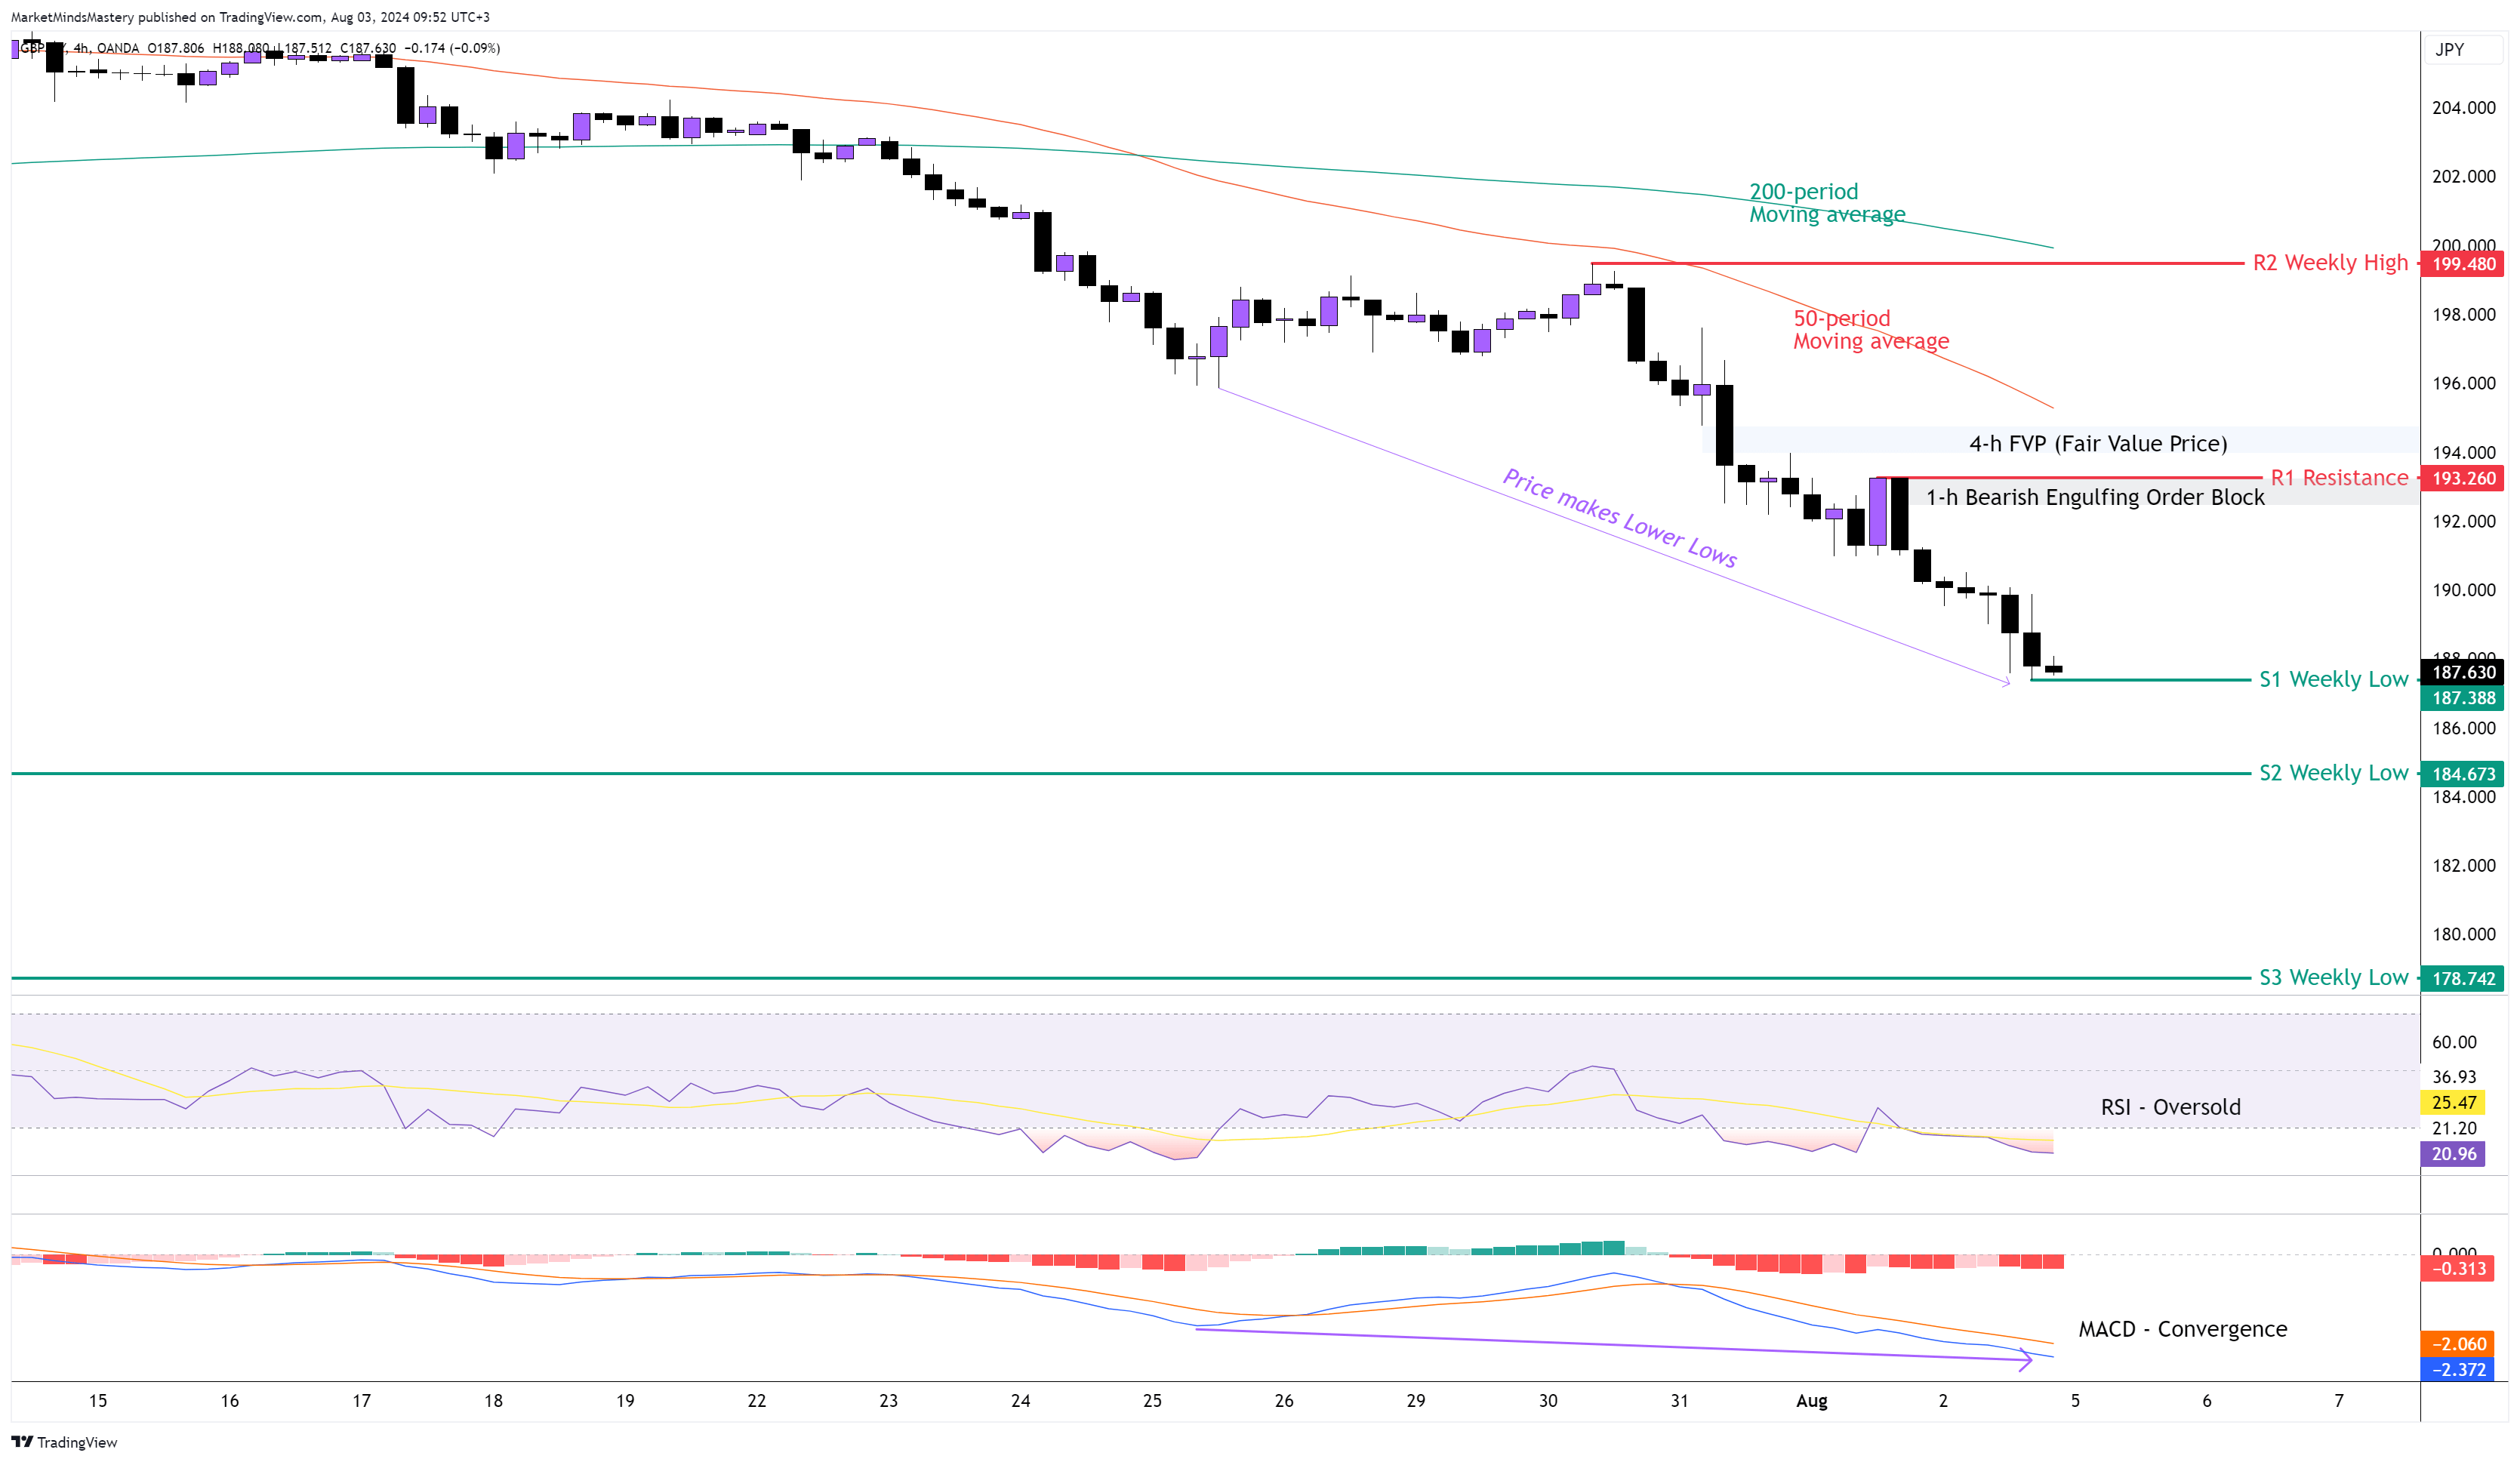
This currency pair received the attention of most of the market participants last week because the macroeconomics analysis and the technical analysis both confirmed each other. The Bank of Japan increased its interest rates at the same time that the Bank of England dropped its rates. This automatically made the Japanese Yen a prominent currency and caused the GBPJPY to drop approximately 1300 pips within a single week. The price sell-off was so strong last week, causing the market to move with only one shallow retracement occurring. The 50-period moving average is below the 200-period, and the distance between them widens, indicating the strength of the price's downward move. The RSI Oscillator has been in an Oversold condition since last Tuesday. The MACD is trading below its zero line, and it created a lower low formation, which confirms the existing market’s downtrend.
Starting Monday, if the price continues its downward move, the first support area, S1, will be the previous week’s low at 187.388. The previous week’s low and the weekly’s candle close were at the same price level. If the price penetrates the S1 and moves downwards, the next support area, S2, will be around 184.673, which is another weekly low price. In case the price bounces off and moves upwards, the first resistance area, R1, will be around 193.26. At the same price level, a Bearish Engulfing Order Block was created on the 1-hour chart last Thursday. If the price penetrates the R1 and keeps moving upwards, there is an unmitigated FVP around the 50-period moving average. The next static Resistance level, R2, is the previous week’s high, around 199.480.
GOLD 4H
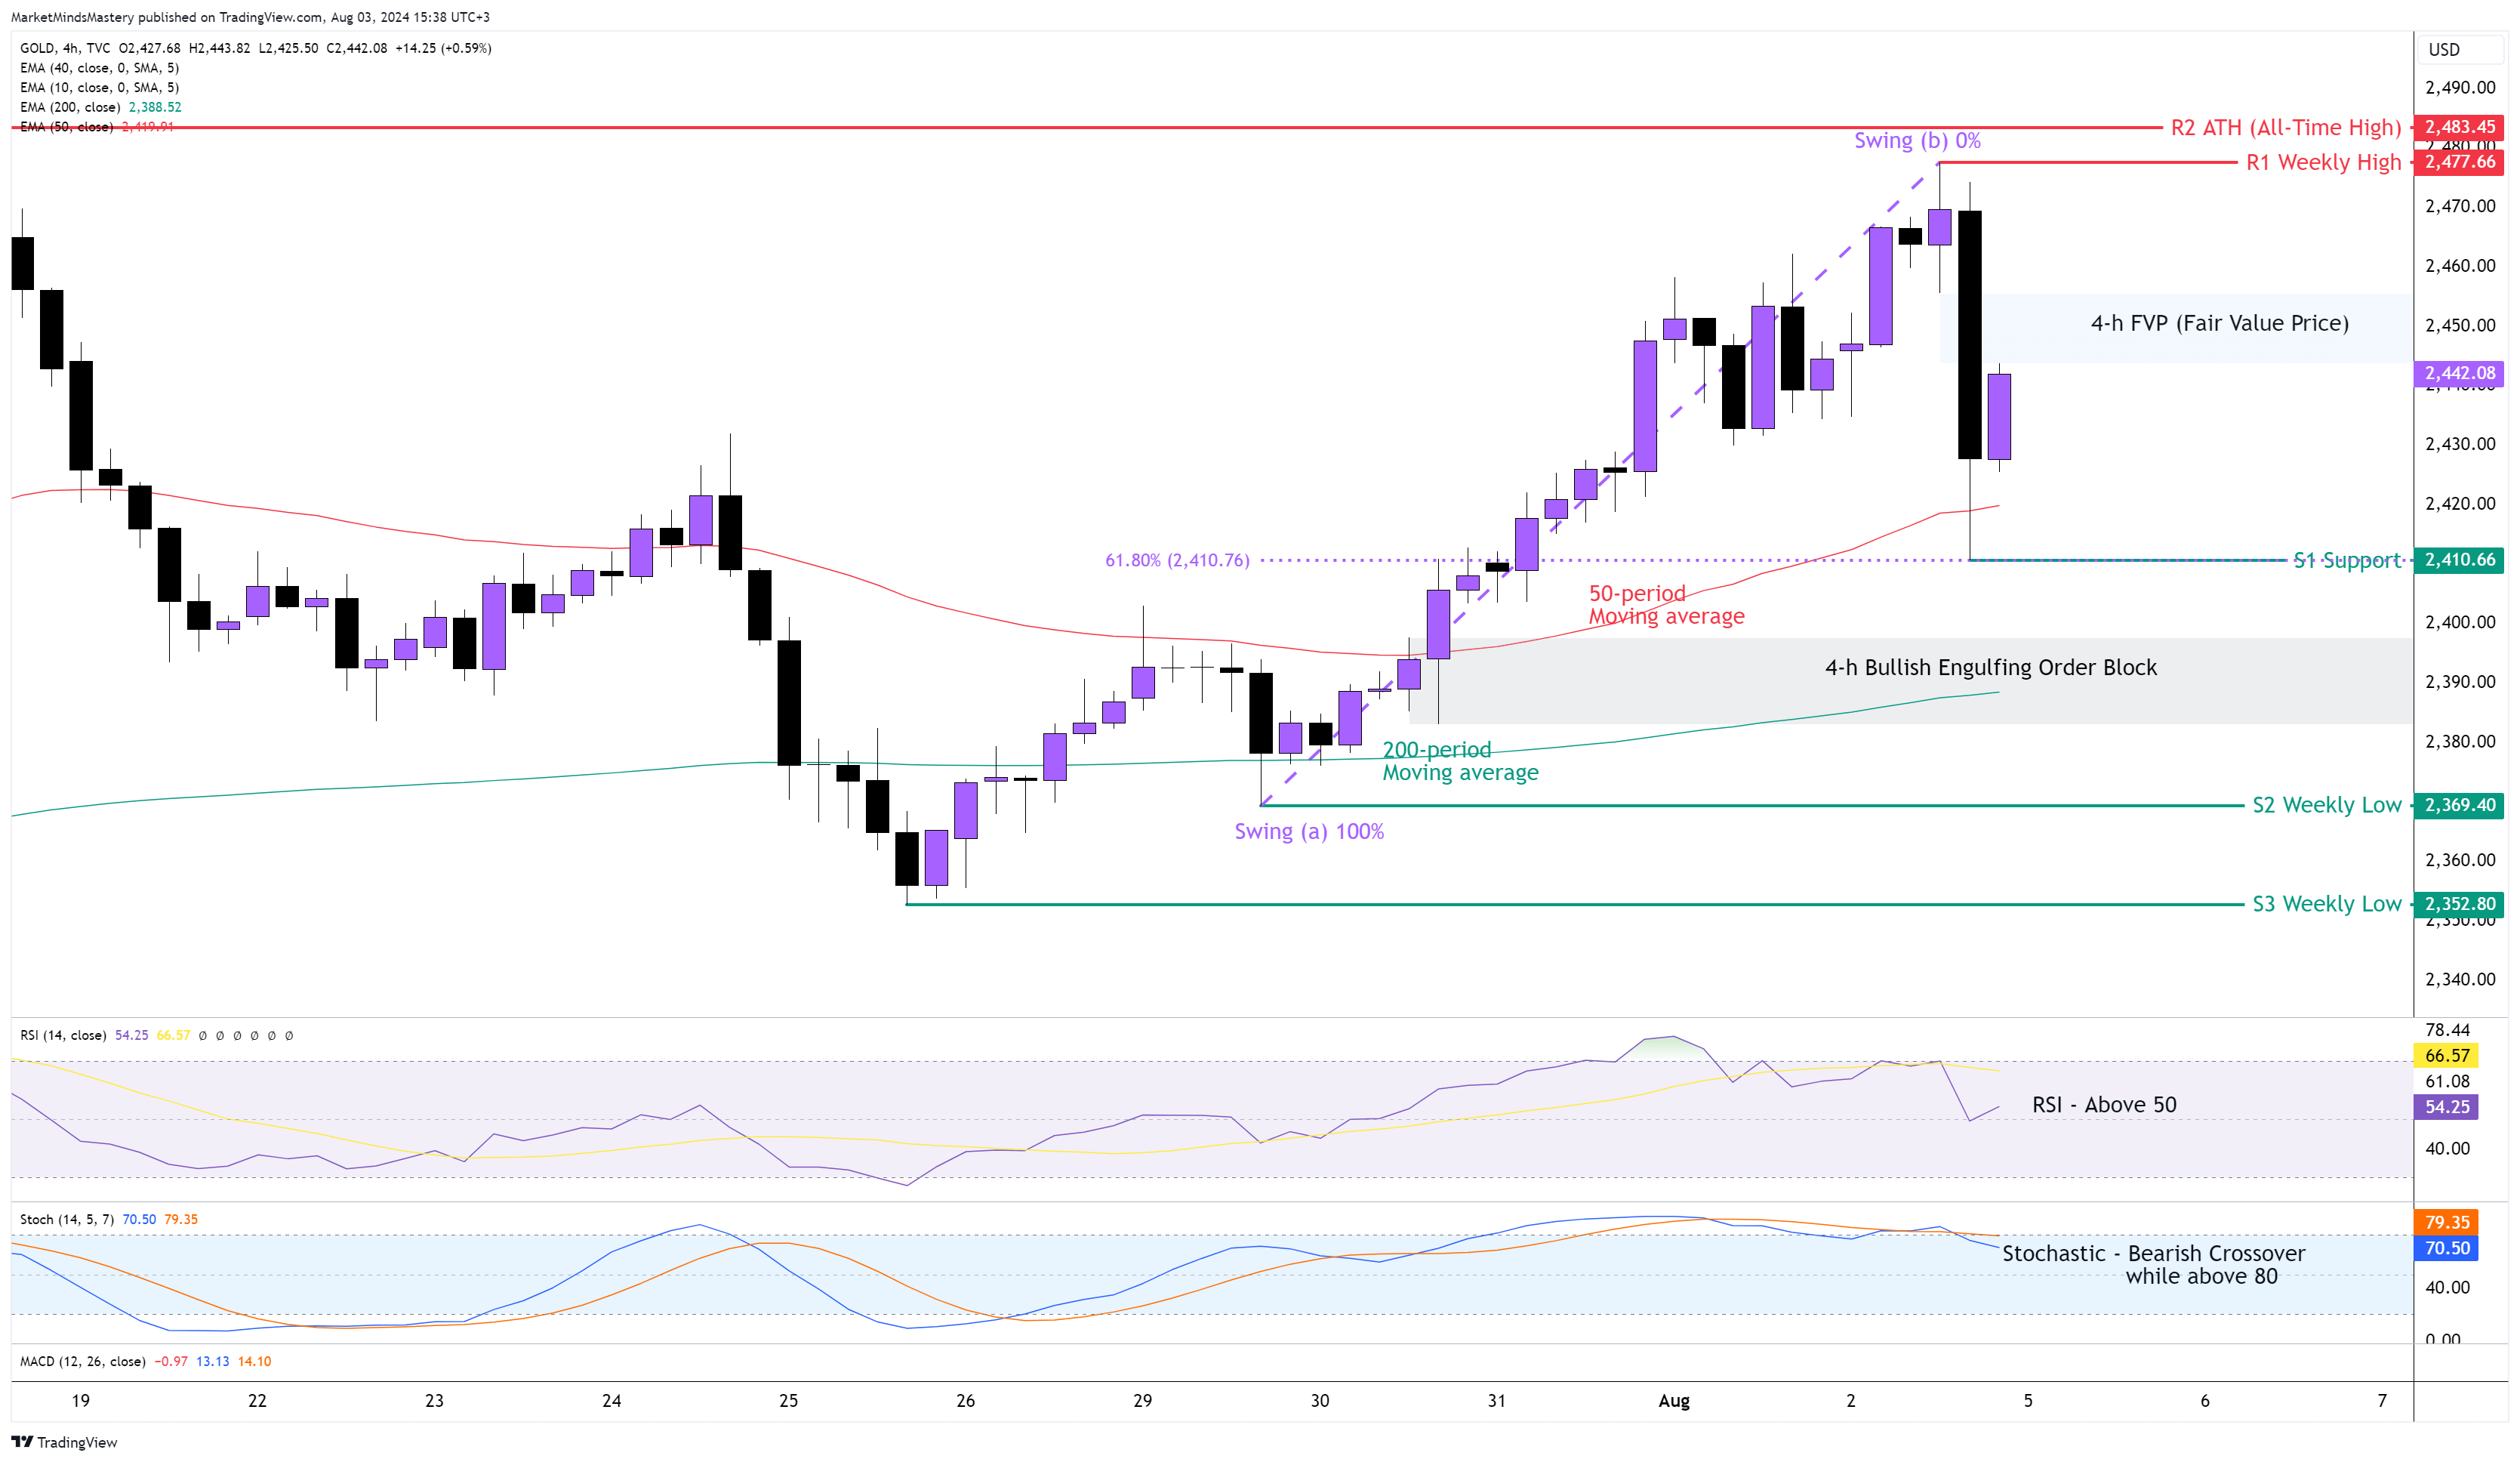
Following the Weekly’s primary uptrend, the price of Gold ended the intermediate downtrend on the 4-hour chart last Wednesday, and since then, it has aligned with the weekly’s uptrend. The 50-period moving average is above the 200-period, and this has bullish implications. Because the RSI is above 50, the market is considered bullish. The Stochastic Oscillator, on the other hand, created a bearish crossover while it was in an Overbought condition, as the %K Line (Blue) crossed below the %K Line (Orange), and this has bearish implications. The reason for this is that the price entered into a corrective phase on the 4-hour chart, and as the %K Line measures the last 5 periods, it reacted fast following the price. As per the swing analysis, the price now makes higher highs and higher lows, a market structure that indicates an uptrend. Last Friday, the price bounced off the 50-period moving average. If the price continues to move upwards, the first resistance area, R1, will be the previous week’s high, around $2477. Around the area of $2450, the market created an FVP (Fair Value Price). If the price surpasses the R1 level and increases, the next resistance area, R2, is the $2483, which is the ATH (All-Time High).
On the other hand, if the price moves downwards, the first support area will be $2410. This price level is at the same level as the Fibonacci Golden Ratio of 61.8% retracement, as shown in the chart above. If the price won't bounce off that price level and surpass it, the decline can continue until the previous week’s low, S2, at $2369.
Between the 61.8% and the S2 support level, there is a Bullish Engulfing Order Block around $2400.
USOIL 4H
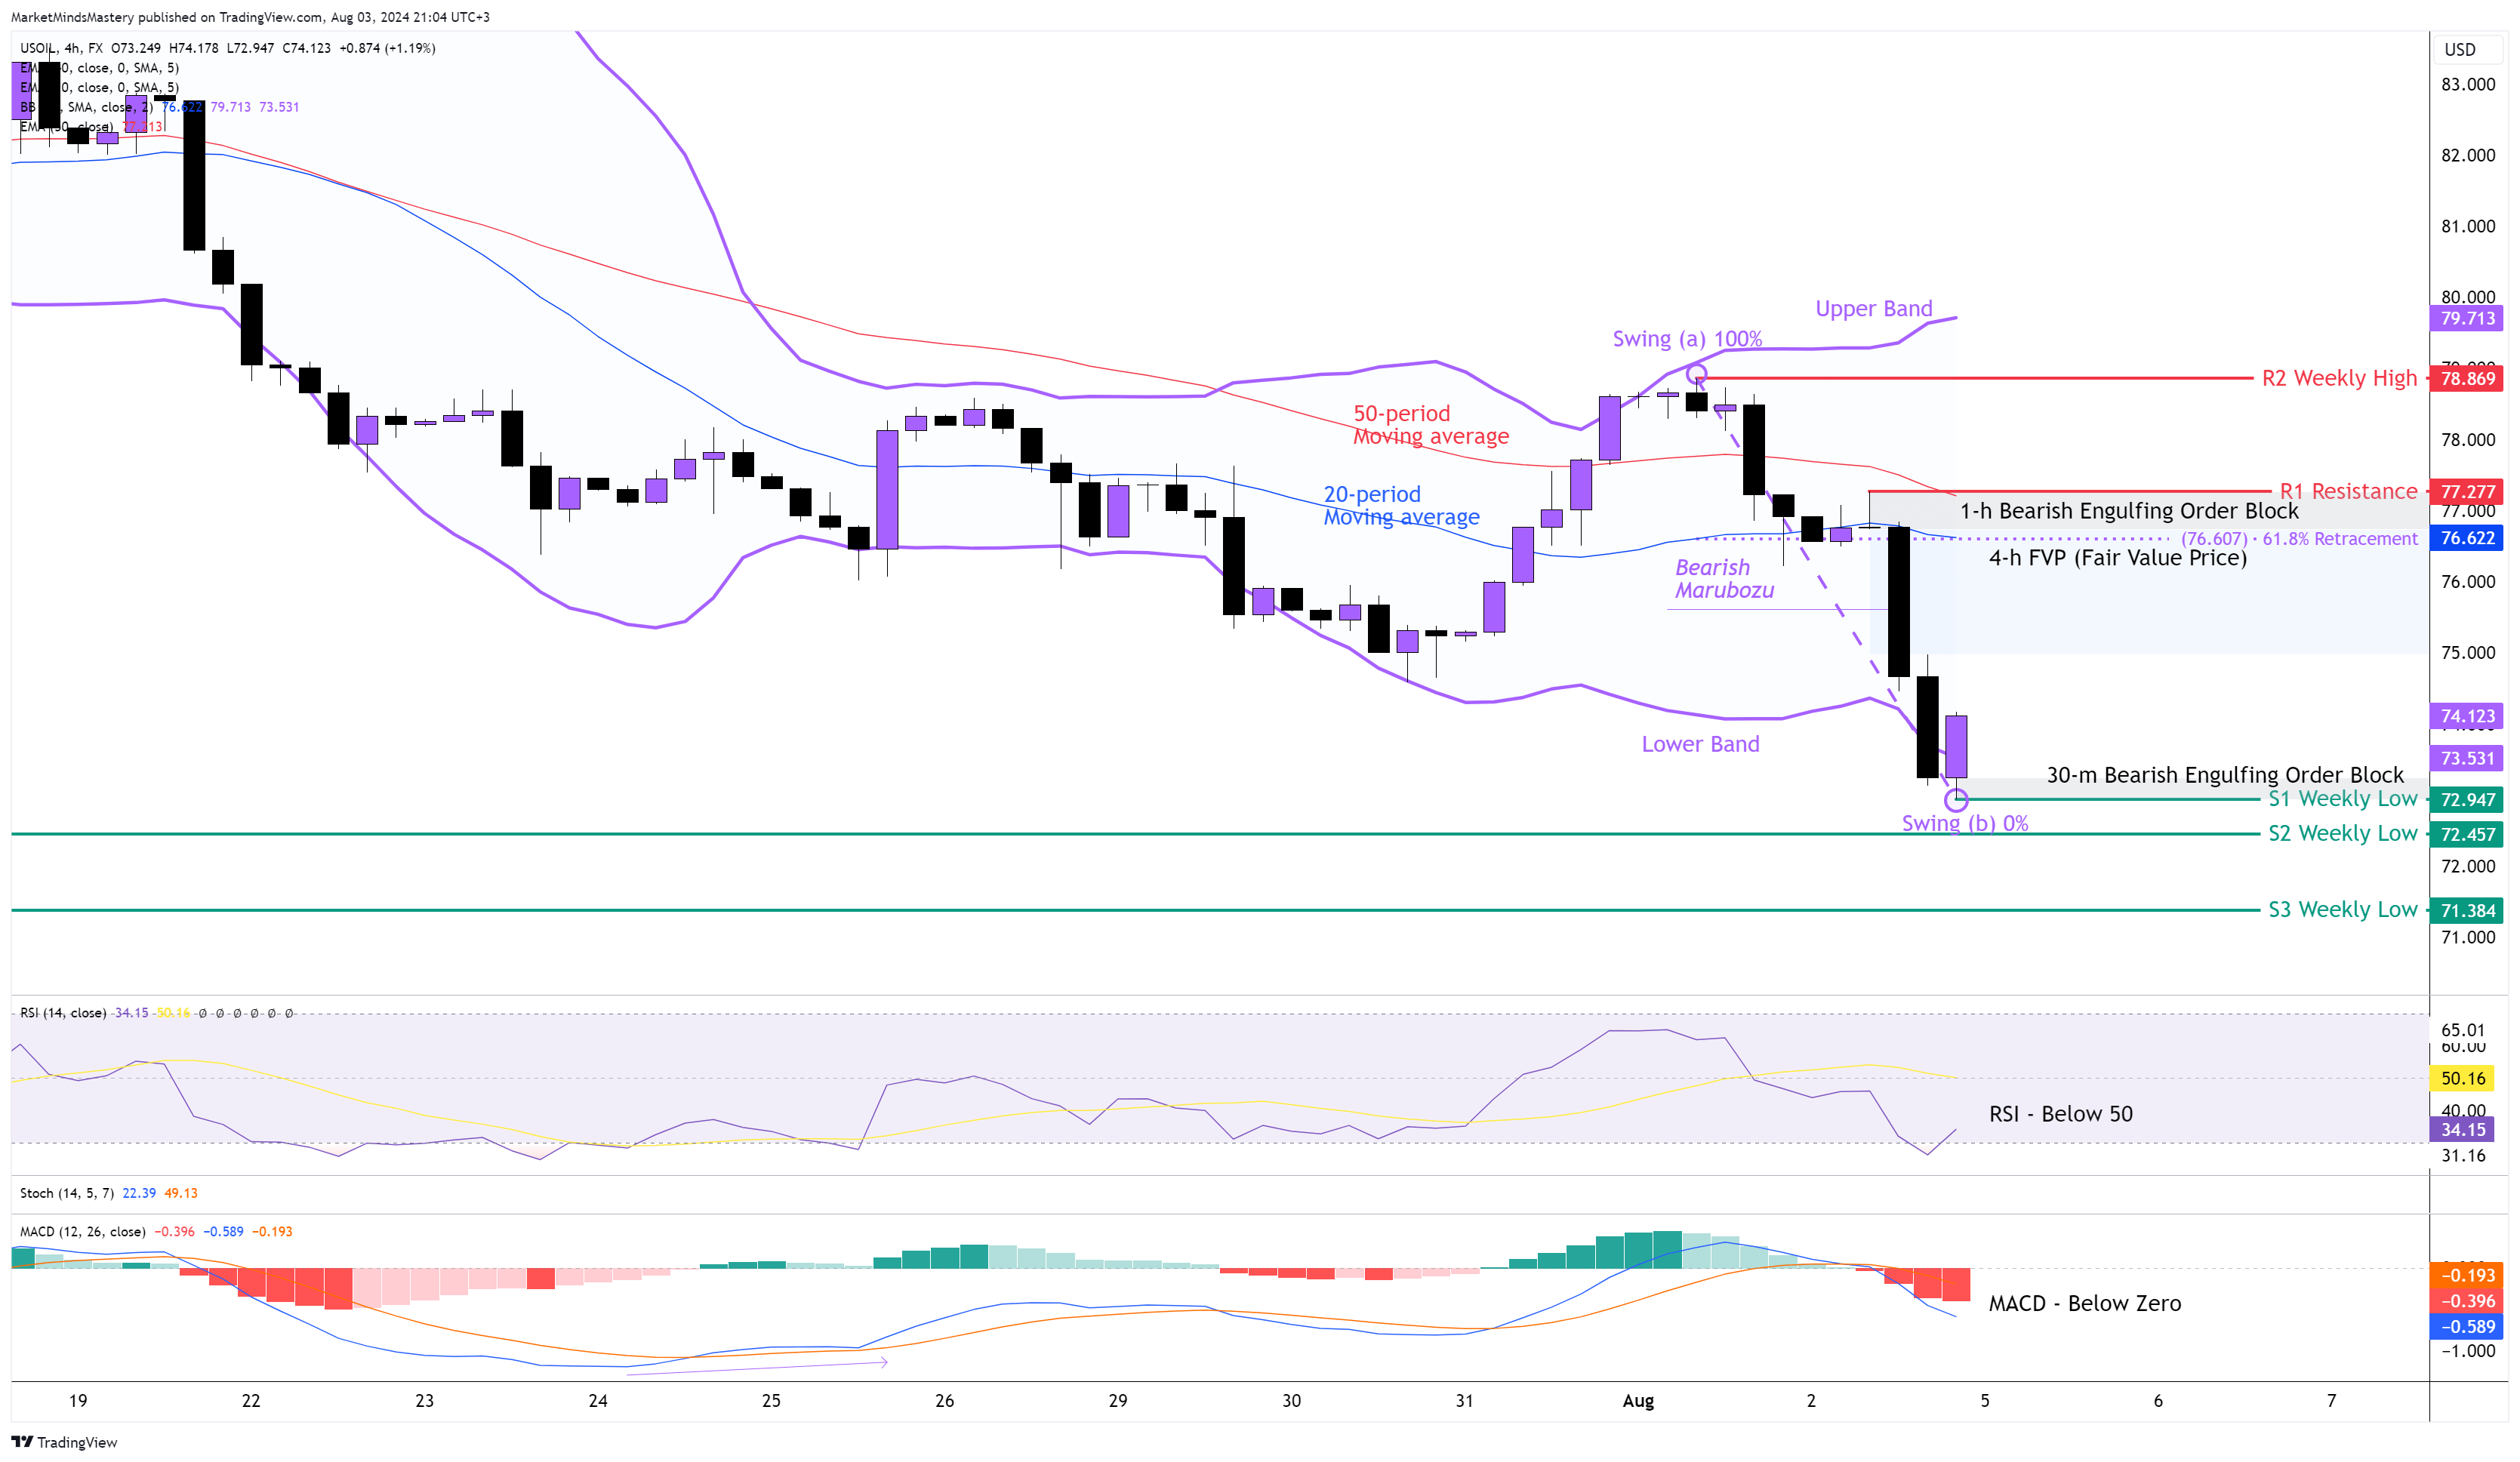
Following the previous week’s market outlook, the price created a new lower-low formation. On the weekly chart, the candle closed as a Long, Bearish candle. On the 4-hour chart, the price created a long Bearish Marubozu candle, which caused the appearance of an FVP (Fair Value Price). Looking at the Bollinger Bands, the price closed below the Lower Band while, at the same time, the Upper Band line pointed upwards. This happens once the breakout is considered a strong breakout. The middle line of the Bollinger Band is the 20-period moving average, which is below the 50-period moving average, and this is considered bearish.
Additionally, the RSI OScillator is below 50, and this is also bearish. The MACD crossed below its zero line, indicating the price decline. The MACD’s Histogram is below zero, and this confirms the price decline. If the price continues its downward move, the first support area, S1, will be the previous week’s low, around $72.94. If the price penetrates the S1 and keeps lowering, the next support area, S2, will be $72.45. A further downward move finds the S3 support, around $71.38. In case the price moves upwards, the first resistance R1, will be above the 1-hour Bearish Engulfing Order Block around $77.27. The $77 area is considered a significant price level because it consists of the R1 resistance, the FVP and the 61.8% Fibonacci retracement level from swing (a) to swing (b), as shown on the chart. If the price penetrates R1 and keeps moving upwards, the next resistance area, R2, will be the previous week’s high at around $78.86.
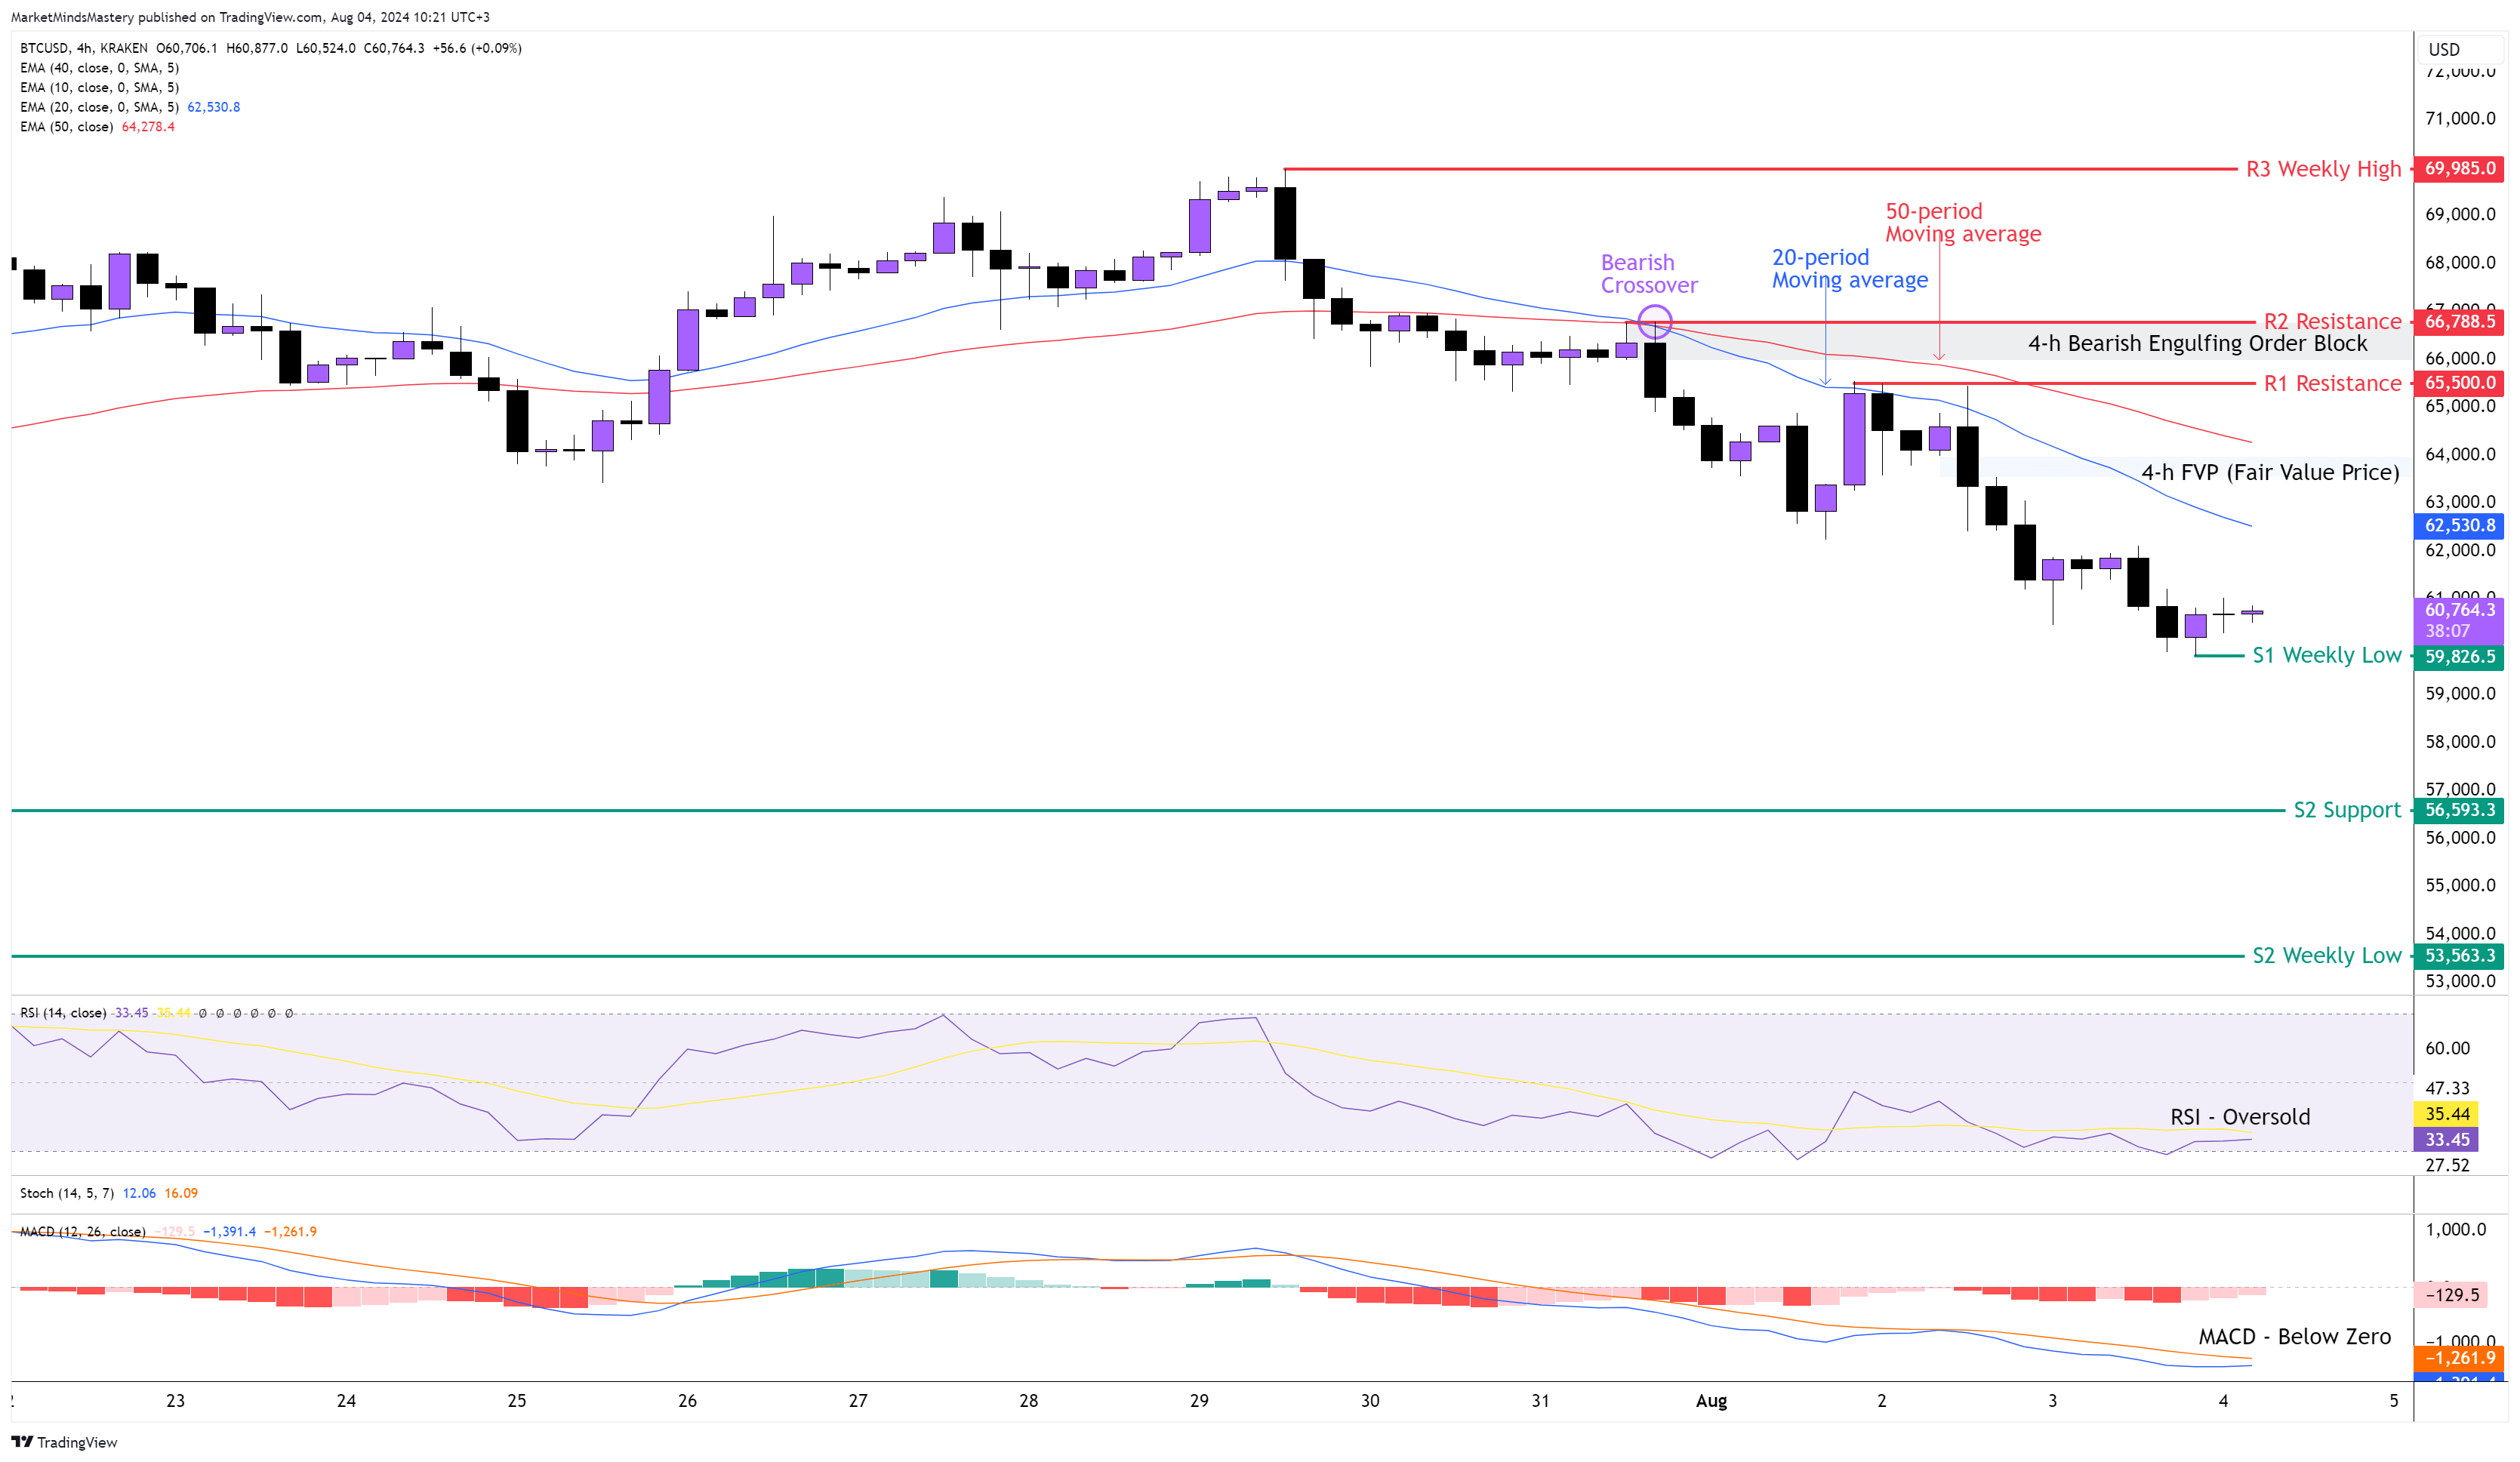
BTC USD 4H
Following the Bullish Hammer on Bitcoin’s weekly chart, the price created a Bearish Engulfing reversal candlestick pattern. As we explained in the previous week’s Market Outlook, the price was expected to decline due to this candlestick pattern followed by an uptrend. On the 4-hour chart, the price created defined lower highs and lows lows, and it established a downtrend. The 20-period crossed below the 50-period moving average, which is called a bearish crossover. The RSI Oscillator is in Oversold condition, and this suggests that the price declines. The MACD is below its zero line, and its Histogram is below that, indicating a strong downward move in the price.
Starting Monday, if the price continues its downward move, the first support area, S1, will be the previous week’s low, around $59826. If the price penetrates the S1 and declines more, the next support area, S2, will be approximately $56593.
On the other hand, if the price moves upward, it means that it enters a corrective phase. Then, the first resistance area, R1, will be around $65500. This price level coexists with the 50-period moving average and can be considered a dynamic price resistance. If the price penetrates the R1 and increases more, the next resistance, R2, will be around $66788. At this price level, there is a Bearish Engulfing Order Block, which can be considered an additional resistance for the price.
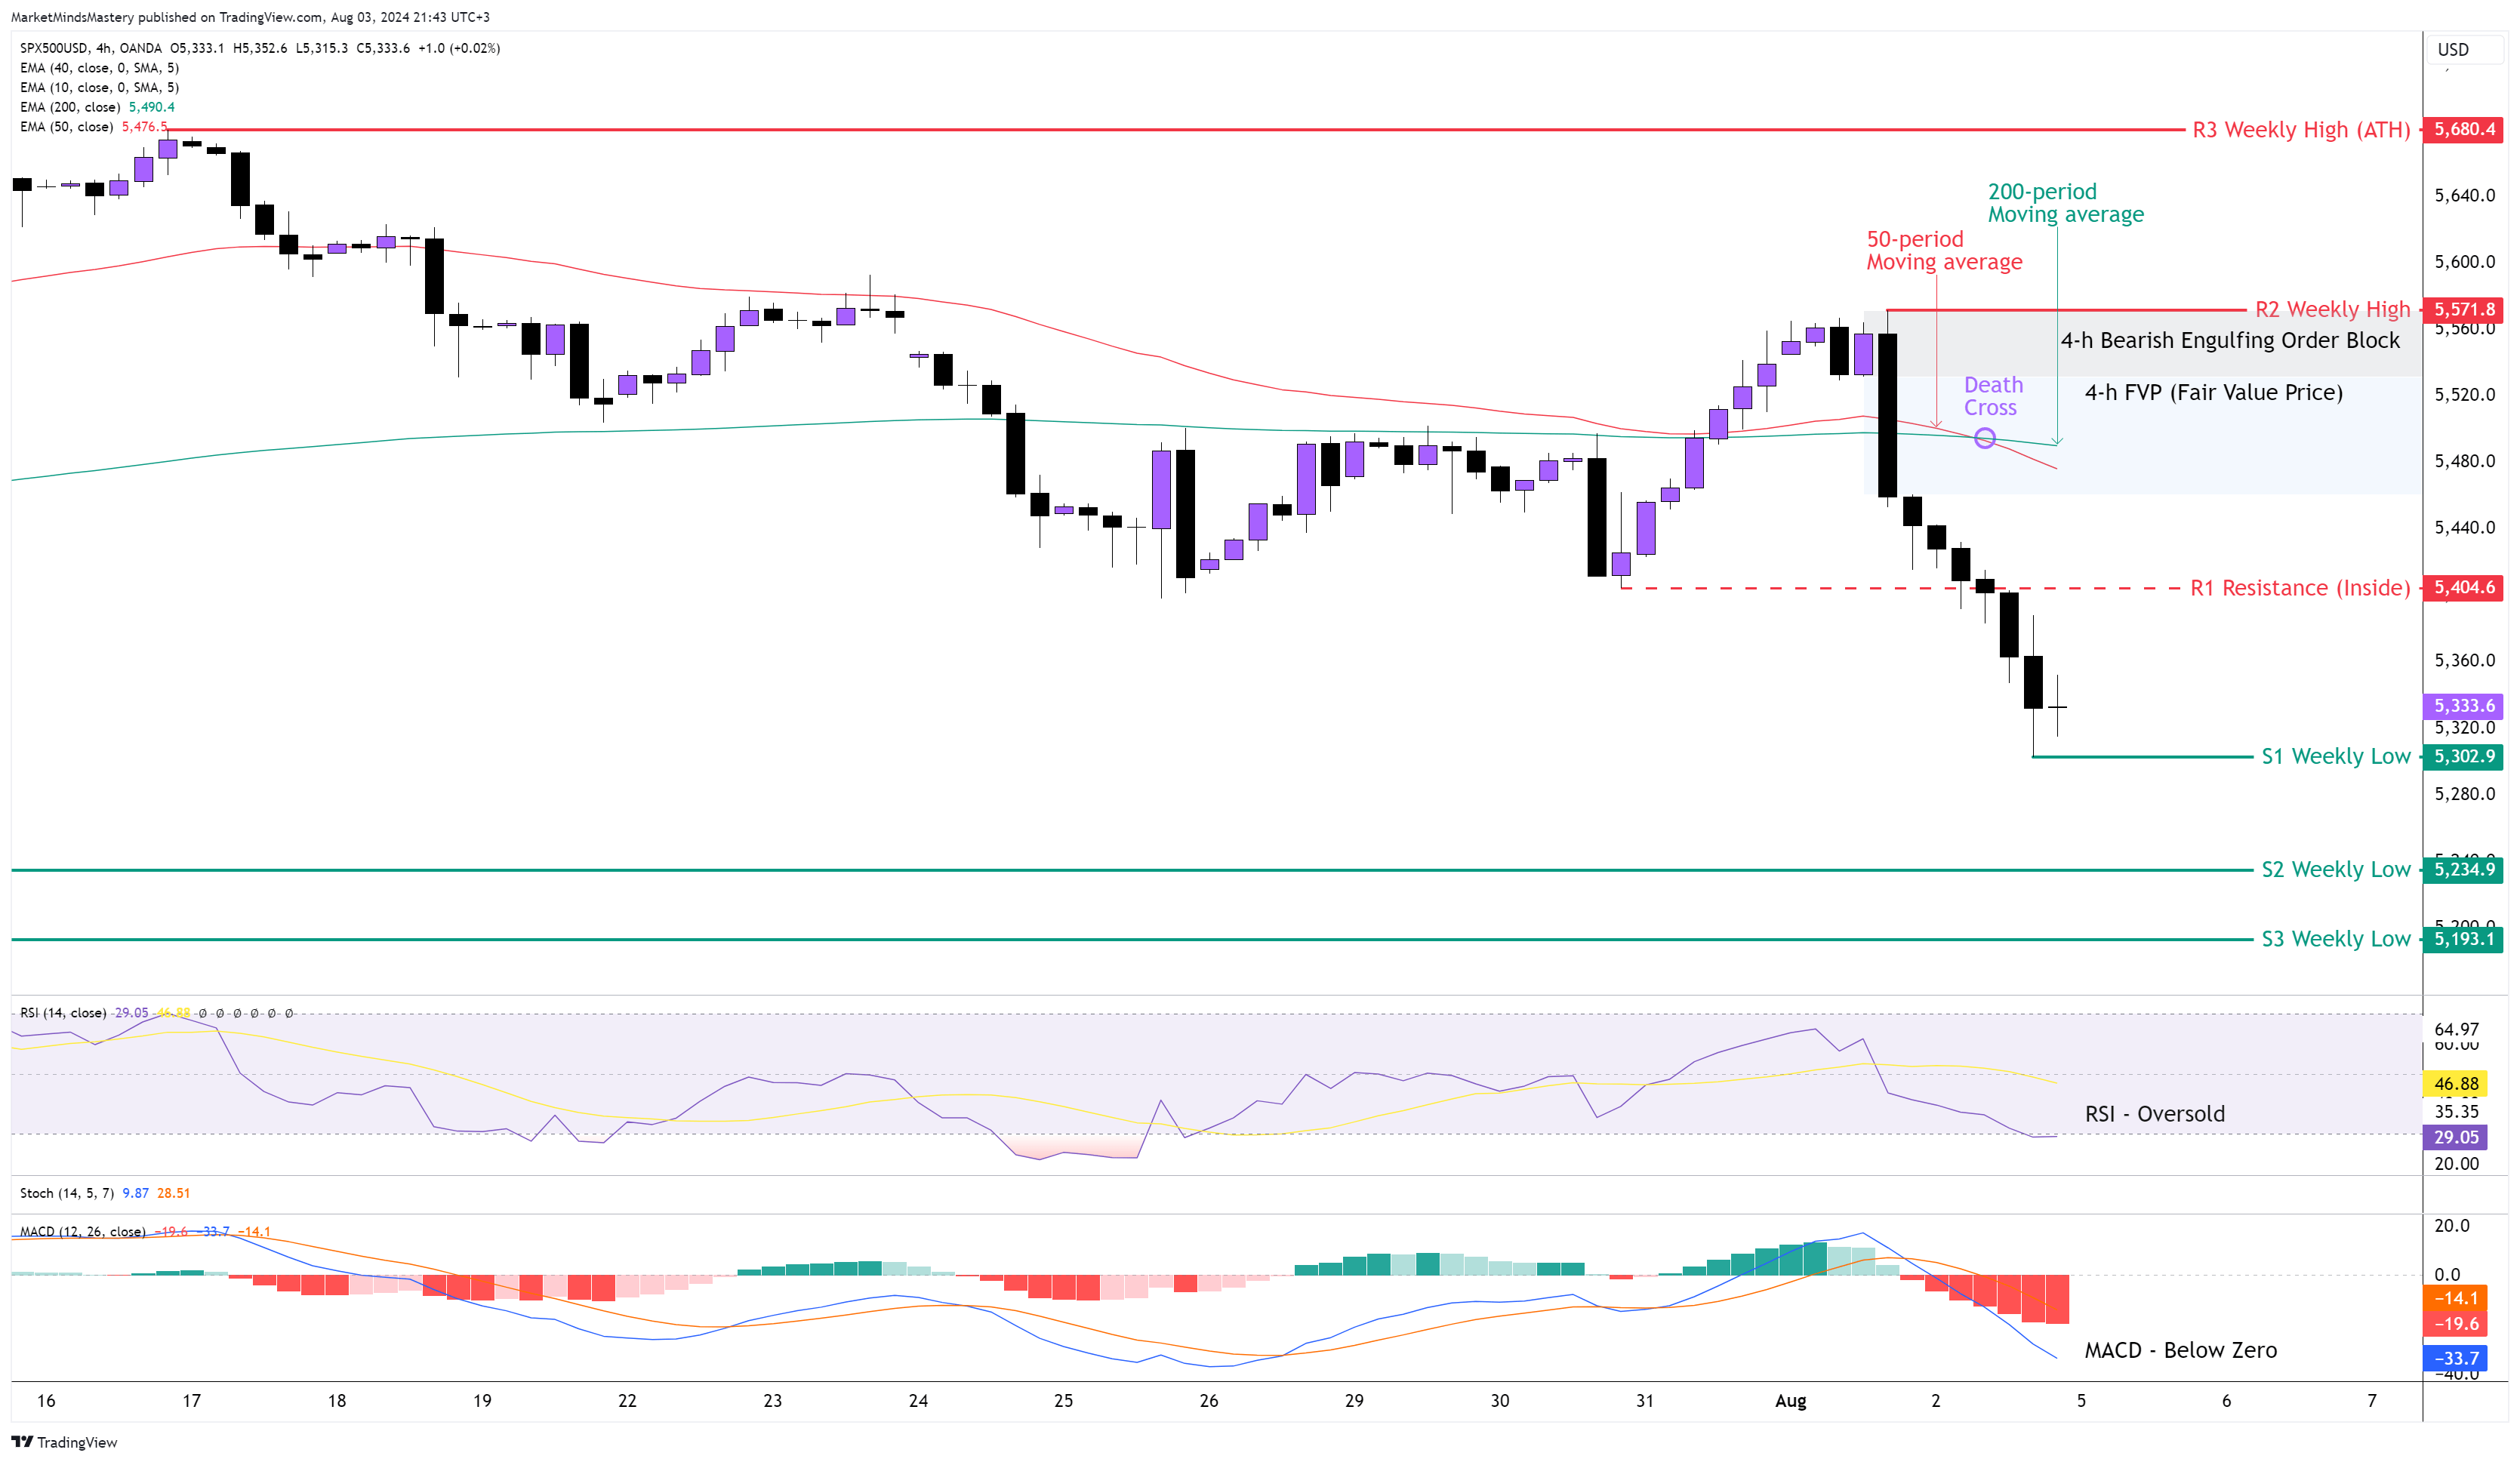
SP 500 4H
Following last week's price move, the price entered into the Demand area we marked on the chart last week, bounced off and moved upwards, filling up the “RunAway Gap”. It then declined, and since then, only Bearish Candles have appeared on the 4-hour chart. Therefore, the weekly candle ended as a Bearish Candle. Last Friday, the 50-period crossed below the 200-period moving average, creating a bearish crossover known as the “Death Cross”. The price created a new lower low, but as there is no confirmed swing low at this moment, we can not use the Fibonacci retracement tool to estimate a retracement percentage. The RSI Oscillator is in an Oversold condition, and the MACD is below its zero line. The MACD’s Histogram is also below the Zero line, and it shows a strong decline. From Monday onwards, if the price continues its downward move, the first support area, S1, will be $5302, which is the previous week’s low. In case the price penetrates the S1 and keep lowering, the next support area, S2 is around $5234 and the S3 at $5193.
Conversely, if the price moves upwards, the first resistance area, R1, will be an Inside resistance around $5404. In case the price surpasses the R1 and keeps moving upwards, the next resistance area, R2, will be the previous week’s high at around $5571. As shown on the chart, the R1 level is a significant one because it caused the creation of an FVP (Fair Value Price) and a 4-h Bearish Englulfing’s Order Block. A further upward movie will find the R3 resistance at $5680, which is the ATH (All-Time High).
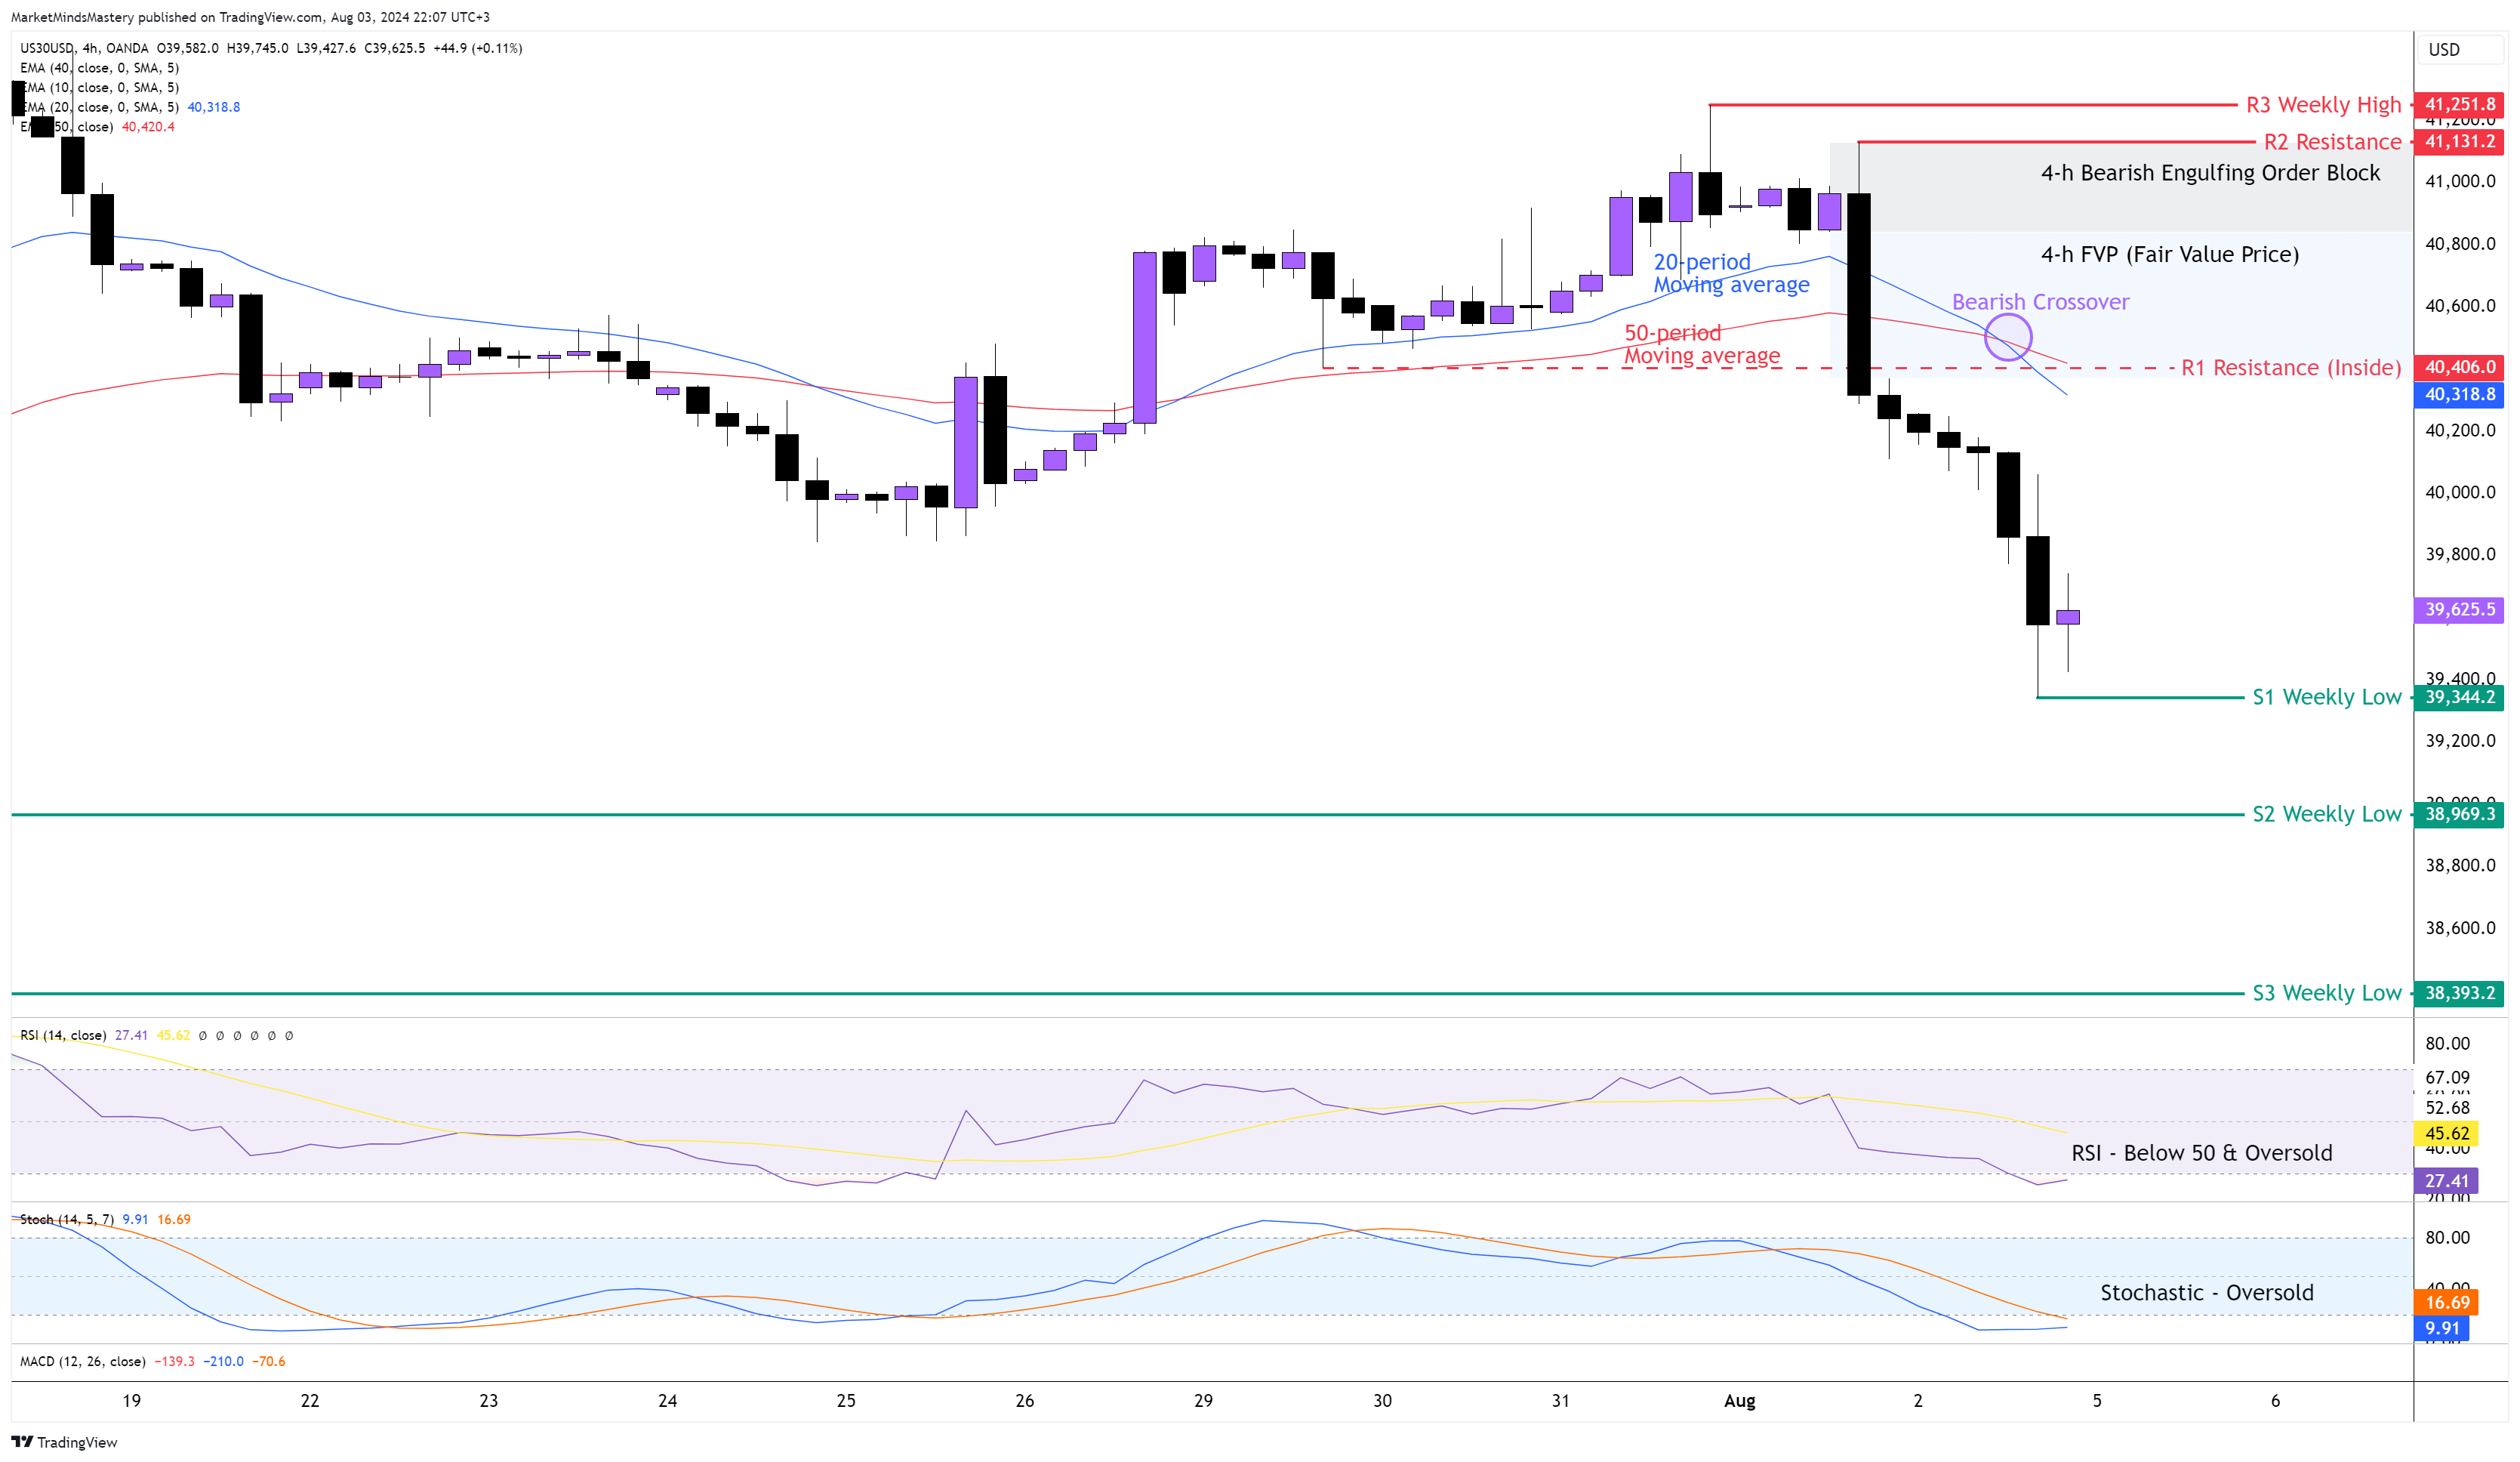
US 30, 4H
The price of the US30 experienced a strong sell-off last Thursday. In the previous week’s Market Outlook, we explained the importance of the Bullish Hammer after a mature uptrend and that it has bearish implications. This happened, and the price on the weekly chart ended up being a Bearish Engulfing Reversal candle. On the 4-hour chart, the market structure shifted and from an uptrend, it's on its way to a downtrend. The market has already made a lower low, and a lower high is required to confirm the downtrend. That said, the 20-period crossed below the 50-period, and this is bearish. The RSI is not only below 50 but also in an Oversold condition due to the strong and fast price decline last week. The Stochastic Oscillator is also in an Oversold condition and this is bearish. Starting Monday, if the price declines further, the first support area, S1, will be around $39344, which is the previous week’s low. In case the price penetrates the S1 and keeps moving downwards, the next support, S2, will be another weekly low price of approximately $38969. If the price penetrates the S2 and keeps lowering, the next support, S3, will be at $38393.
Oppositely, if the price moves upwards for either a retracement or a continuation of the primary (weekly) trend, the first resistance, R1, will be an Inside resistance of around $40406. This coexists with the 20-period moving average., If The price keeps increasing, the next resistance area, R2, will be $41131. In order to rise until the R2, the price needs to penetrate the FVP and the 4-hour Bearish Engulfing Order Block.
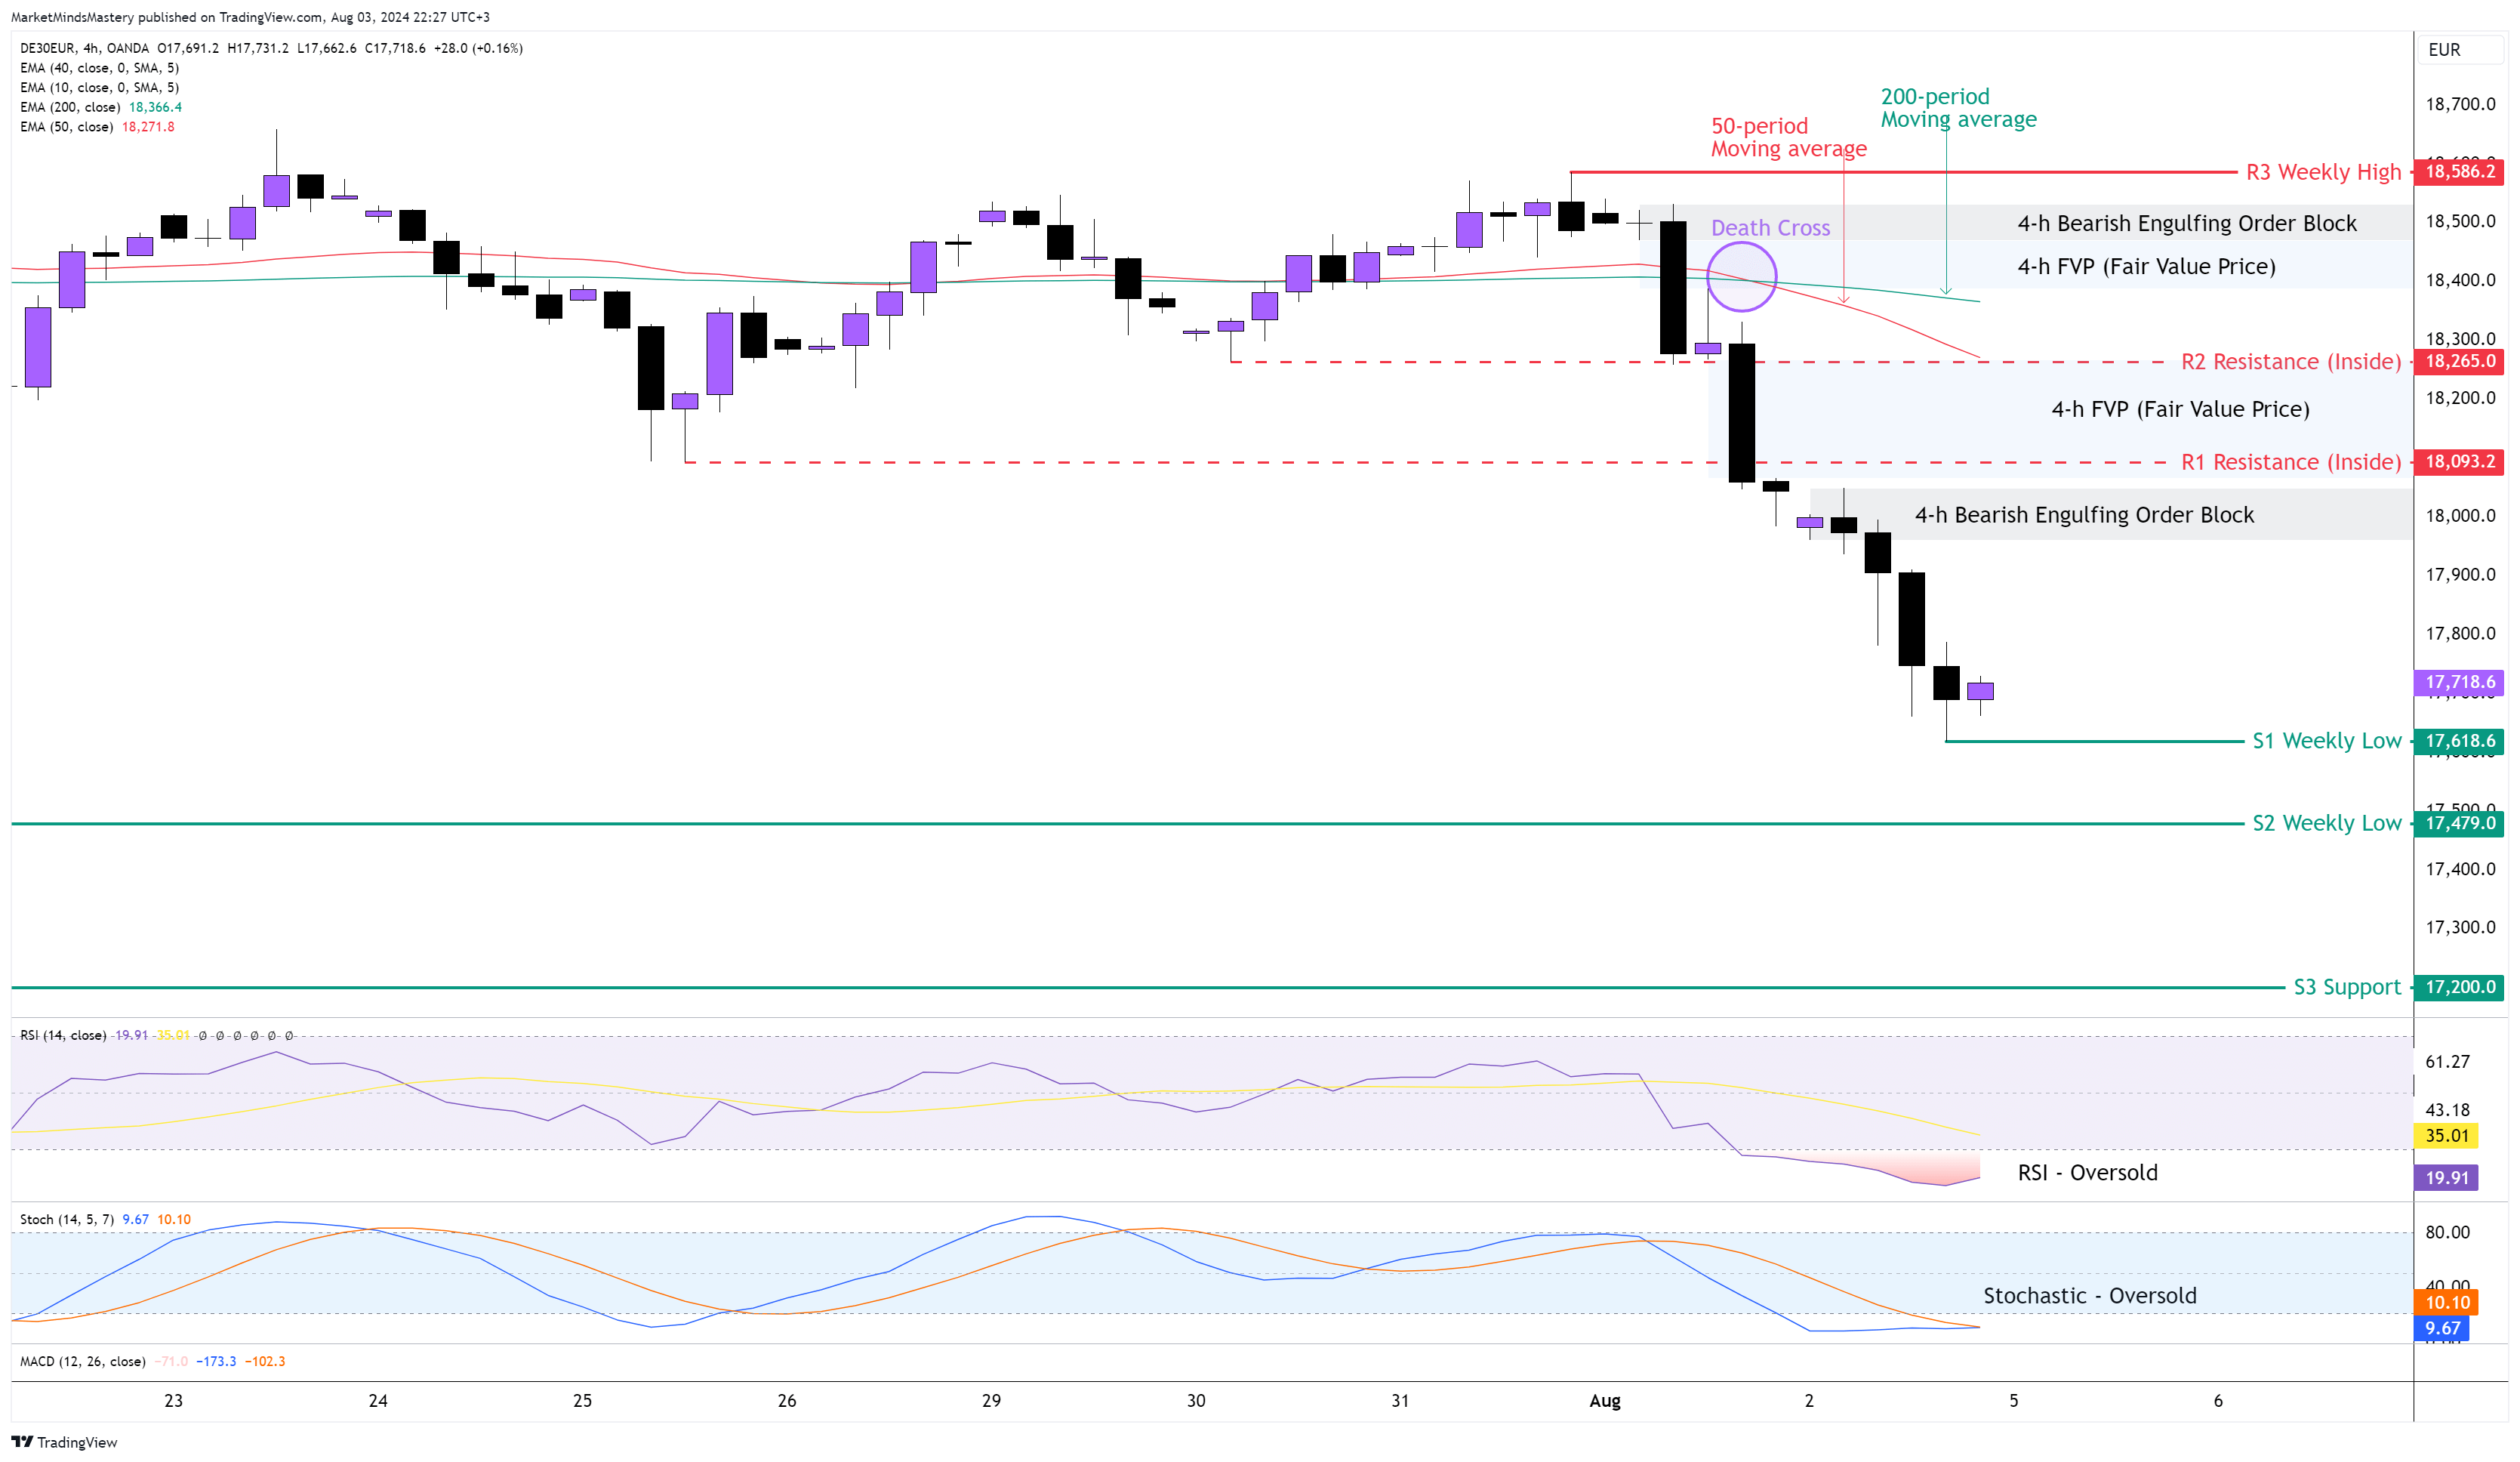
GER 30, 4H
The GER30 last week followed the weakness of the US Indices, and the price on the weekly chart created a long Bearish candle. Additionally, due to the Bullish move of the EURUSD and price rally, the DAX declined due to its inverse correlation with the Euro. The sell-off was fast and intense, sending the RSI in an oversold condition. Additionally, in an Oversold condition, we see the Stochastic Oscillator. Both indicate a bearish price move. The 50-period crossed below the 200-period moving average, known as the “Death Cross”. Although Fibonacci retracement percentages work exceptionally well when they coexist with static price levels, we can not use them at this moment as the price didn’t create a swing low. Therefore, if the price continues to move downwards, the first support area, S1, will be the previous week’s low, around 17618. If the price penetrates the S1 and keeps lowering, the next support area, S2, will be around 17479. A further downward move will find the S3 support at 17200.
On the other hand, if the price bounces off and moves upwards and penetrates the 4-hour Bearish Engulfing Order Block around 18000, the first resistance area will be an Inside resistance around 18093. If the price penetrates the R1 and keeps increasing, if it surpasses the FVP around 18200, it will find the next static resistance, R2, at approximately 18265, which is also an inside resistance. A further upward move will find the R3 resistance around 18586, which is the previous week’s high.