Last week, the markets reacted to the global political, geopolitical, and economic situations with intense volatility. The VIX (Volatility Index) reported a +50% increase on Monday, and the prices of the major currency pairs, Indices and Commodities moved twice and three times as much as the ATR (Average True Range). Last week, a lot of attention was paid to the Australian dollar, primarily due to its overall weakness as a single currency and also because the RBA (Reserve Bank of Australia) reported unchanged interest rates, keeping them at 4.35%, as well as on the Great British Pound as the currency's weakness was noticeable until last Friday.
Starting Monday, the markets are expected to move “under normal conditions,” as there won't be any significant news events. Therefore, volatility is expected to remain low unless Geopolitical events occur during the weekend, which are expected to affect Monday’s trading activity, especially during the open and overlapped trading sessions.
On Tuesday, the trading day will start with the PPI (Purchase Price Index) in Japan, and the forecast gauges an increase from 2.9% to 3%. This can be a positive indication for the Japanese Yen, but not something significant which is expected to create a new trend in the markets. Next, in Australia, the Wage Price Index will be reported, and the expectation is an increase of 0.1%, which means from 0.8 to 0.9%. Due to the rising inflation and the high interest rates which directly affect the housing loans, this wage increase, if it happens, won't be just enough for long-term positiveness on the Australian Dollar. One hour before the London Open, in the UK, the Claimant Count Change will be announced, and the forecast shows a decrease from 32.3K to 14.5K. As per the consensus, fewer people seek unemployment benefits, and if the actual numbers confirm the forecasts, the Sterling is expected to strengthen. As the New York trading session starts, the PPI (Producers Price Index) in the US is expected to report at the same rate as the previous month, 0.2%. If the outcome report overcomes the forecast and if the market follows through, it can be positive and favourable for the US Dollar.
The Tokyo Trading Session is expected to attract traders who are trading in the Asian Session, and the volatility of the Kiwi is expected to be noticeable because the RBNZ (Reserve Bank of New Zealand) will report their Interest Rates. New Zealand’s Interest Rates are among the highest worldwide. The forecast estimates that the RBNZ will keep their rates at their current 5.5%. What this means for the market participants and the traders is that if the rates remain the same, the currency is usually considered bearish. Following the Global trends, the interest rates are expected to drop in the next quarter. In case the RBNZ drops its rates, Kiwi's weakness will be noticeable. Hence, the currency pairs with either a quote or a base currency against the NZD will dominate the price charts. There is a very unlikely scenario for the RBNZ to increase the rates, but if this happens, then the Kiwi will most likely appreciate it. Next, the RBNZ Monetary Policy Statement and the Press Conference will follow. A few hours later, with the European trading session kicking in, the UK will report the CPI (Consumer Price Index). The forecast estimates that an increase of 0.35 is expected.
Currently, the CPi is 2% and is expected to increase to 2.3%. This is compared to the same month of the previous year. As we explained in the previous Market Outlook, the CPI release number is positively correlated with Inflation. Rising CPI often leads to rising Inflation. The first significant outcome of a rising CPI is that the consumer will possibly start paying more to buy the same Goods and Services they used to buy some time ago. However, for the currency, this is a positive and favourable outcome, as the currency tends to be appreciated. Last week, Sterling was among the weakest currencies and the GBPUSD until last Friday did not overcome the downturn as the other major currencies did. So, a positive CPI and a follow-through by the market can lead to some new directional moves in Sterling. During the New York Trading Session, the CPI will be reported in the US, and the forecast expects an unchanging number, with the report remaining at 3%. The consequences for US performance are likely to be weakened if the actual forecast is confirmed and if the market follows through. Therefore, the major currency pairs are expected to gain positive momentum against the Greenback. The trading day will finish with the speech of the Reserve Bank of New Zealand Governor Orr. Throughout the governor's speech, we can identify hinds and clues regarding how the RBNZ sees the overall economy of the country and what their move will be with the next month’s interest rates and inflation.
On Thursday 15, the Banks in the Eurozone, France, Italy, and Spain will be closed due to Assumption Day. Therefore, the liquidity and volatility are expected to be low during the European and London Trading Sessions—especially the pairs involving the EURO either as a base or as a quote currency. In Japan, the GDP (Gross Domestic Product) for the second quarter will be reported, and the consensus is that there will be a significant 1% increase from -0.5% to 0.5%. An increase like this can be favourable for the Japanese Yen and can lead to some bearishness of all currency pairs that have the JPY as a quoted currency. If the CPI in the US weakens the US Dollar and the GDP in Japan strengthens the Yen, the USDJPY is likely to decline further than it currently is.
As we will see later on the charts below, the Weekly (primary) trend is up in the USDJPY pair, and in case of a deeper price retracement, the pair will decline further. Otherwise, the uptrend will likely continue. The next significant event will directly affect the Australian Dollar as the Employment change is expected to drop from 50.2K to 26K. This forecast shows an almost 50% decrease in the number of people who got employed in Australia compared to the month before. At the same time, the Unemployment Rate is expected to remain at 4.1%. In a negative unemployment rate report, the Aussie can weaken. Otherwise, a strong Aussie can lead the AUDUSD until a significant level of price resistance, as we will see in the charts below. Next, in China, Retail Sales are expected to increase by 0.6%, meaning that from 2%, the forecast estimates an increase of 2.6%. Industrial Production in China will be the next significant event, and it is expected to drop from 5.3% to 5.2%. The Sterling is expected to become volatile because during the London Trading Session, the GDP (Gross Domestic Product) will be reported, and the expectation shows a decrease in the monthly GDP from 0.4% to 0.1% and also a decrease in the quarterly GDP from 0.7% to 0.6%. If the actual report confirms the forecast and, at the same time, the market follows through, the weakness of the Sterling will be obvious, and at least temporarily, some short-selling opportunities may arise on the GBPUSD and the GBPJPY.
Moving into the New York Trading Session, Retail Sales in the US are expected to increase from 0% to 0.3%, which is expected to give intraday momentum trading opportunities for shorter time frames.
Friday is the last trading day for this week. Regarding significant news events, this day will be short, and the important news events will mainly affect the Australian Dollar and the Sterling. Starting from the Sydney trading session, and just before we enter the Asian Trading Session in Australia, the Governor of the RBA Bullock will give a speech. Moving into the London trading session, the Retail Sales in the UK are about to improve as per the forecast. The consensus estimates an increase from -1.2% to 0.8%. Considering the actual report confirms the forecast report and the market following the positive outcome, Sterling is expected to gain strength and offer trading opportunities for intraday traders and scalpers.
Overall bullishness in the Great British Pound this week, can also favour the Swing Traders for a longer-term trading approach. Next will be the Trade Balance in the Eurozone, and the forecast estimates an increase from 12.3B to 14.5B, which can be favourable for the Euro. The last two significant events for the day will be the Building Permits in the US, with the forecast showing a drop from 1.454M to 1.44M, and the Preliminary Consumer Sentiment, which is expected to increase from 66.4 to 67.3.
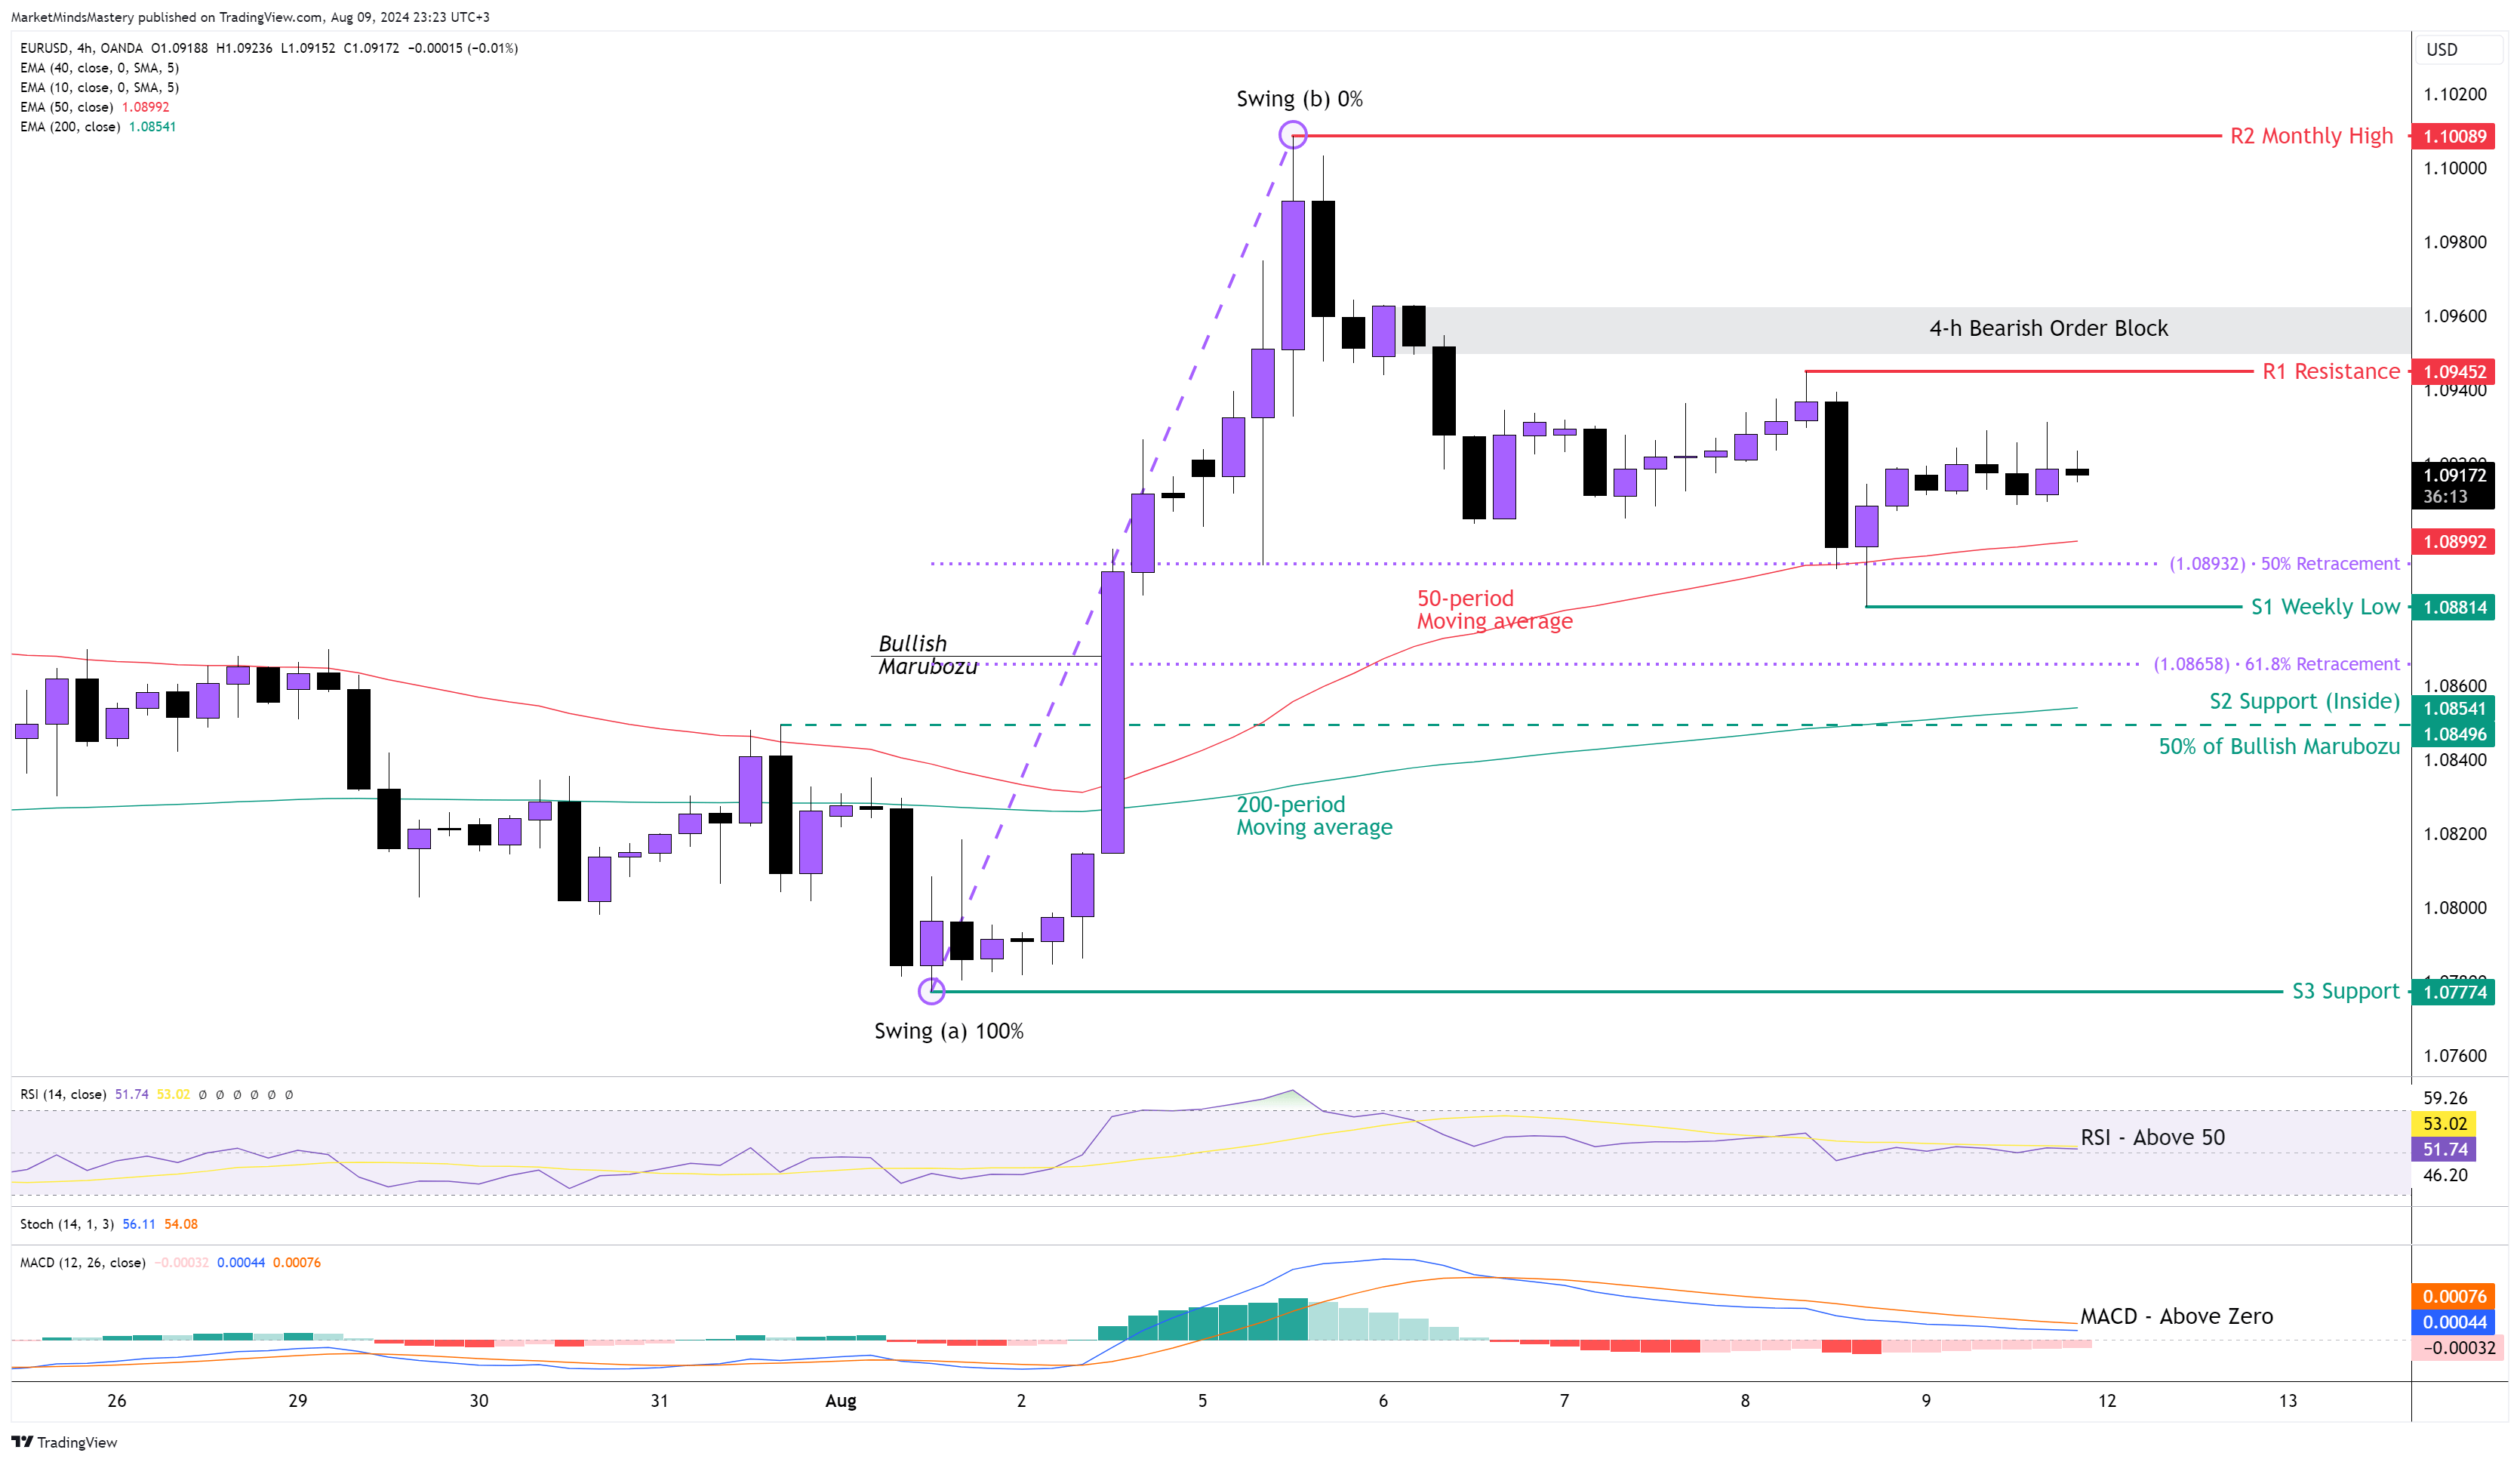
EUR USD 4H

Following the previous week's Market Outlook, the price of the EURUSD last Monday continued the upward move for a short period. From Tuesday onwards, it was trading within a narrow range of 60 pips on average, which is below the Daily ATR (Average True Range). This indicates the sideway movement in the most tradable currency pair, and it is a sign of market indecision on whether or not it will continue trading upwards. The Weekly chart ended with the Long Upper Wick candle, which usually has Bearish implications. The 4-hour chart maintains an upward move as the price maintains a higher high formation without any violation of the most recent swing low. The 50-period remains above the 200-period moving average, and this has a bullish implication. The RSI is above its middle line of 50, and it is another bullish indication. The MACD is above the zero line, but its Histogram is Flat, confirming the sideways move of the currency pair during the last few trading days. Last Friday, the price found support and bounced off from the 50-period moving average and the 50% Fibonacci retracement, as shown on the chart. Therefore, if the price continues its upward move, the first resistance area, R1, will be 1.09452. If the price penetrates the R1 and keeps increasing, the closest Bearish Order Block is around 1.09600, and it is considered an area where the price can find resistance. A further upward move will find the next static resistance R2, approximately 1.10, which is a significant price level that usually represents a round and psychological number that can attract a lot of traders’ attention. A break above the R2 will establish an uptrend in the market. On the other hand, if the price is rejected and moves downwards, the first support area, S1, will be the previous week’s low at around 1.08814. If the price penetrates the S1 and keeps lowering, the next support, S2, will be an inside support, and it coexists with the middle of the Bullish Marubozu candle and the 200-period moving average.
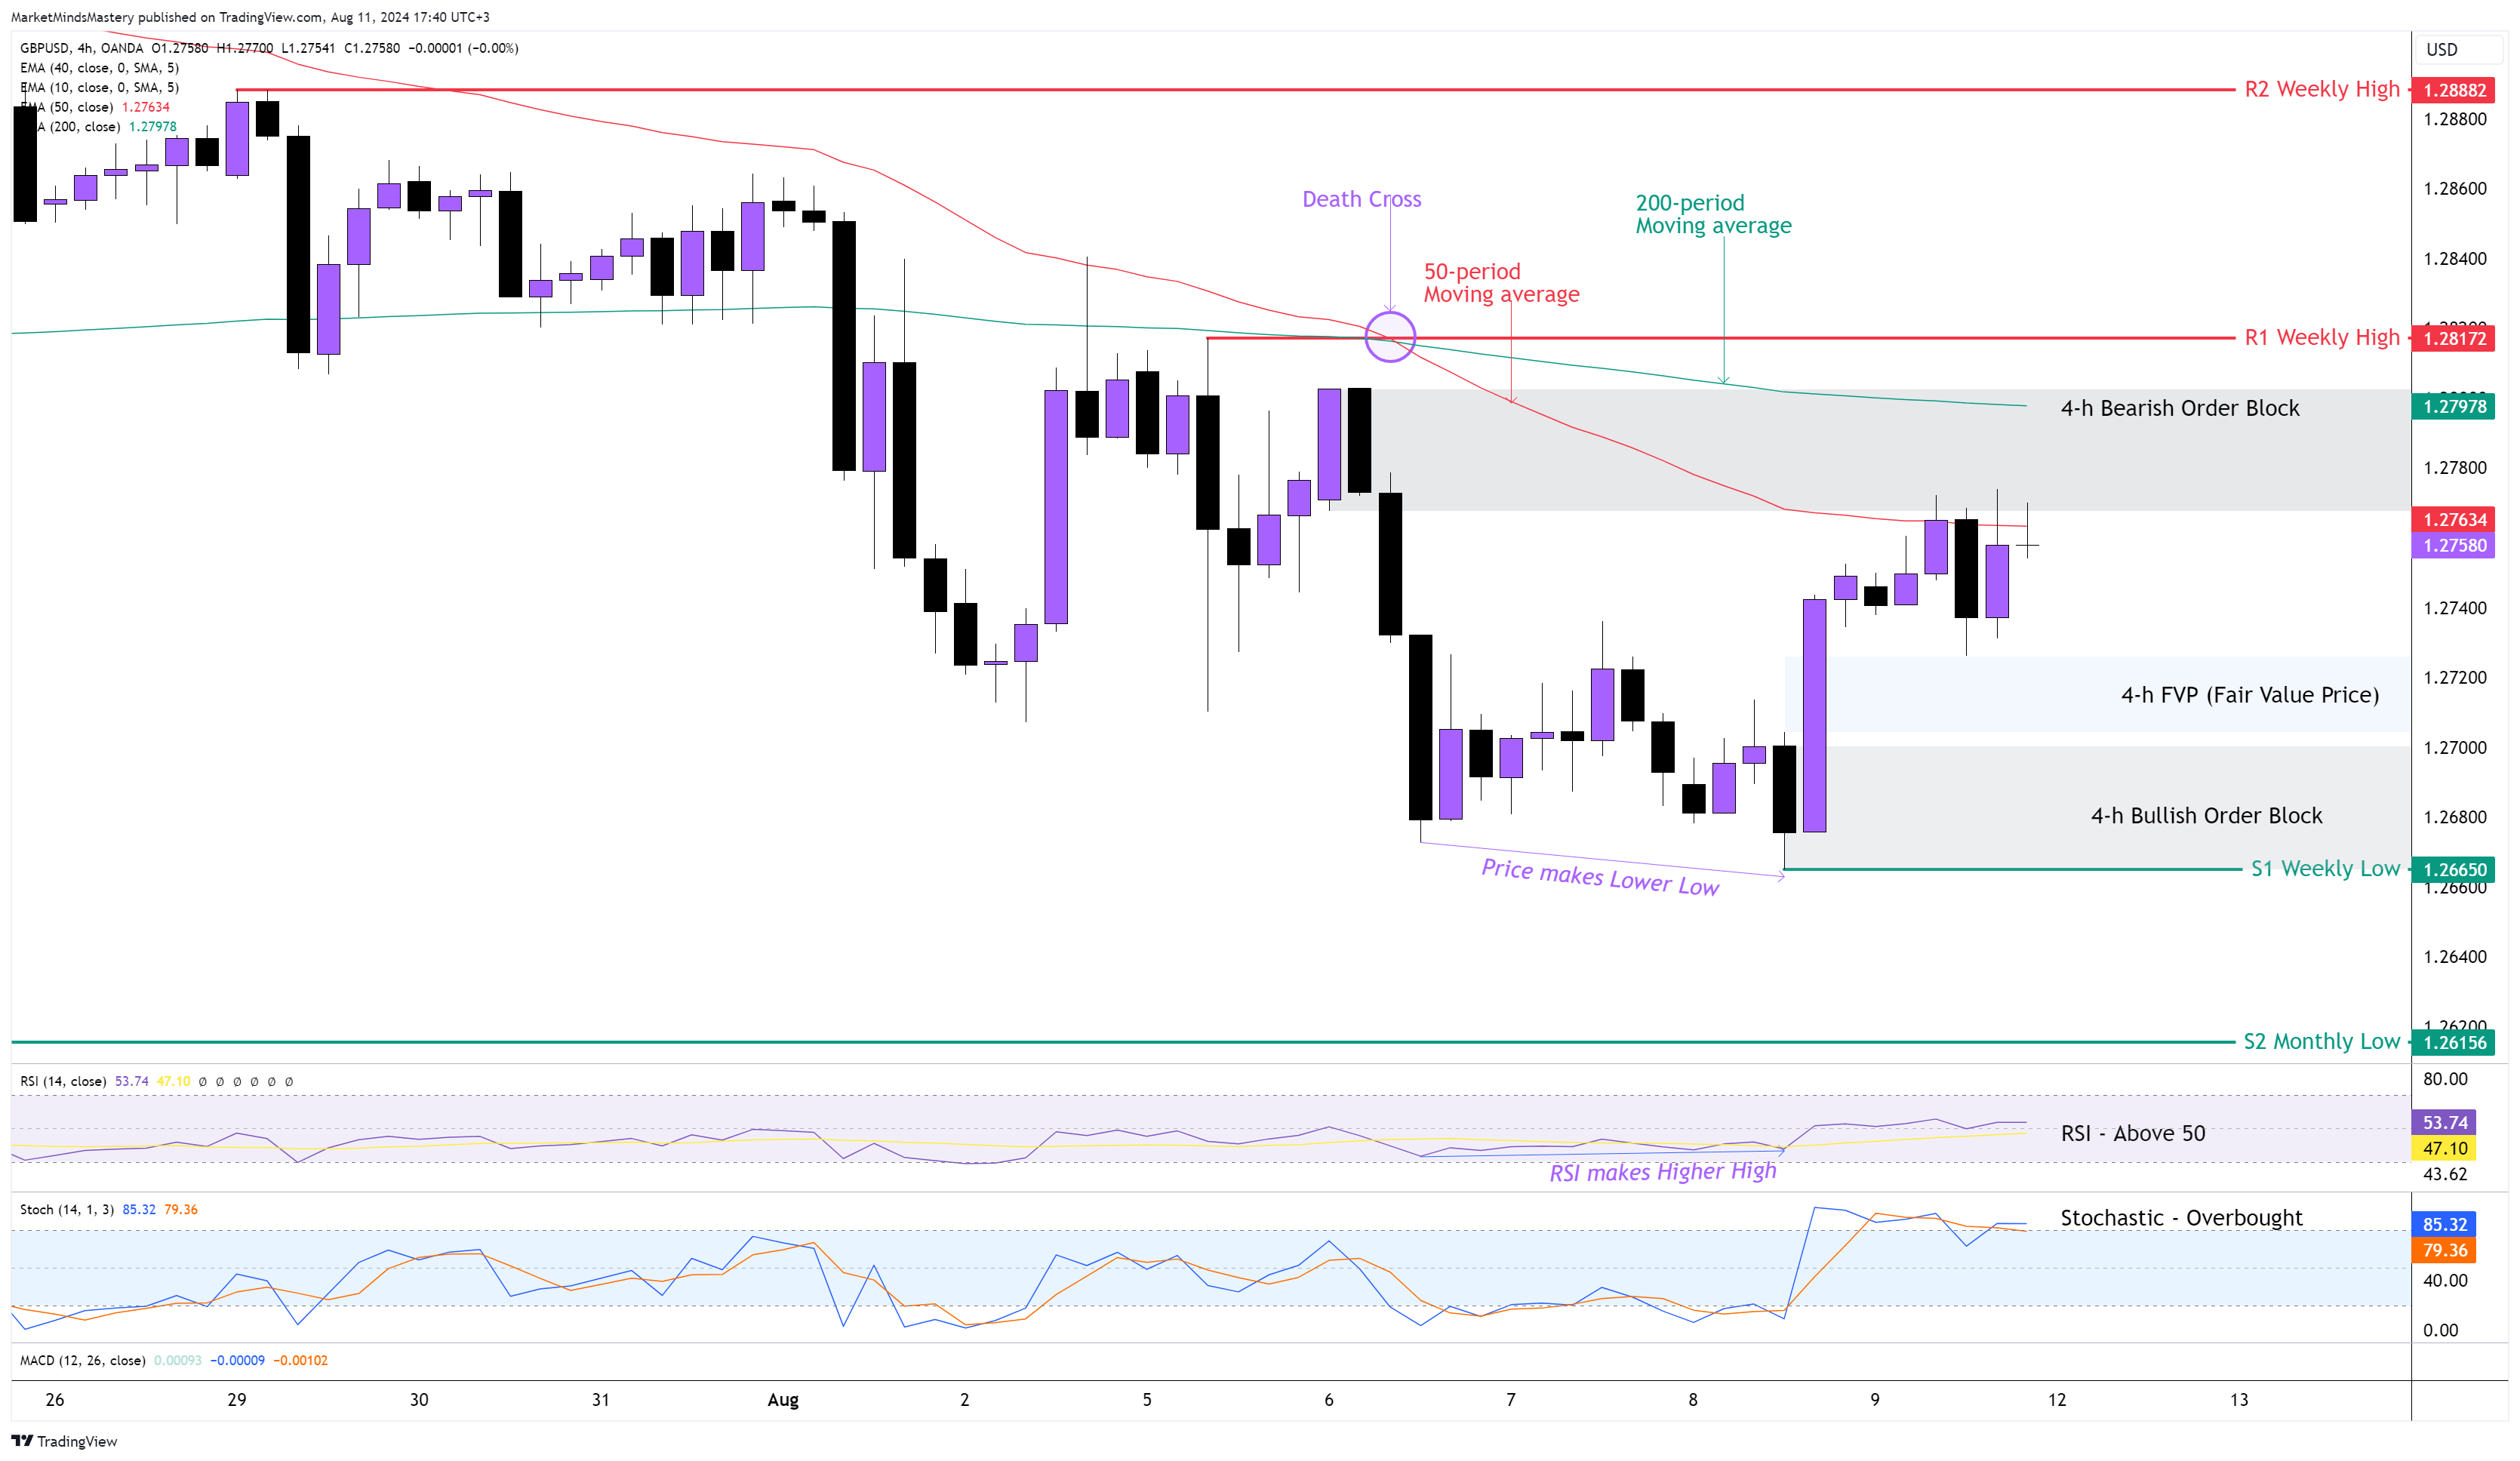
GBP USD 4H
Following Sterling's weakness last week, the price of the GBPUSD kept declining despite the EURUSD and the AUDUSD keeping a bullish sentiment. As per the currency correlation analysis, this indicates how weak was the Great British Pound. On Tuesday, a Bearish Crossover occurred, known as the “Death Cross”, once the 50-period moving average crosses below the 200-period. Since then, the Sterling declined, and on Thursday, the price and the RSI showed Positive Divergences A’ Class, and the price bounced off and moved upwards. Afterwards, the RSI traded above the middle line of 50, and the Stochastic Oscillator became Overbought. It is worth mentioning that the %K Line (blue) is above the %D Line (Orange), and this is bullish. Trades need to pay attention to what the chart indicates by printing Positive Divergences. It is a sign that the last downward trend leg was accompanied by a lack of momentum compared to the one preceding it. Therefore, the price will enter first in a corrective phase, as it did, and if the market structure changes, then we will examine a trend reversal. As long as the price maintains the lower high and lower low formation, the market is in a downtrend. Starting Monday, if the price declines, the first support area, S1, will be the previous week’s low, around 1.26650. Before that level, there is an FVP (Fair Value Price) and a Bullish Order Block, which can become support areas. A further downward move will find the next support area, S2, around 1.26156, which is a monthly high price. Oppositely, if the price penetrates the 50-period moving average and moves upwards, the first resistance area, R1, will be around 1.28172. A move above the R1 will find the next resistance area, R2, around 1.28882, which is another weekly high.
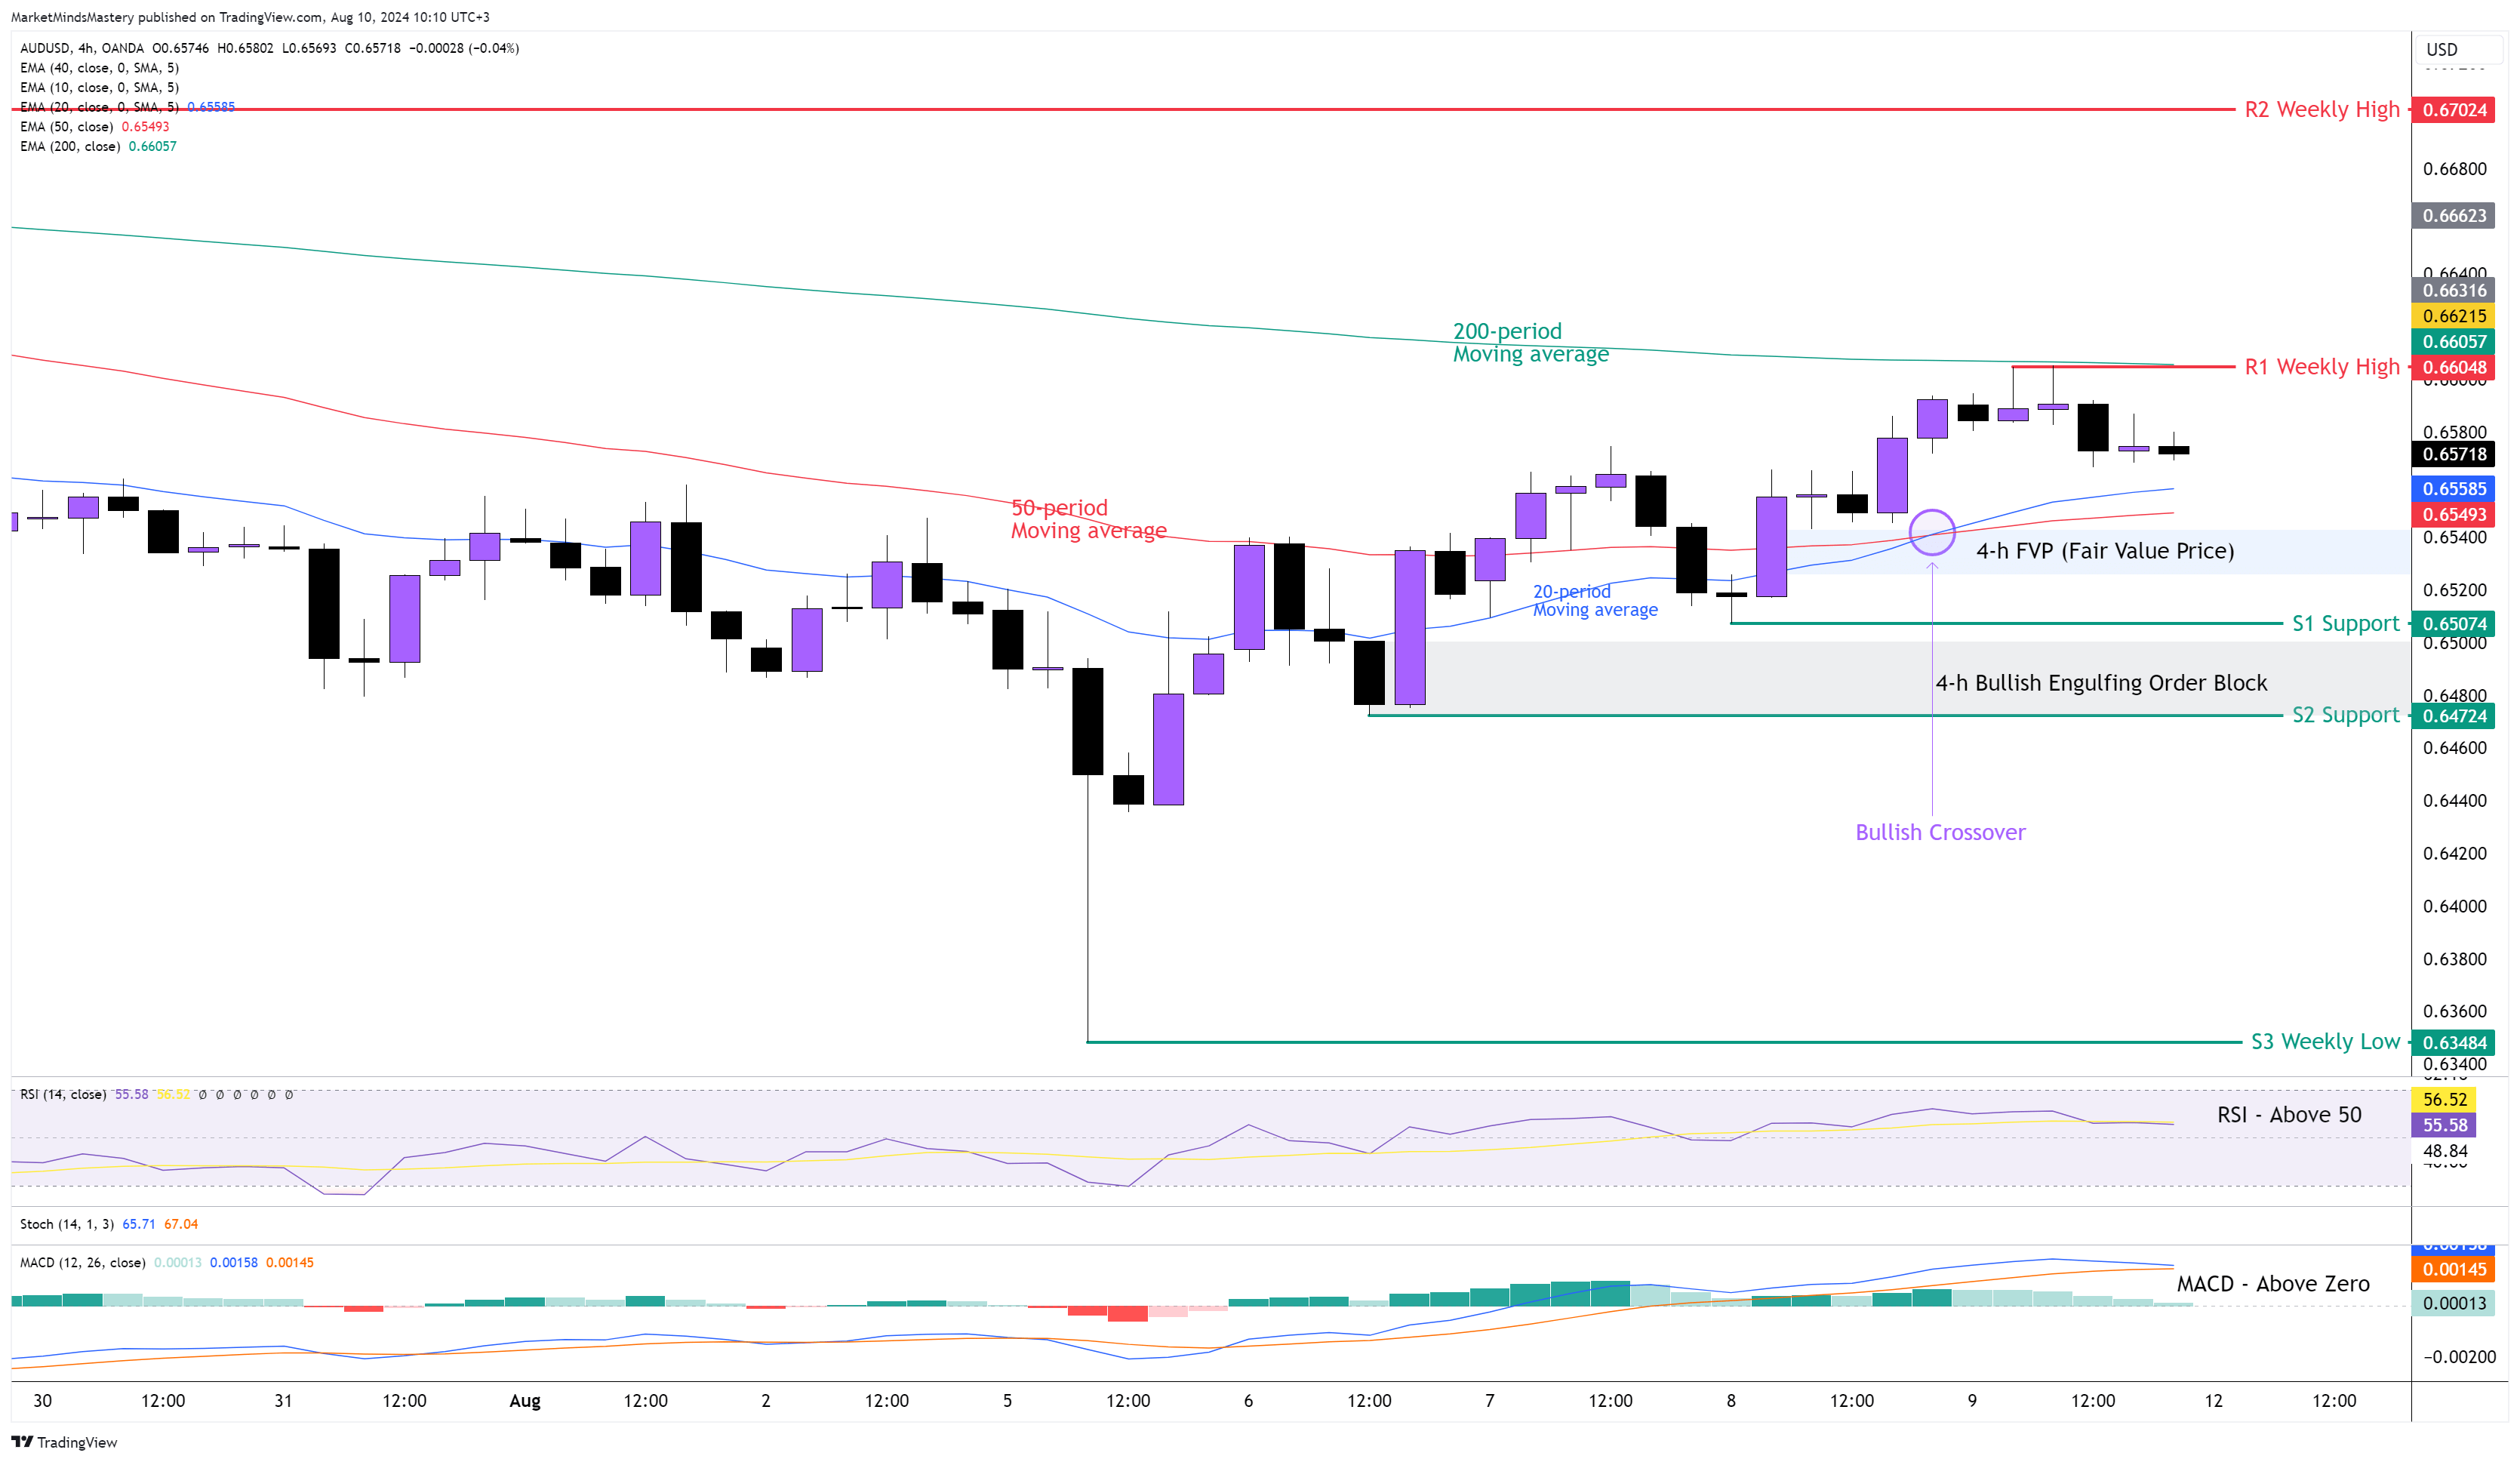
AUD USD 4H
Following the Positive Divergence from the previous week's analysis, the price, after entering a corrective phase, ended up reversing the downtrend and creating a new market structure of higher highs and higher lows on the 4-hour chart. The weekly chart price action was a Bullish Long Lower Wick candle with a price range greater than the ATR, which is an indication of above-average volatility. Despite the RBA keeping interest rates at 4.25%, the market didn't follow through, and instead of weakening, the AUD gained strength against the USD. The 20-period crossed above the 50-period moving average and this is bullish. Last Friday, the 200-period moving average acted as a dynamic resistance, as shown on the chart, forcing the price to decline.
Additionally, an FVP (Fair Value Price) was created last Thursday around 0.65400, and a Bullish Engulfing Order Block last Tuesday approximately at 0.6500. The RSI Oscillator is above its middle line 50, and this is bullish. The MACD also has bullish implications, as it is above its zero line. The Histogram trades above the middle line, which has bullish implications. Starting Monday, if the price continues its upward move and, the first resistance area, R1, will be the previous week’s high, around .66048. This price coexists with the 200-period moving average. If the price penetrates the R1 and keeps increasing, the next resistance, R2, is another weekly high around 0.67024. Conversely, if the price declines and moves downwards, the first support area, S1, will be the swing low around 0.65074. If the price declines further, the next support S2 will be at 0.64724, and the S3 level will be around 0.63484, which is the previous week’s low.
USD JPY 4H
Last Monday, the price of the USDJPY currency pair declined approximately 5000 points (500 pips), but this didn't last long. Starting on Tuesday, the price correction started retracing 100% of the move. This price pattern created a price action on the weekly chart with a Long Lower Wick and a small body, and it has bullish implications.
On the 4-hour chart, the 50-period moving average is below the 200-period. The RSI Oscillator is below its middle line of 50, indicating price weakness. The MACD, on the other hand, is below its zero line, and it has bearish implications. As per the Dow theory, the Failure Swing Low at point (a) and the penetration of the swing high at point (b) are considered a change in the market structure and the potential development of a new trend.
Starting Monday, if the price moves upwards, the first resistance area, R1, will be the previous week’s high, around 147.87. As shown in the chart, this price level coexists with the 50-period moving average, so that it could be a dynamic resistance for the price. If the price penetrates the R1 and keeps increasing, the next resistance area, R2, will be 150.86. Two weeks ago, a Bearish Order Block was created that hasn’t yet been tested around that level. Conversely, if the price declines and moves downwards, the first support area, S1, will be 144, with the Bullish Order Block around 144.500. If the price penetrates the S1 and keeps lowering, it will break the uptrend and a downtrend can potentially begin. Therefore, the next support area, S2, will be around 141.688, which is the lowest level for the previous week.
USD CHF 4H
Following the previous week’s Market Outlook, the price kept declining last Monday, and then it started an upward move, which lasted until the end of the trading week. On the Weekly chart, the price action is a Long Lower Wick, and usually, it has bullish implications. Looking at the 4-hour chart, the 20-period moving average is below the 50-period moving average, and it is a bearish indication. As per the Swing Analysis, the price made a higher high and higher low formation, indicating an uptrend. A T1 Upward Trendline shows the direction on the chart above. Last Thursday, a Bullish Engulfing Order Block and an FVP (Fair Value Price) were created at around 0.86000, as shown on the chart. The RSI above 50 indicates bullishness. The Stochastic Oscillator is in an Overbought condition, which is also a bullish indication. Therefore, if the price maintains the series of higher highs and higher lows and keeps moving above the T1 trendline, the first resistance R1 is approximately 0.8674. If the price penetrates the R1 and keeps moving upwards, the next resistance area, R2, will be around 0.87772.
On the other hand, if the price declines, moves downwards and penetrates both the FVP and the Order Block around 0.8600, the first support area, S1, will be at 0.85600. In this case, the T1 Trendline will break, and the uptrend will end. If the price keeps lowering, the next support area, S2, will be around 0.8501, and a further downward move will find the S3 support around 0.84323, which is the previous week’s low.
GBP JPY 4H
Despite Sterling's weakness across the board last week and the overall downtrend on the GBPJPY currency pair, the weekly chart ended as a long lower wick candle, also known as a bullish Pin Bar. This is good enough to inform those traders who seek potential trading opportunities on the lower time frames with directional bias, but it needs to back up with market structure on the lower time frames. On the 4-hour chart, the 50-period is below the 200-period, and this is bearish. The RSI Oscillator is around 50, indicating a short-term price balance or market equilibrium. A 4-h Bearish Engulfing Order Block was created at the beginning of the month around 192. Last week, around the area of 181, a Bullish Order Block was created on the hourly time chart.
Starting Monday, if the price follows the weekly bullish price action and moves upwards, the first resistance area, R1, will be the previous week’s high, around 188.42. If the price penetrates the R1 and keeps moving upwards, the next resistance area, R2, will be about 193.26. In case the price now surpasses the R1 resistance and keeps increasing, the next resistance area, R3, is around 197.61.
On the other hand, if the price moves downwards, the first support area, S1, will be around 184.48, which was the recent swing low. A break below the S1 will end the current short-term uptrend defined by the Upward Trendline T1. In this case, a further price decline will find the next support, S2 at 182.81 and S3 support around 180.10, which is the previous week’s low.
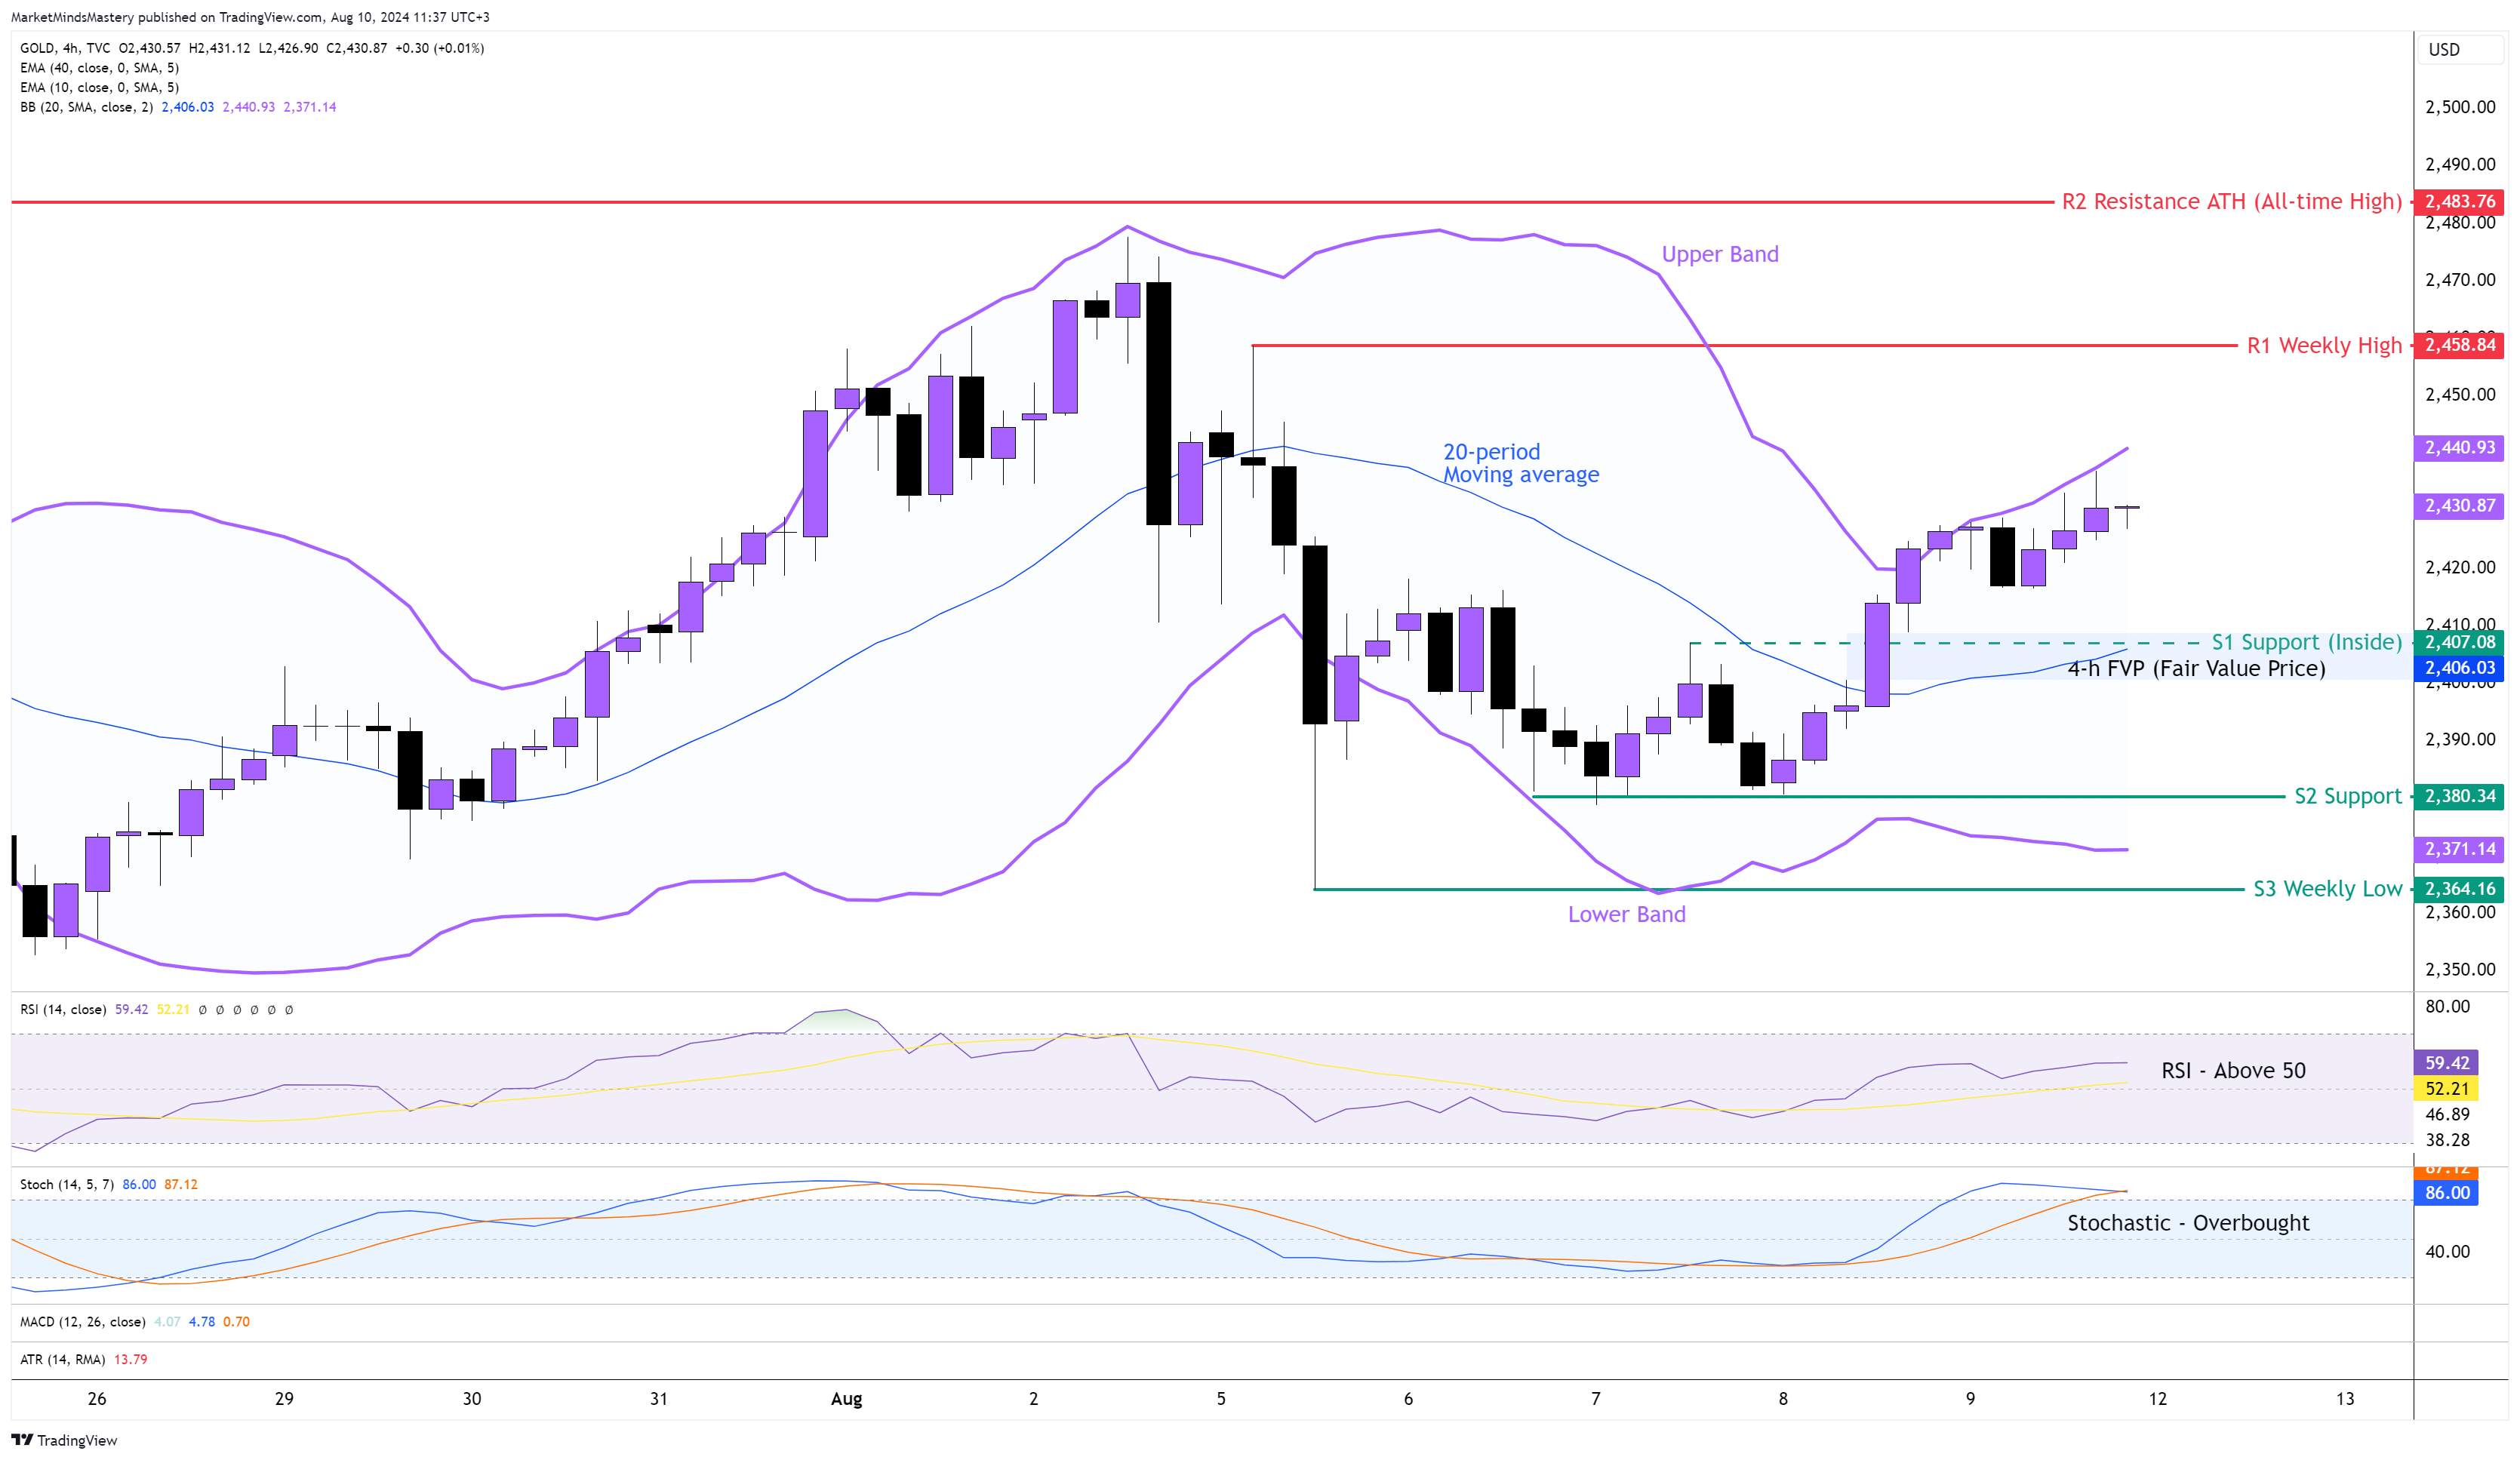
GOLD 4H
The Gold market was moving sideways the previous week primarily because of global uncertainty. Although in July, it registered an ATH (All-Time High) and also, a few weeks ago, it traded almost at the same ATH. As per the technical price charts, a decline and retracement were expected. Through time, Gold has become a hard commodity that serves the fears and worries of investors well and is used as a safe haven asset. Using the Bollinger Bands, Gold prices are around the Upper Band and can be considered a bullish indicator. The Lower Band is slightly pointing downwards, indicating that the upward move can be sustained, at least in the short term. The price trades above the 20-period moving average, which is the middle of the Bollinger Bands, which has bullish implications. Last Thursday, an FVP (Fair Value Price) was created around $2400, which is a significant price level. The RSI Oscillator is above its middle line of 50, and this is bullish. The Stochastic Oscillator is in an overbought condition, and this also has bullish implications. Starting Monday, the price continues its upward move, and the first resistance area, R1, will be the previous week’s high, around $2458. If the price penetrates the R1 and keeps increasing, the next resistance, R2, will be the ATH, approximately $2483. Oppositely, if the price declines and moves downwards, the first support area, S1, will be an Inside support around $2407. If the price won't bounce off from the S1 rather than penetrates it and declines further, the next support area, S2, will be around $2380. A further decline can move the price lower until the next support area, S3, at around $2364, which is the previous week’s low.
USOIL 4H
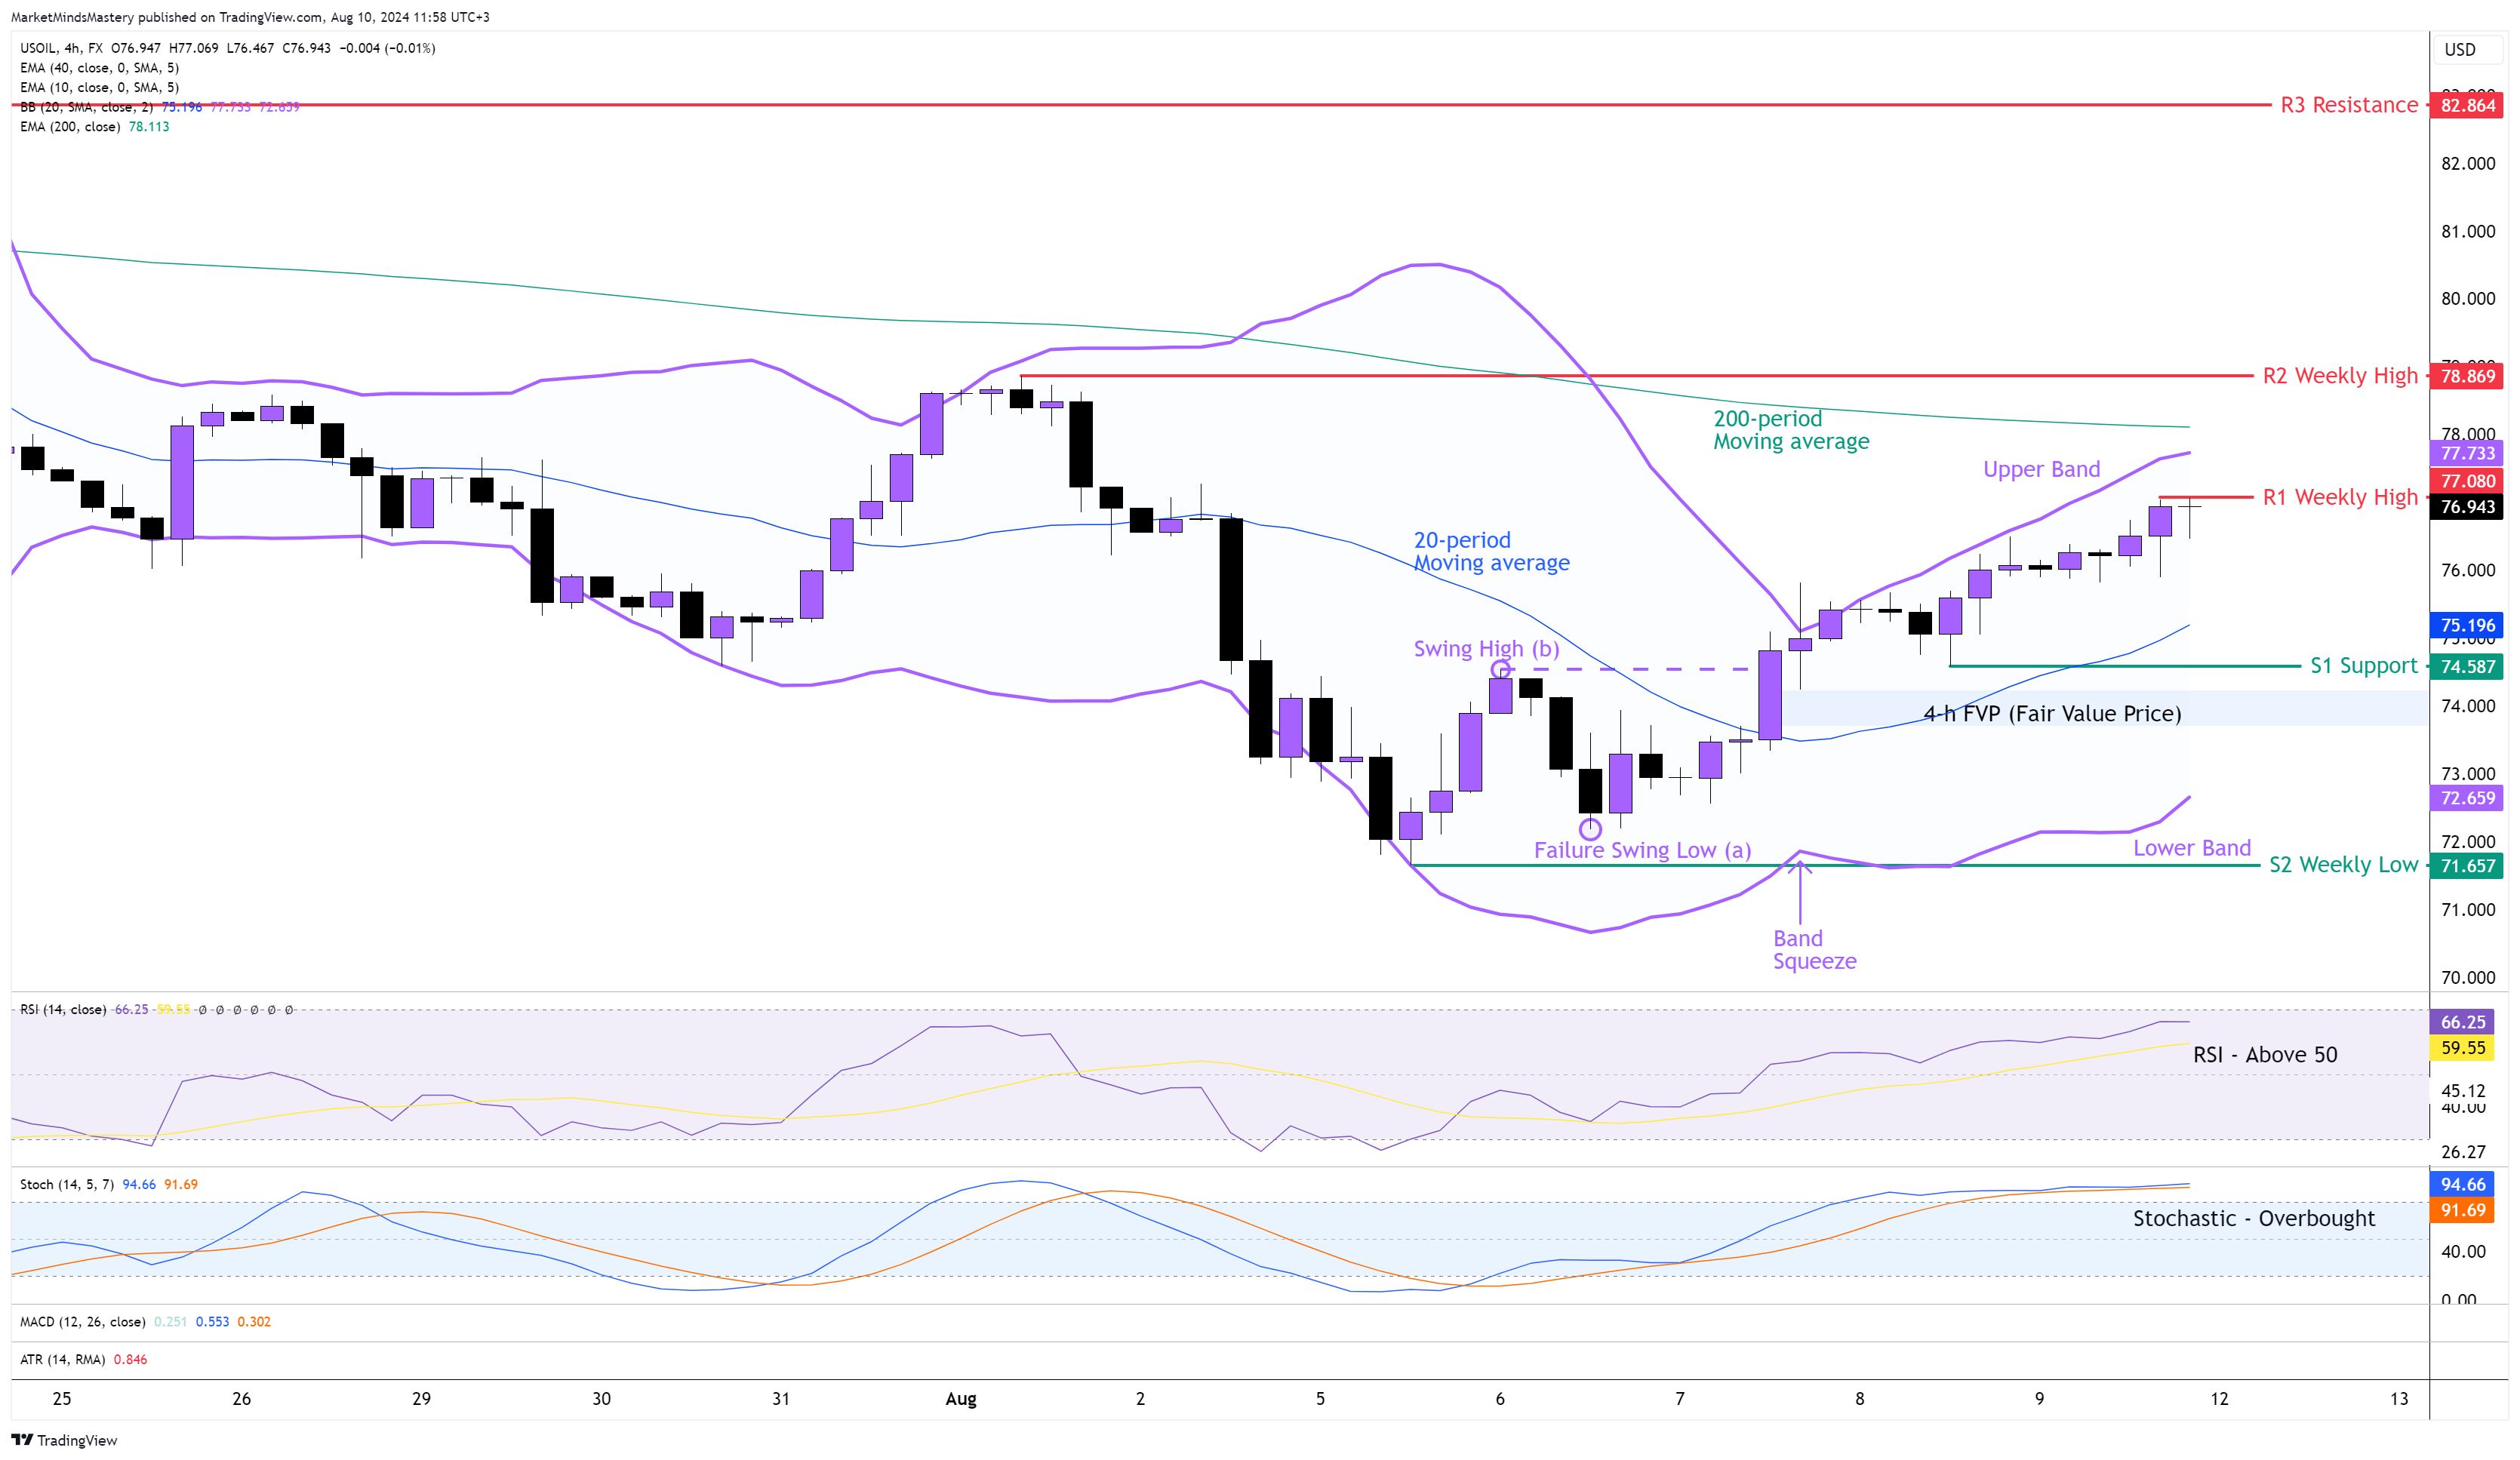
Following the previous week’s Market Outlook, the price of the USOIL created a Bullish Reversal Price action on the weekly chart, and the price since last Tuesday has moved upwards. On the 4-hour chart, as per the swing analysis, the price created a Failure Swing Low at point (a), followed by a change of market structure. This ended the downtrend that started in the middle of July. Currently, the price is above the 20-period moving average, which is the middle line of the Bollinger Band Indicator and is also close to the upper band area, which is considered bullish. In addition to that, the RSI is above its middle line of 50, and this has bullish implications. The Stochastic Oscillator has been in an Overbought condition since last Thursday, and this is also a bullish indication. Therefore, if the price continues to move upwards, the first resistance area, R1, will be around the previous week's close at $77.08. If the price penetrates the R1 and keeps increasing, the next resistance area, R2, will be the previous week’s high at $78.86. The 200-period moving average plotted around $78 can be a dynamic resistance for the price.
Conversely, if the price declines and moves downwards, the first support area, S1, will be around $74.58. This price level is around the 20-period moving average and close to the FVP created last Wednesday. If the price penetrates the S1 and declines further, the next support area, S2, will be the previous week’s low, around $71.65, which also coexists with the lower band of the Bollinger Band indicator.
BTC USD 4H
Last Monday, Bitcoin’s price dropped below $50000, drawing buy orders in the market. Therefore, the imbalance between buy and sell orders at that price level was the main reason for the price of Bitcoin to move higher. The weekly candle ended as a Bullish candle with a long lower wick. As the price has not broken any significant market structure on the weekly chart, the primary trend is considered to be an uptrend.
On the 4-hour chart, the price was found to be resistant at the 200-period moving average, and the price is now between the 50-period and the 200-period. However, the 50-period is below the 200-period, and this has bearish implications. The RSI is above 50, and this is a bullish indication. The MACD and its Histogram are both above its zero line, and this has bullish implications. As the RSI and the MACD calculate much fewer periods than the two moving averages we mentioned above, this indicates that the price action in the short term leads to more buying orders than sell orders. Hence, if the price continues to move upwards and surpasses the 200-period moving average, the first resistance R1 will be the previous week’s high, around $62700. If the price penetrates the R1 and keeps increasing, the next resistance area, R2, will be around $65500. A further upward move will find the next resistance, R3, around $70000. In case the price is rejected and moves downwards, the first support area, S1, will be an Inside support around $57720. This is between the FVP and the Bullish Engulfing Order Block. If the price penetrates the S1 and keeps lowering, the next support area, S2, will be around $54500, and the next support area, S3, will be around $49111, which is the previous week’s low.
SP 500 4H
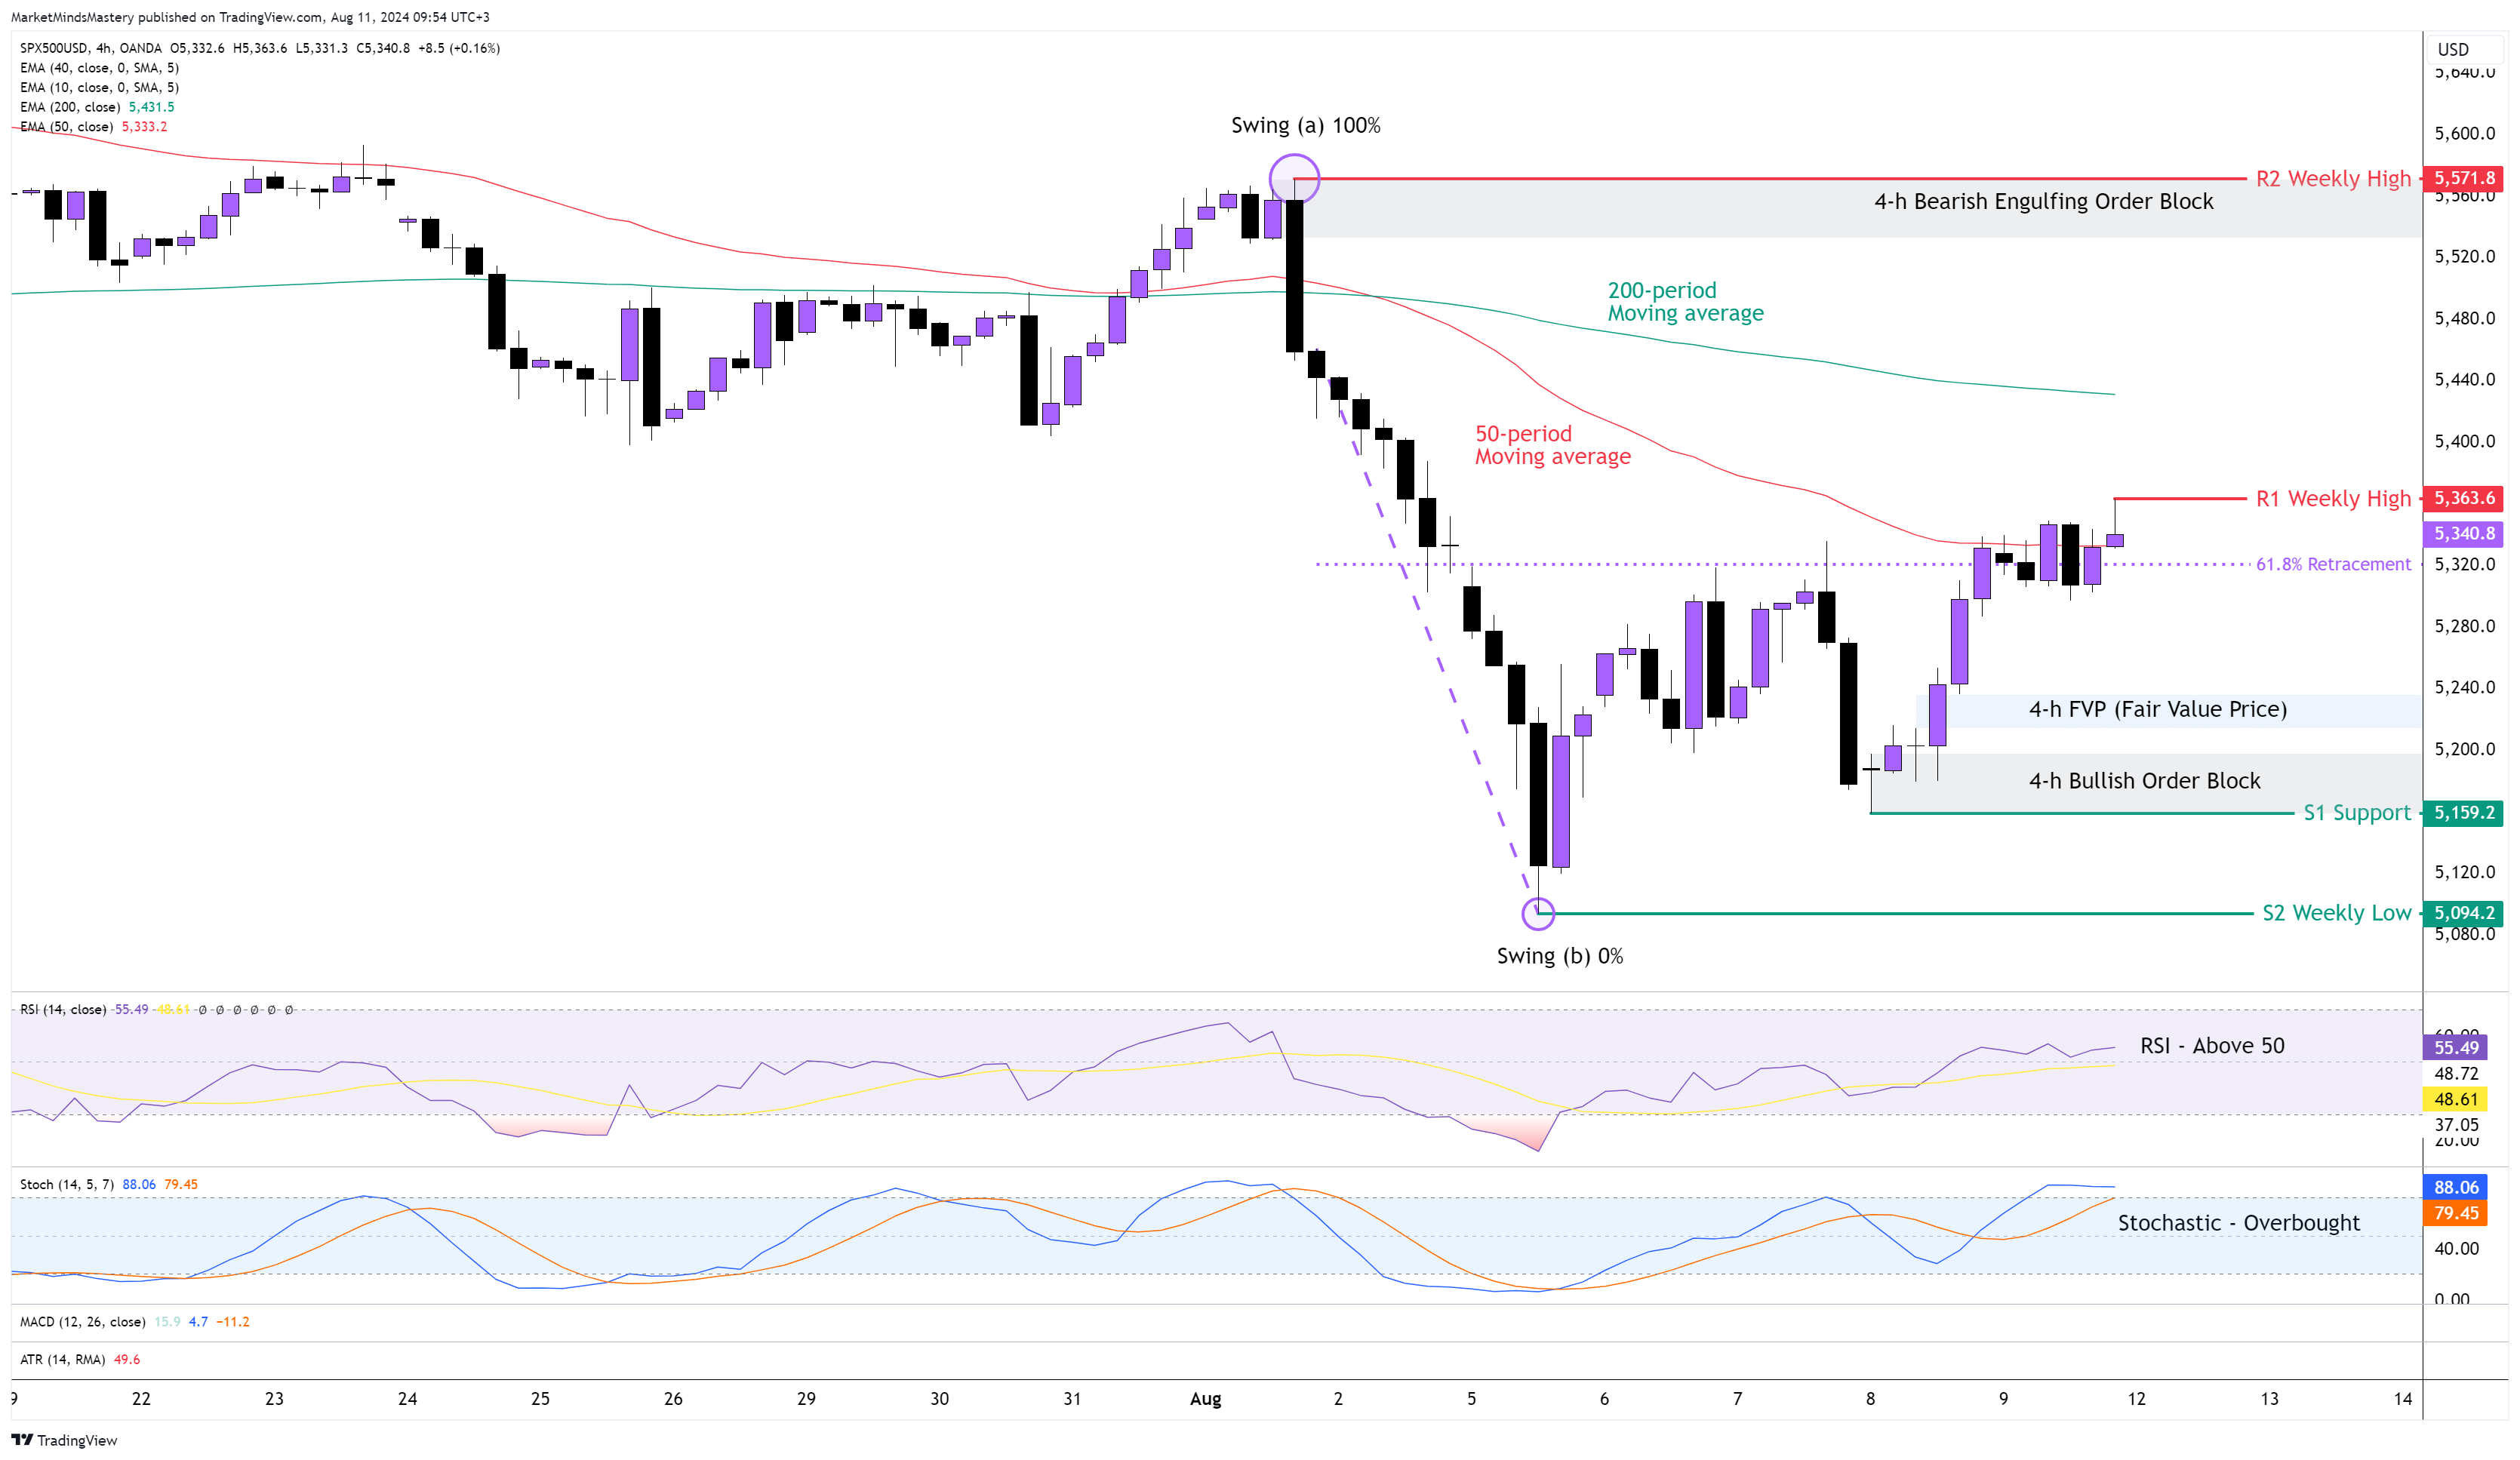
The SP500 followed the decline as all the US Indices last Monday traded until $5080 and then bounced off and moved upwards, creating a Bullish Hammer on the weekly chart that has a long lower wick. On the weekly chart, although we don’t show it here, the same price action rejected the 40-period moving average, which has bullish implications. On the 4-hour chart, the price created a Bullish Order Block of around $5200 and an FVP (Fair Value Price) of around $5220. The 50-period is below the 200-period moving average, and this is bearish. The RSI is above 50, and it has bullish implications. The Stochastic Oscillator is in an overbought condition, and this is bullish. The price retraced approximately 61.8% of its move from Swing point (a) to the Swing point at (b), and it is currency around $5340. Therefore, if the price is rejected and moves downwards, the first support area, S1, will be around $5159. In case the price penetrates the S1 and keeps lowering, the next support area, S2, will be the previous week’s low, around $5094. Oppositely, if the price on the 4-hour chart follows the weekly Bullish price action and moves upwards, the first resistance area, R1, will be the previous week’s high, around $5363. If the price penetrates the R1 and keeps increasing, the next resistance area, R2, will be another weekly high of approximately $5571.
US 30, 4H
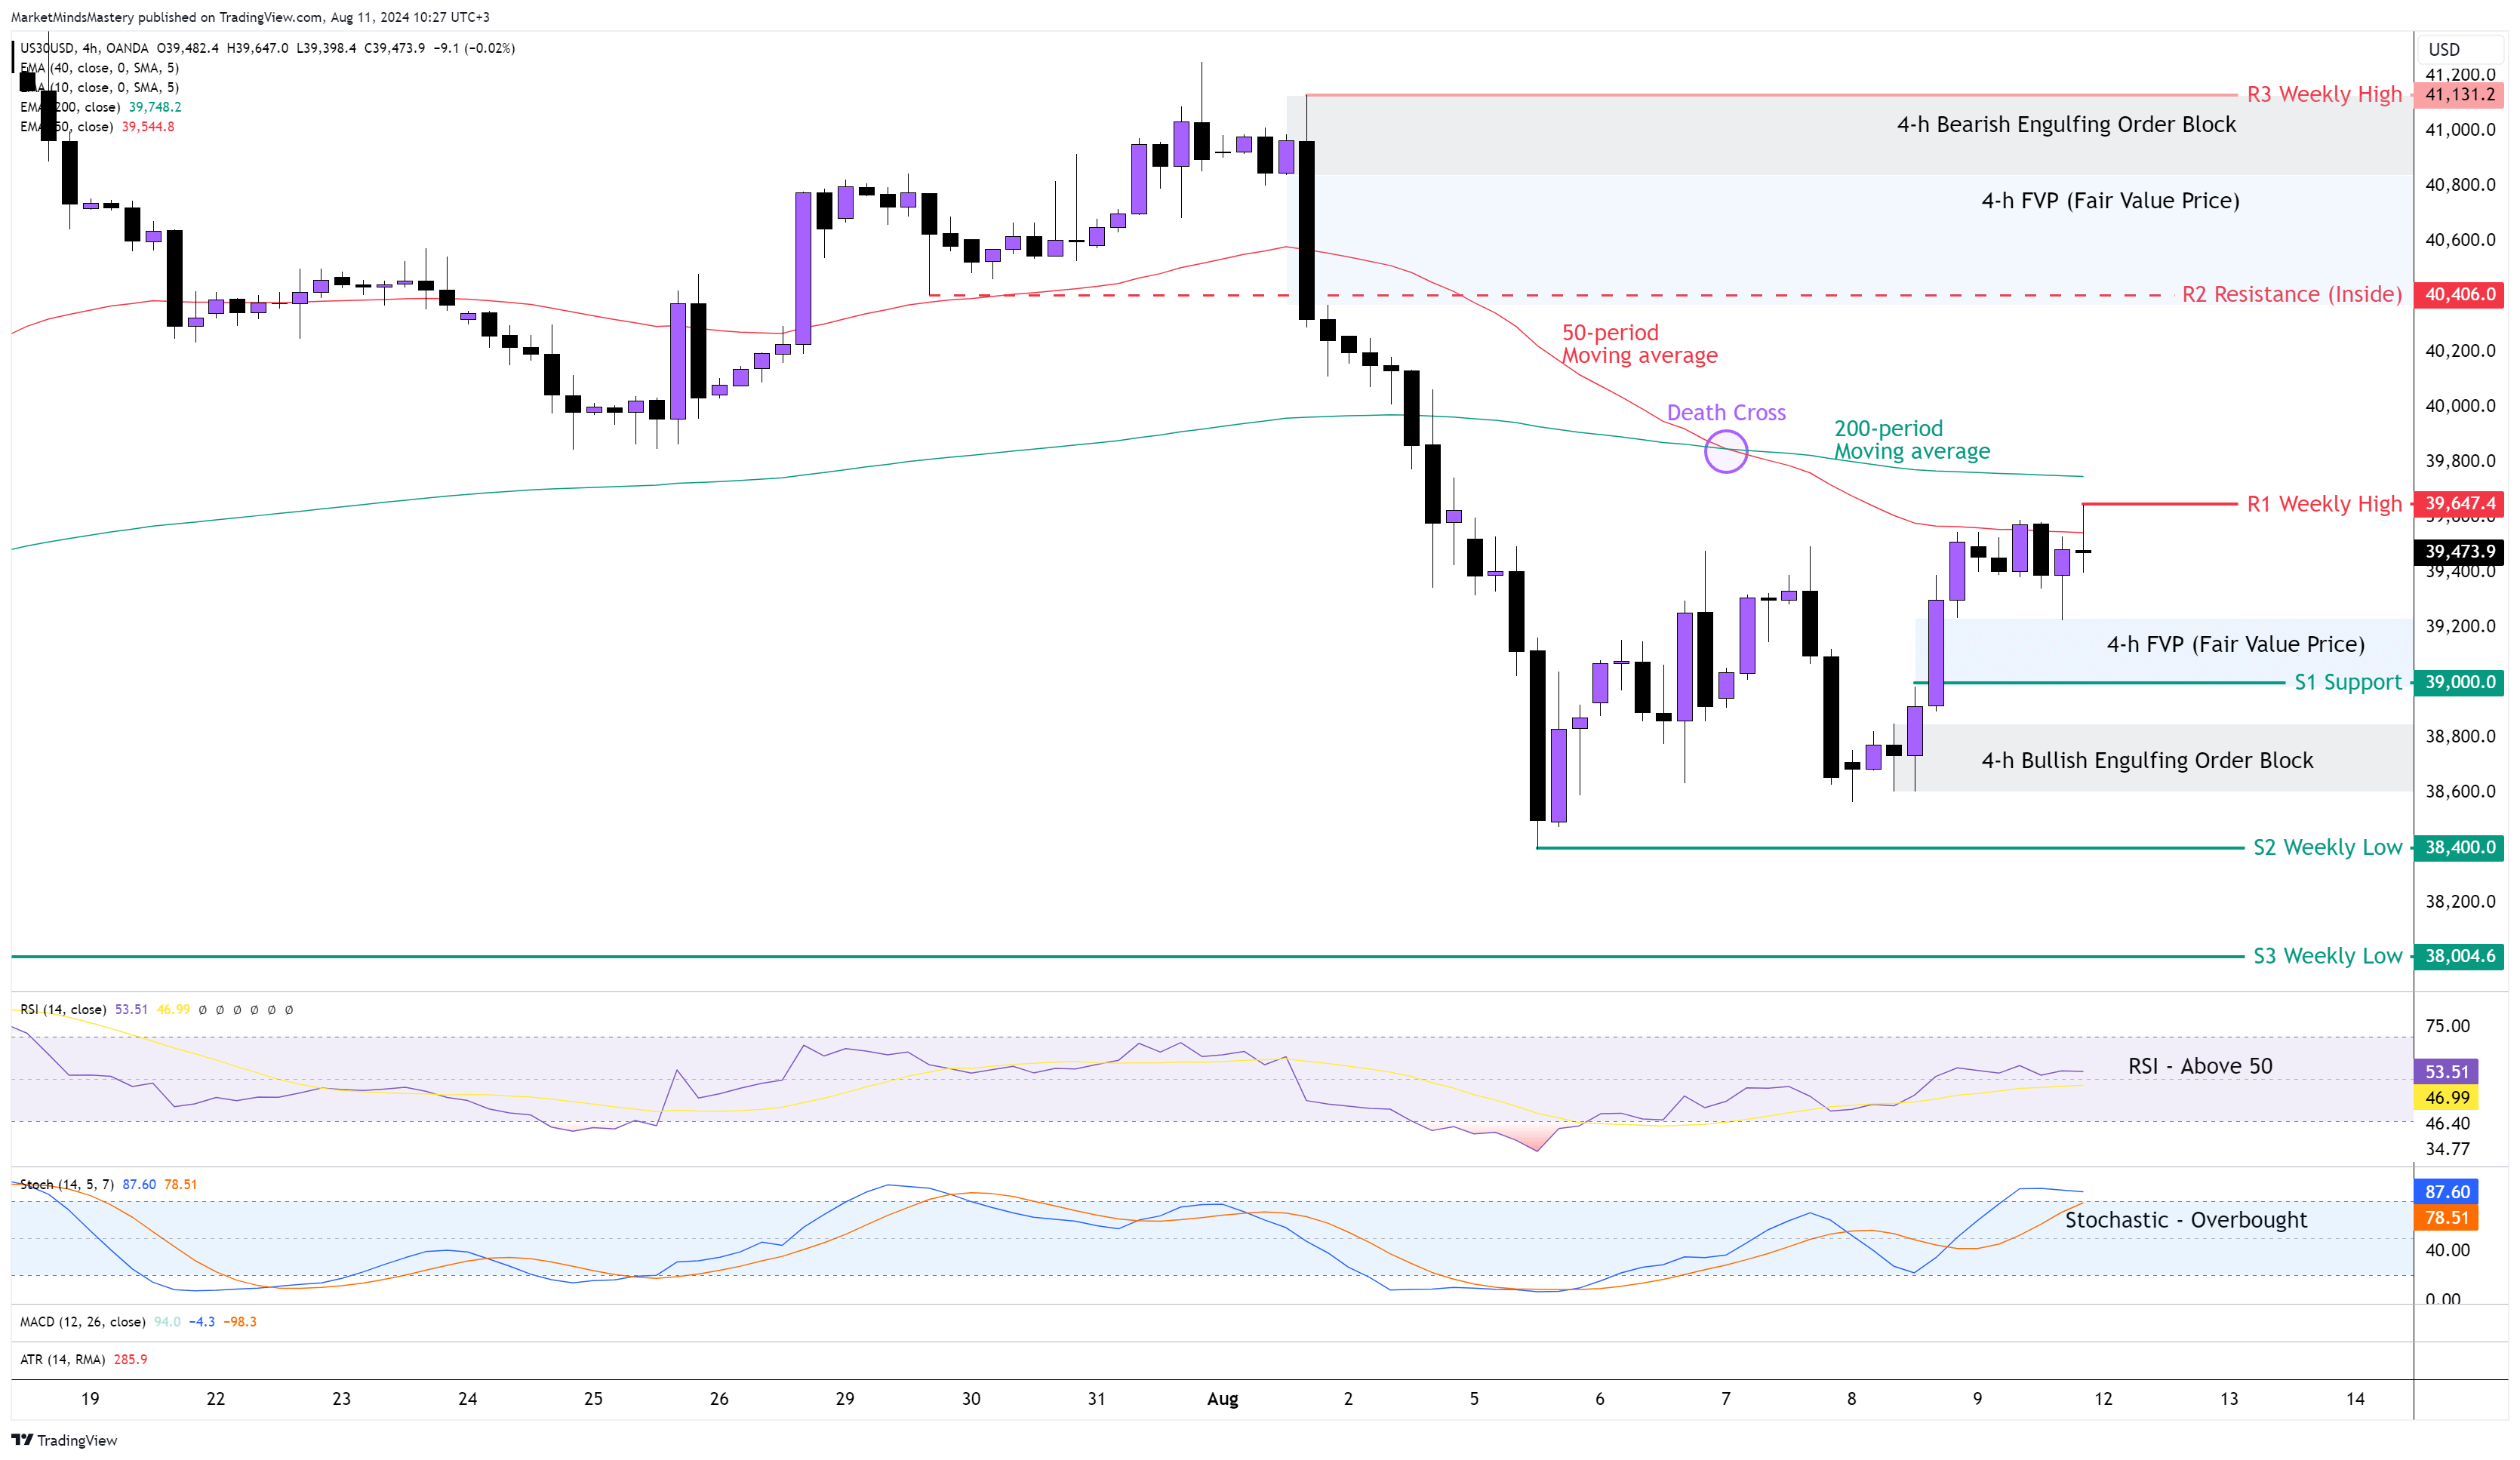
The US30 had a lower price range from the other major US Indices last week. Following the previous week’s Market Outlook, last Monday, the price kept lowering until $39400, where it found support, and then it moved upwards until the 50-period moving average, where it is currently. Last Wednesday, the 50-period crossed below the 200-period moving average, known as the “Death cross”, and it is among the bearish indications. The RSI is above 50, and during the last 15 periods, buy orders primarily drove the market. Additionally, the Stochastic Oscillator, which reacts faster to price changes, has already entered into its Overbought area. Starting Monday, if the price remains below the 50-period moving average and moves downwards, the first support area, S1, will be $39000. It is a round number, and on the price chart, it is below the FVP and above the Bullish Engulfing Order Block created last Thursday. If the price penetrates the S1 and declines further, the next support, S2, will be the previous week’s low, around $38400. On the other hand, if the price penetrates the 50-period moving average and moves upwards, the first resistance area, R1, will be the previous week’s high, around $39647. If the price penetrates the R1 and keeps moving upwards, the next resistance area, R2, will be the inside resistance at around $40406.
GER 30, 4H
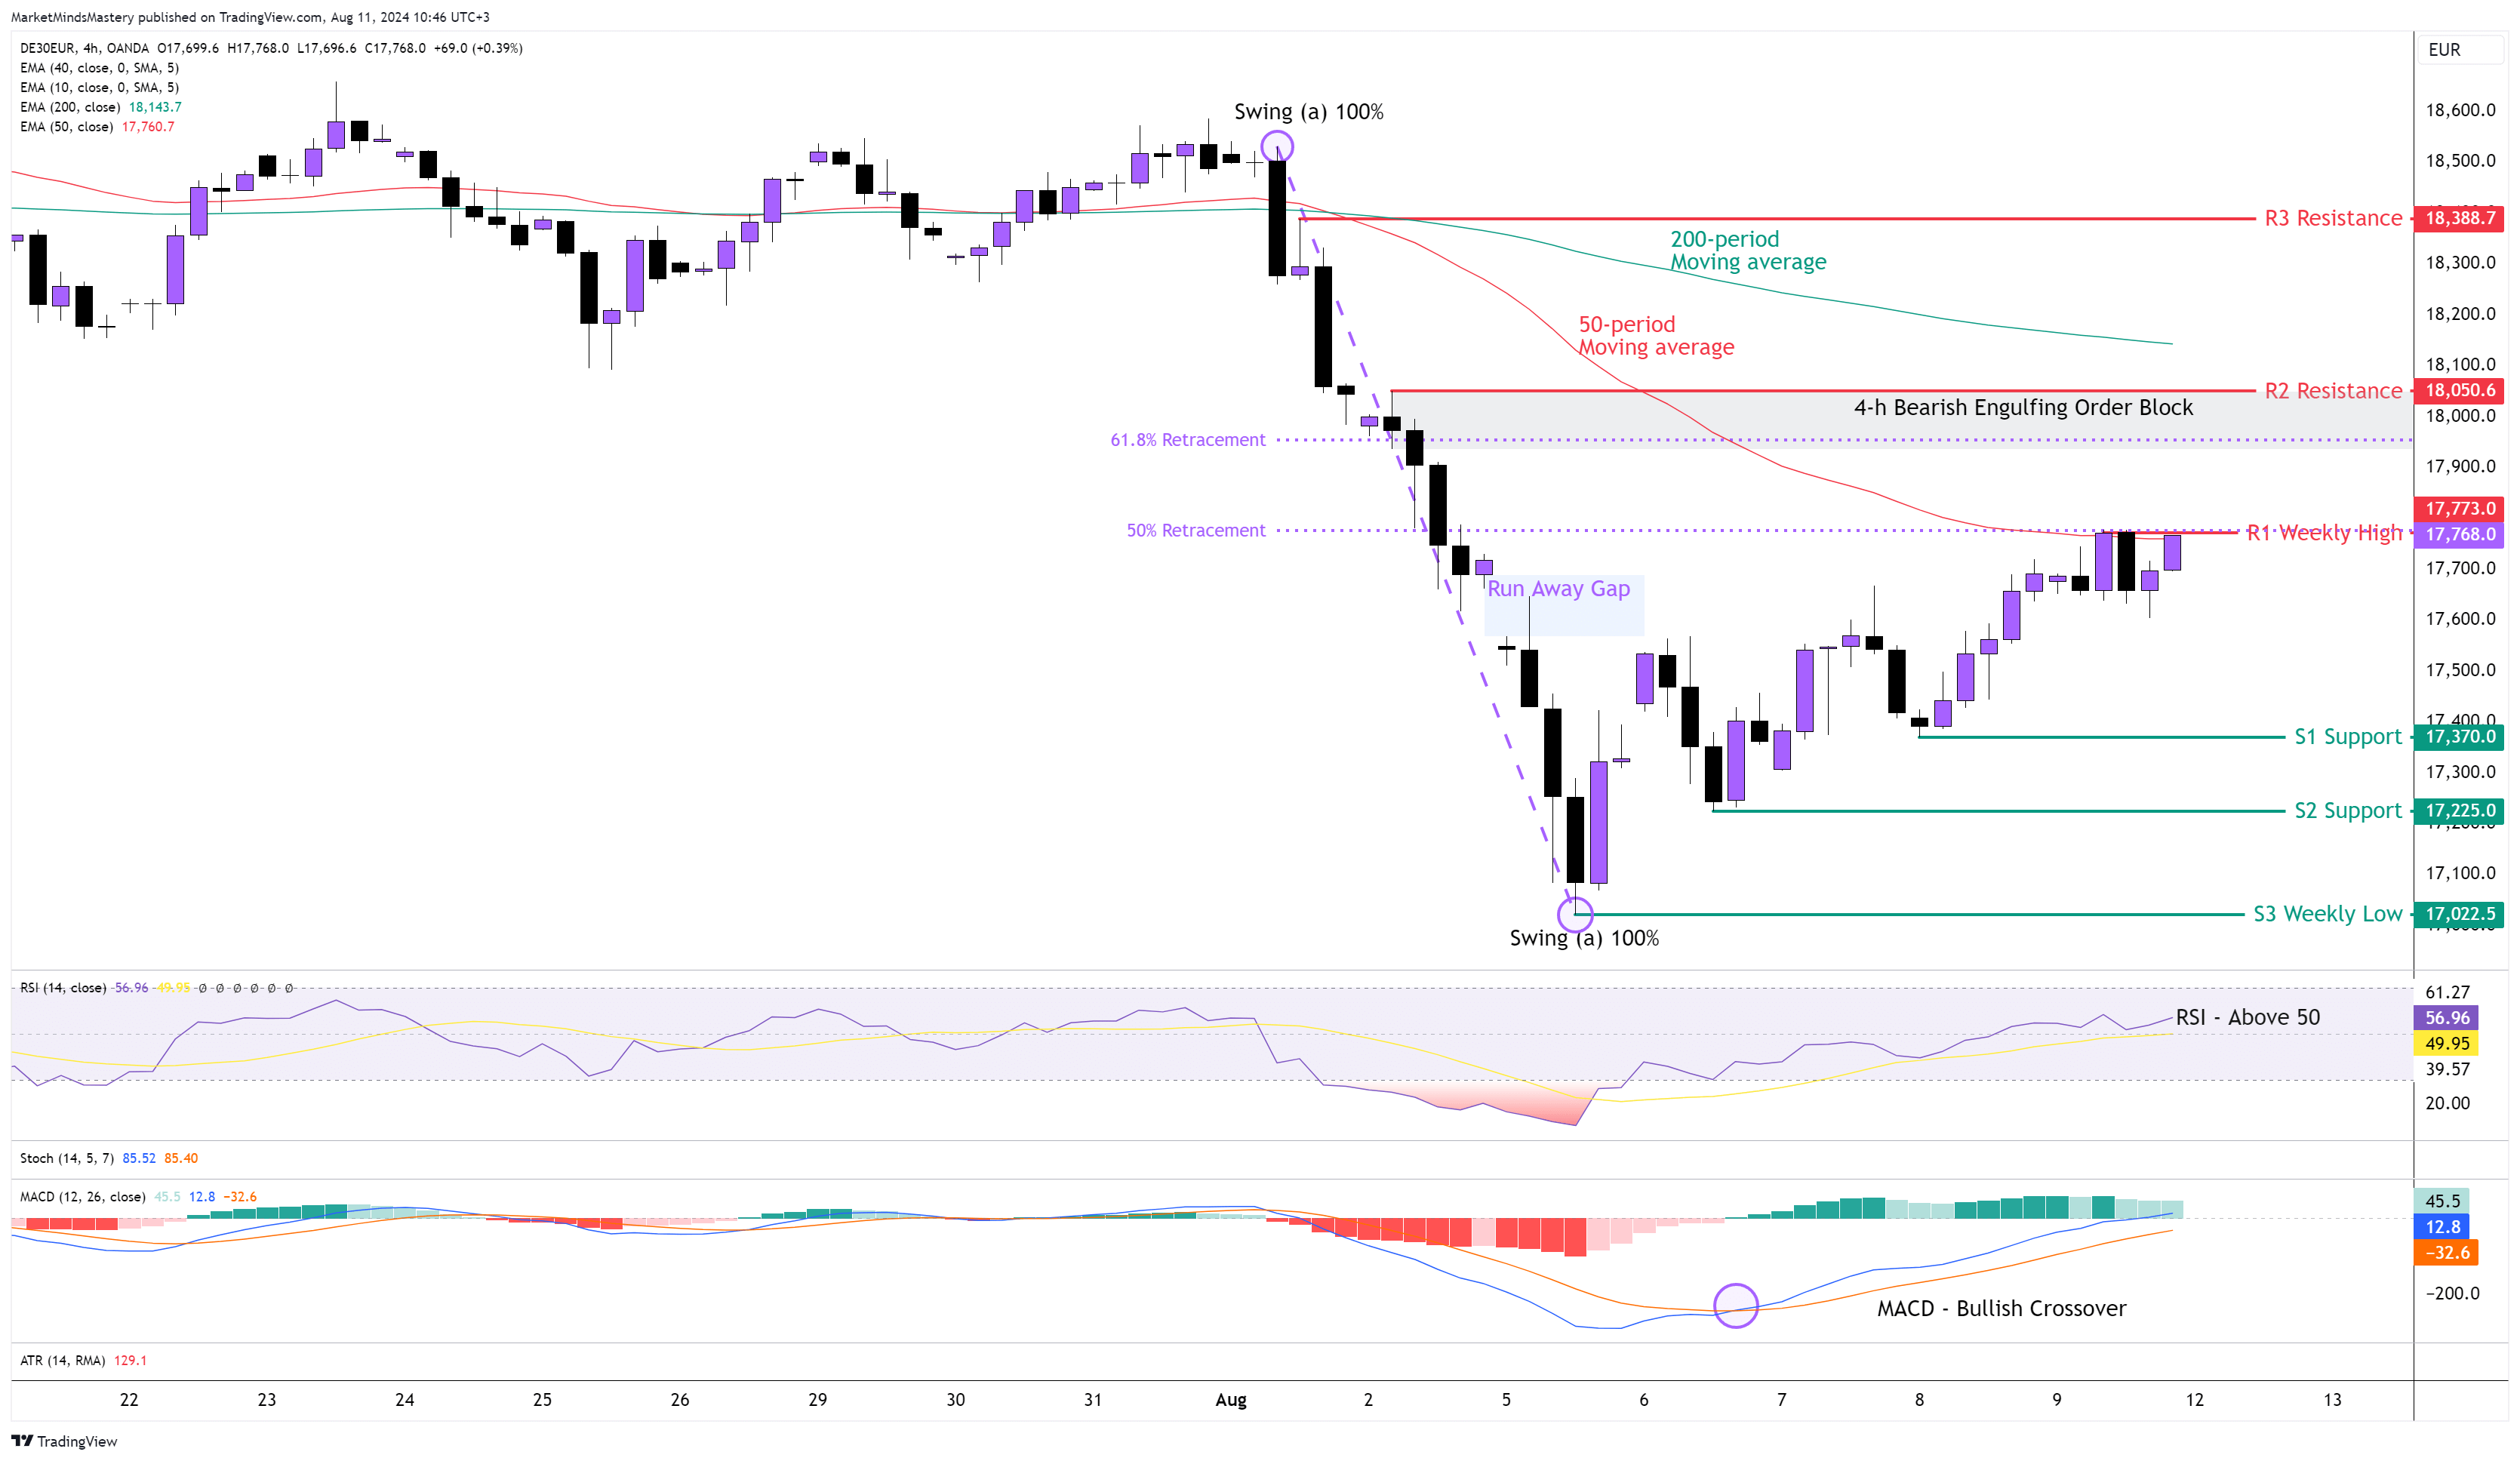
Following the previous week’s decline, the price of the GER30 kept lowering last Monday, creating a Run Away Gap that filled within the same day. The Runaway Gap is usually found during a strong trend. It signals that the trend is already halfway to its final destination. Although we can not be 100% sure when a trend will come to an end, we can estimate based on this information until we can trade positions with the trend. The weekly candle created a Hammer reversal price action pattern. The RSI Oscillator is above 50, which is bullish. The MACD created a Bullish crossover as the MACD Line (Blue) crossed above the Signal Line (Orange) while the indicator was below zero and far away from it. The Bullish crossover indicates that the price will most likely start a corrective phase. Using the Fibonacci retracement tool, from swing (a) to the swing point at (b), the price has retracted by 50% so far. Currently, the price is at the 50% Fibonacci retracement level, which is 17768, and it coexists with the 50-period moving average and the R1, which is the previous week’s high. Therefore, if the price follows the weekly Bullish hammer from Monday onwards, and the price moves upwards, the next resistance area, R2, will be the $18050, a level that a few weeks ago created a Bearish Engulfing Order Block. A further upward move will find the next resistance area, R3, around 18388. Oppositely, suppose the price declines and moves downwards, then the first support area, S1, will be the 17370 as it is the most recent swing low. If the price penetrates the S1 and keeps lowering, the next support area, S2, will be the 17225, and the S3 will be the 17022, which is the previous week’s low.