The Trading Pit Week Ahead Market Outlook (May 20 – May 26)
Last week, the drop in the Consumer Price Index in the US caused the Dollar weakness and helped the Euro, the Sterling, the Aussie, and the rest penetrate critical price levels. A noticeable advance came in the Sterling because of the significant decrease in the number of people seeking unemployment benefits in the UK, strengthening the Sterling. The CPI in the US caused weakness in the US Dollar. Therefore, the GBPUSD lifted higher.
Because of the Whit Monday celebrations, the banks will be closed on Monday in Switzerland, Germany, France, and Canada due to Victoria Day. This will affect their Indices trading and not their currencies. More volatility is expected during the New York trading session.
On Tuesday, the volatility is expected to pick up. Starting from the Sydney trading session, the Meeting Minutes by the RBA (Reserve Bank of Australia) will be the day's first event. Usually, this gives us a good understanding of how well or not the Australian economy is doing and why they kept the interest rates unchanged for this month at 4.35%. One of the primary leading indicators in Australia's economy is the housing demand. Canada's CPI (Consumer Price Index) will be the next significant event. The Consumer Price Index report is a leading indicator of the economy’s health. The Bank of Canada is expecting a lower number than the last report. In the previous announcement, the CPI in Canada was 2.9%, and this time, it is likely to drop to 2.8%. If this happens and the market follows through, the Canadian dollar can fall against the other currencies. This will likely impact the USOIL performance. Although we don't usually analyse many cross-currency pairs, the Technical picture of the AUDCAD shows a Bullish Engulfing on the weekly chart, which, with a lower CPI, can add more to the Canadian dollar’s weakness. Towards the New York trading session, the Bank of England Governor Bailey will host a speech.
Wednesday will be the most volatile day the market is expected to experience this week. The RBNZ (Reserve Bank of New Zealand) will report the interest rates early in the morning. The forecast estimates the rates to stay at the current 5.5%. It is not unusual to see weakness in the currency when the interest rates remain unchanged. It does not show economic expansion. Therefore, investors are trying to avoid additional or large deposits into the country. The Monetary Policy will released around the same time. The next significant event will be the CPI in the UK. The consensus estimated a significant drop from 3.2% to 2.1%. This will primarily indicate Sterling’s performance if the outcome confirms the forecast and the market follows through. The Sterling will likely set for a significant drop, which will be visible on the charts. Last will be the FOMC Meeting Minutes. The event takes place in the US, and we will clearly understand what the FEDs will likely do with the country’s interest rates next month.
Towards the end of the week, and on Thursday, the Eurozone will report the Manufacturing PMI (Purchase Manufacture Index) Prelim, which is expected to increase slightly but will remain under the benchmark 50, the Service PMI to rise and hold above 50, and the Composite PMI which is also forecasted to increase and be above 50. Thirty minutes later, the same events will be reported in the UK, with the Composite PMI holding around 54, the Manufacture PMI around 49.4 and the Service PMI around 54.7. Moving into the US trading session, the unemployment claims are forecasted to drop from 222K to 221K. Less than an hour later, they will report the Composite and the Service PMI in the US, which are both expected to remain around 51 and the Manufacture PMI to be around 50. This can be considered a bullish sign for the Greenbuck.
Additionally, the annual total new home sales are forecasted to drop from 693K to 678K, and the new home sales for April are forecasted to drop from 8.8% to -1.9%. This indicates that fewer homes sold in April this year than last year’s, which is considered bearish for the Dollar. Housing demand is an essential indicator of the economy’s growth and is a significant metric for the country’s CPI reports. New home sales are expected to drop when the interest rates are high, and consumers usually look for rentals instead of buying new homes.
Moving into the week's last trading day, there will be two speeches on Friday. First, during the Sydney trading session, the Reserve Bank of New Zealand Governor Adrian Orr will give a speech about the Monetary Policy of the current month. Second, during the European trading session, the Swiss National Bank’s Chairman Jordan’s speech will also be about the Monetary Policy and the future of the Swiss Franck. In Japan, CPI is expected to drop from 2.7% to 2.4%. The outcome will be reported around the Asian trading sessions, and the volatility is expected to pick up on all Japanese Yen pairs. If the actual number will be as per the forecast or less, Yen’s weakness is very likely. Particularly, the USDJPY and the GBPJPY can take advantage of this and push prices higher against the Japanese Yen.
Next, it is the UK’s turn to report the Retail Sales, and the forecast estimated a drop to 0.2% compared to the 0% on the last report. Generally, the sterling based on the weekly forecasts on the macroeconomic scale is due to weakness. If both the CPI and the Retail Sales will be reported as negative, they will add to Sterling’s weakness.
The last few events will be reported during the New York trading session. In Canada, Retail Sales are expected to remain the same as in the most recent report at -0.1%, and in the US, the Durable goods order is expected to drop from 0.9% to 0.5%. It is not a single event that can change the dollar’s trend. However, it is an event that creates high volatility, and intraday traders must keep an eye on it.
EUR USD 4H

Following the bullish momentum built on the 4-hour chart, the price kept its upward move last week, breaking and closing above the weekly’s inside candle. The price formed a series of consecutive higher highs and higher lows. The 50 and 200-period moving averages created a bullish crossover known as the Golden Cross. The RSI is above 50, which has bullish implications. The MACD is also above its zero line, with a bearish crossover shown on the indicator. If the market continues its upward move, the first resistance level, R1, is the previous week’s high, around 1.0895. If the price breaks the level, it will be either with a strong bullish candle or a bullish continuation pattern. If the price successfully penetrates the R1, the next important resistance in the market is the R2, which is another week’s high, around 1.0942.
On the other hand, if the price declines and moves downwards, the first support area, S1, around 1.0812, will be considered as a key level of support because the Upwards Trendline T1, an inside support, the 61.8% Fibonacci retracement, the 50-period moving average, and a Bullish Engulfing Order Block cluster at the same level. A lower move can force the price into the following Bullish Engulfing Order Block consisting of the S2 support, a weekly low, around 1.0765, and the dynamic 200-period moving average.
GBP USD 4H
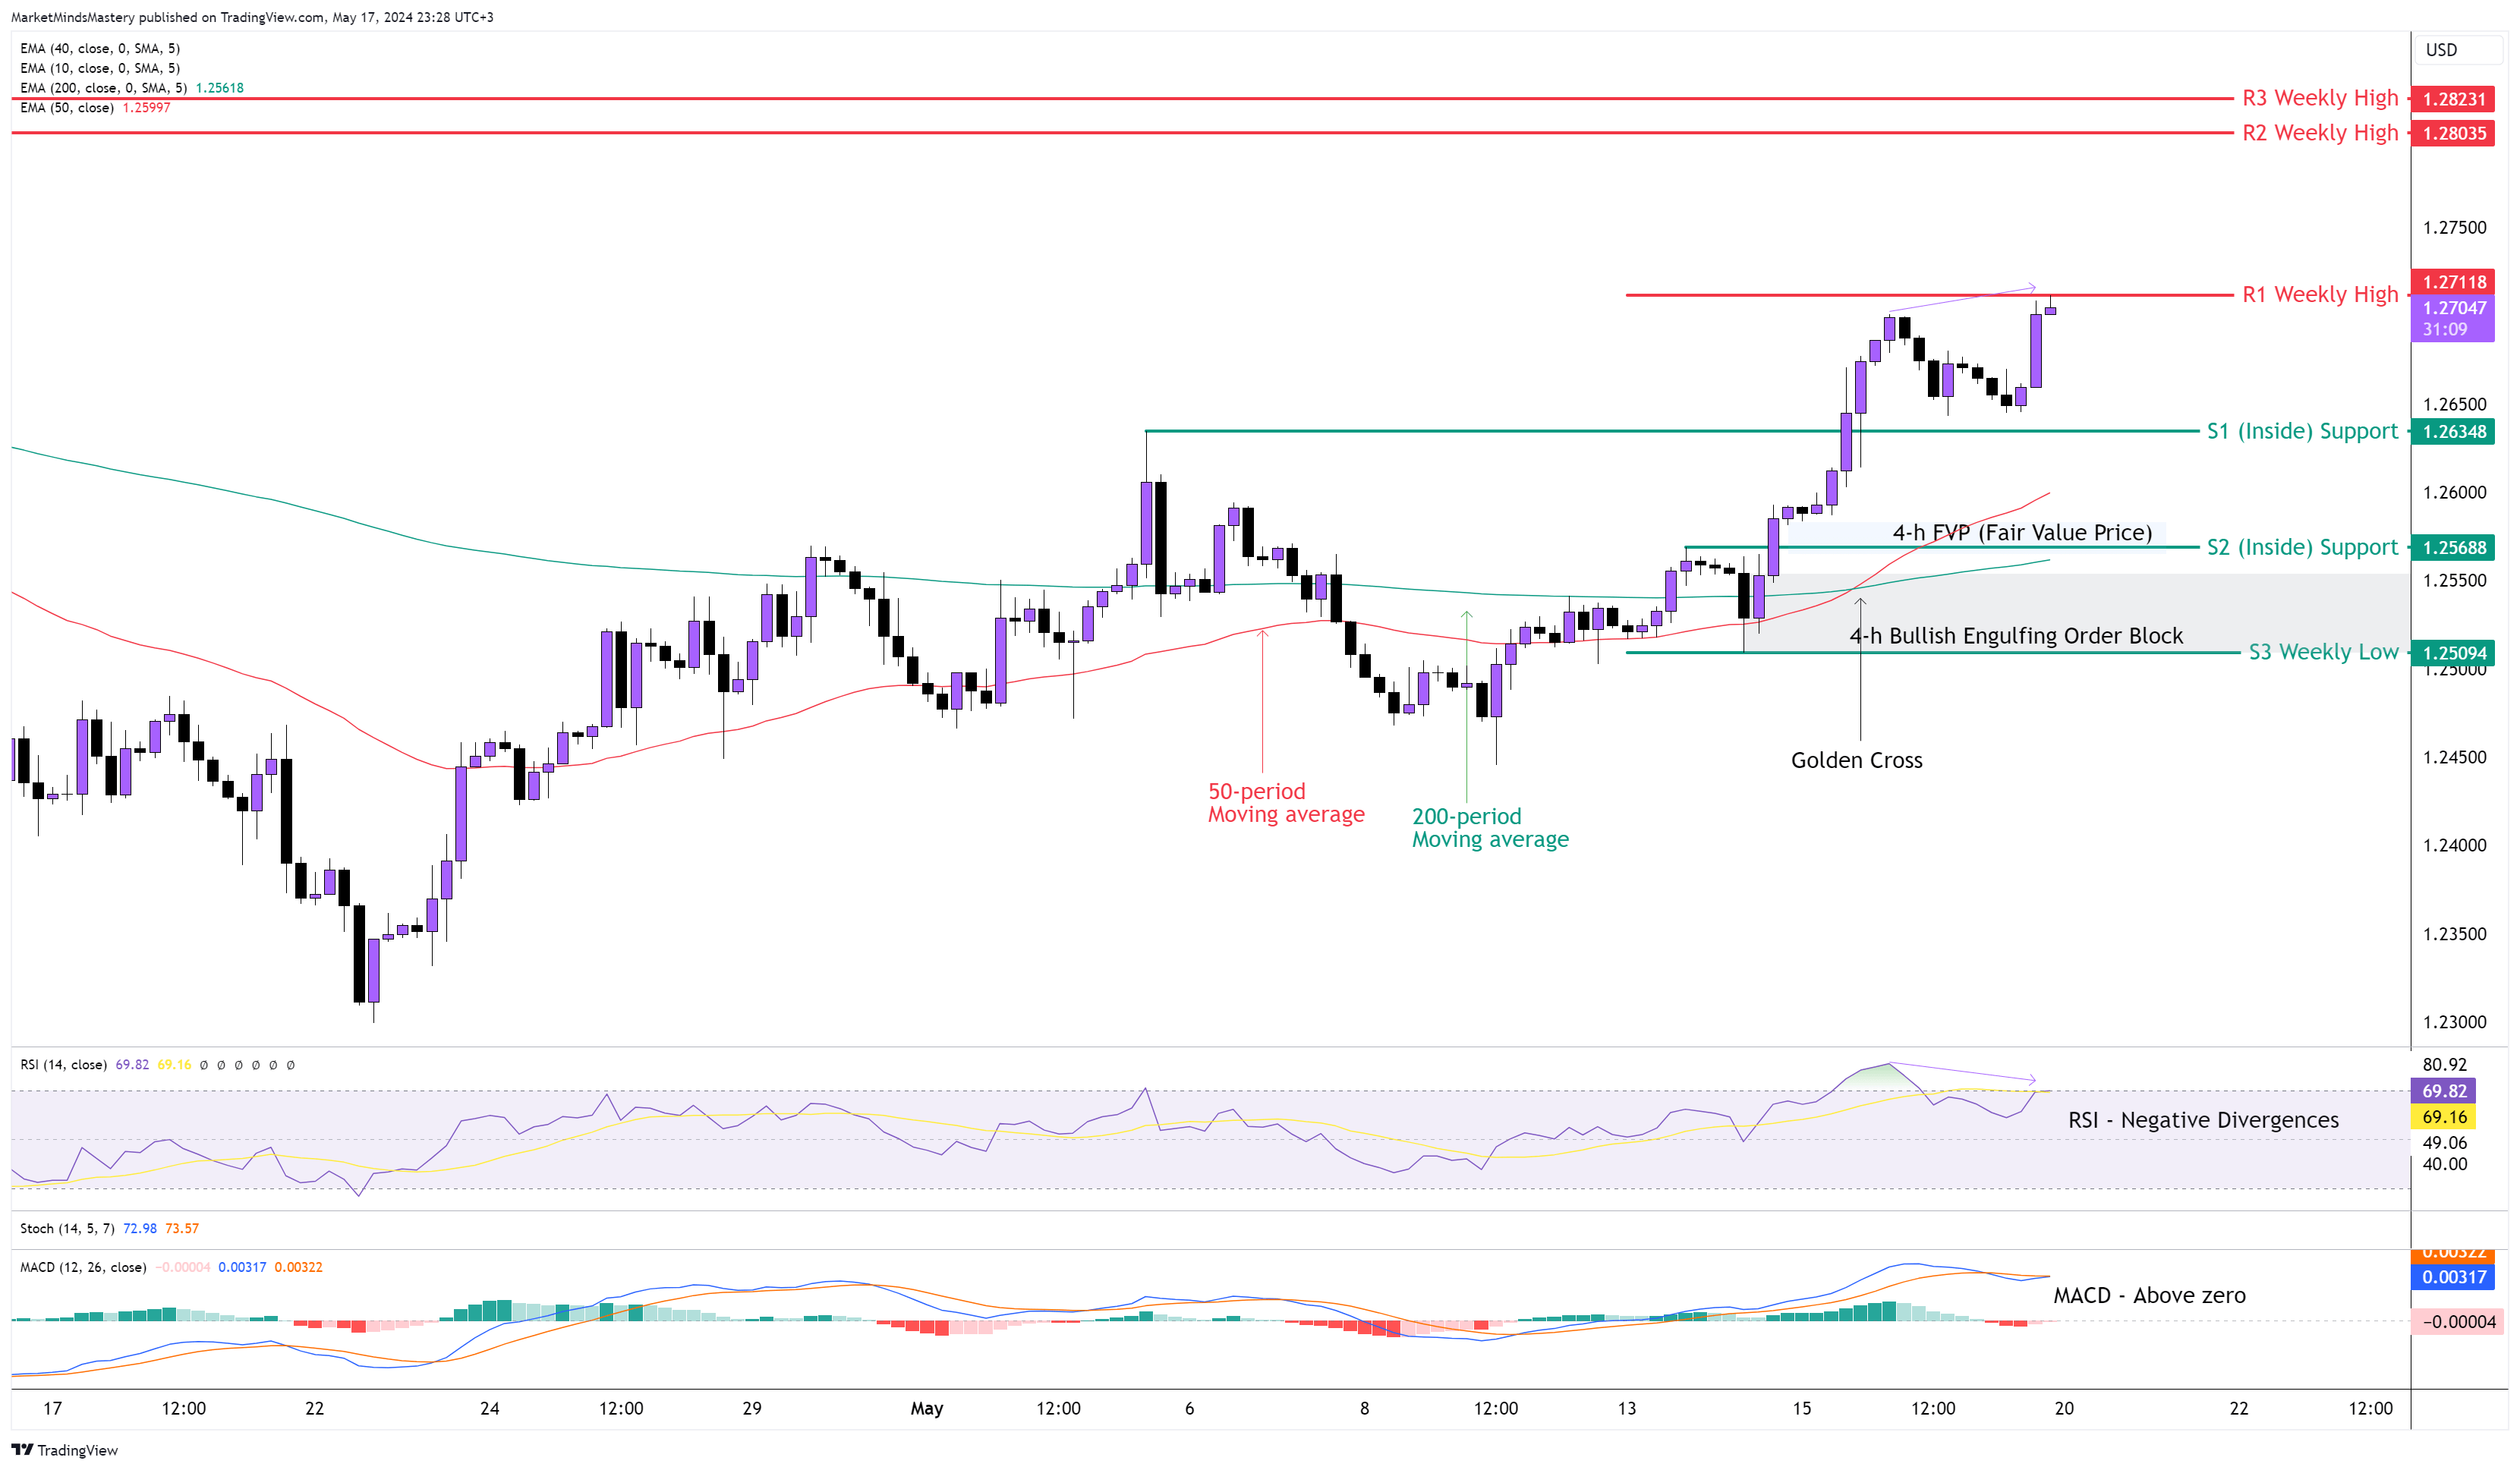
The Sterling's dominance was evident the previous week as not only did it manage to break the high of the Daily’s candle with the upper long wick (as we explained in the last analysis), but also during Friday’s New York trading session, the price created a higher high on the 4-hour chart. Although the new high is followed by the Negative Divergences A’ Class shown on the RSI, the market has a structure of higher highs and higher lows. The MACD is above zero, indicating bullish market sentiment. The 50-period crossed above the 200-period, shown as the Golden Cross on the chart.
Starting Monday, if the market continues to move upwards, the first apparent resistance, R1, is the previous week’s high, around 1.2711. If the price breaks, closes above the R1 and moves upwards, the next resistance area, R2, is around 1.2803. Conversely, if the price moves downwards, the first support area, S1, is an inside support around 1.2634. If the price breaks below the S1 and keeps moving downwards, the next support area is the S2 inside support, around 1.2568. This S2 support sits between the FVP, a significant market area. If the price penetrates the S2 and declines successively, the S3 support is at a weekly low of around 1.2500. A round number which holds a Bullish Engulfing Order Block.
AUD USD 4H
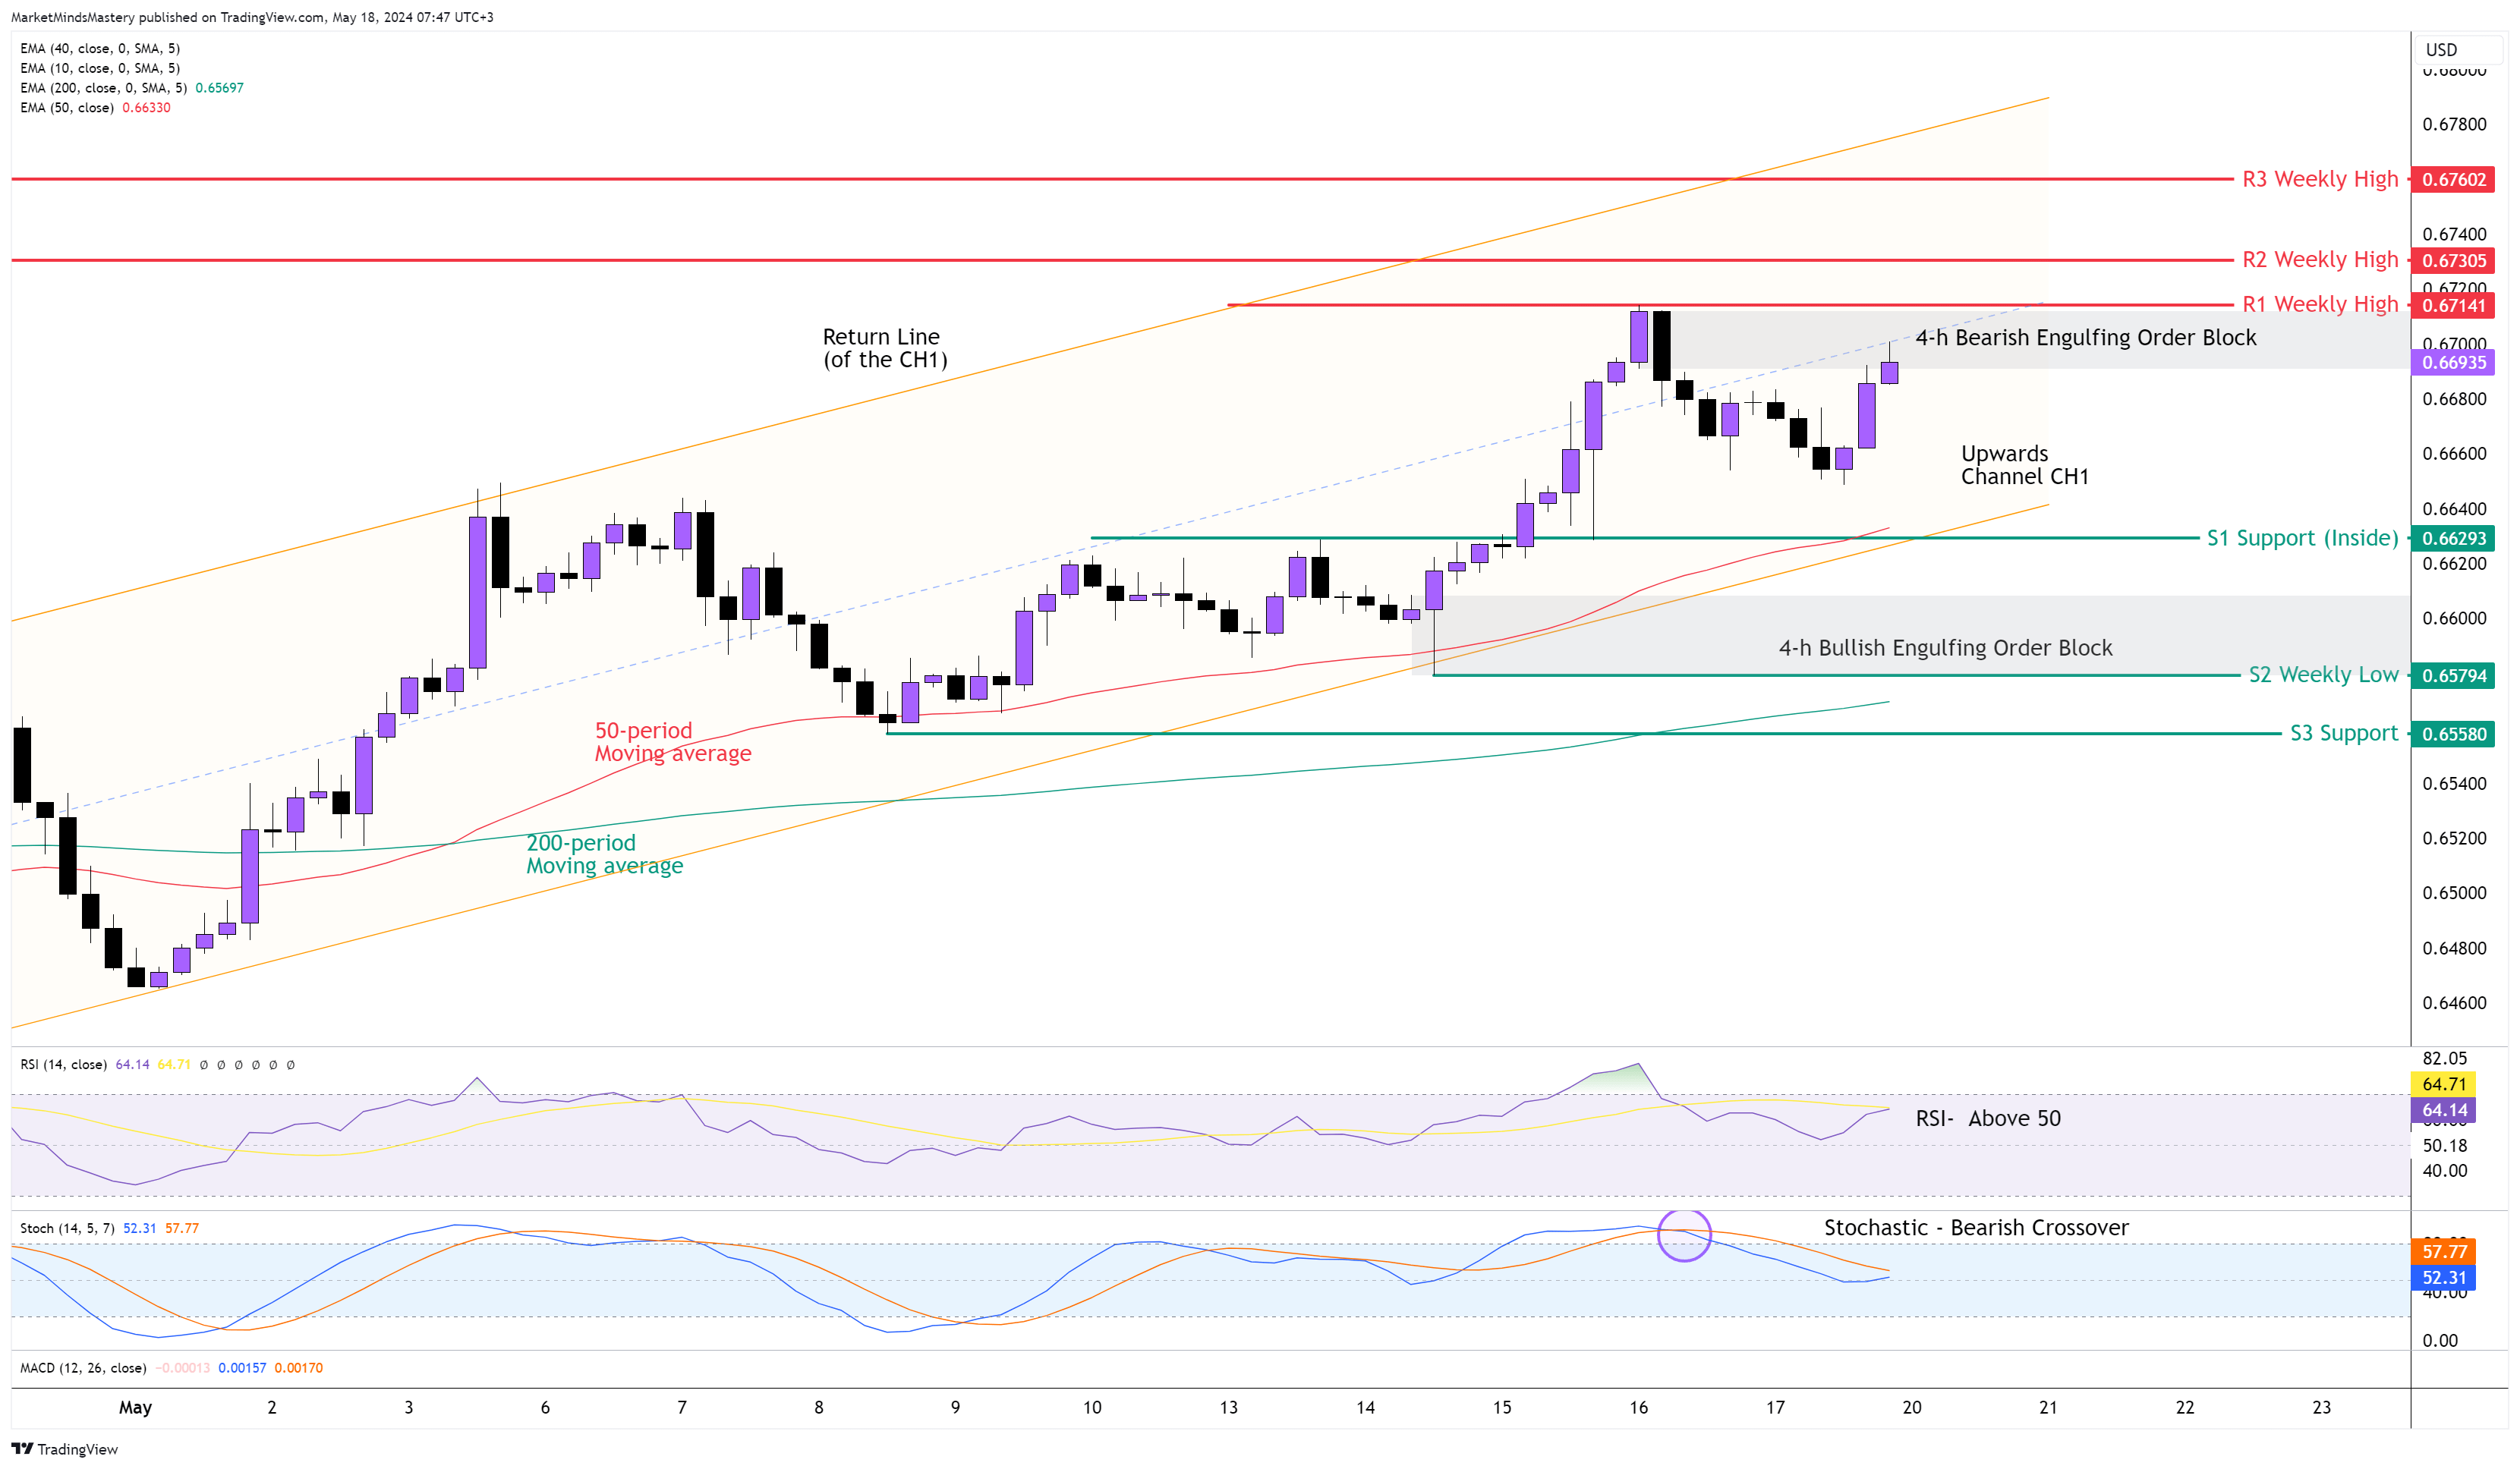
The positive number on the Unemployment Rate in Australia last week helped the Aussie maintain a bullish upward move and formed higher highs and higher lows on the 4-hour chart. The price is trading within a valid Upwards Channel CH1. The Channel’s Trendline tested successfully three times and held. The RSI indicates bullishness as it trades above 50, the middle line. The Stochastic oscillator created a Bearish Crossover, indicating the price correction phase. The 50-period moving average is above the slow 200-period, indicating a bullish sentiment in the currency pair. The price created a Bearish Engulfing Order Block last week, with its highest point being the previous week’s high R1, around 0.6714. The Order Block and the R1 resistance must be penetrated by the price for the uptrend to continue. If the price closes above R1, the next resistance will be the R2 level at around 0.6730, approximately 15 pips above the R1. If the R2 level penetrates successfully, the next resistance, R3, is a weekly high of around 0.6760. Opposively, if the price declines and moves downwards, the first support area, S1, is approximately 0.6629. The level consists of the most recent swing high, the 50-period moving average - considering the market volatility won't change drastically, and the Upward Trendline of the CH1 channel. If the price closes under the S1 and moves downwards, the next support, S2, is the previous week’s low, at 0.6579. The price at this level formed a Bullish Engulfing Order Block, which can cause the price to have a noticeable reaction.
USD JPY 4H
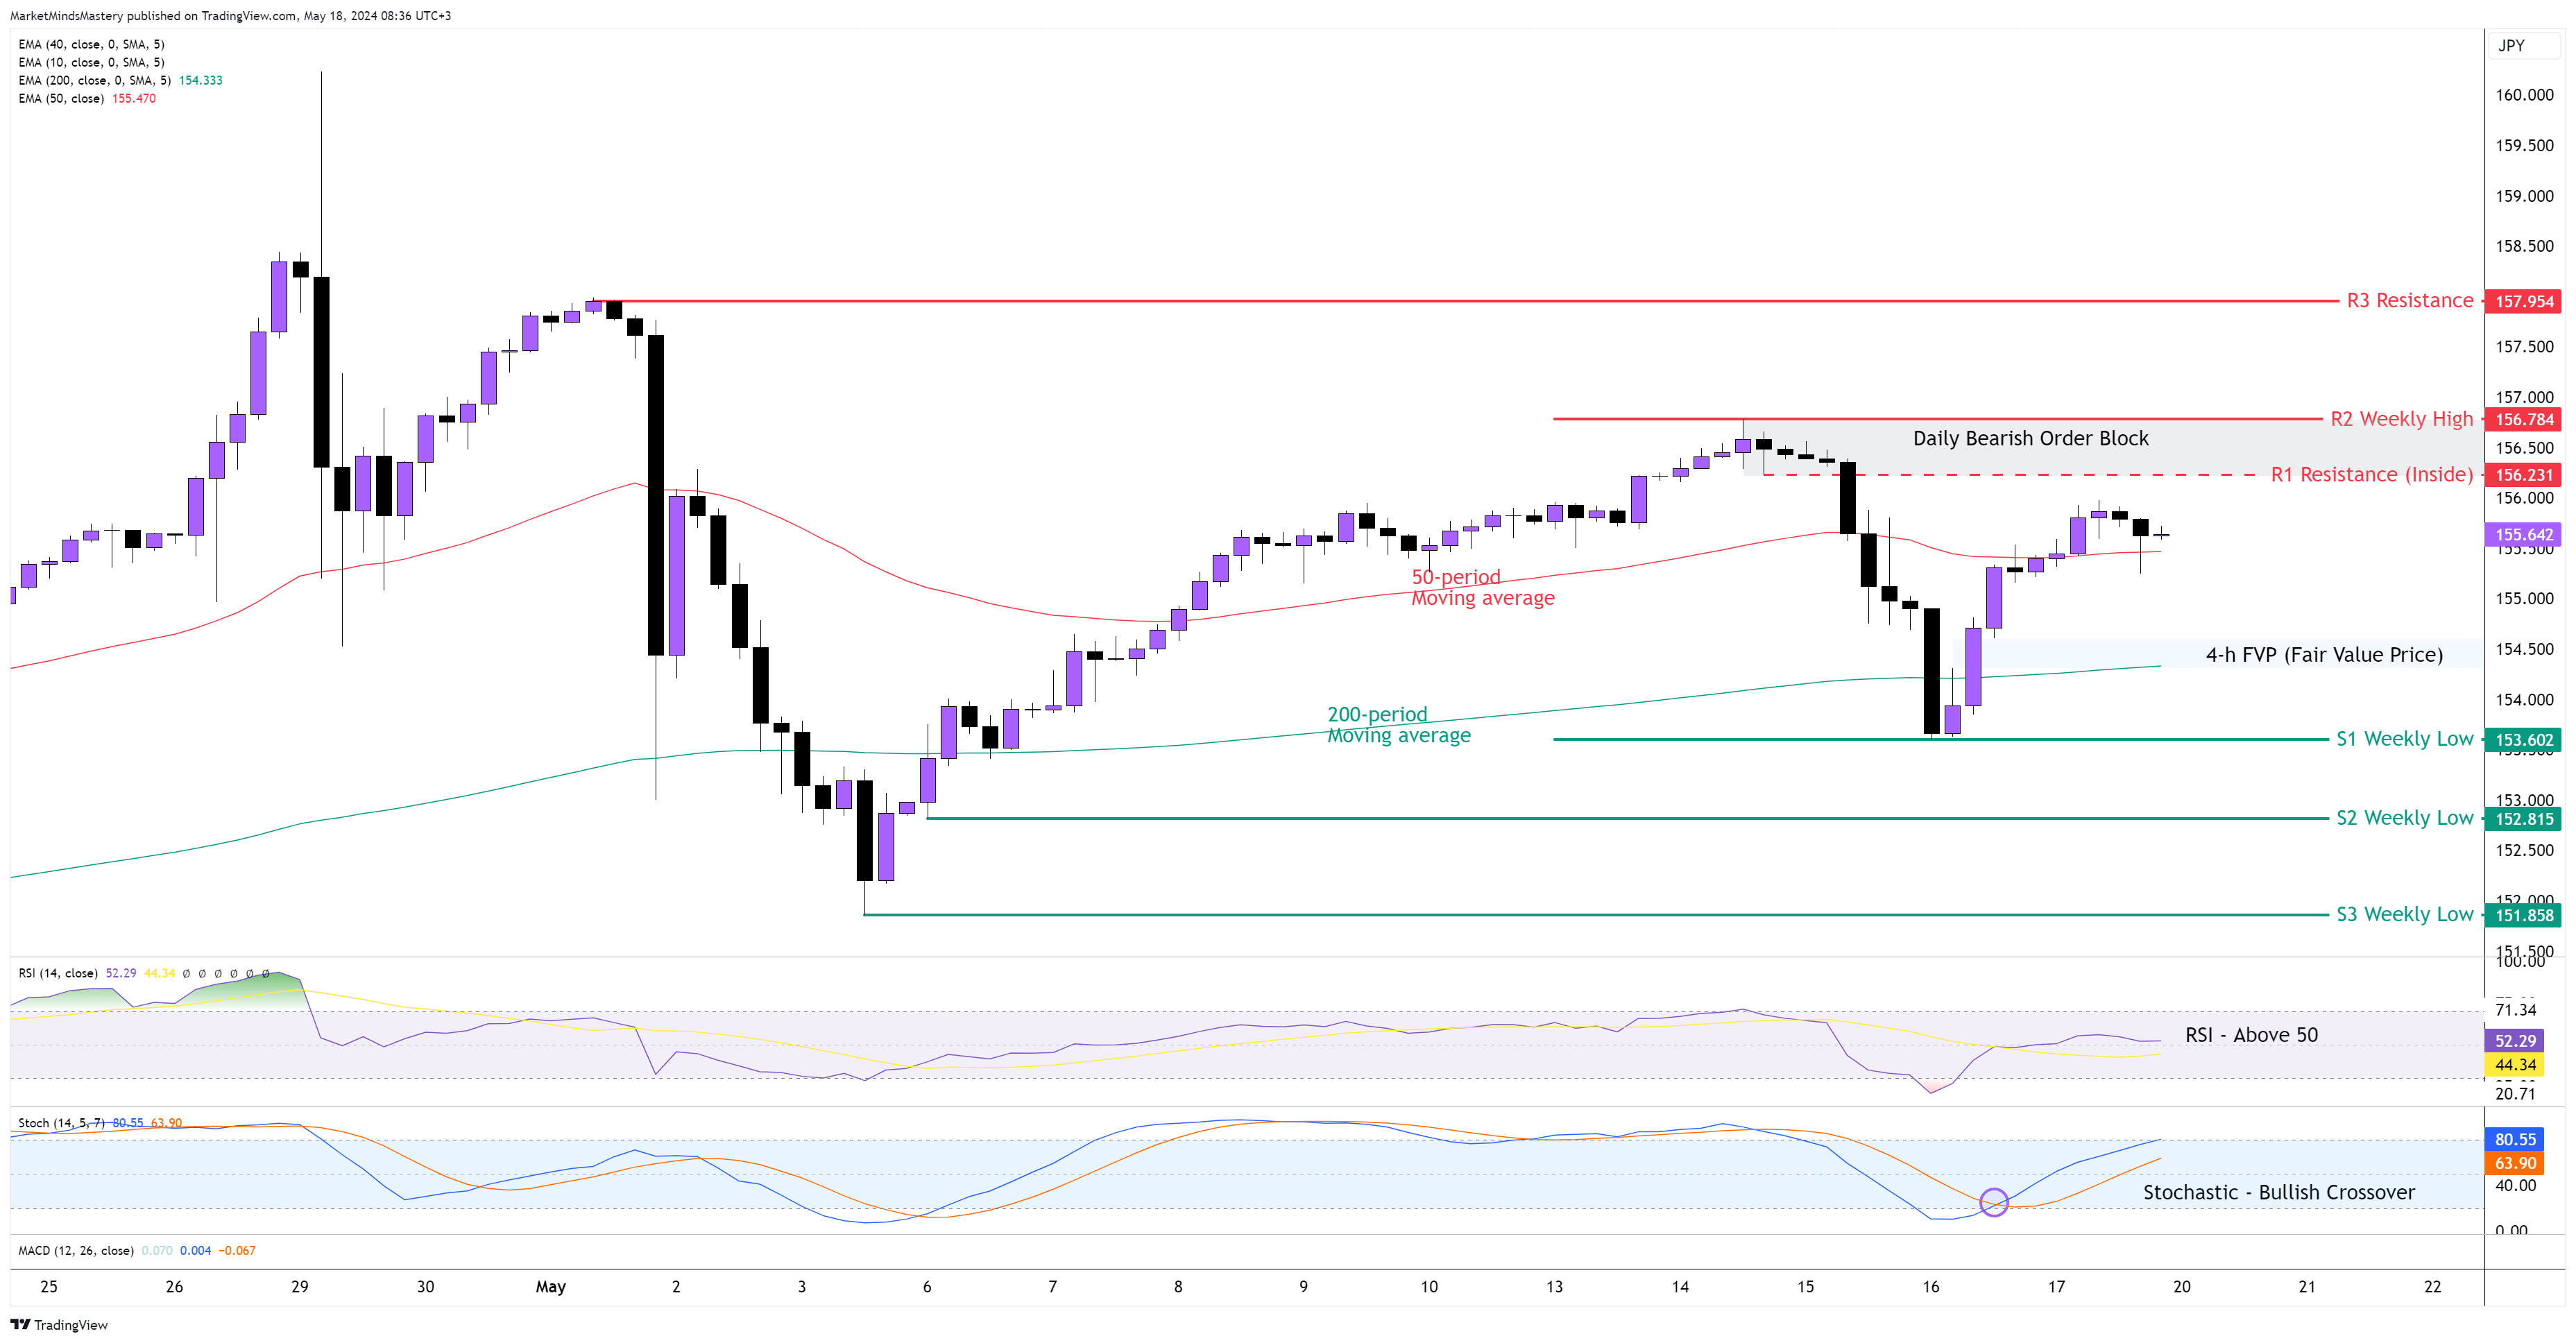
Following the successful test of the Bullish Engulfing Order Block last week, the price bounced off and moved upwards as expected to continue the upward trending move. Last week’s price action formed a long-legged doji candle. Despite this, the price made a higher high and high low formation. On the 4-hour chart, the 50-period moving average is above the 200-period moving average, which is a bullish indication. The RSI is over 50, and the Stochastic created a Bullish Crossover. Starting Monday, if the price continues moving upwards, the first resistance, R1, is an inside resistance of around 156.23. The next resistance is R2, which was the previous week’s high at around 156.78. Within the R1 and R2 is a Bearish Order Block formed on the Daily chart.
If the price is rejected and moves downwards, it can fill up the FVP (or FVG as many of you know it), which is the same area as the 200-period moving average. If the price declines further and moves downwards, the first static support, S1, is the previous week’s low, approximately 153.60. If it closes under the S1 and keeps lowering, the next support, S2, is an older weekly low of around 152.81.
USD CHF 4H
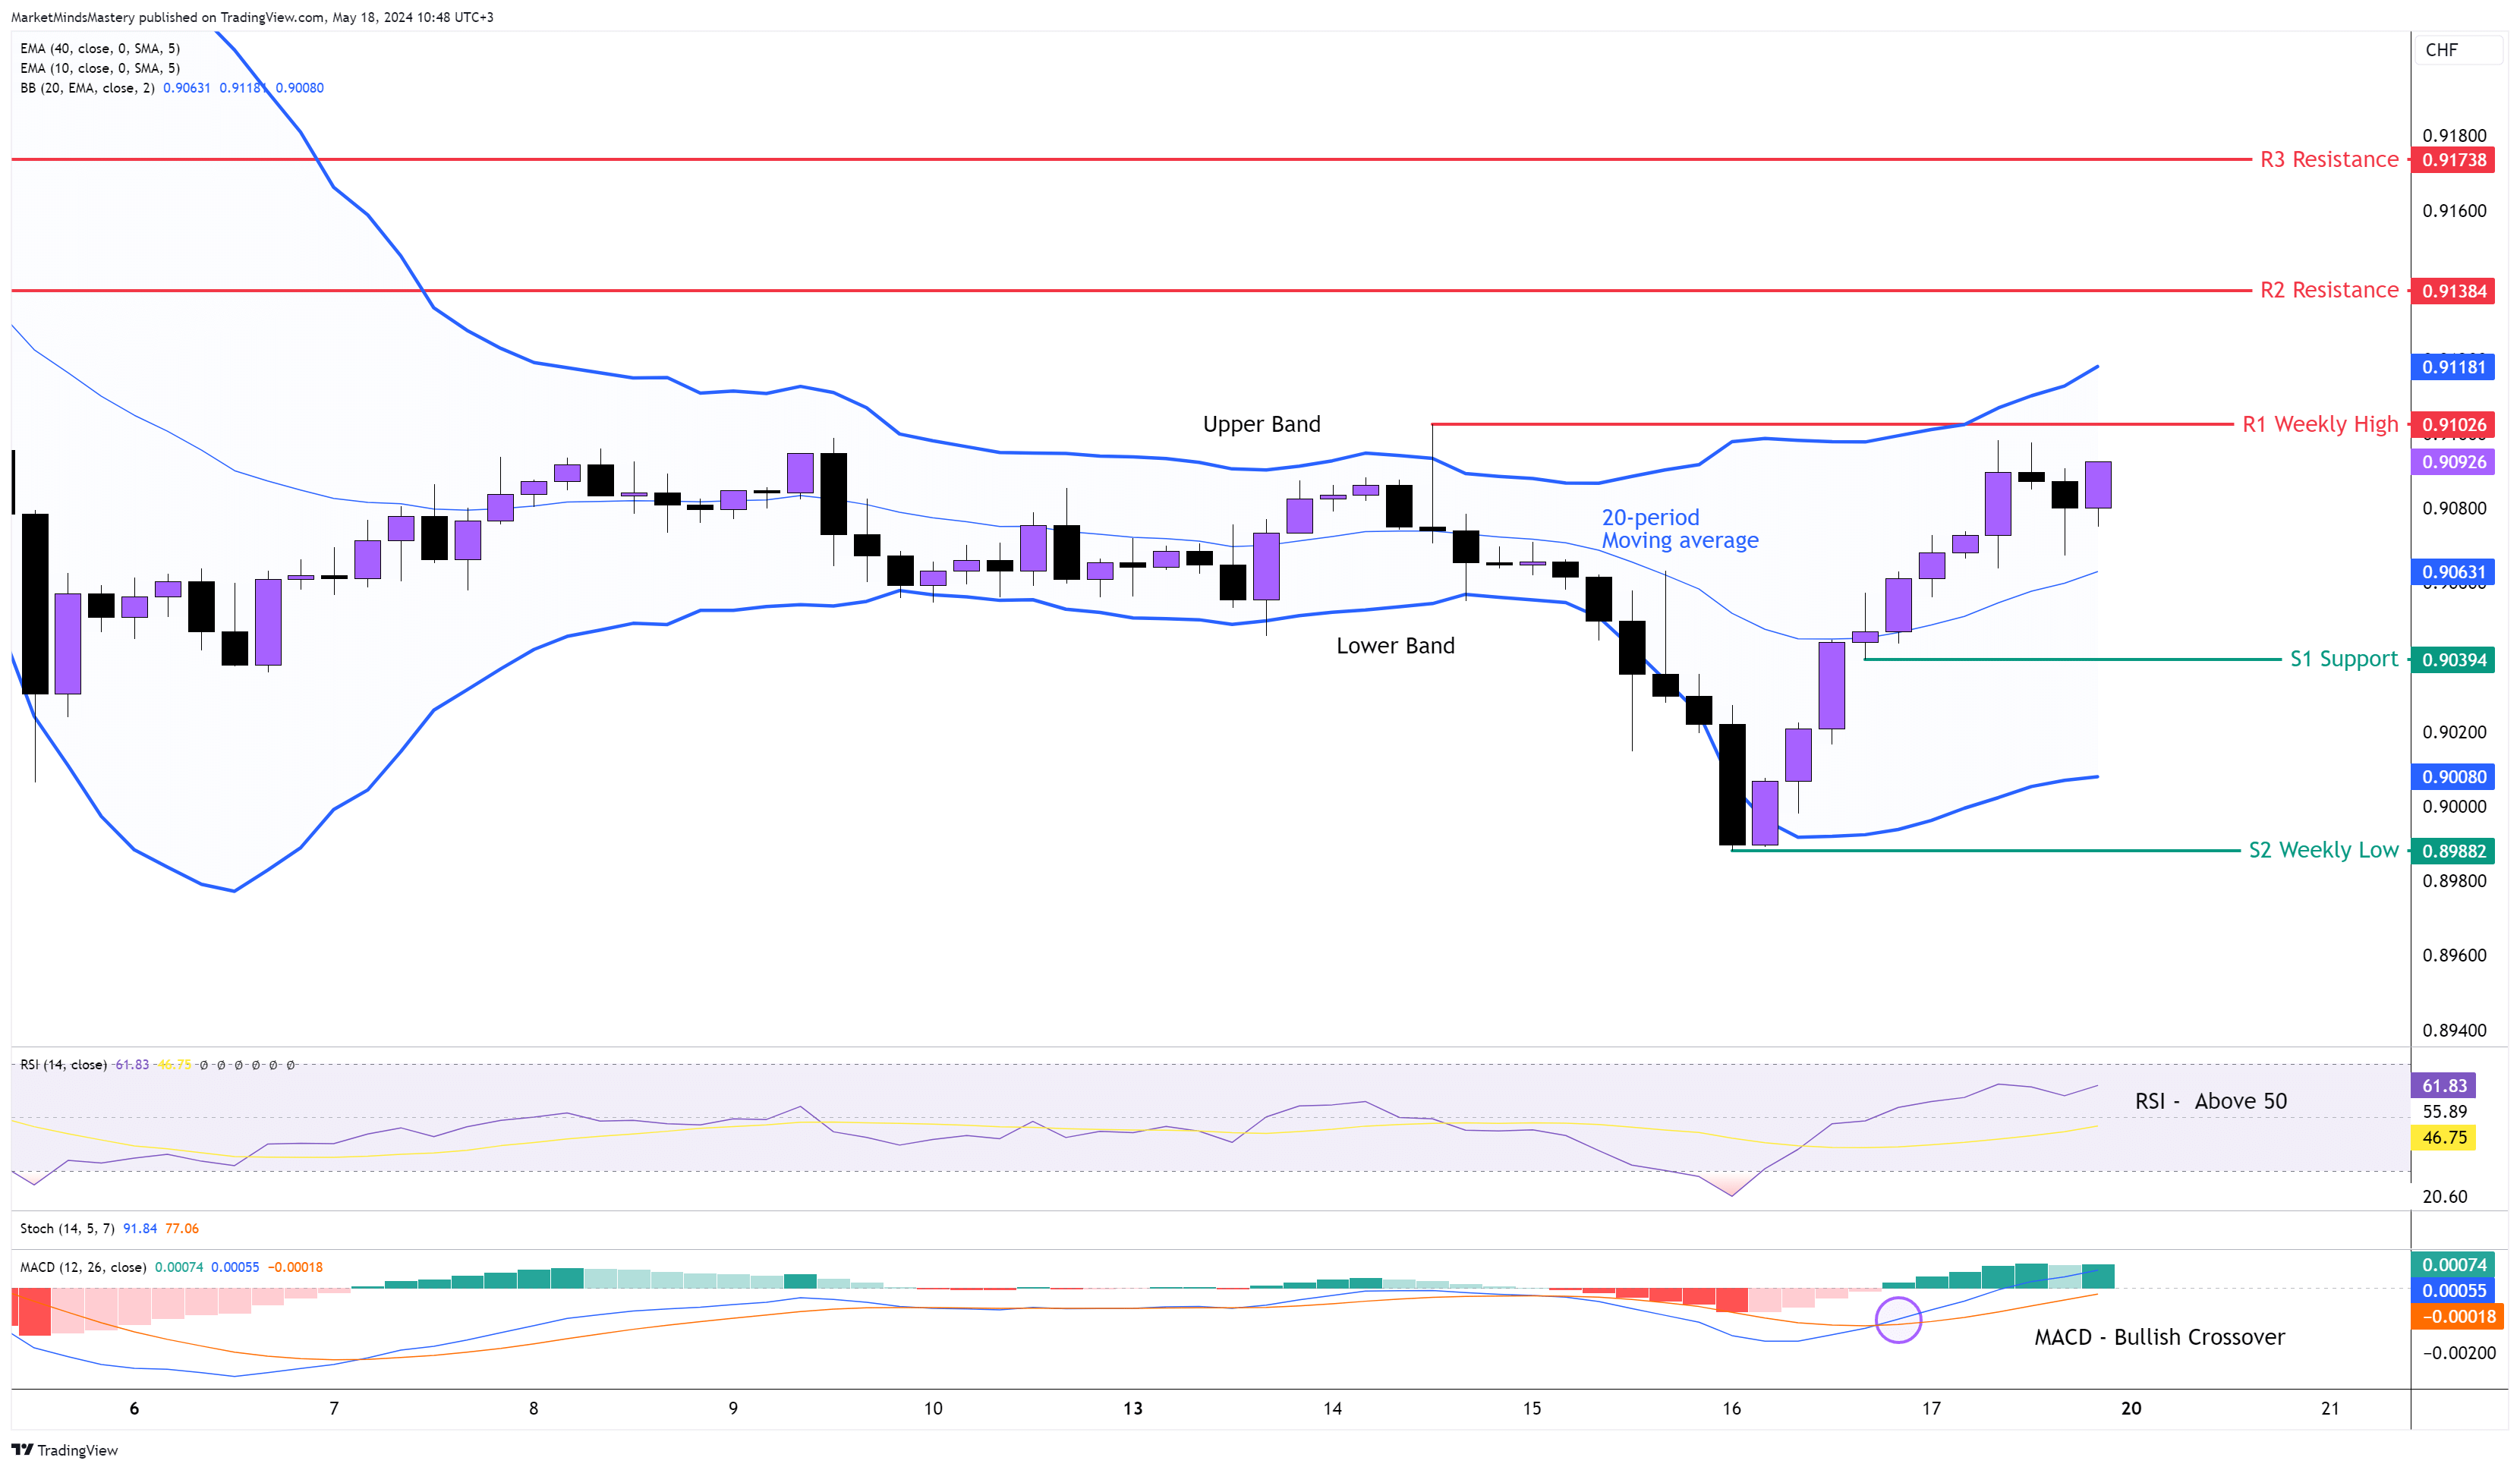
The week it was ended as a Bullish Engulfing candle with a long lower wick. It is more a combination of a Bullish Engulfing and a Hammer. On the 4-hour chart, the price traded until the previous week’s analysis levels, bounced off, and moved upwards, retracing almost 90% of the downward move. Currently, the price is trading above the middle line of the Bollinger Band, which is the 20-period moving average. The MACD created a Bullish Cross, and the RSI is above the middle line, indicating a bullish market. If the price keeps trading above the 20-period and moves upwards, the first resistance area, R1, will be the test of the previous week’s high. The level is approximately 0.9102. If the price breaks and closes above the R1 and moves away from the level, the next resistance area, R2, will be around 0.91384. On the other hand, if the price is rejected and moves downwards, the first support area, S1, is approximately 0.9039. If it penetrates the S1, closes under it, and moves downwards, the next support level is the S2, which is around 0.8988, which is the previous week’s low.
GBP JPY 4H
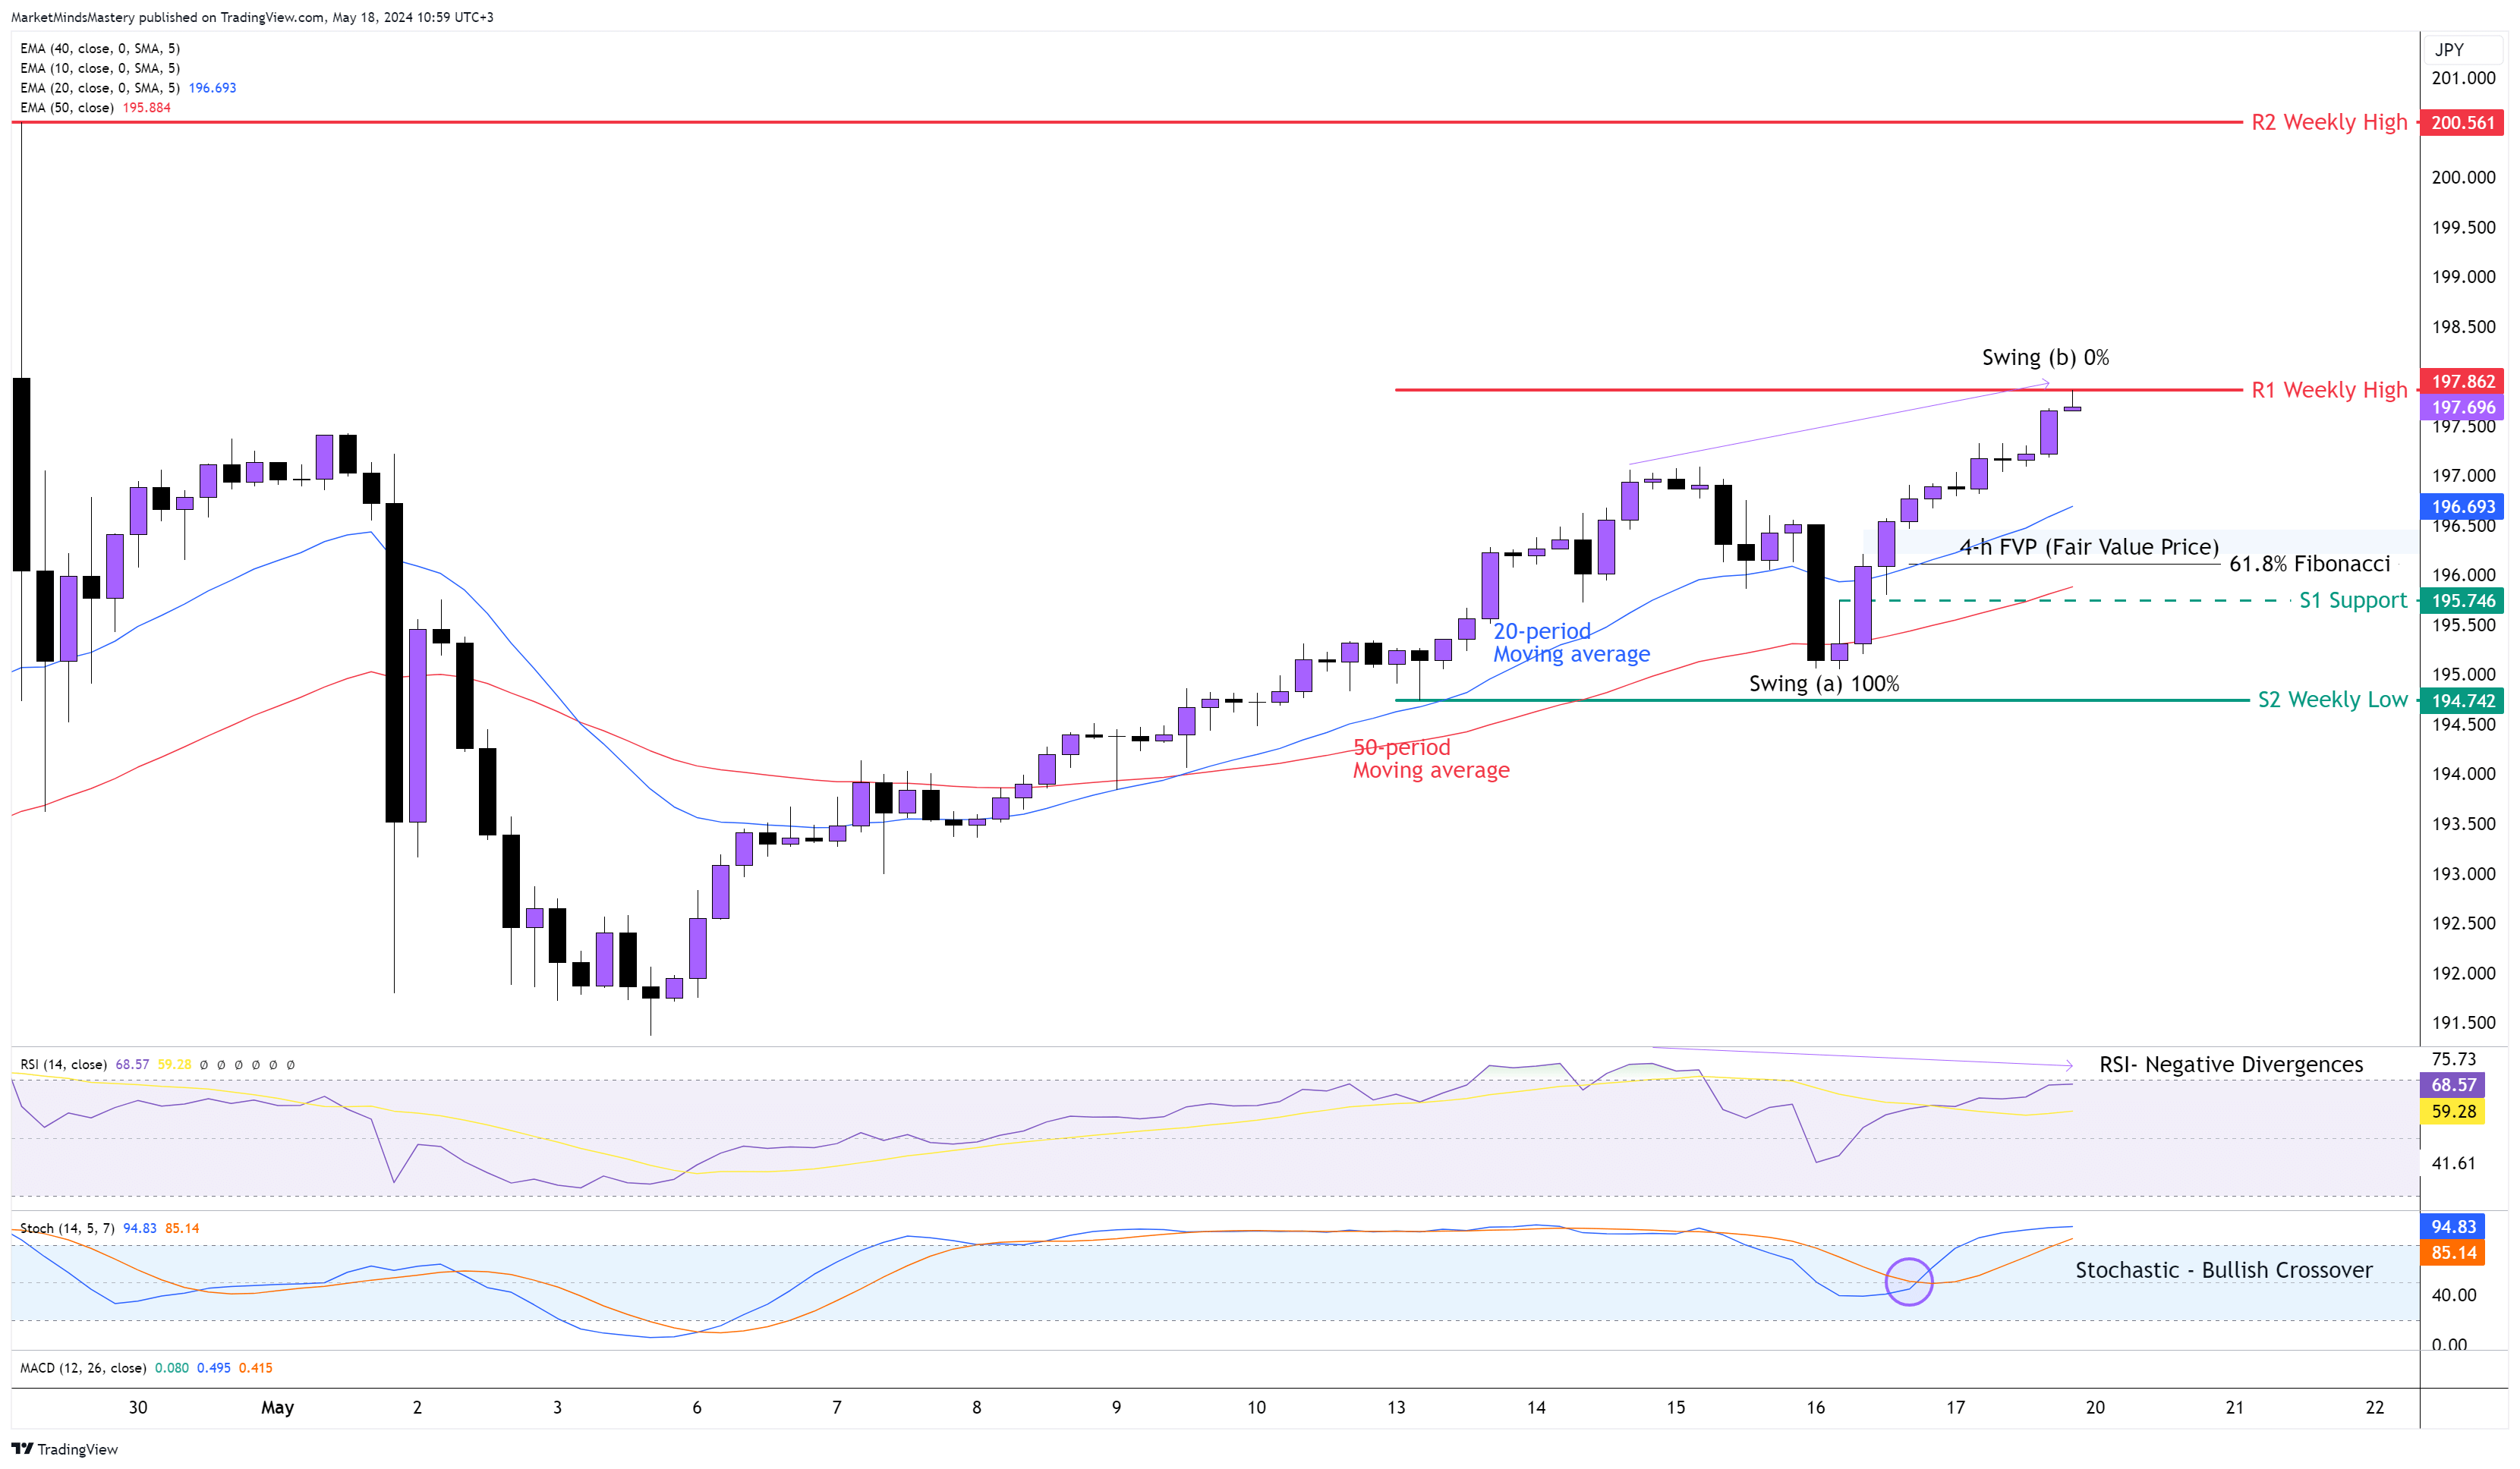
The price maintained the higher high and higher low formation last week, and the weekly candle closed as a bullish Marubozu. The 20-period is above the 50-period moving average, indicating a bullish market. The RSI is very close to its overbought area, which is a bullish indication, but under the appearance of Negative Divergences, as the last impulsive move on the chart wasn’t strong enough to force the RSI to follow with a new High. Negative divergences first cause prices to retrace part of the previous move, and only if there is a break in the market structure and swing violation will cause a change in trend. The Stochastic oscillator is overbought, indicating a bullish trend. The price must break the previous week’s high for the uptrend to continue. However, it can also act as a resistance to cause the market a setback. If the price penetrates the R1 resistance around 197.86 and moves upwards, the next resistance area, R2, is approximately 200 pips away at the 209.56 level.
Conversely, if the price declines and moves downwards, the 61.8% Fibonacci level aligns with an FVG and the 20-period moving average area. This combination of confluences can attract buy orders. In case the price declines further, the first static support, S1, is only 30 pips away, around the 195.74 level. A further downward move finds the previous week’s low at around 194.74, which is the S2 support.
GOLD DAILY
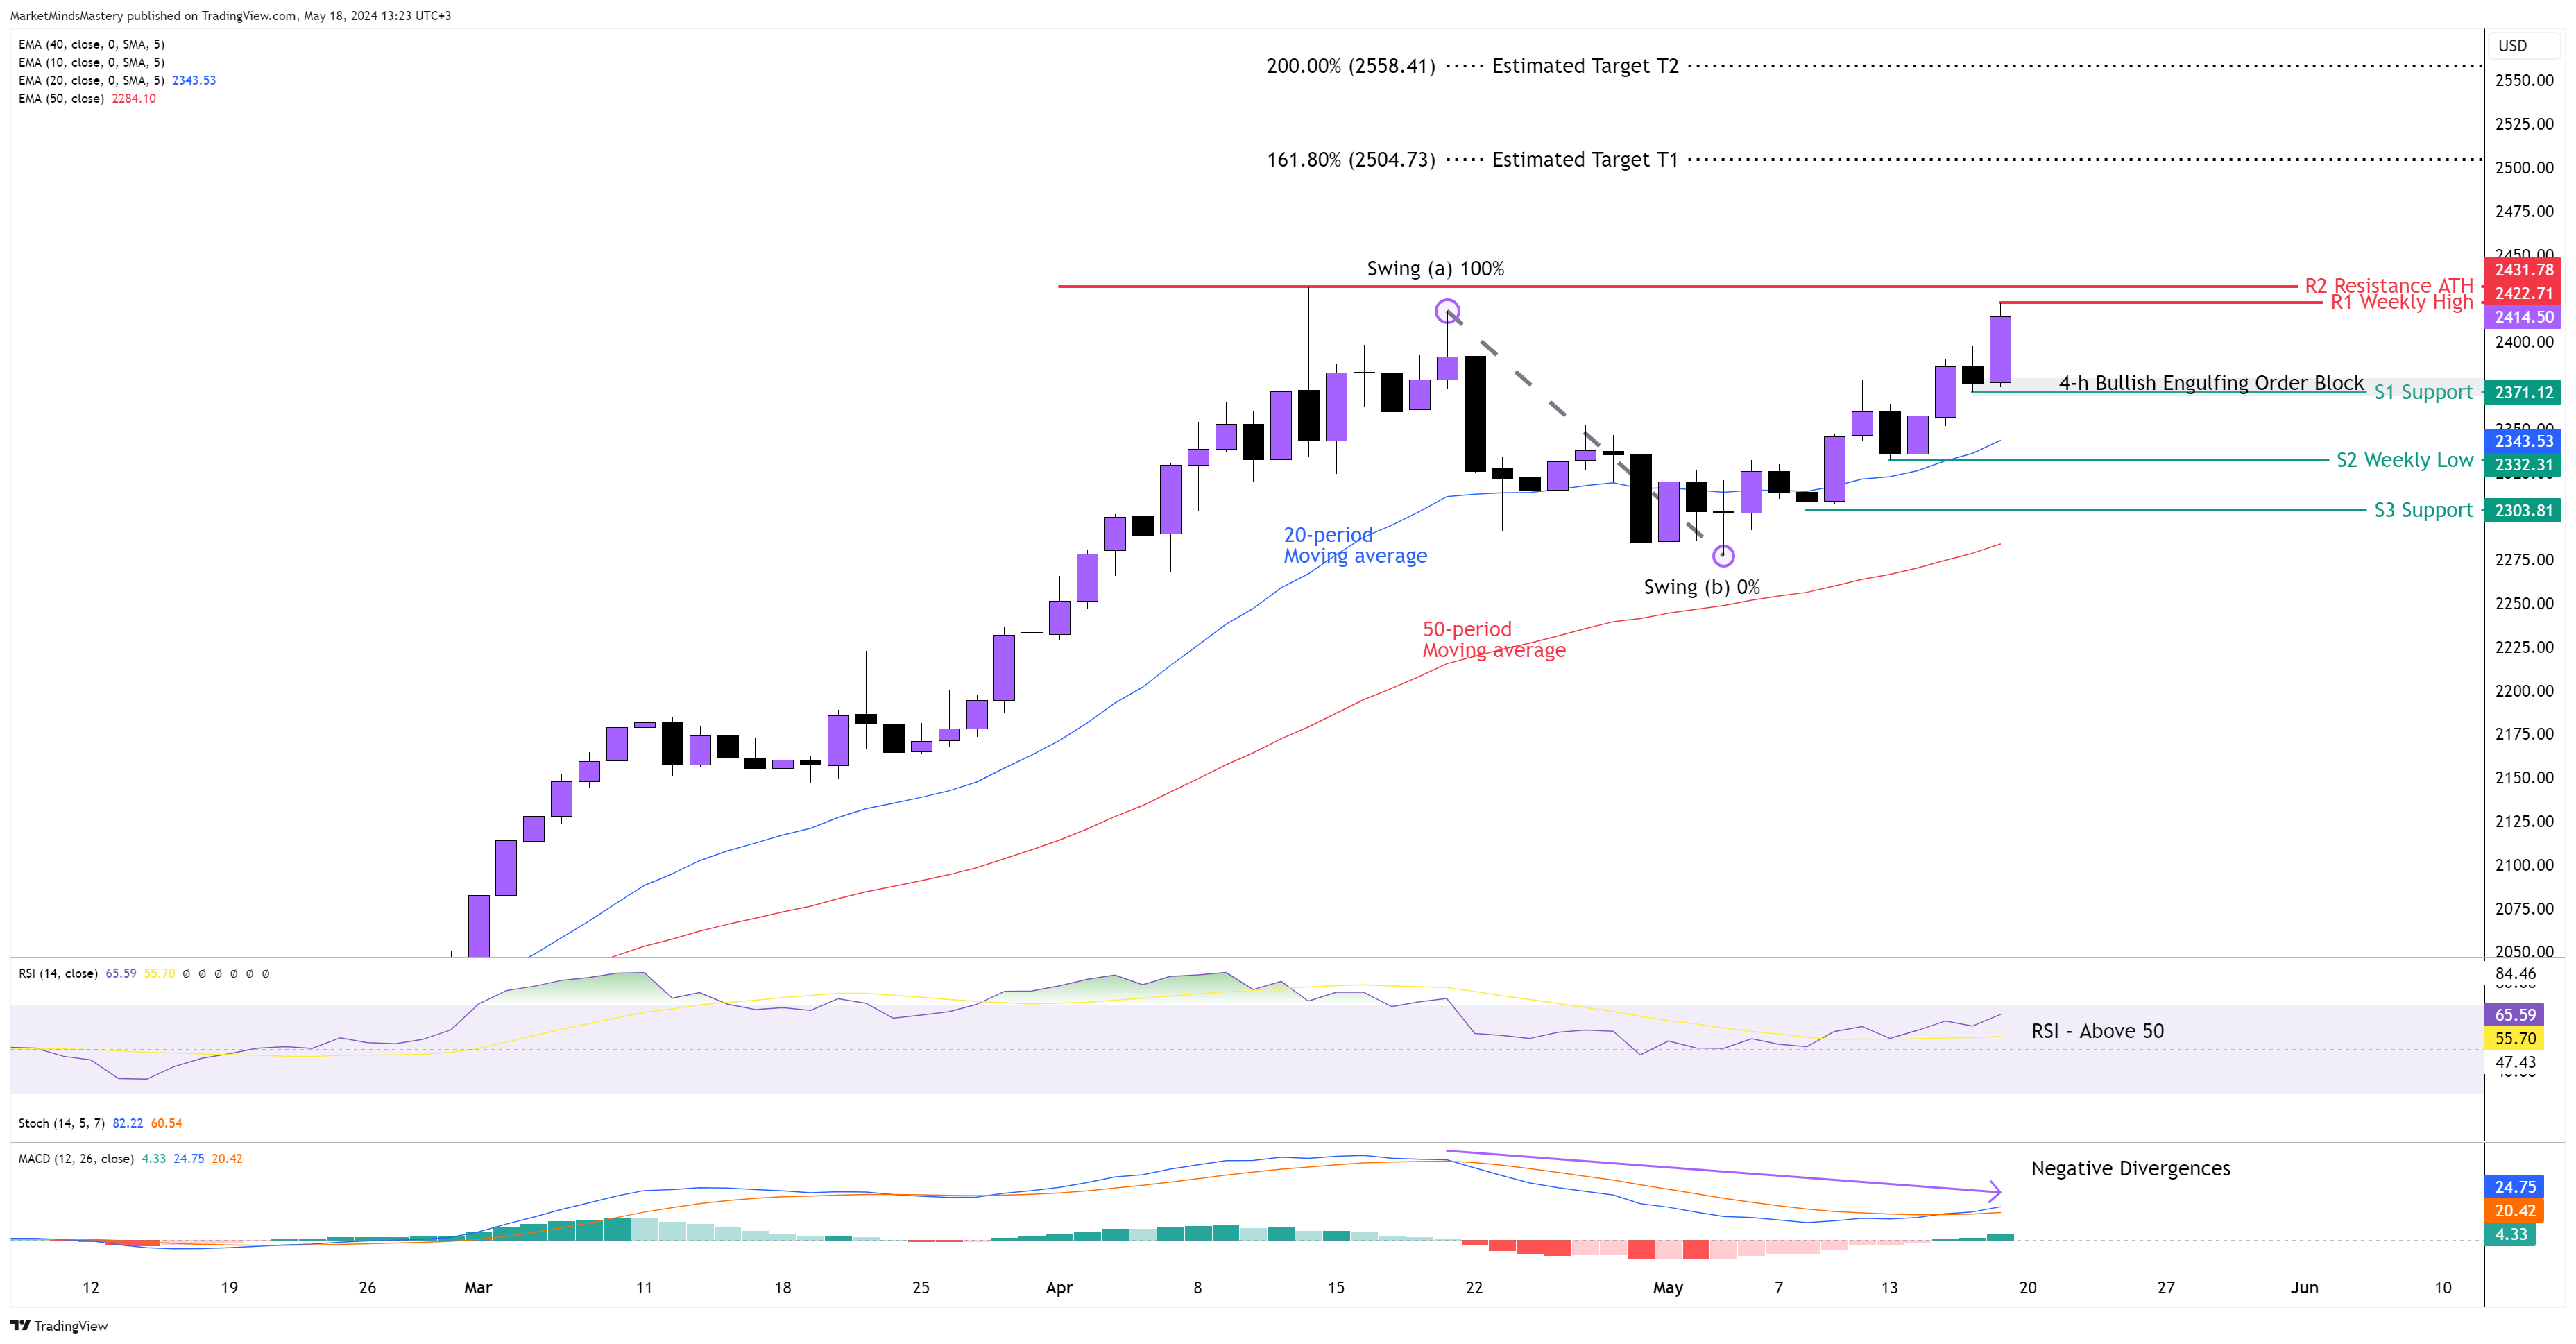
The uptrend in the Gold market continued last week, with the retracement occurring exactly at 61.8%, as we pointed out in the previous week’s analysis (Market Outlook GOLD 4H 13-19/5). Since then, the price rally has continued the Higher Highs and Higher Lows series. This week, we will analyse the Daily chart since the price is approaching an ATH (All-Time High). As the market is in a strong uptrend, the 20-period is above the 50-period moving average, with the distance between them widening. The RSI is well above the 50, which is a bullish sign. The MACD, as it takes the 24 periods into account, is considered a slower indicator than the RSI. Therefore, the MACD shows noticeable Bearish or Negative Divergences B’ Class, which means that the price made equal top and the MACD lower high. This indication can set the price on a set-back, at least temporarily. If the price continues moving upwards, the previous week’s high should be violated, and a close above the R1 resistance, which is around $2422, should occur. If this happens, the ATH, as marked on the chart with the R2 resistance, is around 200 pips above the $2431. If the price breaks above the ATH, then using the Fibonacci Extension, we marked 161.8% and 200%.
On the other hand, if the MACD divergences set the price on a retracement, the first support area is the S1, which is approximately $2371. We refined a noticeable Bullish Engulfing Order Block using the 4-H chart, which can add more validation to the level. If the price breaks and closes under the S1, the next support area, S2, is around $2332, which is the previous week’s low.
US OIL 4H
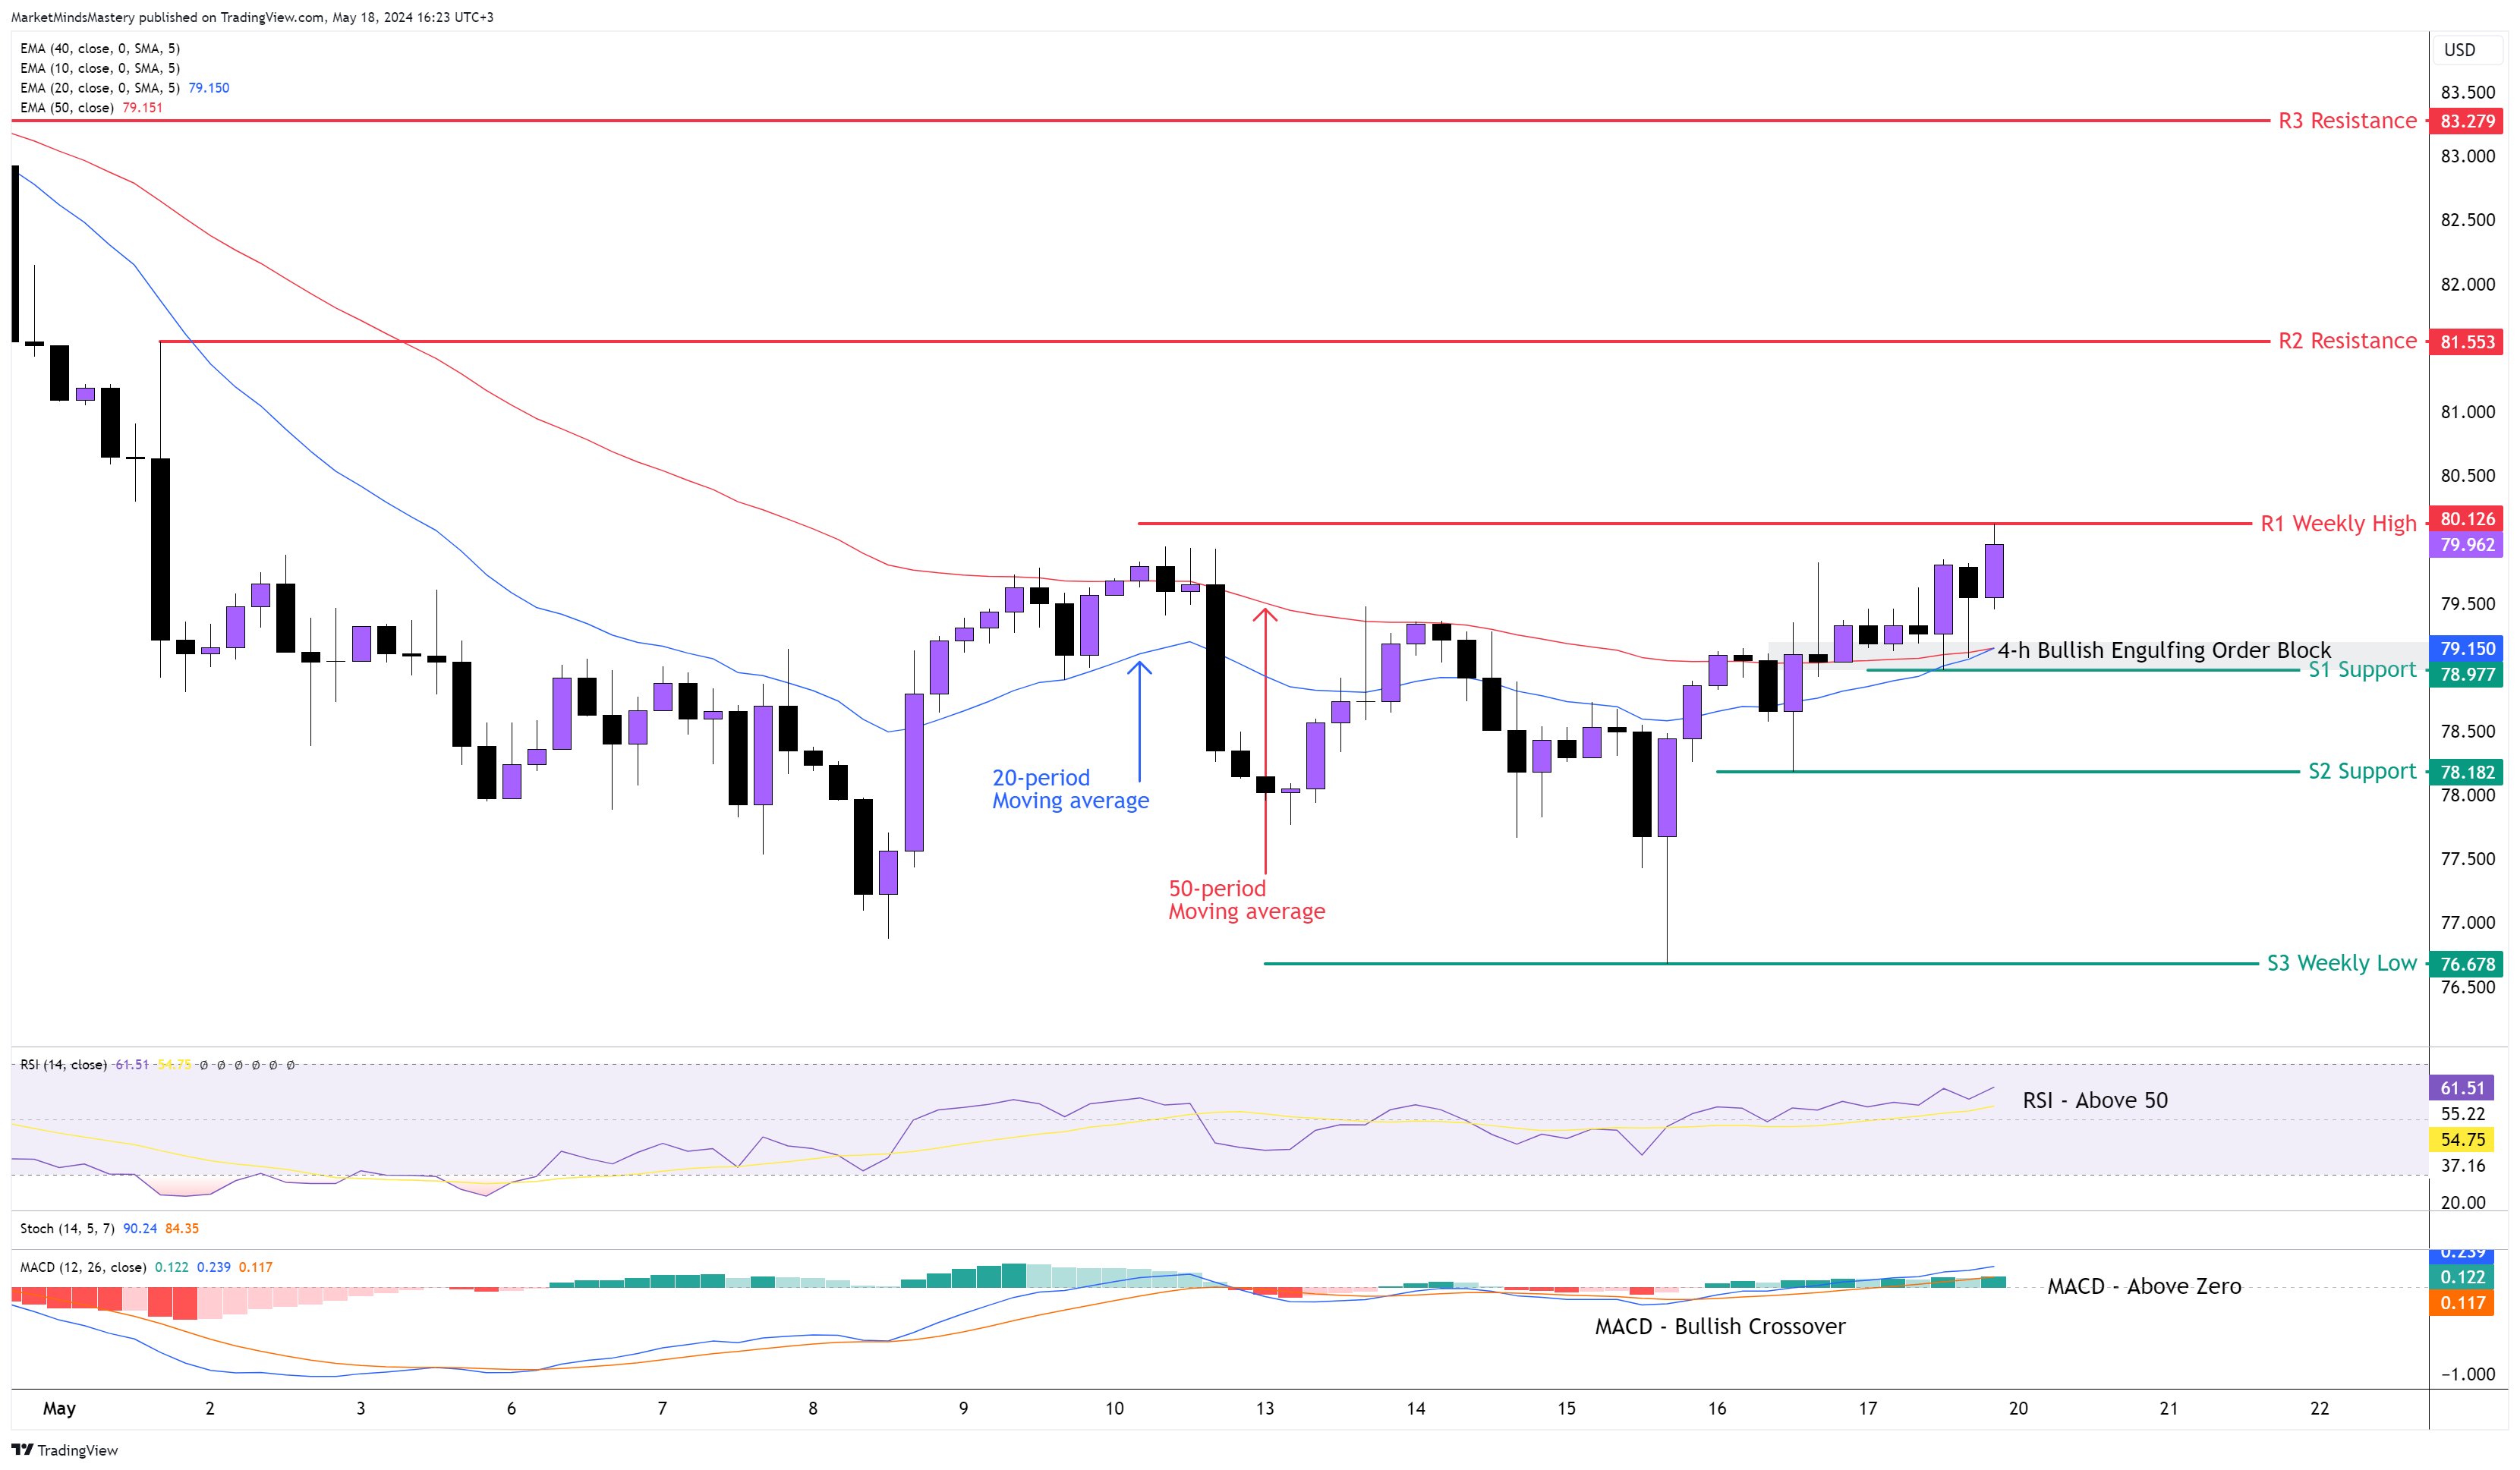
Following the doji weekly candle, which occurred after a downward move, the price stopped and reversed as expected, and the last week ended with a weekly Bullish Engulfing reversal. This is one of the strongest reversal patterns because it shows the shift in the price momentum and the significance of the buy orders accumulation compared to the executed sell orders. On the 4-hour chart, the price is still in a consolidation phase and using Wyckoff analysis, it looks like the accumulation phase is forming. The 20-period is touching with the 50-period moving average as the price has yet to start trending. The MACD created a bullish crossover, trading above the zero line, indicating a bullish market. The RSI is above 50, which has a bullish bias. Starting Monday, if the price moves upwards, the first resistance, R1, will be the previous week’s high, around $80.12. If it will be an upside breakout, and the price penetrates the R1 closes above it, and moves upwards, the next resistance, R2, will be $81.55. On the other hand, if the price declines and moves downwards, the first support area, S1, will be around $79. The significance of this level is the consistency of the static support and the Bullish Engulfing Order Block. It is not unusual for the price to find support and bounce off during an uptrend development. If the price closes under the S1 and moves downwards, the next support area, S2, will be $78.18.
BTC USD 4H
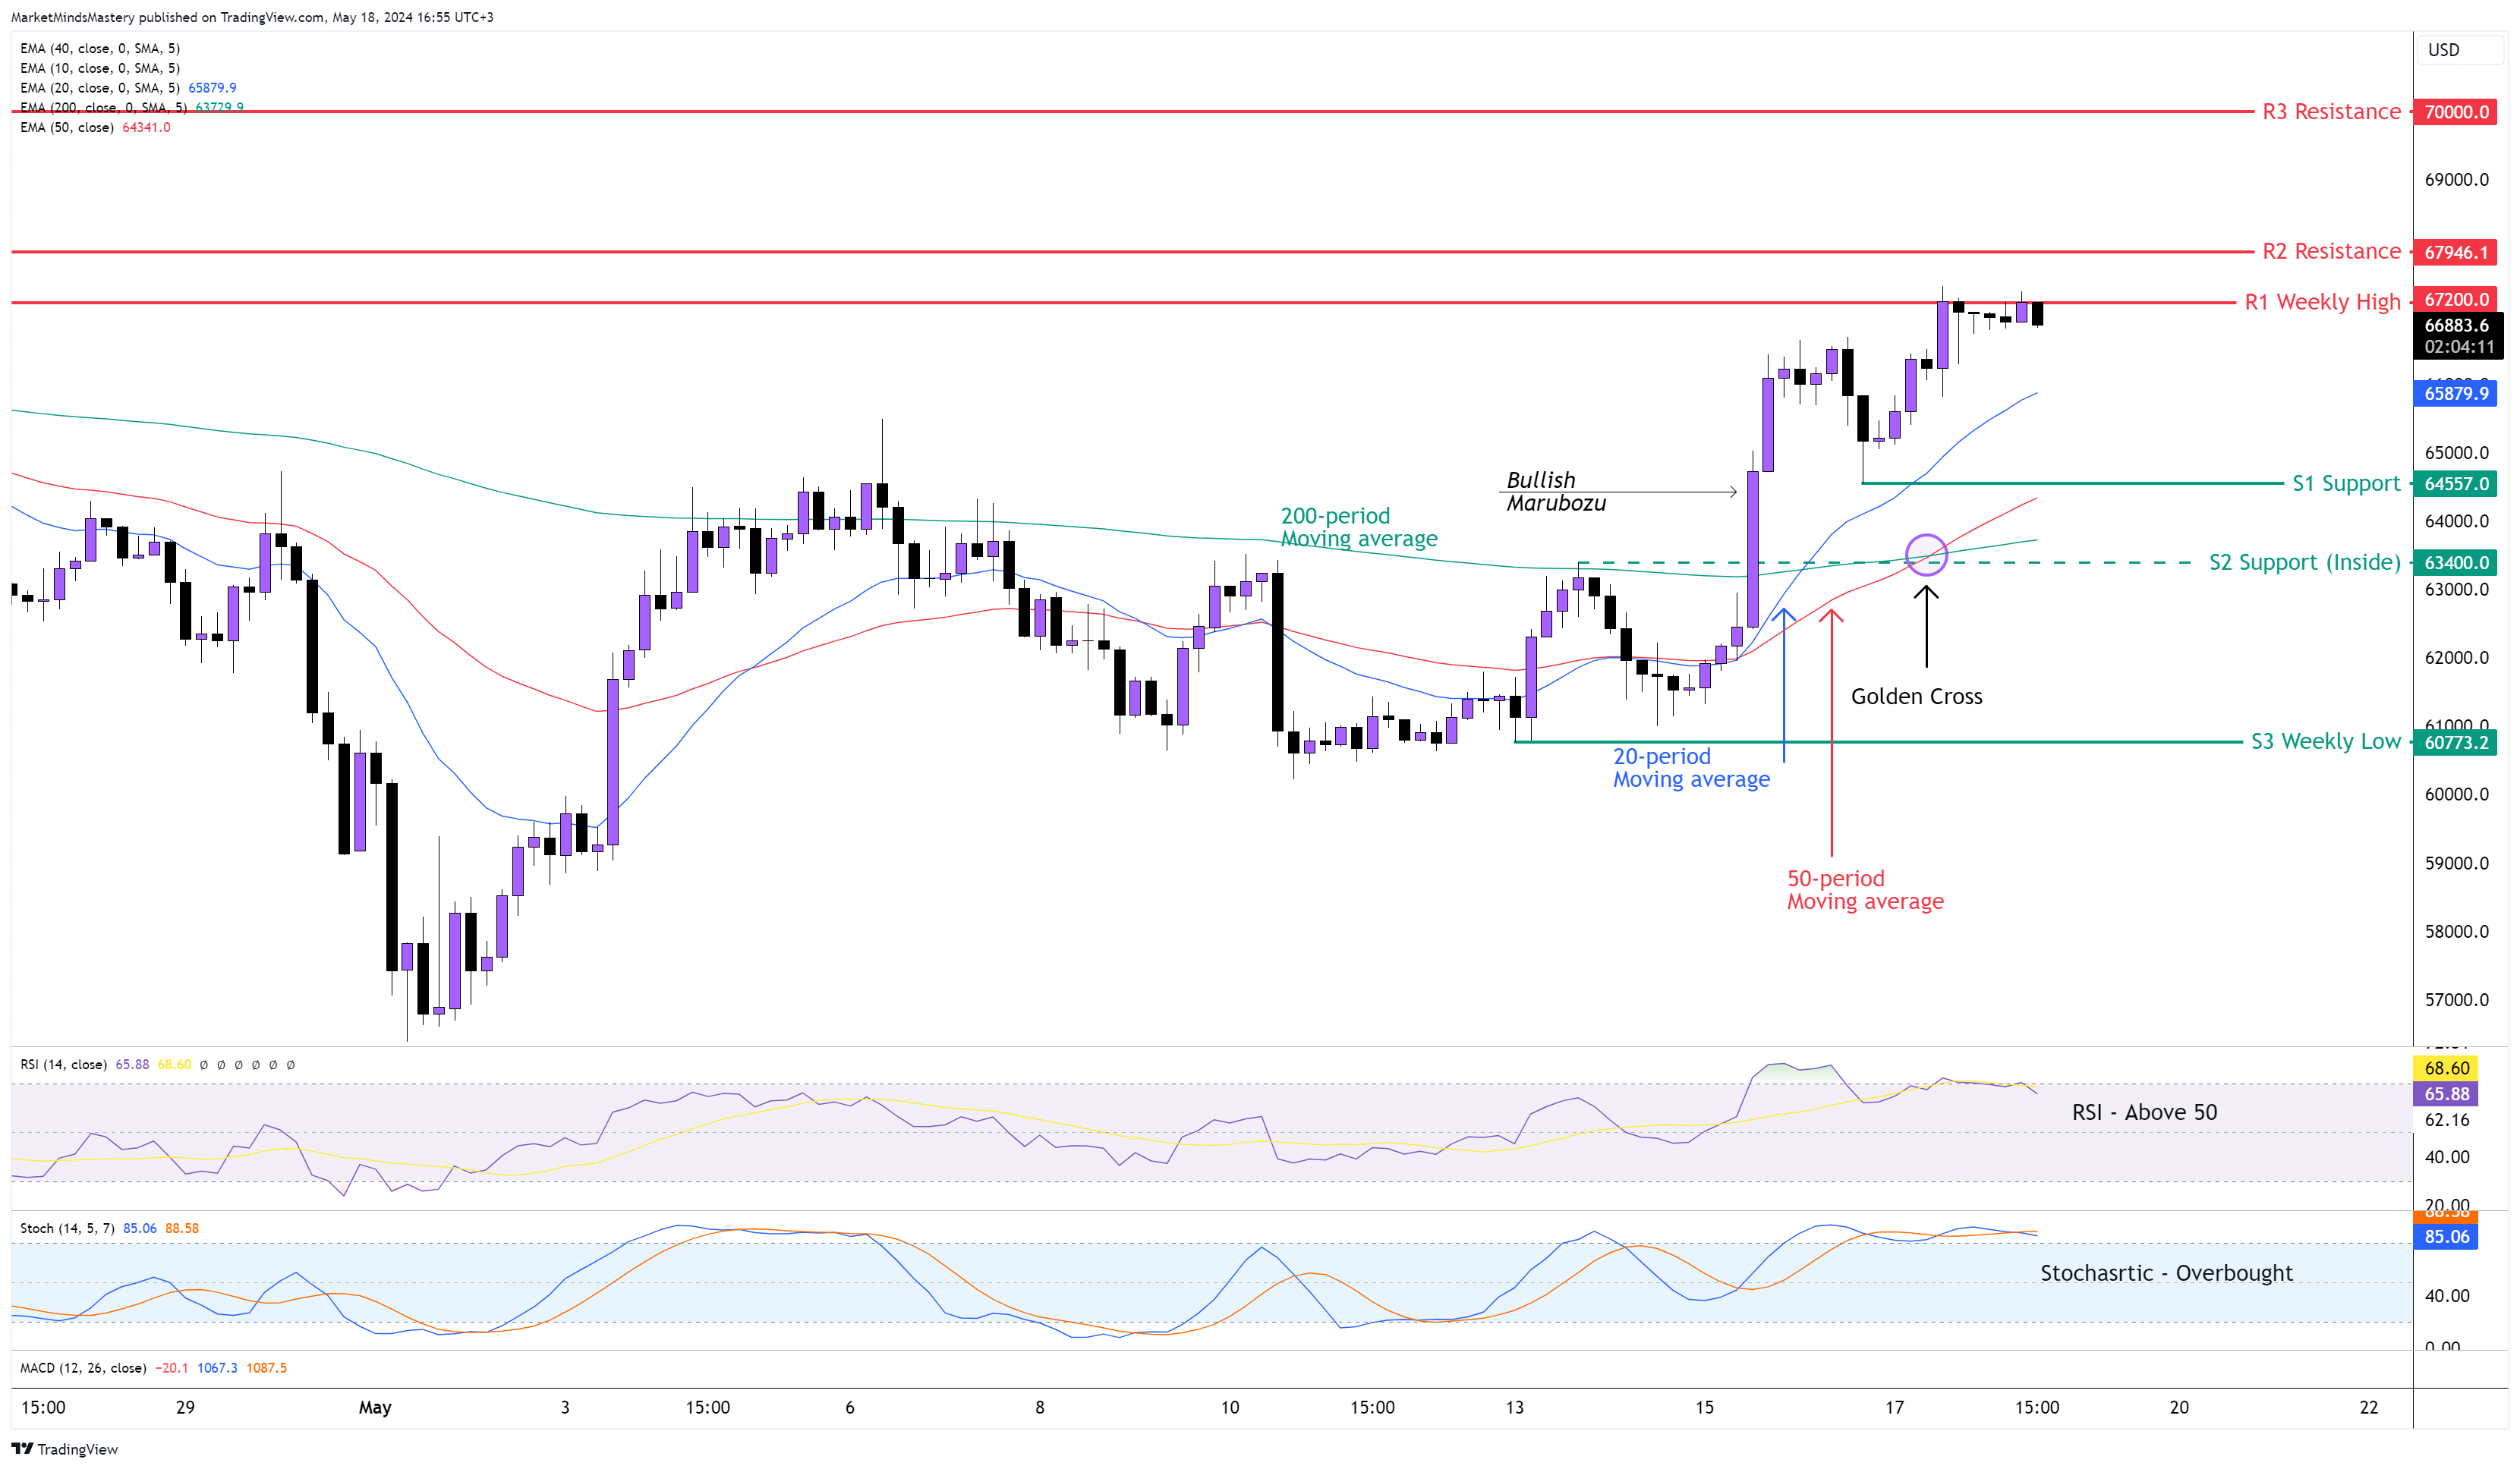
The primary weekly uptrend resumed after the price made a new high. On the 4-hour chart, the price created a well-defined uptrend with a series of higher highs and higher lows. The Bullish Marubozu candle signalled the confirmation of the uptrend as the price broke the $63400 under a significant volume as the Bullish Marubozu candle reveals. The 20-period crossed above the 50-period, and the 50 crossed above the 200-period, creating the Golden Crossover. The RSI is above 50, indicating a bullish market, whereas the Stochastic confirms the bullishness because it is in an overbought condition. If the price keeps trading upwards, the first resistance area, R1, will be the previous week’s high, around $67200. This is close to R2, the next resistance area, at around $ 68,000. A price close to $68000 can set the price to retest the $70000, which is the R3 resistance. On the other hand, if the price moves downwards, the first support S1 is around $64550, which is the beginning of the last impulsive upward move. If the price closes under the S1 and moves lower, the next support, S2, will be approximately $63400. This level is considered significant because it finds the 200-period moving average and the broken resistance, which now will act as support, and is the middle of the Bullish Marubozu candle, which usually hosts a significant amount of volume of the candle.
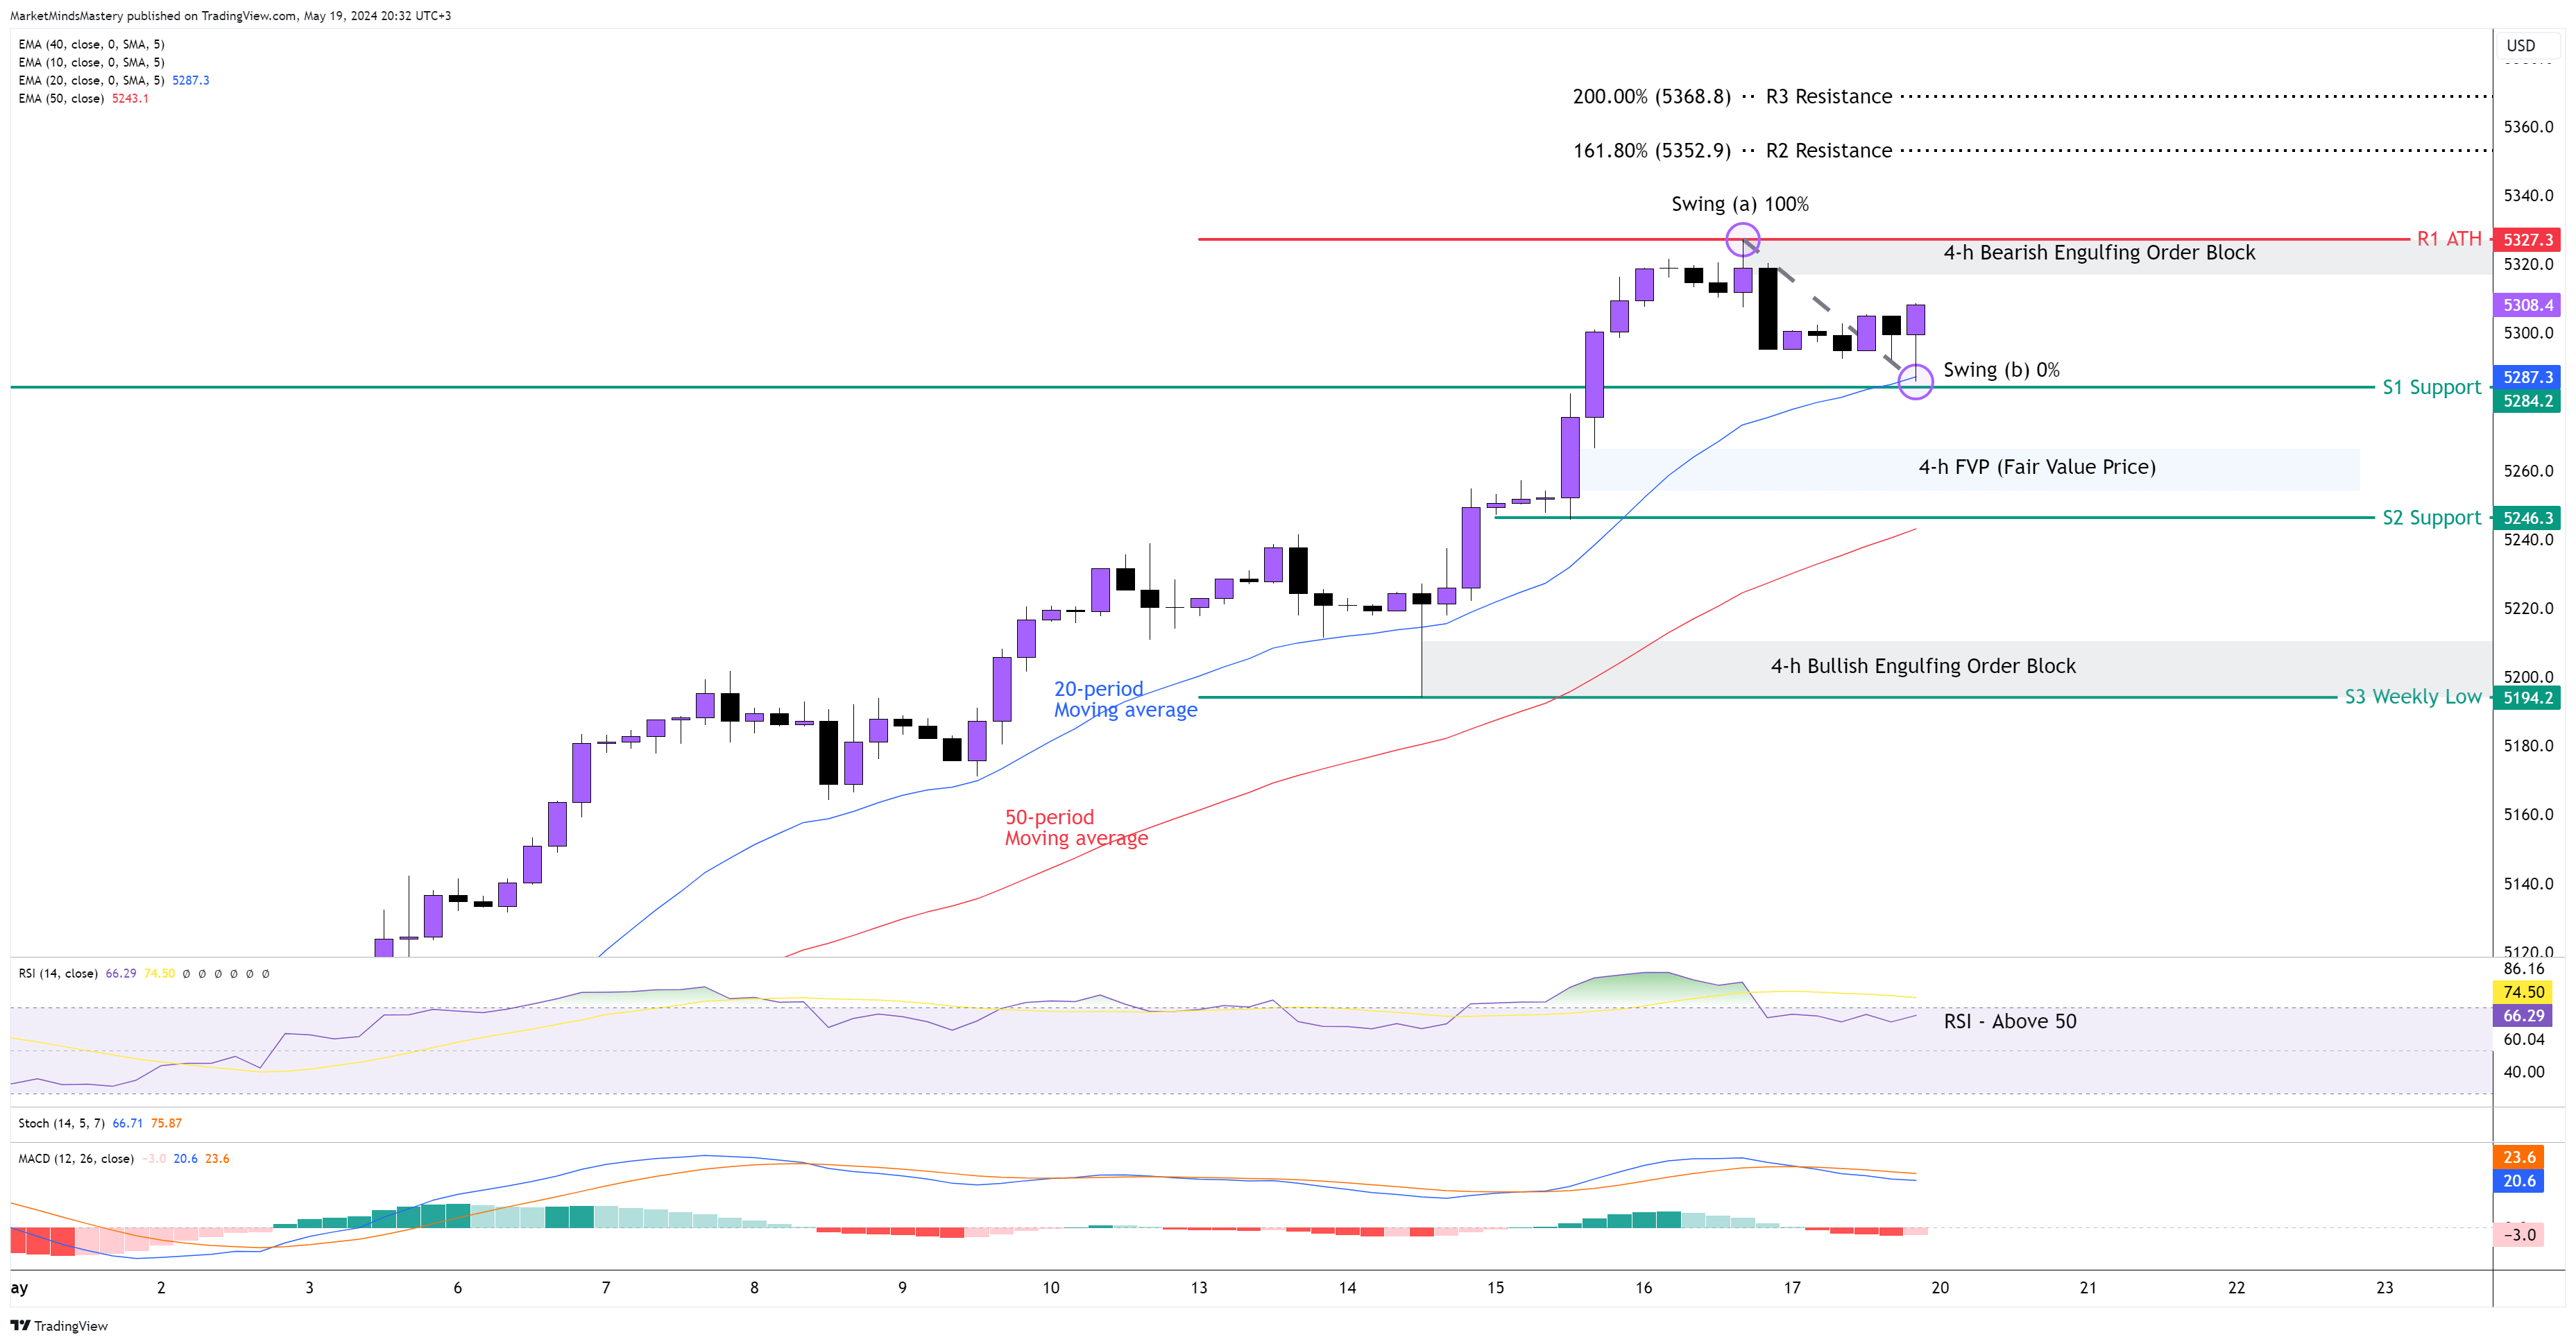
SP 500 4H
The S&P500 registered a new ATH (All-Time High) at around $5327. The price continues its upward move with higher highs and higher lows. The retracements occurred in a light volume as the black candles (bearish) not only have small bodies but also are much less than the bullish candles. This is an indication of a strong, bullish market. The 20-period is above the 50-period moving average, and the distance between them widens, which is a bullish indication. The RSI is above 50 and very close to its overbought area. The Stochastic is above 50, which has bullish implications. As per the law of trend, “a trend in motion continues its direction unless the opposite force reverses it”. Suppose the price continues to increase, and the R1 resistance will be the first area of resistance, which is around $5327. If the price penetrates the R1 and moves higher, the following resistance areas will be estimated using the Fibonacci extension tool. Measuring the distance from swing (a) 100% to swing (b), which is 0%, we find that the 161.8% is around $5352 and the 200% is around $54368.
If the price is rejected and moves downwards, the first support area, S1, is expected to be around $5284. If the price doesn’t bounce off from the S1 and declines further, the next support area S2 will be the $5246. The market created an FVP, which is likely to be filled.
US 30 4H
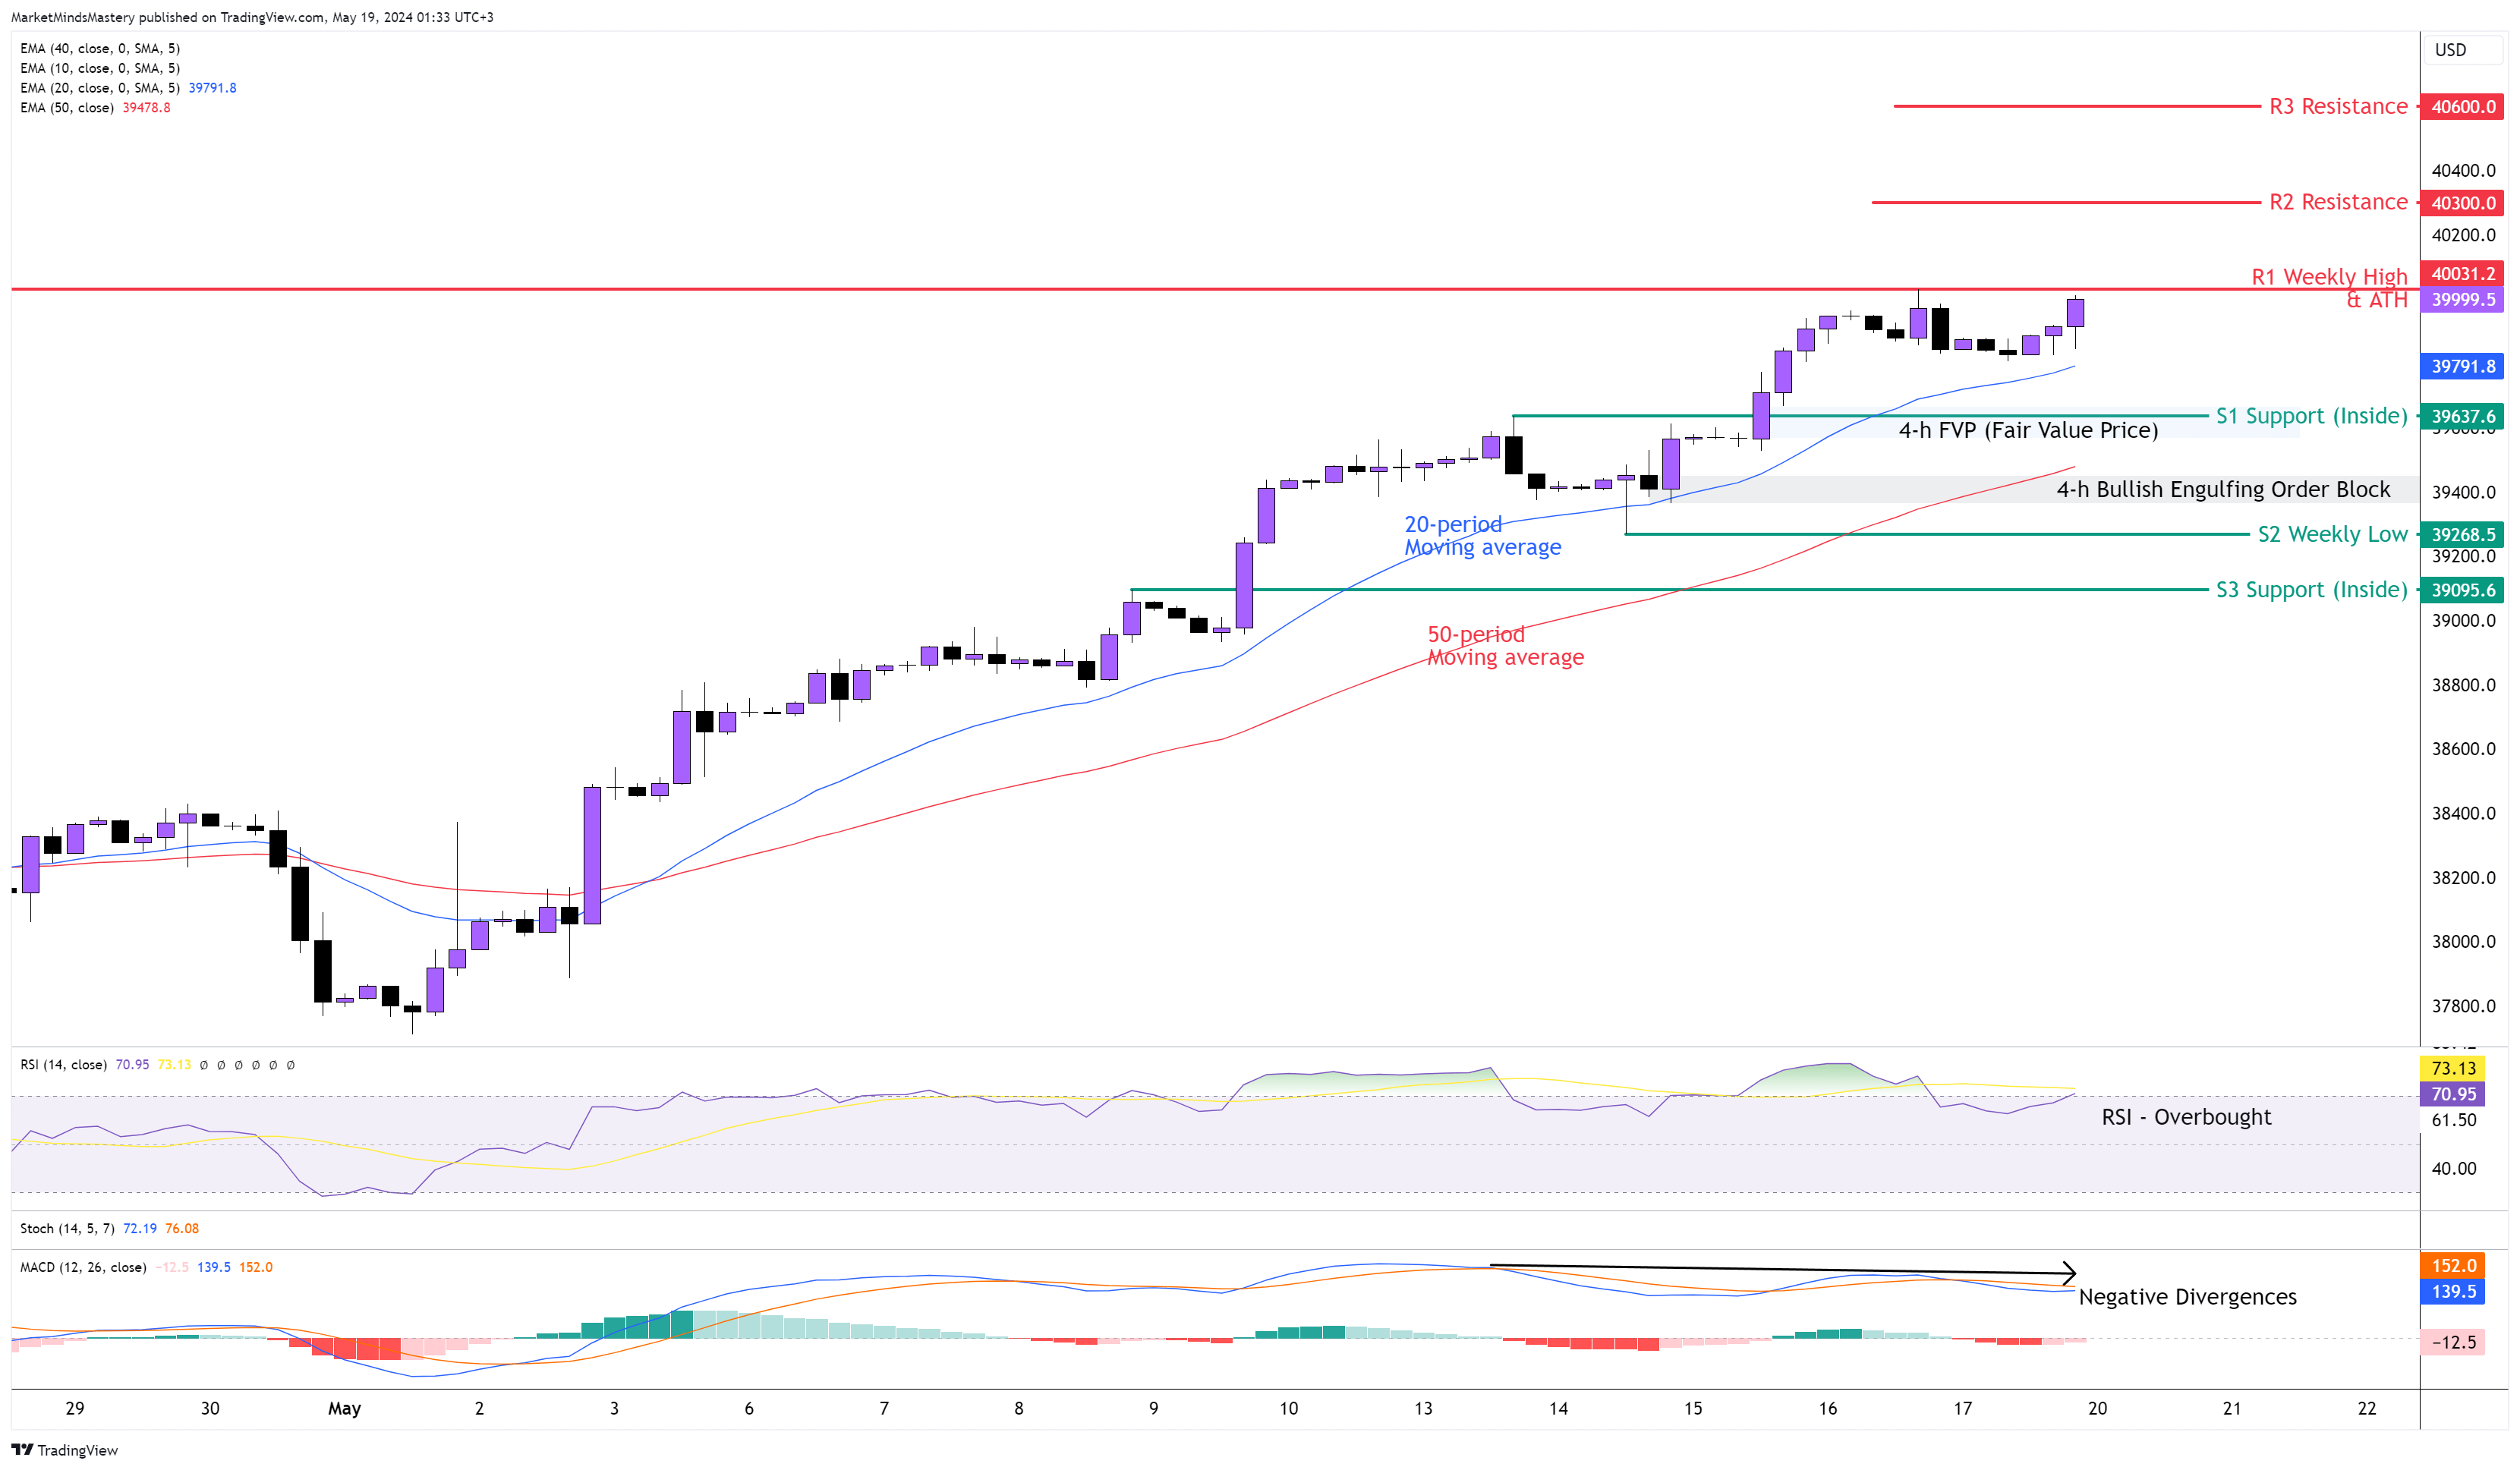
Following the uptrend of the weekly chart, last week's price continued moving upwards, successfully reaching the previous week’s high but without making a new ATH. The chart shows an equal top formation, and the MACD shows Negative Divergences. This can possibly force the price to a market correction. The RSI is overbought, indicating a strong uptrend. The 20-period moving average is above the 50-period, which has bullish implications. Starting Monday, if the price penetrates the $40000 area and closes above it, it will create an ATH. If the price keeps increasing, the resistance area R2, around $40300, will become the first potential target. A further upward move finds the next resistance area, R3, around $40600.
Conversely, if the price retraces part of its move, it will find the first support, S1, around $9637. The significance of this level is the cluster of the S1 has been inside support, and the FVP formed at this level as the price penetrated the level last week. If the price doesn’t bounce off and closes under the S1, the next support area, S2, is the previous week’s low of around $39268. Above the S2, in a short distance, a Bullish Engulfing Order Block is resting along with the 50-period moving average. This can add significantly to the S2 level due to the accumulation of orders they are resting there.
GER 30, 4H
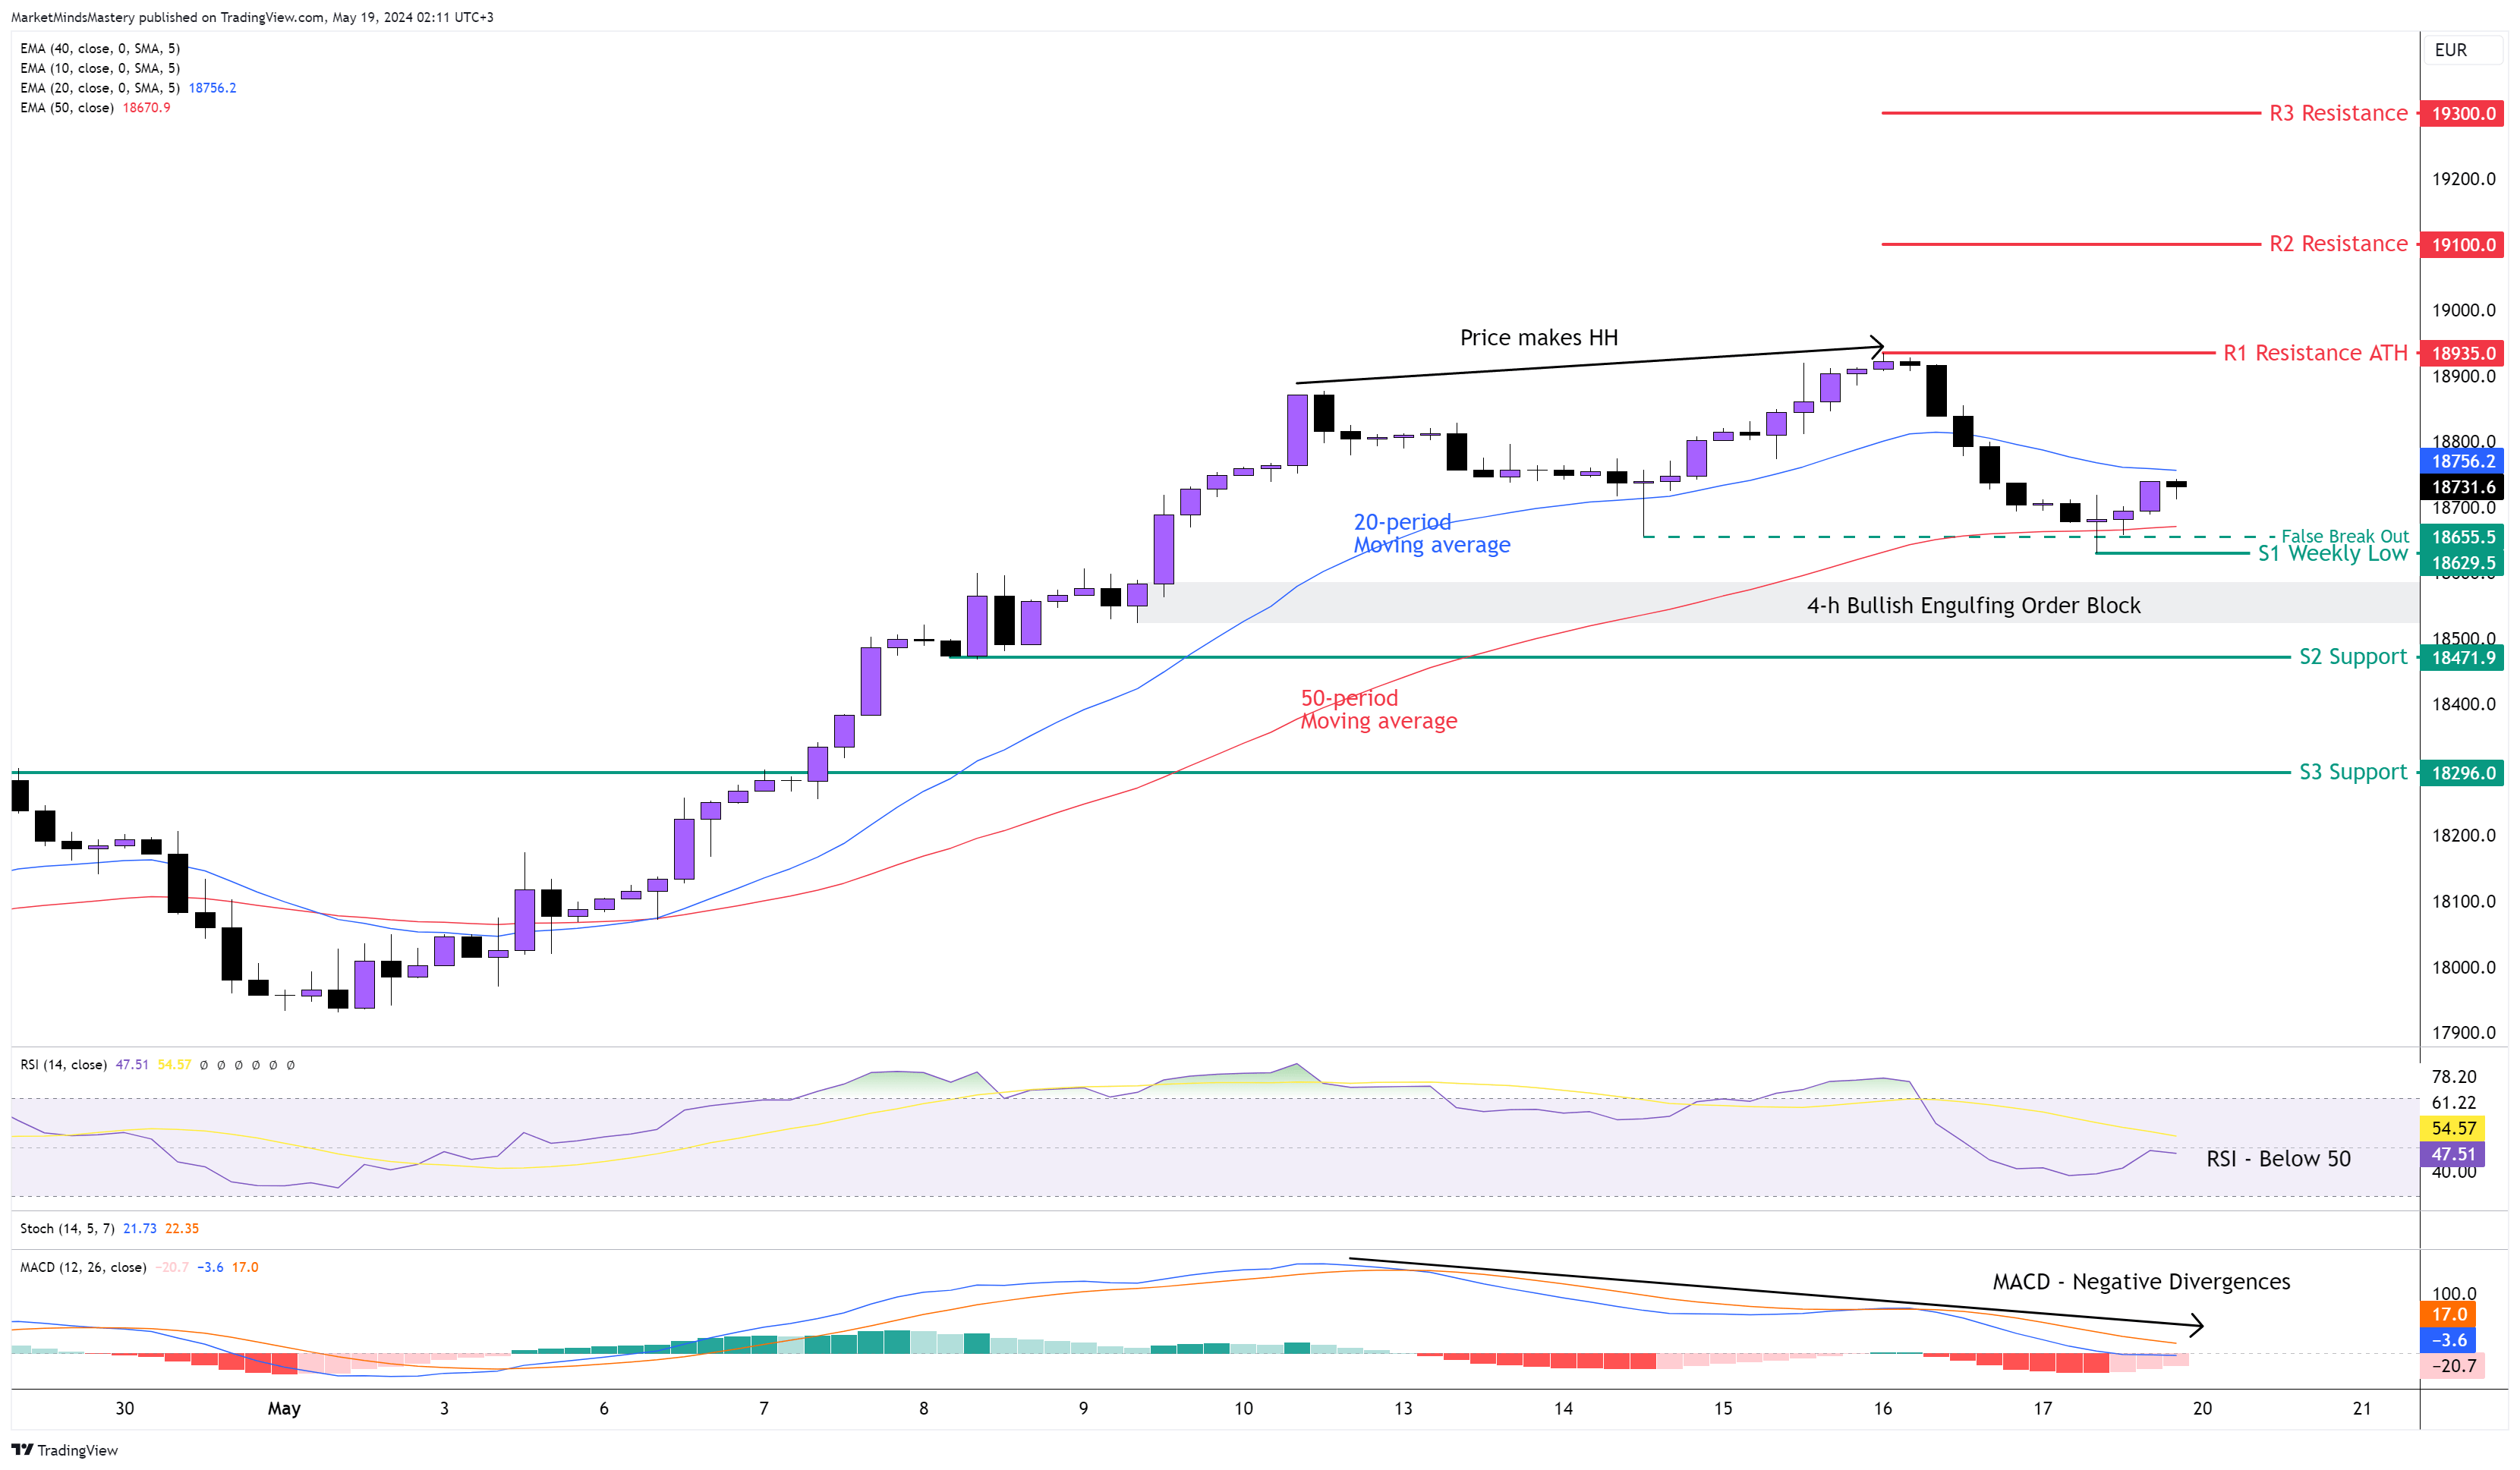
Following the uptrend on the weekly chart, the European Indice created a Spinning Top reversal candle at the ATH level. Additionally, the MACD couldn’t follow the ATH and didn’t register for a higher high. This indicates a market weakness and that the upward move is likely running out of stream. The RSI oscillator is under 50, indicating market weakness. Currently, the price is congesting within the 20 and the 50-period moving averages. Both moving averages are flat, pointing in a parallel. Starting Monday, if the price is rejected and moves downwards, the first support area, S1, is the previous week’s low, around 18269. This level had been tested two weeks ago, and the price bounced off. If the price closes under the S1 and moves downwards, the next support area, S2, is approximately 18471. A Bullish Engulfing Order Block was formed a few weeks ago at this level, and it has not yet been tested, making the Order Block significant. On the other hand, if the price finds support, bounces off and moves upwards, the first resistance area, R1, will be the ATH around 18935. If the price penetrates the R1 and moves higher, the next resistance area, R2, will be the 19100.
👉 Click here to check our Challenges
👉 Don’t miss our Free Live Webinars
👉Join us on Discord
Risk Disclosure:
The Trading Pit offers only demo accounts to all users within the Challenges and Signal Provider Agreements (Scaling Plan). All assets and trading activities are purely virtual. Please note that we do not offer CFD (Contract for Difference) challenges to residents of Canada and the United States. All content and information on this website is for informational purposes only and should not be interpreted as financial advice. Also, remember that results achieved in the past are no guarantee of future results. It is essential to understand the risks associated with trading. If you are unsure, always consult an independent financial advisor.