The markets were focused primarily on the Australian Dollar and the Swiss Frank last week. First, the RBA kept the Interest rates in Australia unchanged at 4.25%. The Australian Dollar kept dominating the EURAUD and the GBPAUD currency pairs as the negative reports on the PMIs in both the Eurozone and the UK showed indications of weak economies. A total surprise for most traders, especially beginners, was the Swissy’s performance after the SNB proceeded with a rate cut, and from 1.25%, it has now moved to 1%. Instead of becoming the weak currency across the board, the Swiss Frank appeared to be one of the most appreciated currencies at the end of the week. This was expected as the Global Geopolitical events got more intense, and the Swissy became one of the “Safe Heaven” assets, just like the GOLD.
Moving into this week’s major events, the markets will start with the Retail Sales report in Japan early in the morning. The forecast estimates a drop to 2.3%, compared to the current 2.6%. As of last week, the Japanese yen resumed most of the major trends, which has advanced against all the other major currencies. This event can cause some trend retracements. Next will be the CPI (Consumer Price Index) in Germany, which is expected to decrease from 1.9% to 1.7%. Last week, the Euro was among the weakest currencies, and this event outcome can cause noticeable changes in the Euro currency. If the outcome confirms the forecast, and if the market follows through, we can see a much weaker Euro. Once the London trading session begins, in Switzerland, they will report the KOF Economic Barometer, and the consensus estimates a drop from 101.6 to 101. As it takes into consideration 216 Indicators for this event outcome, it is considered an important event for Switzerland’s economy. Still, at the same time, it is not the most significant event that causes trend changes in the markets. For the whole day, in Canada, the Banks will be closed in observance of the National Day for Truth and Reconciliation. Hence, we expected the volatility and the liquidity to be minimal, especially for the Canadian Dollar. Next, the European Central Bank President Legarde will give a speech, and during the event, the volatility is expected to be extreme for the Euro. Less than 1 hour after Legarde’s speech, in the US, they will report the Chicago PMI (Purchase Manufacture Index), which is expected to decrease from 46.1 to 45.2. The trading day will end with the FED Chairman’s Powell Speech.
On Tuesday, the volatility is expected to start rising in the early morning as in Japan, they will report the Unemployment Rate. Currently, the unemployment rate in Japan is 2.7%, and as per the forecast, it is expected to drop to 2.6%. If the outcome confirms the forecast and, at the same time, the market follows through, the Janapness Yen can become a strong currency across the board, and the downtrend in USDJPY, GBPJPY and the rest of the currency pairs will most likely continue. The following event will be the European Central Bank Chief Economist Lane's speech, in which we will get a new understanding of how they see the economy in the Eurozone and what are the major updates, as, week by week, the political and geopolitical events become very sensitive. The next event will be the Retail Sales in Australia. The forecast estimates an increase from 0.0% to 0.4%. If this happens, the Australian Dollar is expected to gain strength, and the AUDUSD Bullishness might continue. During the London session, in the UK, the Manufacture PMI is expected to be reported at its current number of 51.5. Next, in the Eurozone, they will report the CPI (Consumer Price Index), and the consensus estimates a drop from 2.2% to 1.9%. If the outcome confirms the forecast, it can be devastating for the Euro currency as it will add a strike of negative reported significant news events, which the only thing they do is to weaken the Euro currency. In this case, the most noticeable Euro fall is expected in commodity currencies against the Euro plus in the EURJPY currency pair. The last significant event for the day will be the ISM Manufacture PMI in the US. The forecast shows a small increase from 47.2 to 47.6. As the markets will be expecting the NFP report on Friday to determine the US Dollar’s performance, this event doesn’t usually create any directional move prior to the NFP.
There will be a few significant news events on Wednesday. During the Asian trading session, volatility is expected to be normal, as there won't be any significant news events. Only a few hours after the London trading session starts, the Unemployment Rate in the Eurozone will be reported, and the consensus estimates an unchanged number remaining at 6.4%.
The last important event of the day will be the ADP Employment Change. The forecast estimates an increase in the number of Employed People in the US from 99K to 125 K. This is an earthly indication of the NFP, which will be reported 48 hours later. Usually, the correlation between the ADP and the NFP is high, but there are times when the NFP doesn’t follow the ADP report.
On Thursday, the markets will get active early in the morning. In Australia, they will report the Trade Balance, and the forecast estimates an increase from 6.009B to 6.01 B. As the forecasted number is very close to the current number, the markets will only expect a significant move on the Aussie if the reported number deviates much from the forecast. The next event will be the CPI (Consumer Price Index) in Switzerland. Currently, the CPI is 0%, and the consensus estimates a decrease to -0.1%. A negative CPI report always has a positive feeling for the consumers, but when it comes to the currency’s value, it always plays the opposite role, making the currency weak. If the reported outcome confirms the forecast and if the market follows through simultaneously, we might see some weakness in the CHF. Next will be the Services PMI Final and the Composite PMI Final in the UK. Both are expected to remain around 52.8 to 52.9, which can be considered as a positive for the Sterling. Around midday, the PPI (Producer Price Index) will be reported in the Eurozone, and the forecast shows a drop from 0.8% to 0.4%. The last significant event for the day will be the ISM Services PMI in the US, which is expected to increase from 51.5 to 51.6. The volatility around this repost usually tends to increase, and day traders must be aware of it.
Friday is the day all traders anticipate. Almost every month, on the first Friday of the month, the US reports the NFP (Non-Farm Payrolls). This is one of the most important and anticipated news events as it plays a major role in the US Dollar’s performance, and the volatility around the event increases drastically. But before that, during the European trading session, in Switzerland, they will report the Unemployment Rate. The consensus estimates an increase in the country’s unemployment from 2.5% to 2.6%. An increase in unemployment usually negatively impacts the country's currency. The next major news event will be the Construction PMI in the UK. The forecast estimates a decrease in the number this time, and from 53.6, it is expected to drop to 53.1. All market participants' attention will be on the New York trading session, as in the US, the NFP will be reported. This is an event that attracts the attention of all market participants. It is one of the most significant events that can cause a directional move on the US Dollar. As per the forecast, the new payrolls added to the US economy last month were 144K compared with the 142K added on the previous report. If the number reported that day confirms the forecast, a strong USD may be seen on the chart, and the GBPUSD, AUDUSD, EURUSD, and the rest might decline. Opposively, a negative reading number can fuel the weakness of the US Dollar and surpass 100.00 on the Dollar Index, as shown on the DXY weekly chart. At the same time, the Average Hourly Earnings are expected to drop from 0.4% to 0.3%, and the Unemployment Rate to remain at 4.2%.
EUR USD 4H

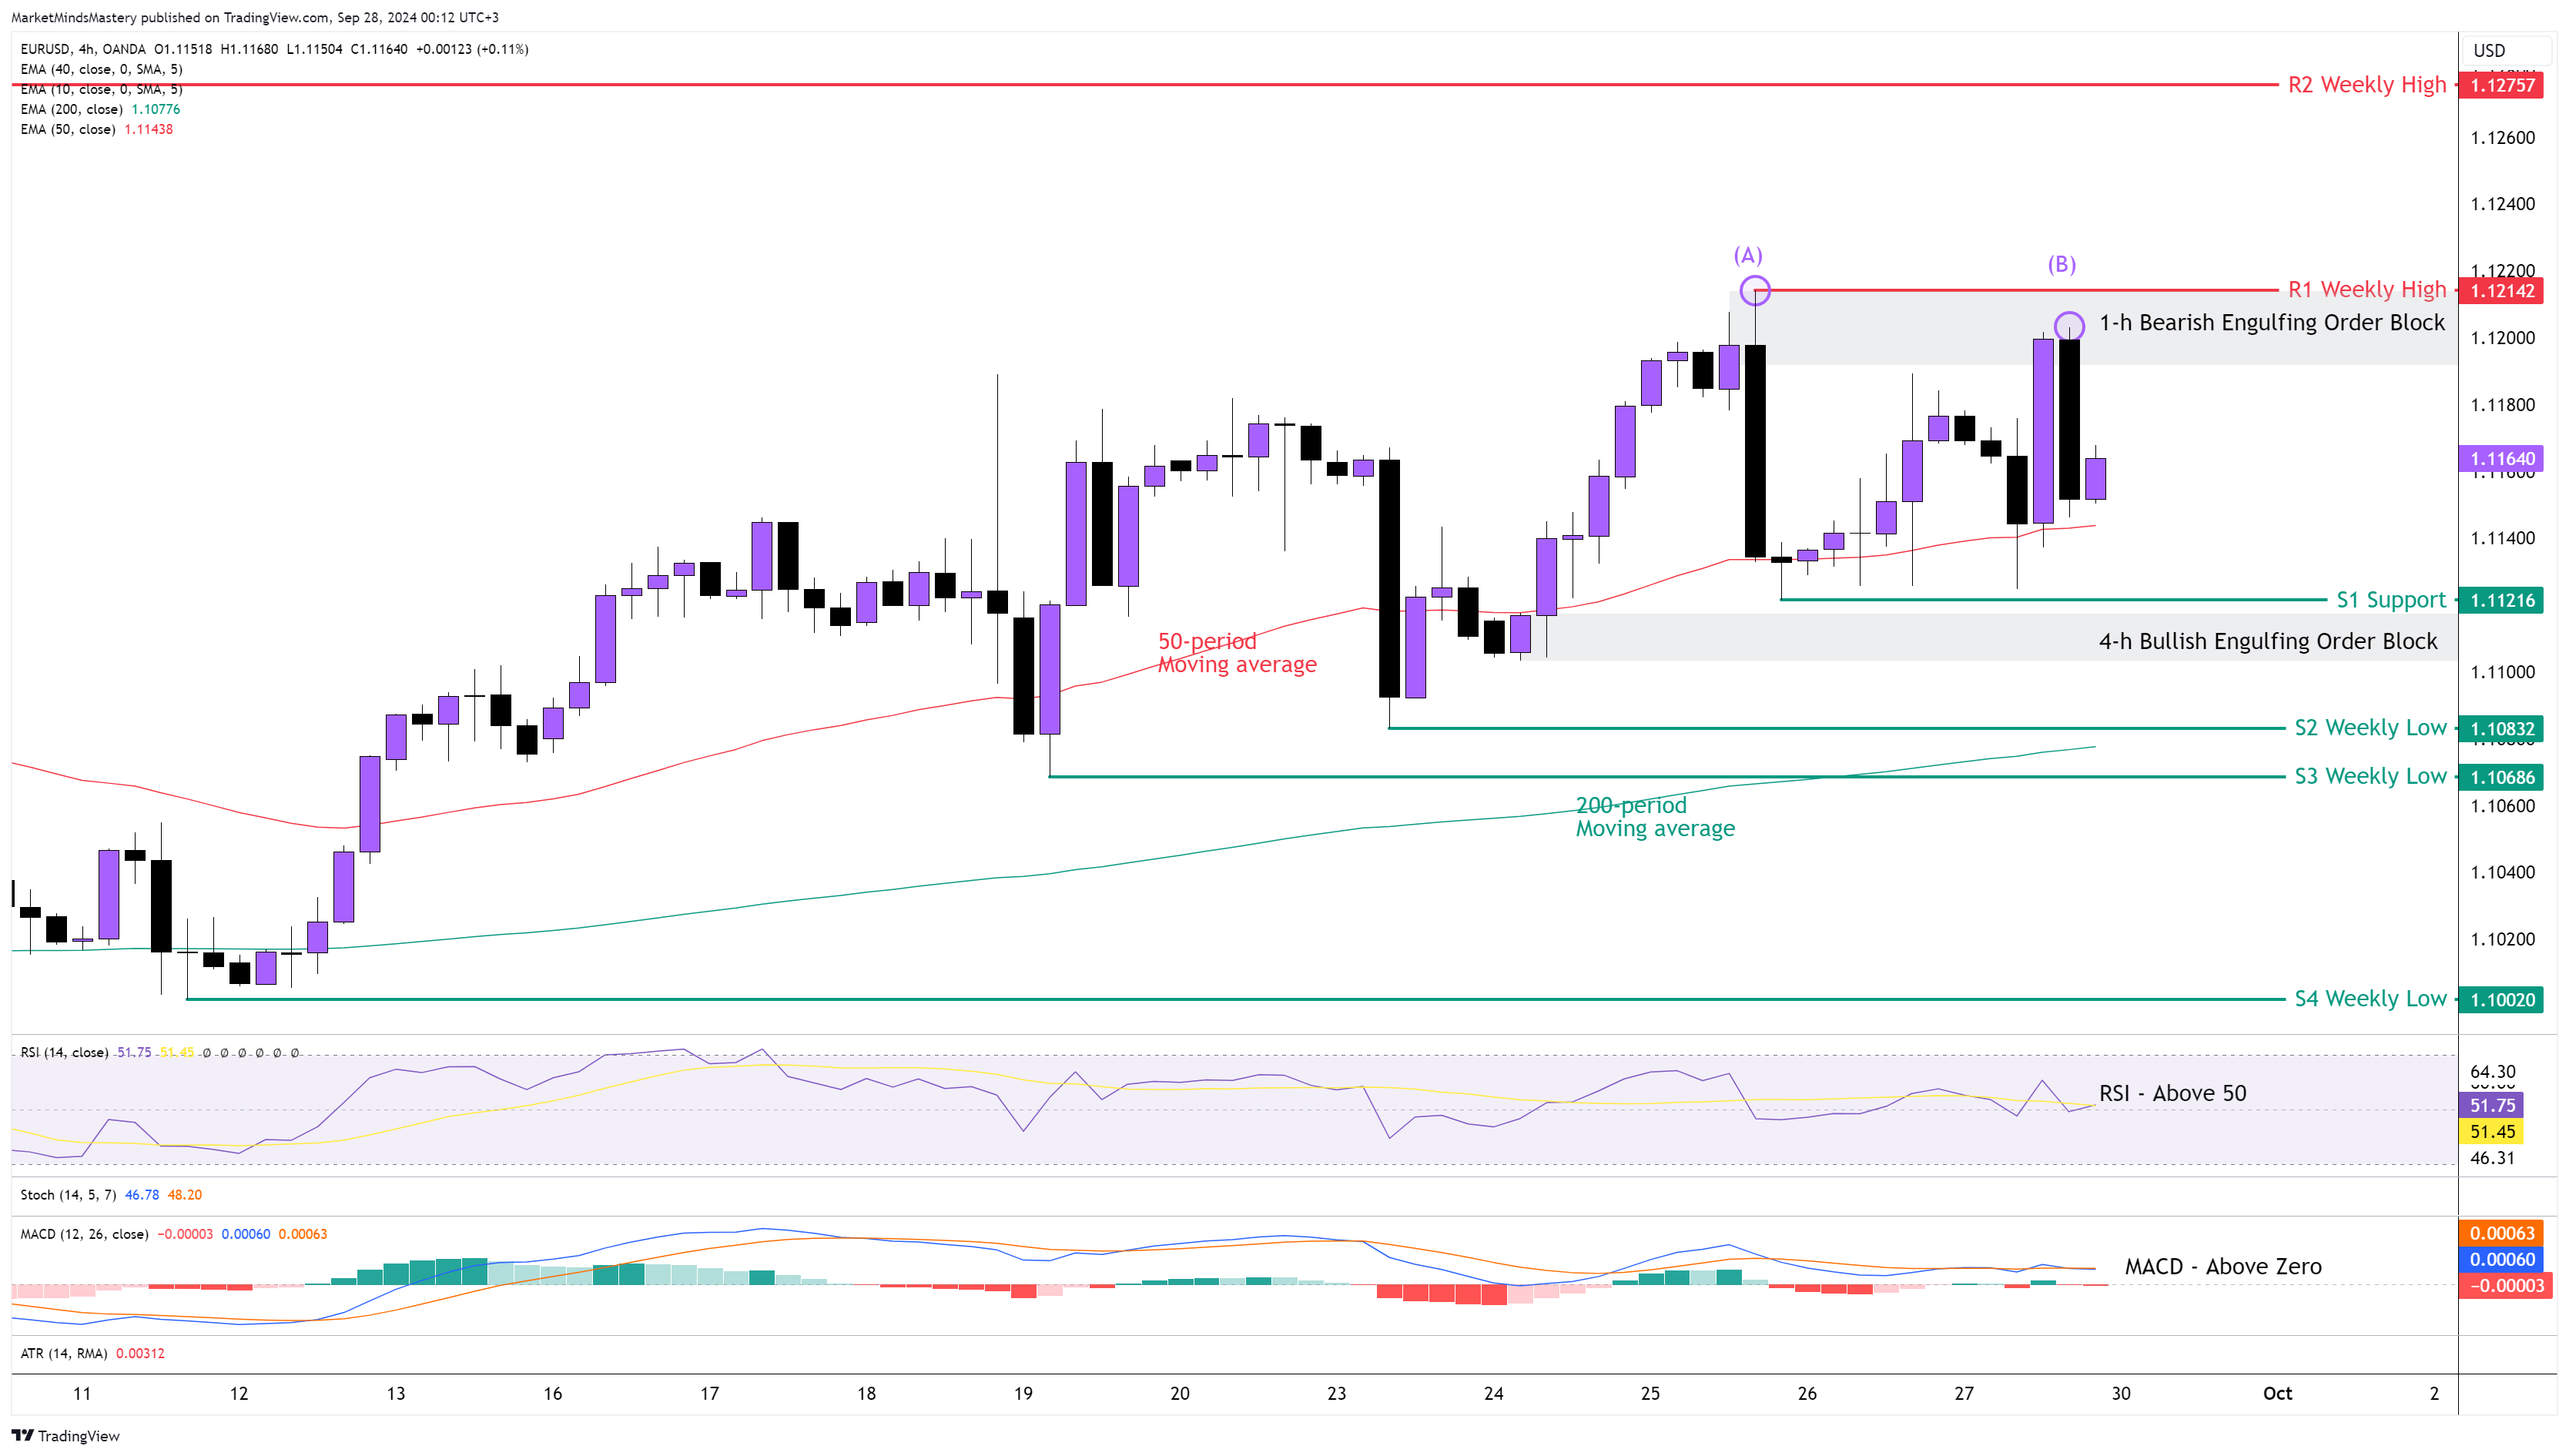
Following the previous week’s Market Outlook, the price of the EURUSD kept moving upward until it reached the weekly resistance levels, as we pointed out in the charts last week. The price formed a Bearish Engulfing Order Block last Wednesday, which it tested last Friday during the New York trading session, and the price declined and moved downwards. The price on the weekly chart ended as a Doji candlestick price action pattern. On the 4-hour chart, the price failed to create a higher high at point (B), which indicated less buying interest by the market participants. As the price is above the 50-period and the 20–period moving average, the market is considered bullish. The RSI Oscillator is above this middle line of 50, and this is bullish. The MACD is above its zero line, which is also a bullish sign. If the price moves upwards, the first resistance area, R1, will be the previous week’s high, around 1.12142. If the price penetrates the R1 resistance and if it keeps moving upward, the next resistance area, R2, will be the 1.12757, which is an older weekly high level.
On the other hand, if the price declines and moves downwards, the first support area, S1, will be around 1.11216. If the price declines further and moves below S1, there is a Bullish Engulfing Order Block, which can cause support at around 1.11000. A continuous downward move will find the next support area, S2, at approximately 1.10832. A further downward move can cause the price to move to the next support area, S3, around 1.10686.
GBP USD 4H
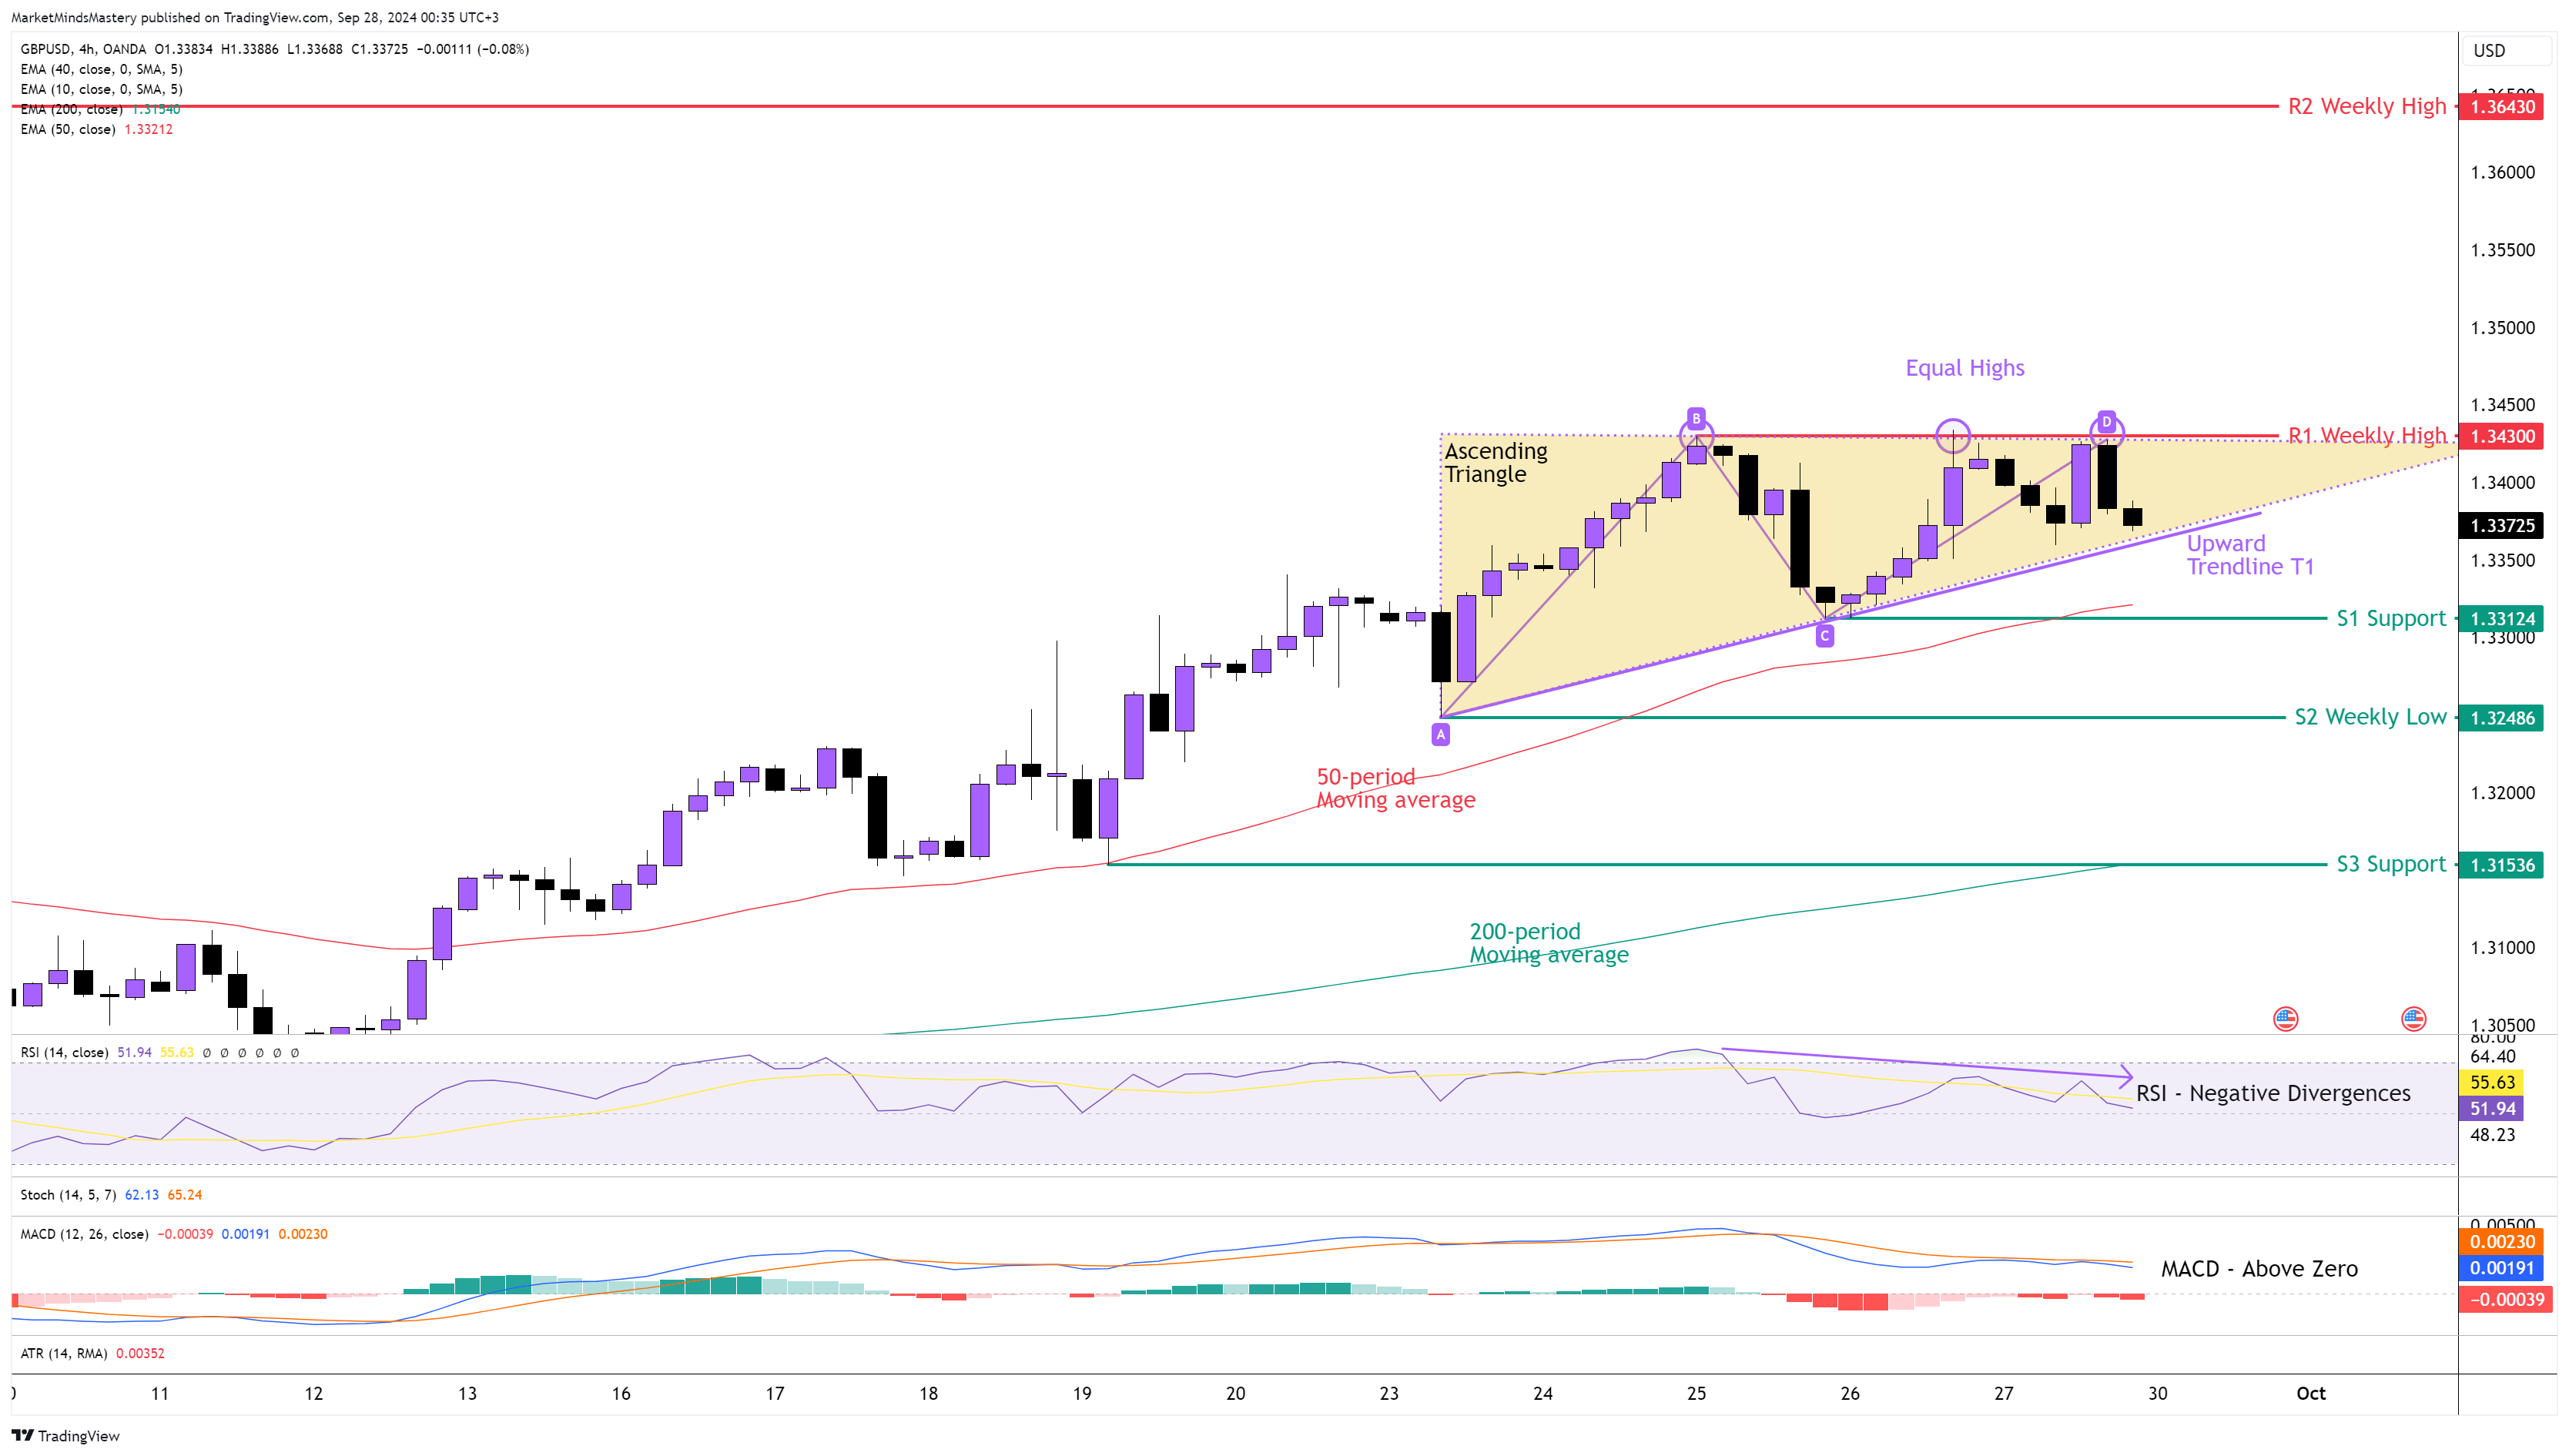
Last week, we said that Sterling is one of the most dominant currencies across the board. The strength continued last week as the price of the GBPUSD created a weekly price action with a higher high and a higher low.
On the 4-hour chart, the price formed an Ascending Triangle continuation pattern. This pattern is considered one of the most reliable chart patterns, indicating that the uptrend will continue. Traders need to be aware that not all patterns work out as expected. The validity of this Ascending Triangle will occur once the price penetrates the upper liner, which makes the Equal Highs as seen on the chart. The moving average analysis indicates bullishness as the 50-period is above the 200-period. As the price created equal highs, the RSI Oscillator showed this as a weakness of the price to create a new high. Therefore, there is a lack of price momentum. The divergences formed by the RSI are the Negative Divergences B class. Starting Monday, if the price moves upwards, the first resistance area, R1, will be around 1.34300. If the price penetrates the R1 and keeps moving upward, it will fulfil the criteria for a valid ascending triangle pattern. In this case, if the price keeps moving upwards, the next resistance area, R2, will be around 1.36430.
On the contrary, if the price declines and moves downwards, the first support area, S1, will be around 1.33124. If the price surpasses S1 and keeps declining, the next support area, S2, will be the previous week’s low, around 1.32486.
AUD USD 4H
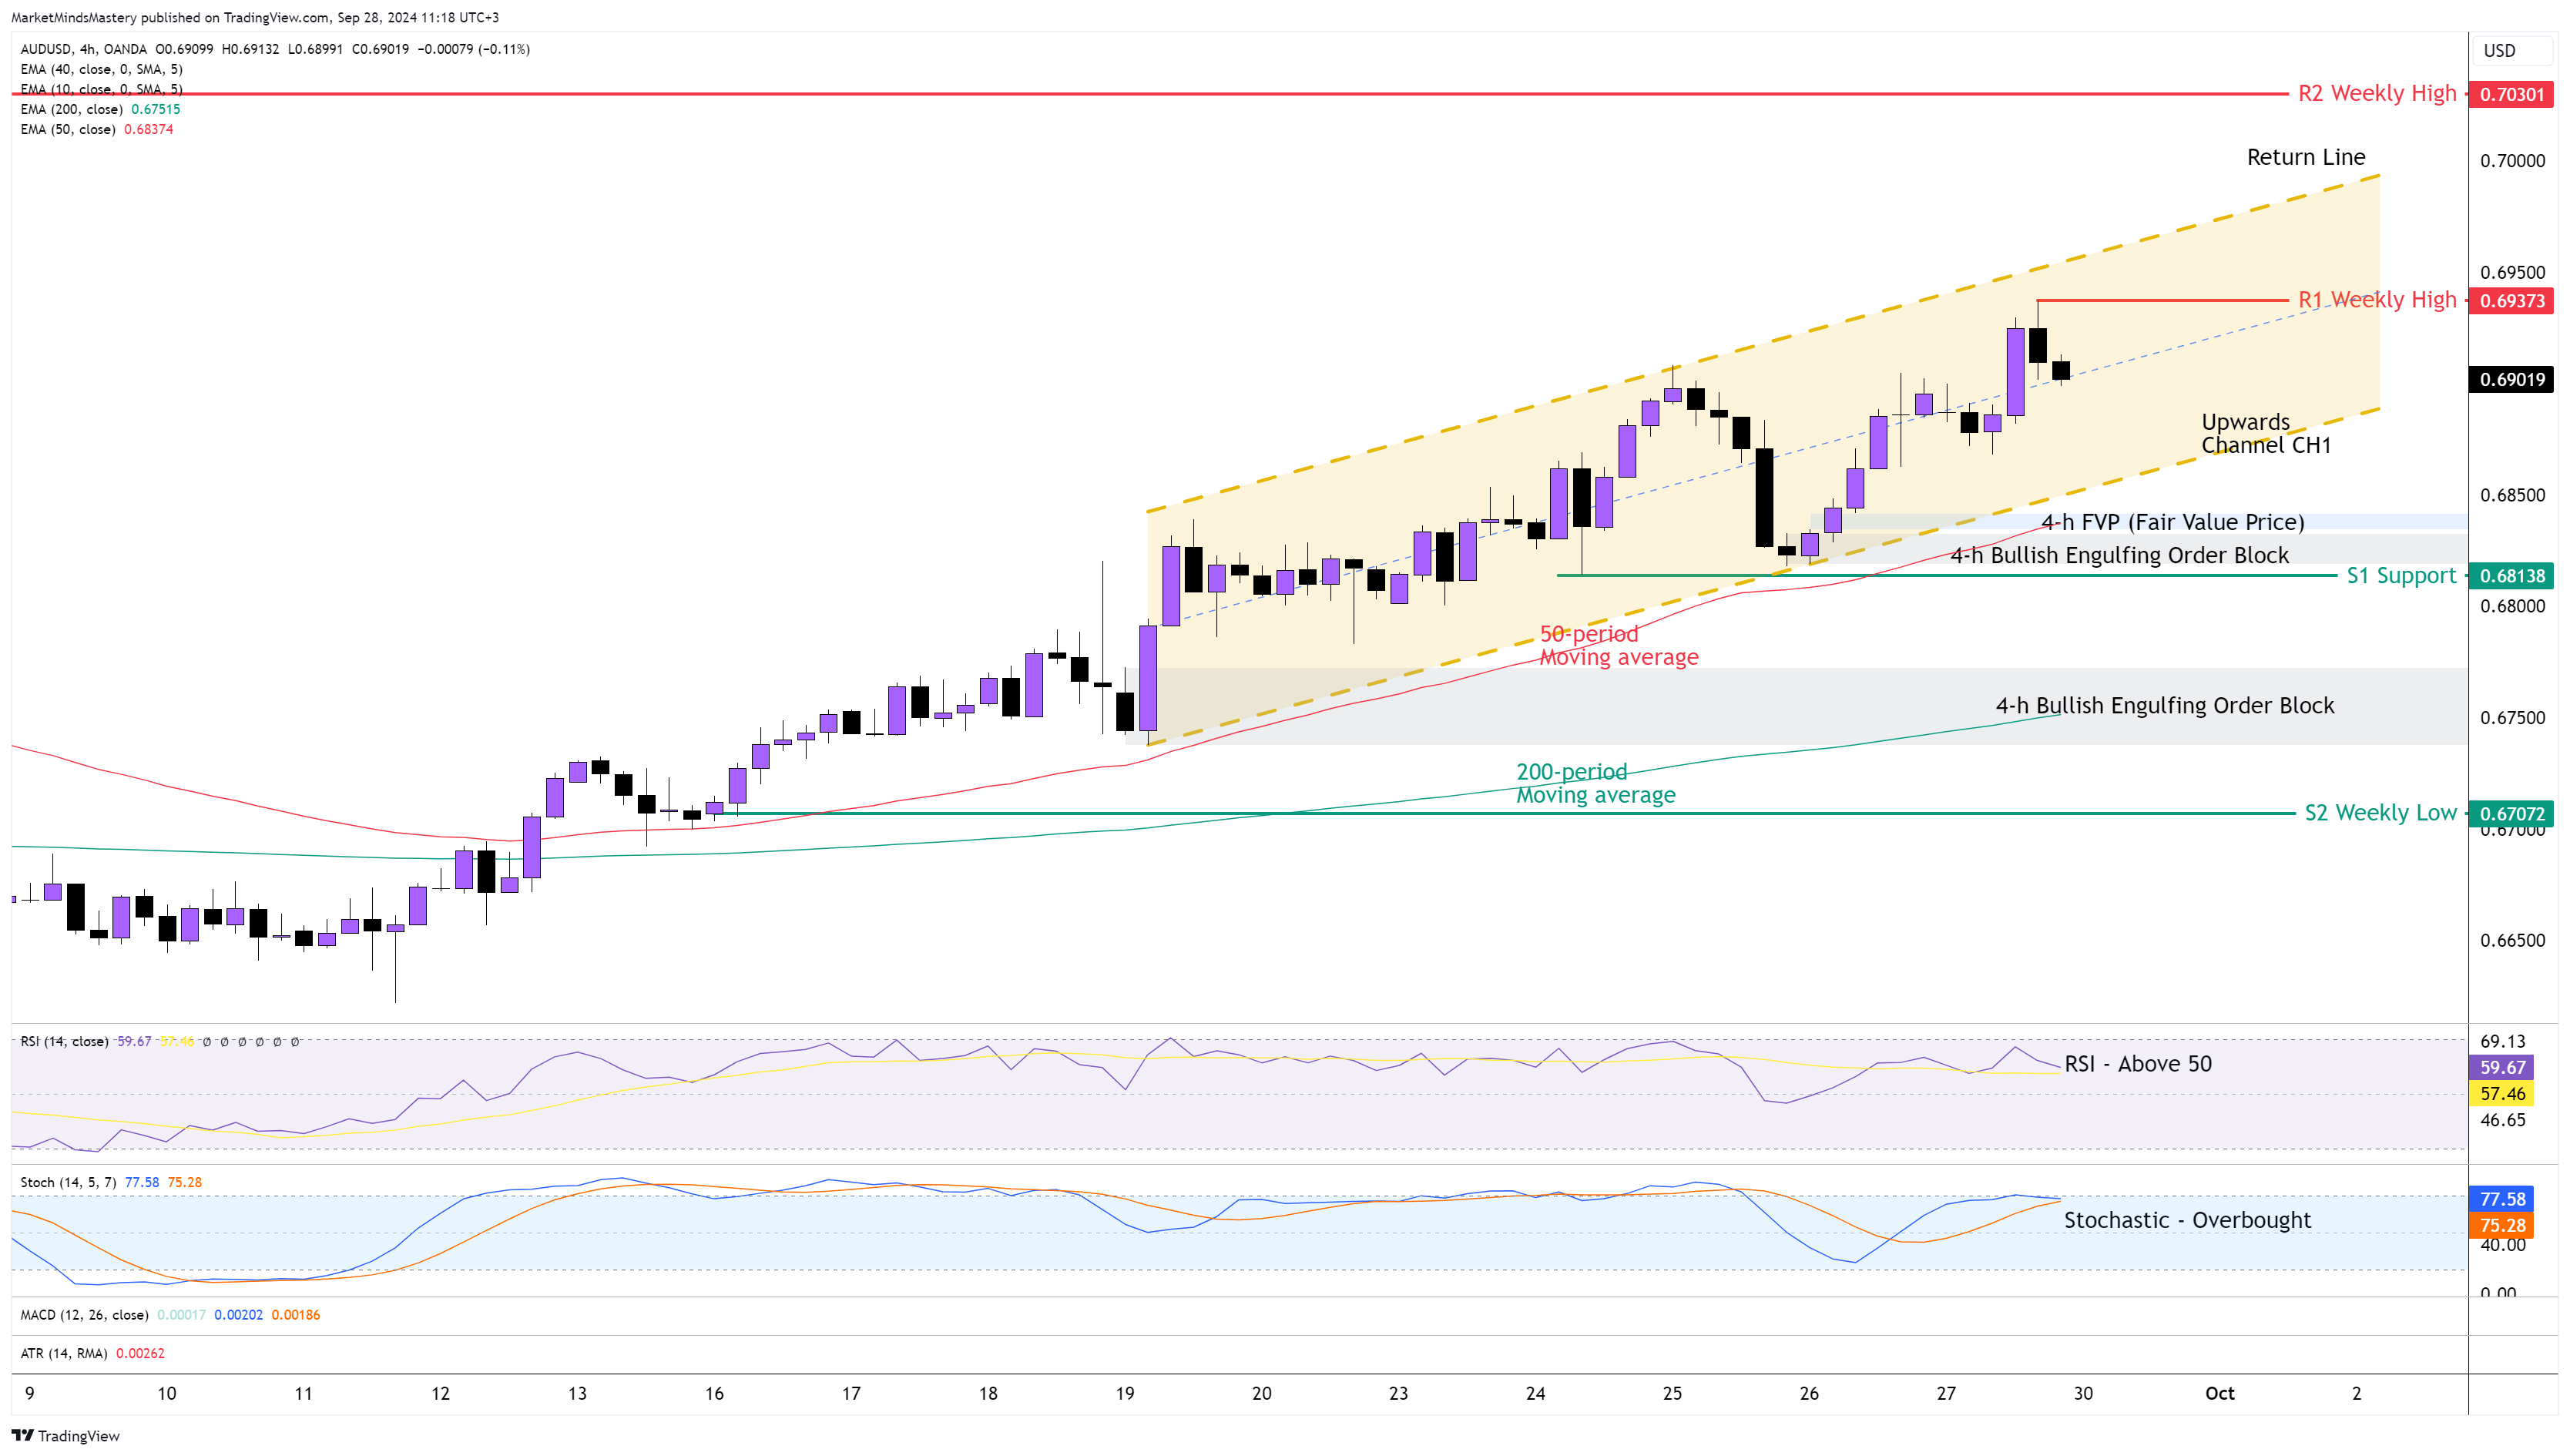
Regardless, the RBA (Reserve Bank of Australia) kept the Interest Rates in Australia unchanged, the price didn’t follow through last week and kept moving upward. Usually, when a country keeps its Interest Rates the same or cuts them, the currency is considered weak because it automatically becomes a “less attractive” currency for traders and investors. The Weekly price action ended as a Bullish candle, with its closing price above the previous candle’s high. On the 4-hour chart, the price created a series of higher highs and higher lows, which is bullish. A Tentative Upwards Channel CH1 can be drawn as shown on the chart. The 50-period moving average is above the 200-period, which is bullish. The RSI is around 60, indicating bullishness. The Stochastic Oscillator is around its Overbought condition, which also has bullish implications. Starting Monday, if the price declines and moves downwards, the first support area, S1, will be around 0.68138. This is a key level of support because, in this area, there is an FVP(Fair Value Price) and a 4-h Bullish Engulfing Order Block, both created last Thursday, and they can provide additional support. If the price penetrates the S1 support and declines further, the next support, S2, will be around 0.67072, which is an older weekly low level.
On the other hand, if the price bounces off and moves upwards, the first resistance area, R1, will be around 0.69373, which is the previous week’s high. In case the price penetrates the R1 and keeps moving upwards, the Return Line of the CH1 channel can be used as a resistance level. If the price penetrates the Return Line and keeps increasing, the next resistance area, R2, will be approximately 0.70301.
USD JPY 4H
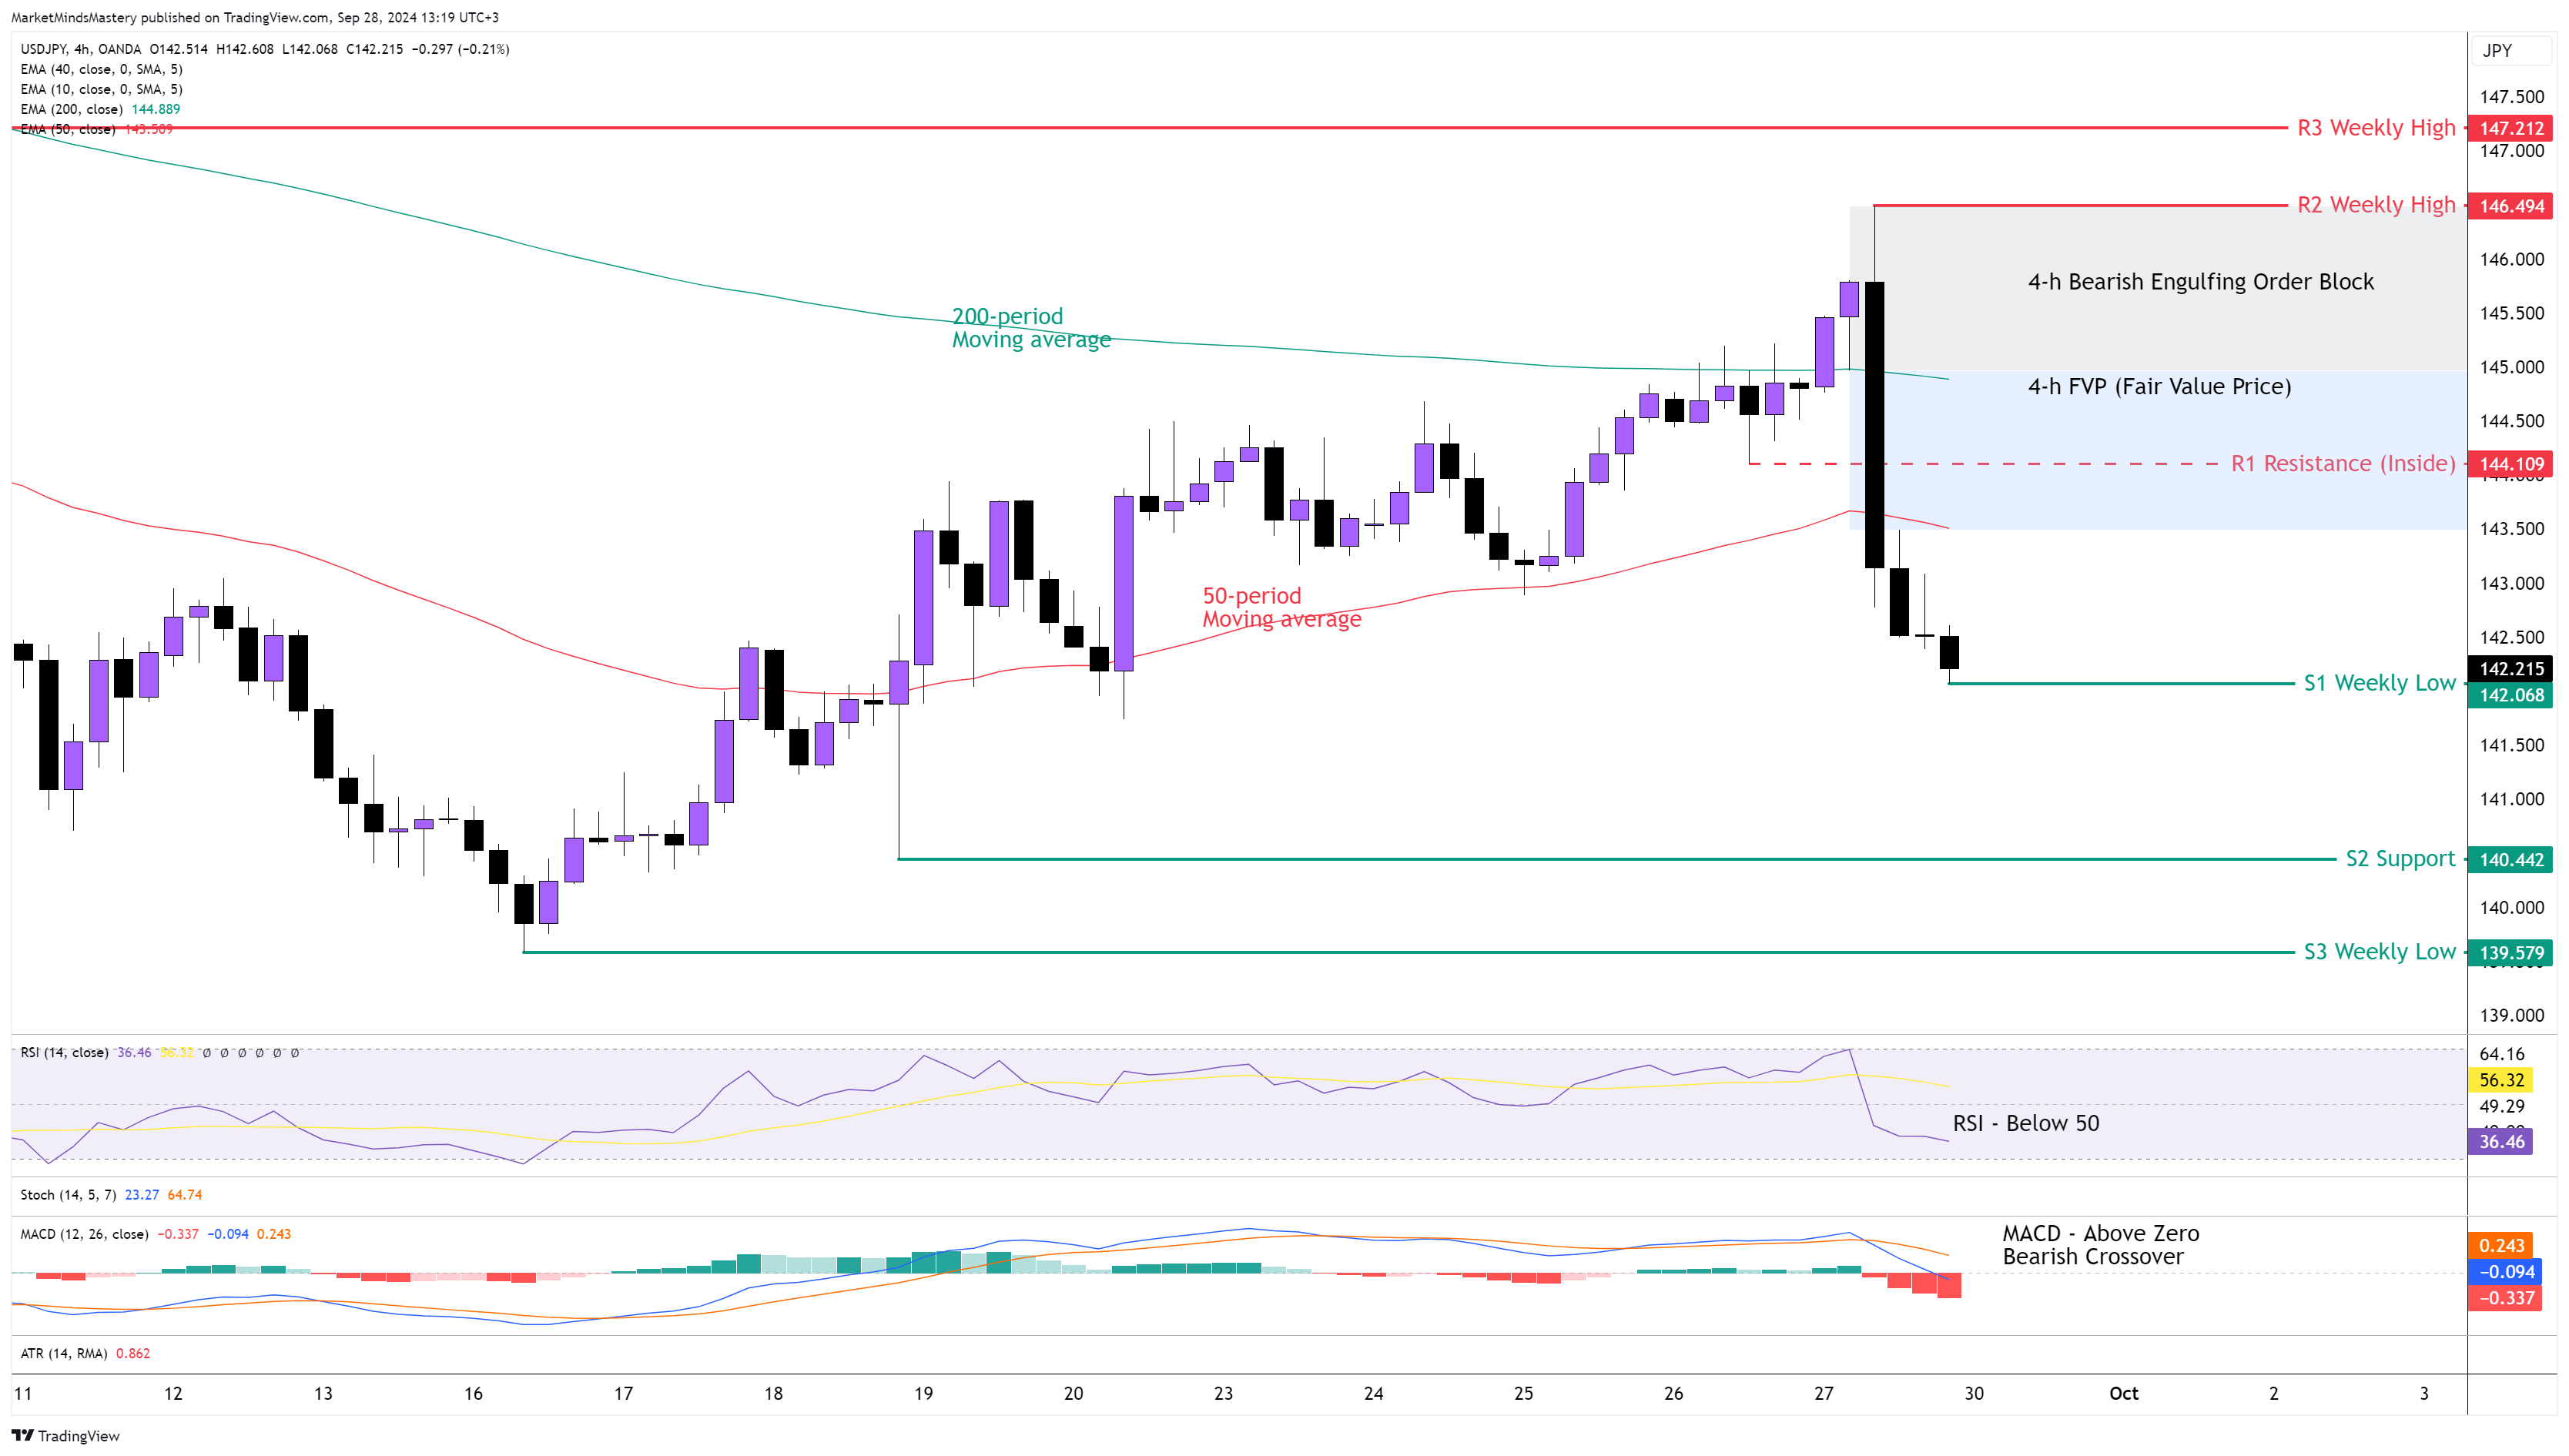
Following the previous week’s bullish move, the price of the USDJPY was trading upwards and on Friday, it declined about 3700 points (370 pips) on a single candle on the 4-hour chart, forcing the price to change the market structure of the currency pair. This happened once the price touched the 10-period weekly moving average and the price resumed the major downtrend. On the 4-hour chart, the price created a new lower low and which signifies the potential start of a downtrend. The 50-period moving average is below the 200-period, and this is bearish. As expected, the RSI moved below its middle line of 50, which has bearish implications. The MACD created a bearish cross-over while it was above its zero line. The MACD’s Histogram is also below its zero line as it follows the price decline as shown on the chart.
Starting Monday, if the price keeps trading below the 50-period moving average and moves downwards, the first support area, S1, is around 142.215, which is the previous week’s low. If the price penetrates S1 and moves lower, the next support area, S2, is approximately 140.442.
On the other hand, if the price bounces off and moves upwards, the first resistance area, R1, is an Inside Resistance around 144.109. If it breaks and closes above the R1, the next resistance area, R2, is around 146.494, which is the previous week’s high. A key price level on this chart is the 145.000, as last Friday, the price created an FVP (Fair Value Price) and a Bearish Engulfing Order Block. Additionally, the 200-period moving average is fluctuating around this level.
USD CHF 4H
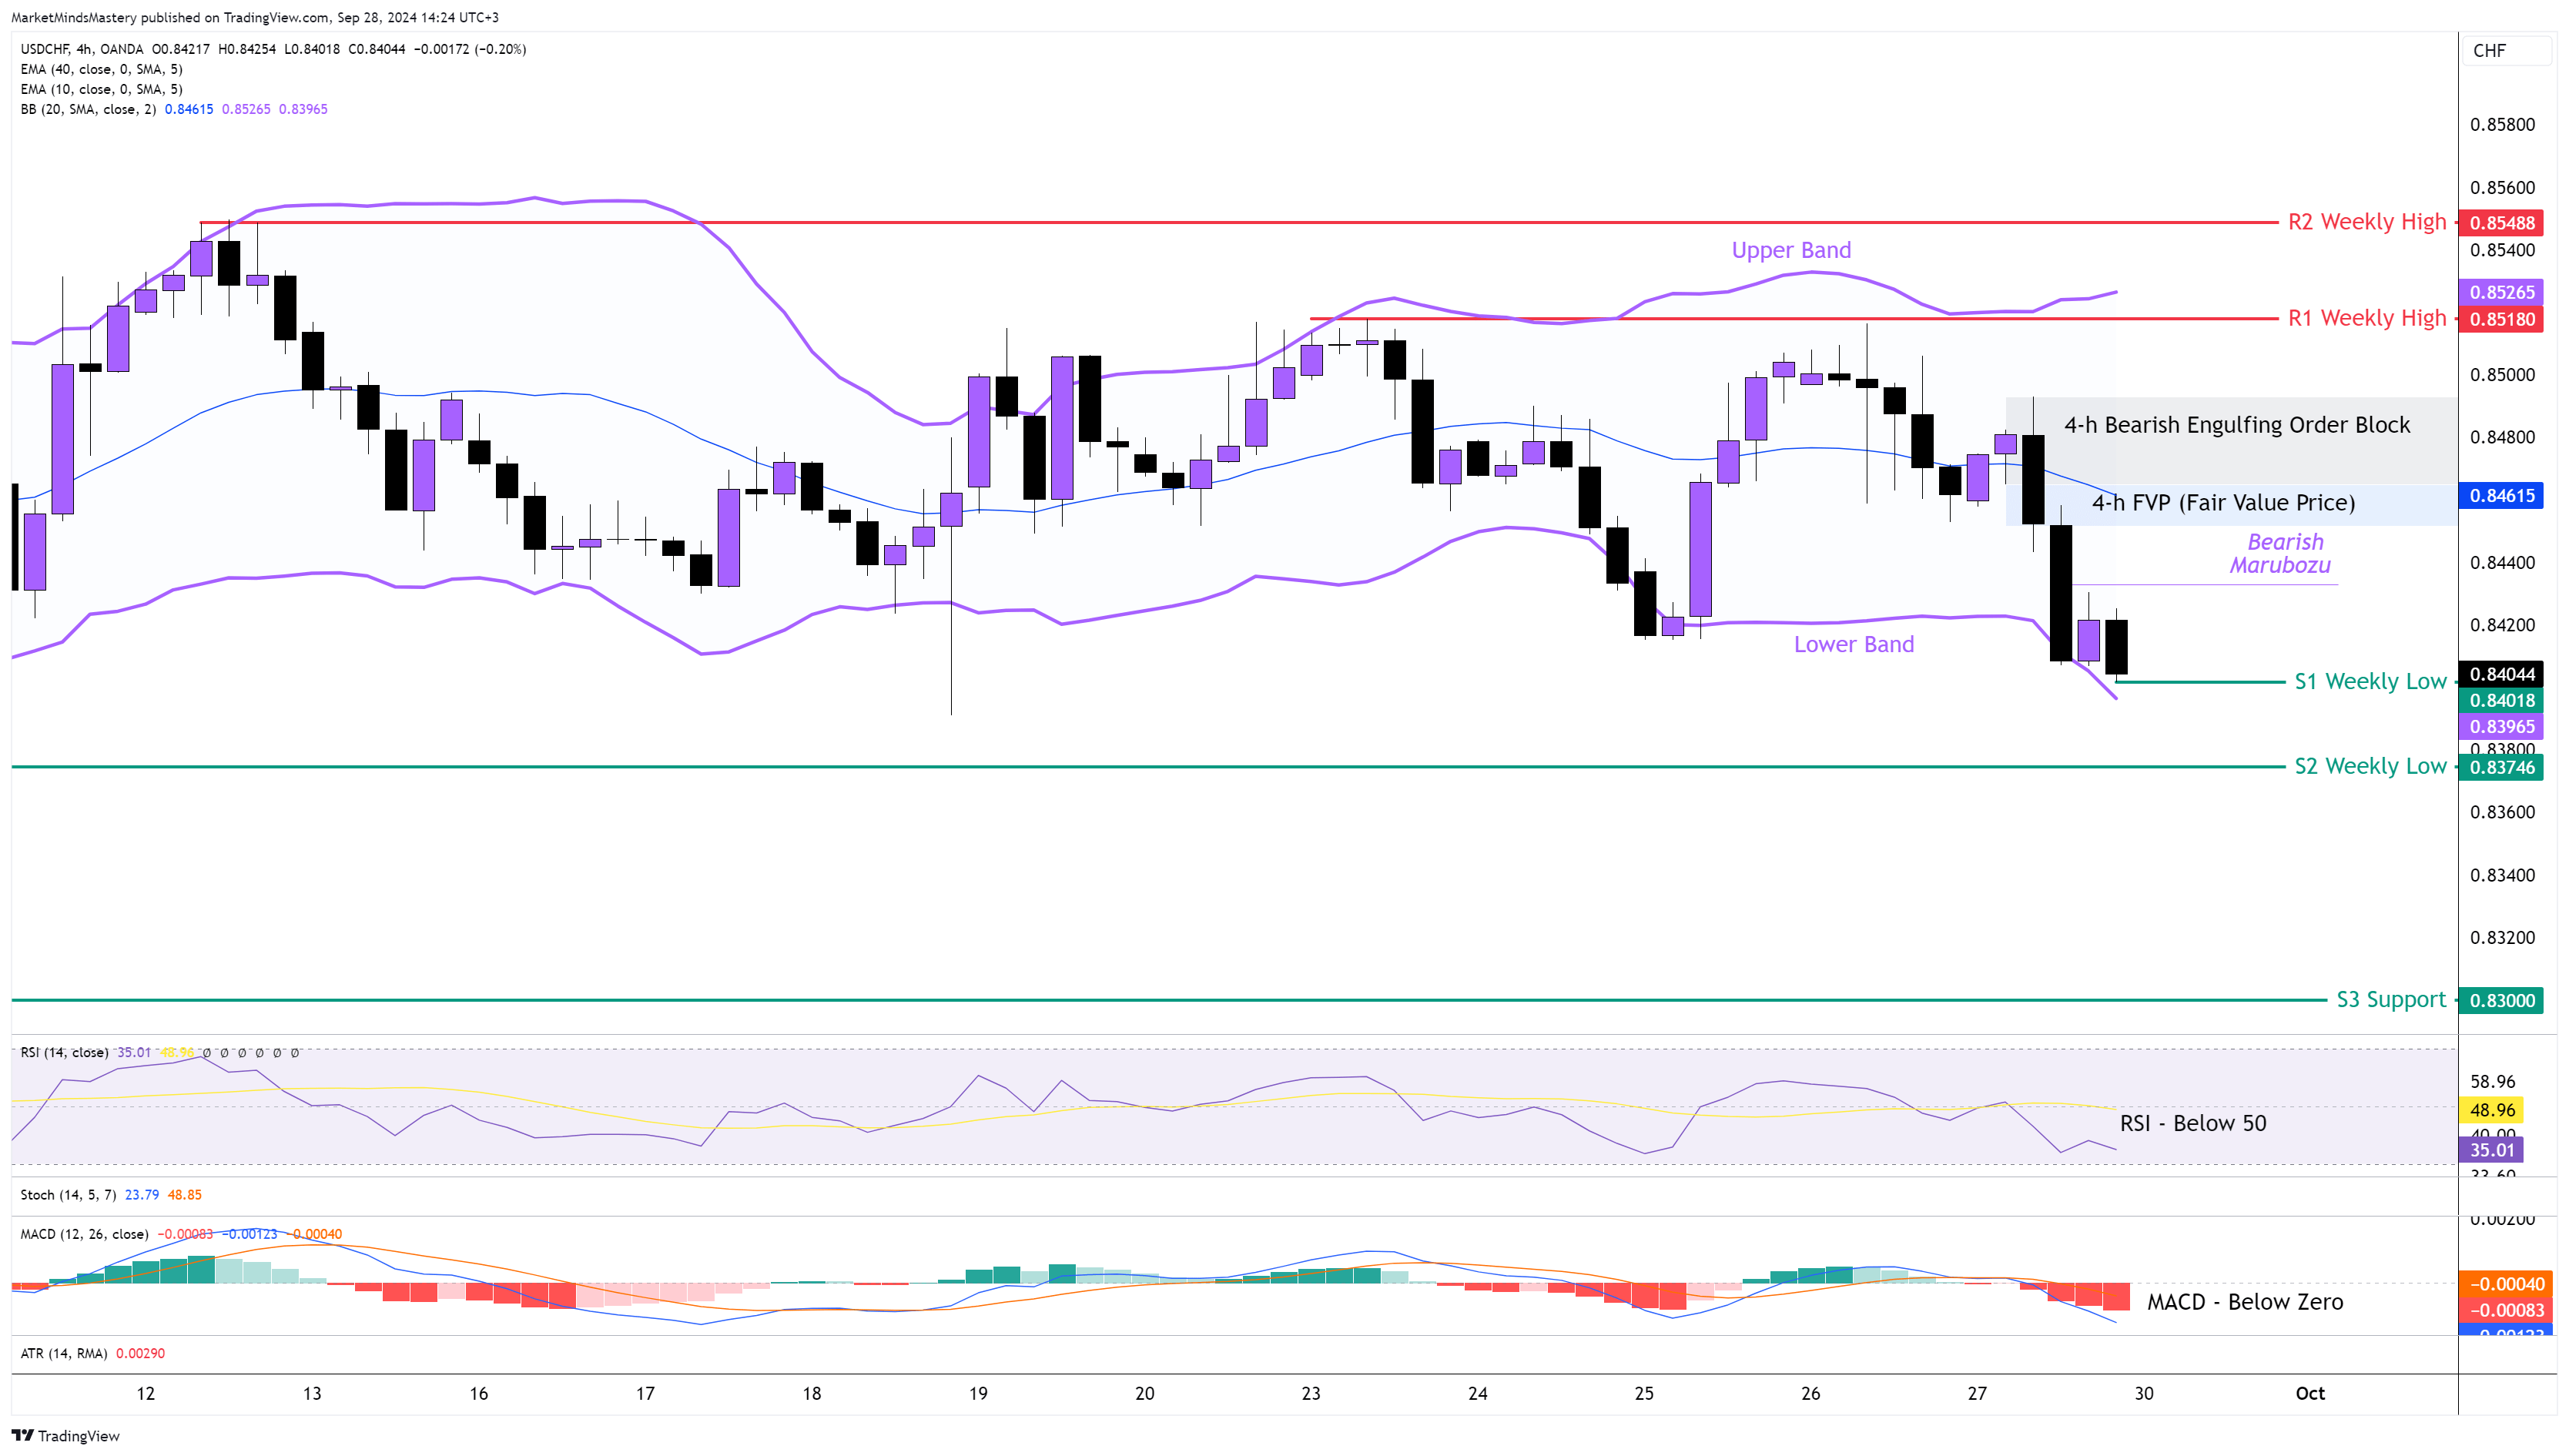
Last week, the SNB cut the Interest Rates in Switzerland, and the Swissy became one of the strongest currencies instead of the opposite. The CHF was dominating the markets not only against the US but also against other currencies. The main reason is the belief in Switcherland’s good economy. The Swiss Frank is considered one of the “Safe Heaven” assets during uncertain financial and geopolitical situations like the current ones we are experiencing worldwide. The price on the 4-hour chart is trading within a range that is easy to see using the Upper and the Lower Bands of the Bollinger Band indicator. During the New York trading session, the price created a Bearish Engulfing Order Block around 0.84800 last Friday and an FVP around 0.84600, which was followed by a Bearish Marubozu candlestick pattern. The week finished with the price being at the indicator’s lower band. The RSI Oscillator is below 50, indicating bearishness. The MACD is under the zero line, and this has bearish implications.
Starting Monday, if the price continues to move downwards, the first support area, S1, will be the previous week’s low, around 0.84044 and the next support, S2, will be an older weekly low, around 0.837466. A further downward move will find the next support area, S3, around 0.83000. On the other hand, If the price finds support, bounces off and moves upwards, the first resistance area, R1, will be 0.85180. If the price closes above the R1 and moves higher, the price can find the next resistance, R2, around 0.85488.
GBP JPY 4H
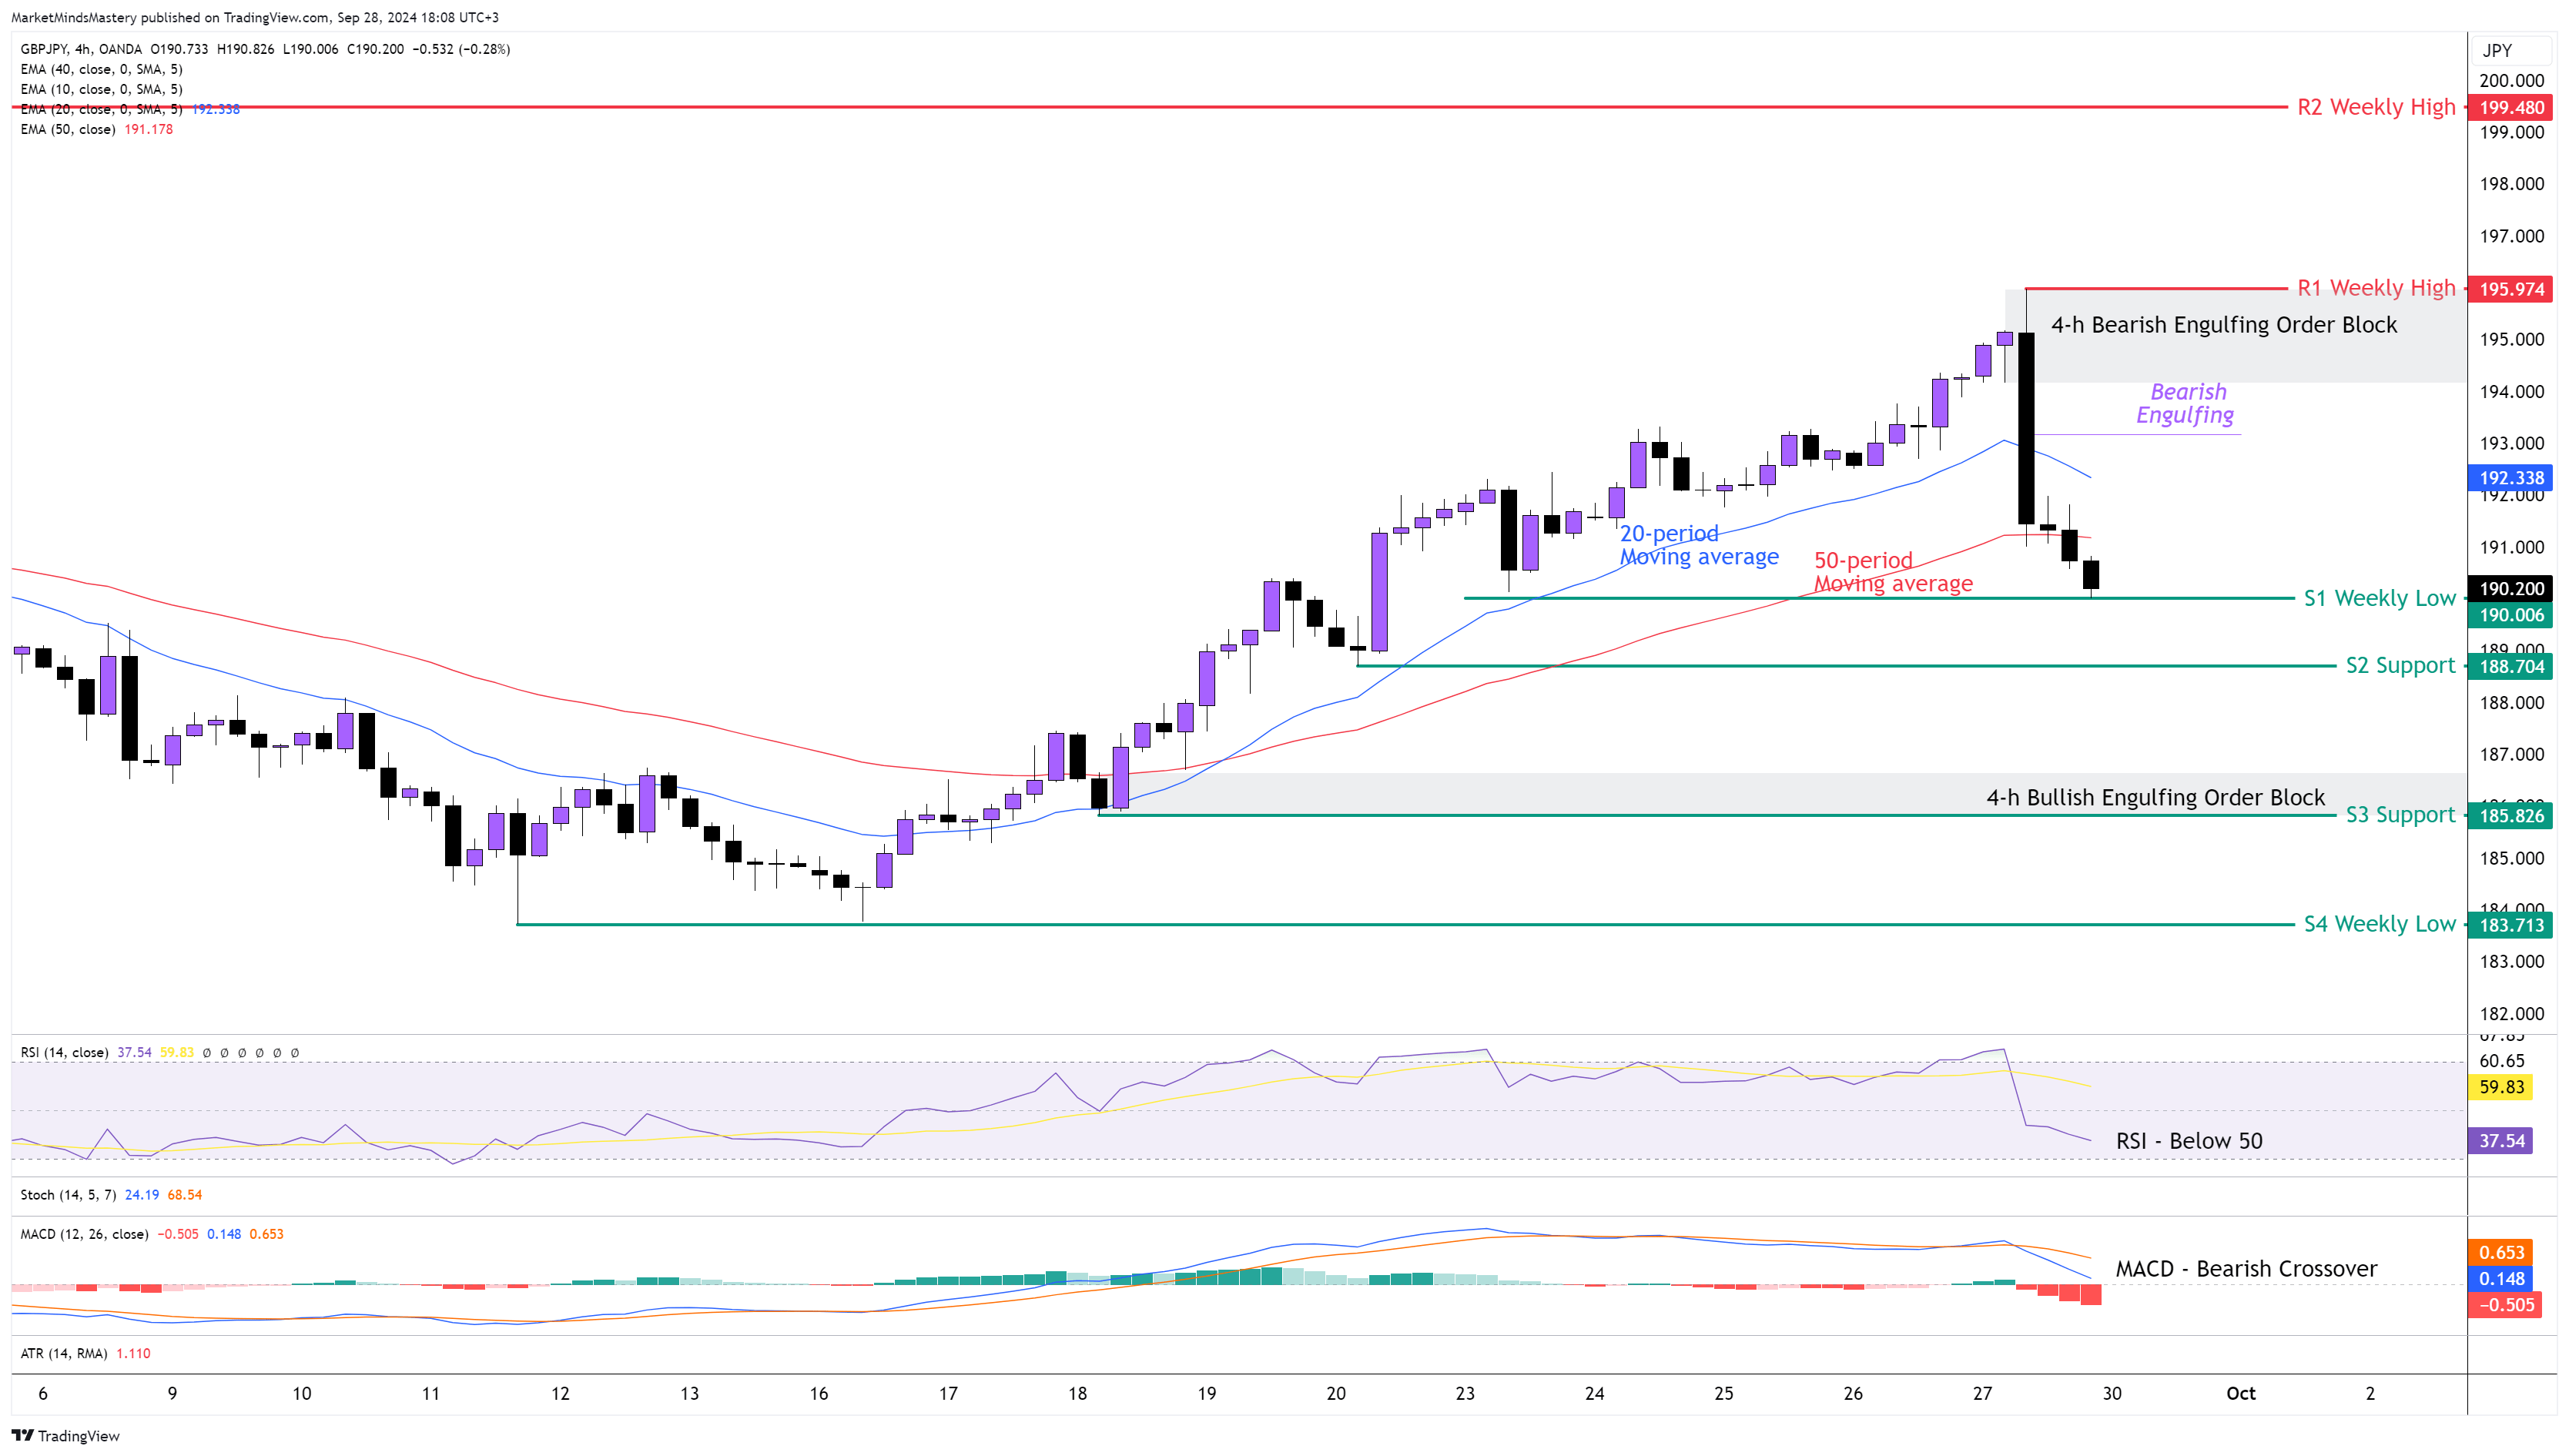
Following the previous week’s Market Outlook, the price of the GBPJPY declined once the pair reached the weekly resistance of around 195.000. As we mentioned previously, this pair's major trend is a downtrend, and at any moment, the price would have tested a key level of resistance and could have declined. The weekly chart created a Shooting Star pattern, which is considered a reversal candlestick. On the 4-hour chart, the price created a Bearish Engulfing Reversal price action last Friday, which forced the price to penetrate both the 20 and the 50-period moving averages. The 20-period is above the 50-period moving average, and this is bullish. However, the moving averages will follow the price in case a 4-hour downtrend starts. The RSI has already moved below its middle line of 50, and this is considered bearish. The MACD created a bearish crossover while it's above the zero line, which also has bearish implications. Therefore, if the price keeps moving downwards, the first support area, S1, will be around 190.000. If the price penetrates the S1 and keeps lowering, the next support area, S2, will be approximately 188.704. If the price penetrates the S2 and keeps lowering, the next support area, S3, will be around 185.826, which also formed a few weeks ago a Bullish Engulfing Order Block, which hasn’t been filled yet, and it can provide additional support. If the price bounces off and moves upwards, the first resistance area, R1, will be the previous week’s high, around 195.97. If the price penetrates the R1 and keeps increasing, the next resistance area, R2, will be at 199.480.
GOLD 4H
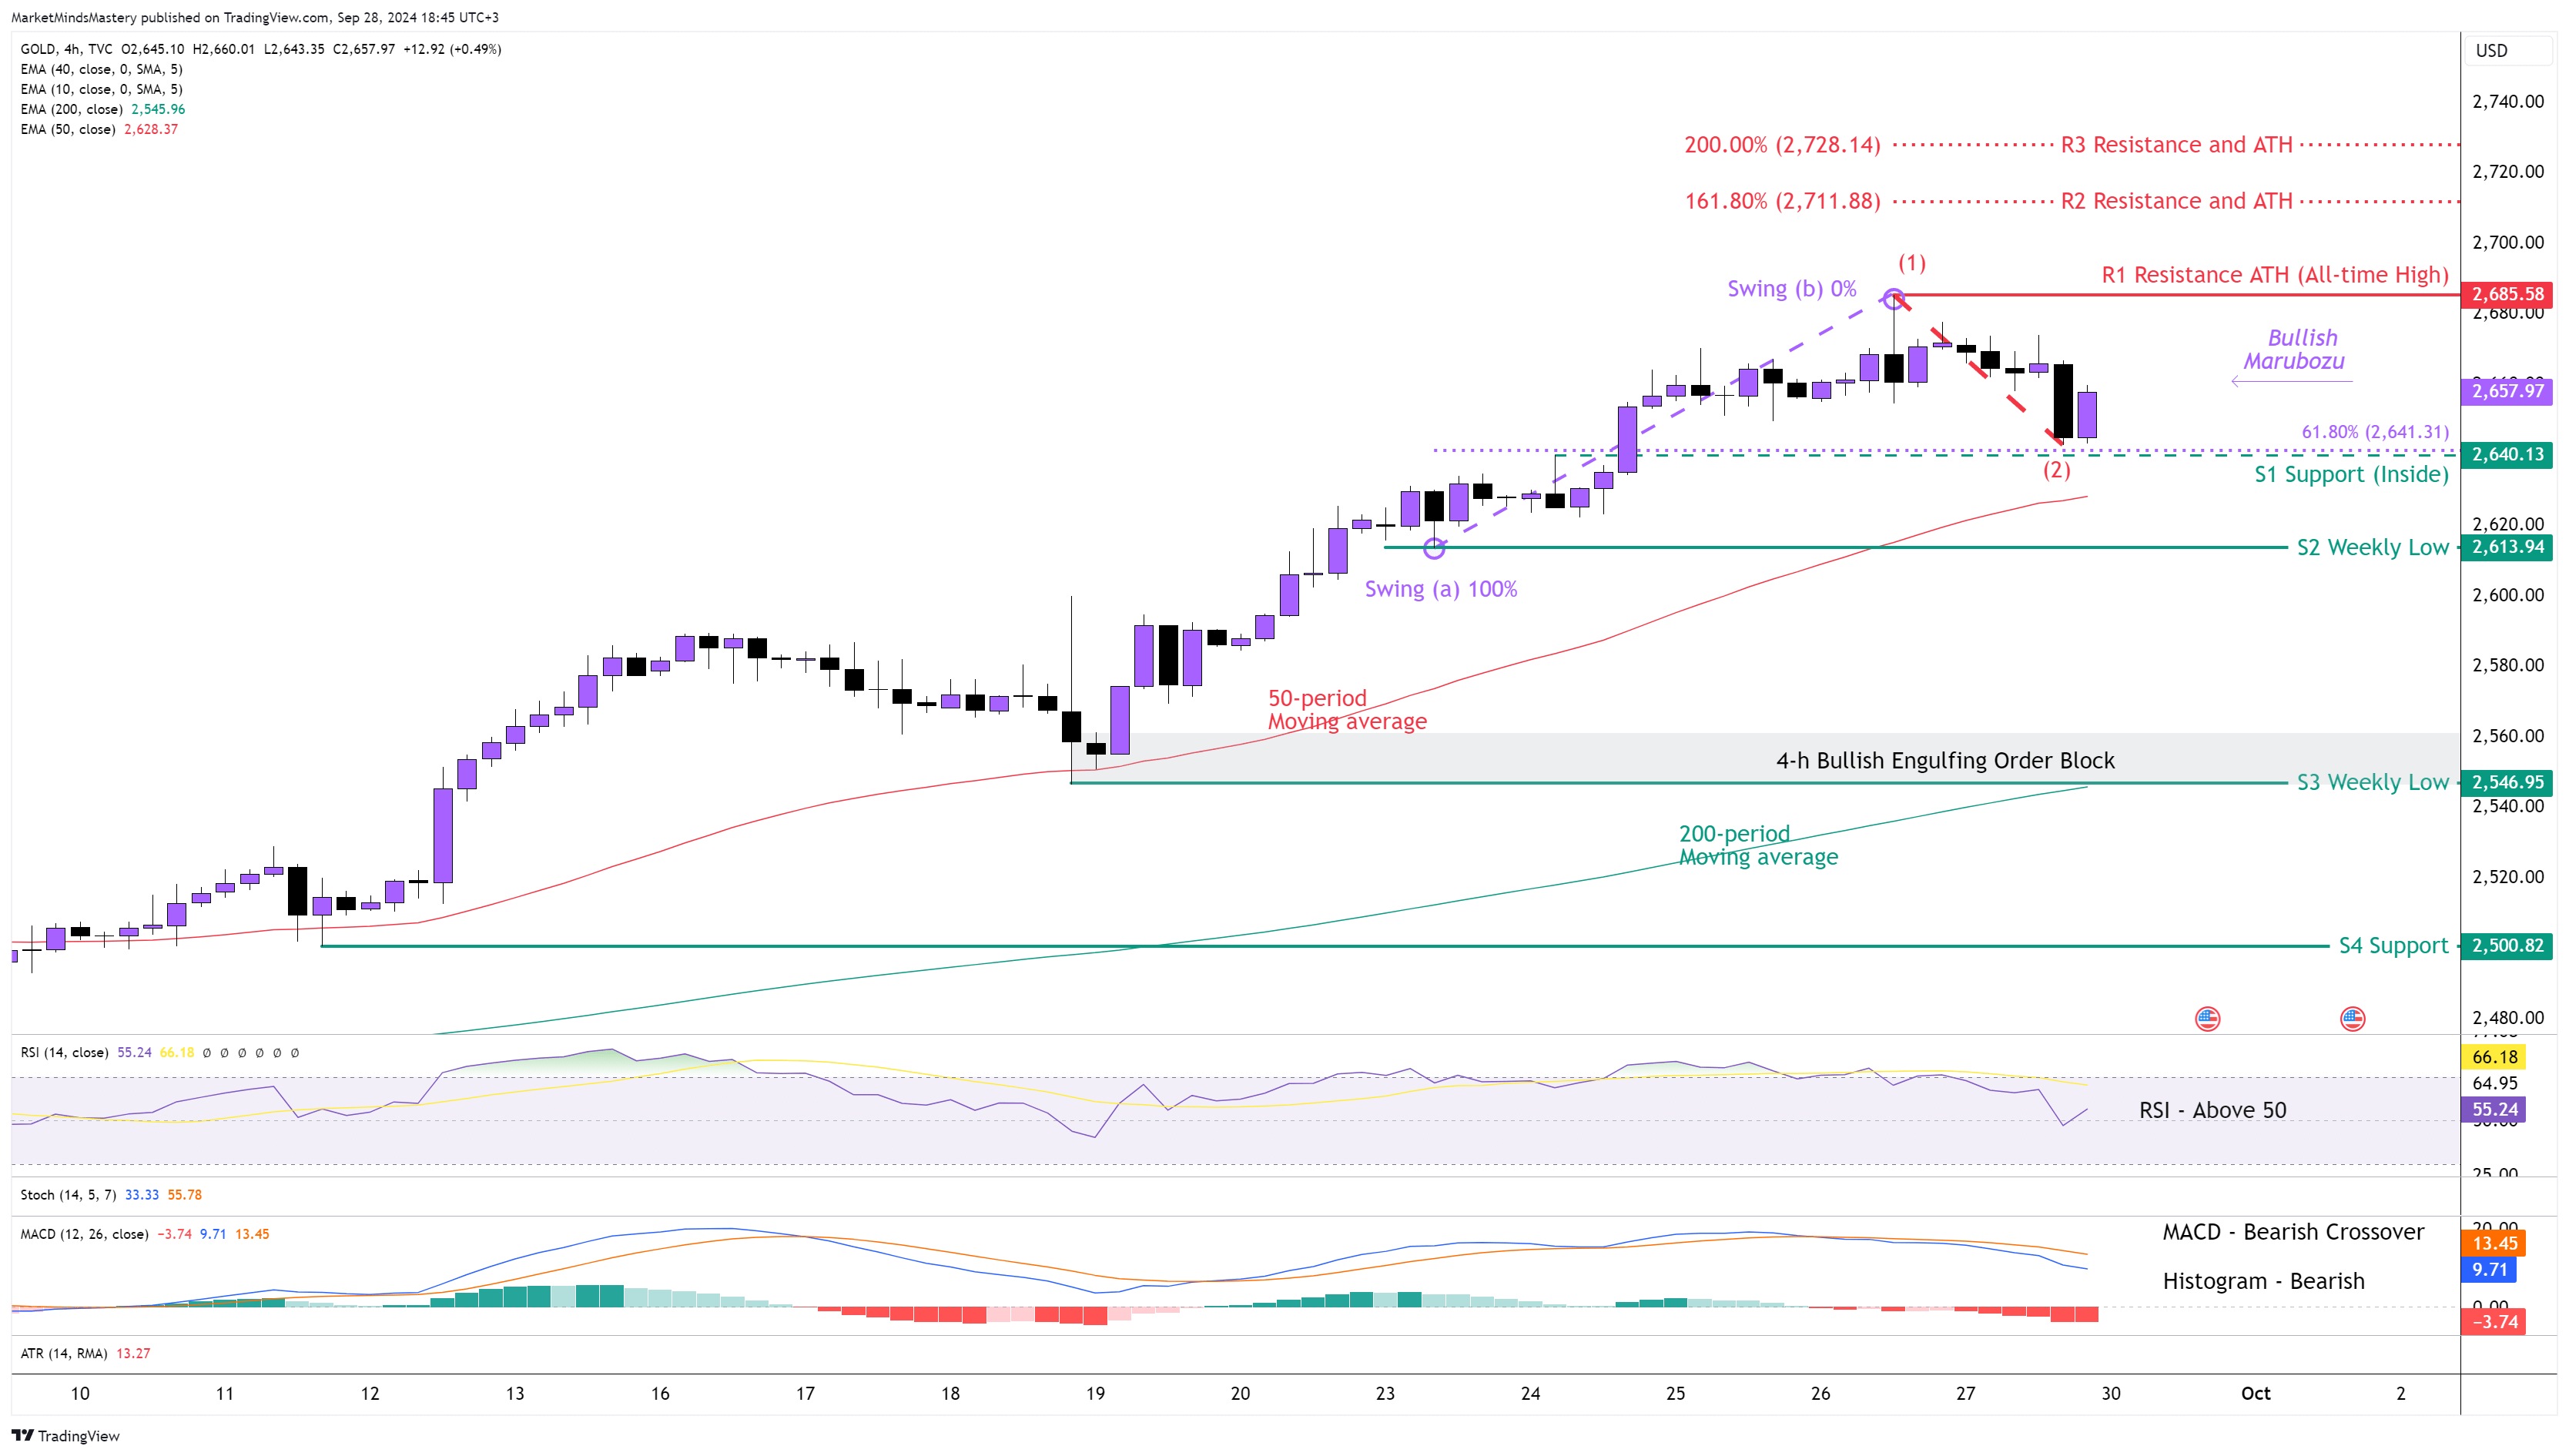
For the third week in a row, the GOLD prices registered a new ATH(All-time High). On the weekly chart, the price of the weekly candle closed above the previous candle’s high. On the 4-hour chart, the price continues, creating higher highs and higher lows, which has bullish implications. If we observe the retracement phases, the price created shallow retracements, which, in most cases, don’t reach 50% or 61.8% of the Fibonacci levels. This explains the strength of the GOLD market. Also, the 50-period is above the 200-period moving average, and this is bullish. The RSI is above the middle line of 50, which is also bullish. Last Thursday, the MACD created a Bearish crossover once the MACD Line (Blue) crossed below the Signal Line (Orange), while both lines were above the middle line of zero. The MACD’s Histogram is below its zero line, which has bearish implications. Last Friday, the price retraced 61.8% of its move measuring from the swing at point (a) to the swing at point (b). Therefore, if the price continues moving downwards, the first support area, S1, will be an Inside support of around $2640, which is at the same level as the 61.8% Golden ratio of Fibonacci. If the price penetrates the S1 and keeps moving downwards, the next support area, S2, will be around $2613, which is the previous week’s low. If the price also penetrates the S2 and keeps lowering, the next support area, S3, will be an older weekly low level at $2546. This level coexists with the 200-period moving average. Oppositely, if the price bounces off and moves upwards, the first resistance area, R1, will be the $2685, which is the previous week’s high and also the ATH. In case the price surpasses the R1 and keeps increasing, the next resistance area, R2, will be $2711, which is the 161.8% Fibonacci Extension number, and the R3 Resistance will be the $2728, which is the 200% Fibonacci extension number.
USOIL 4H
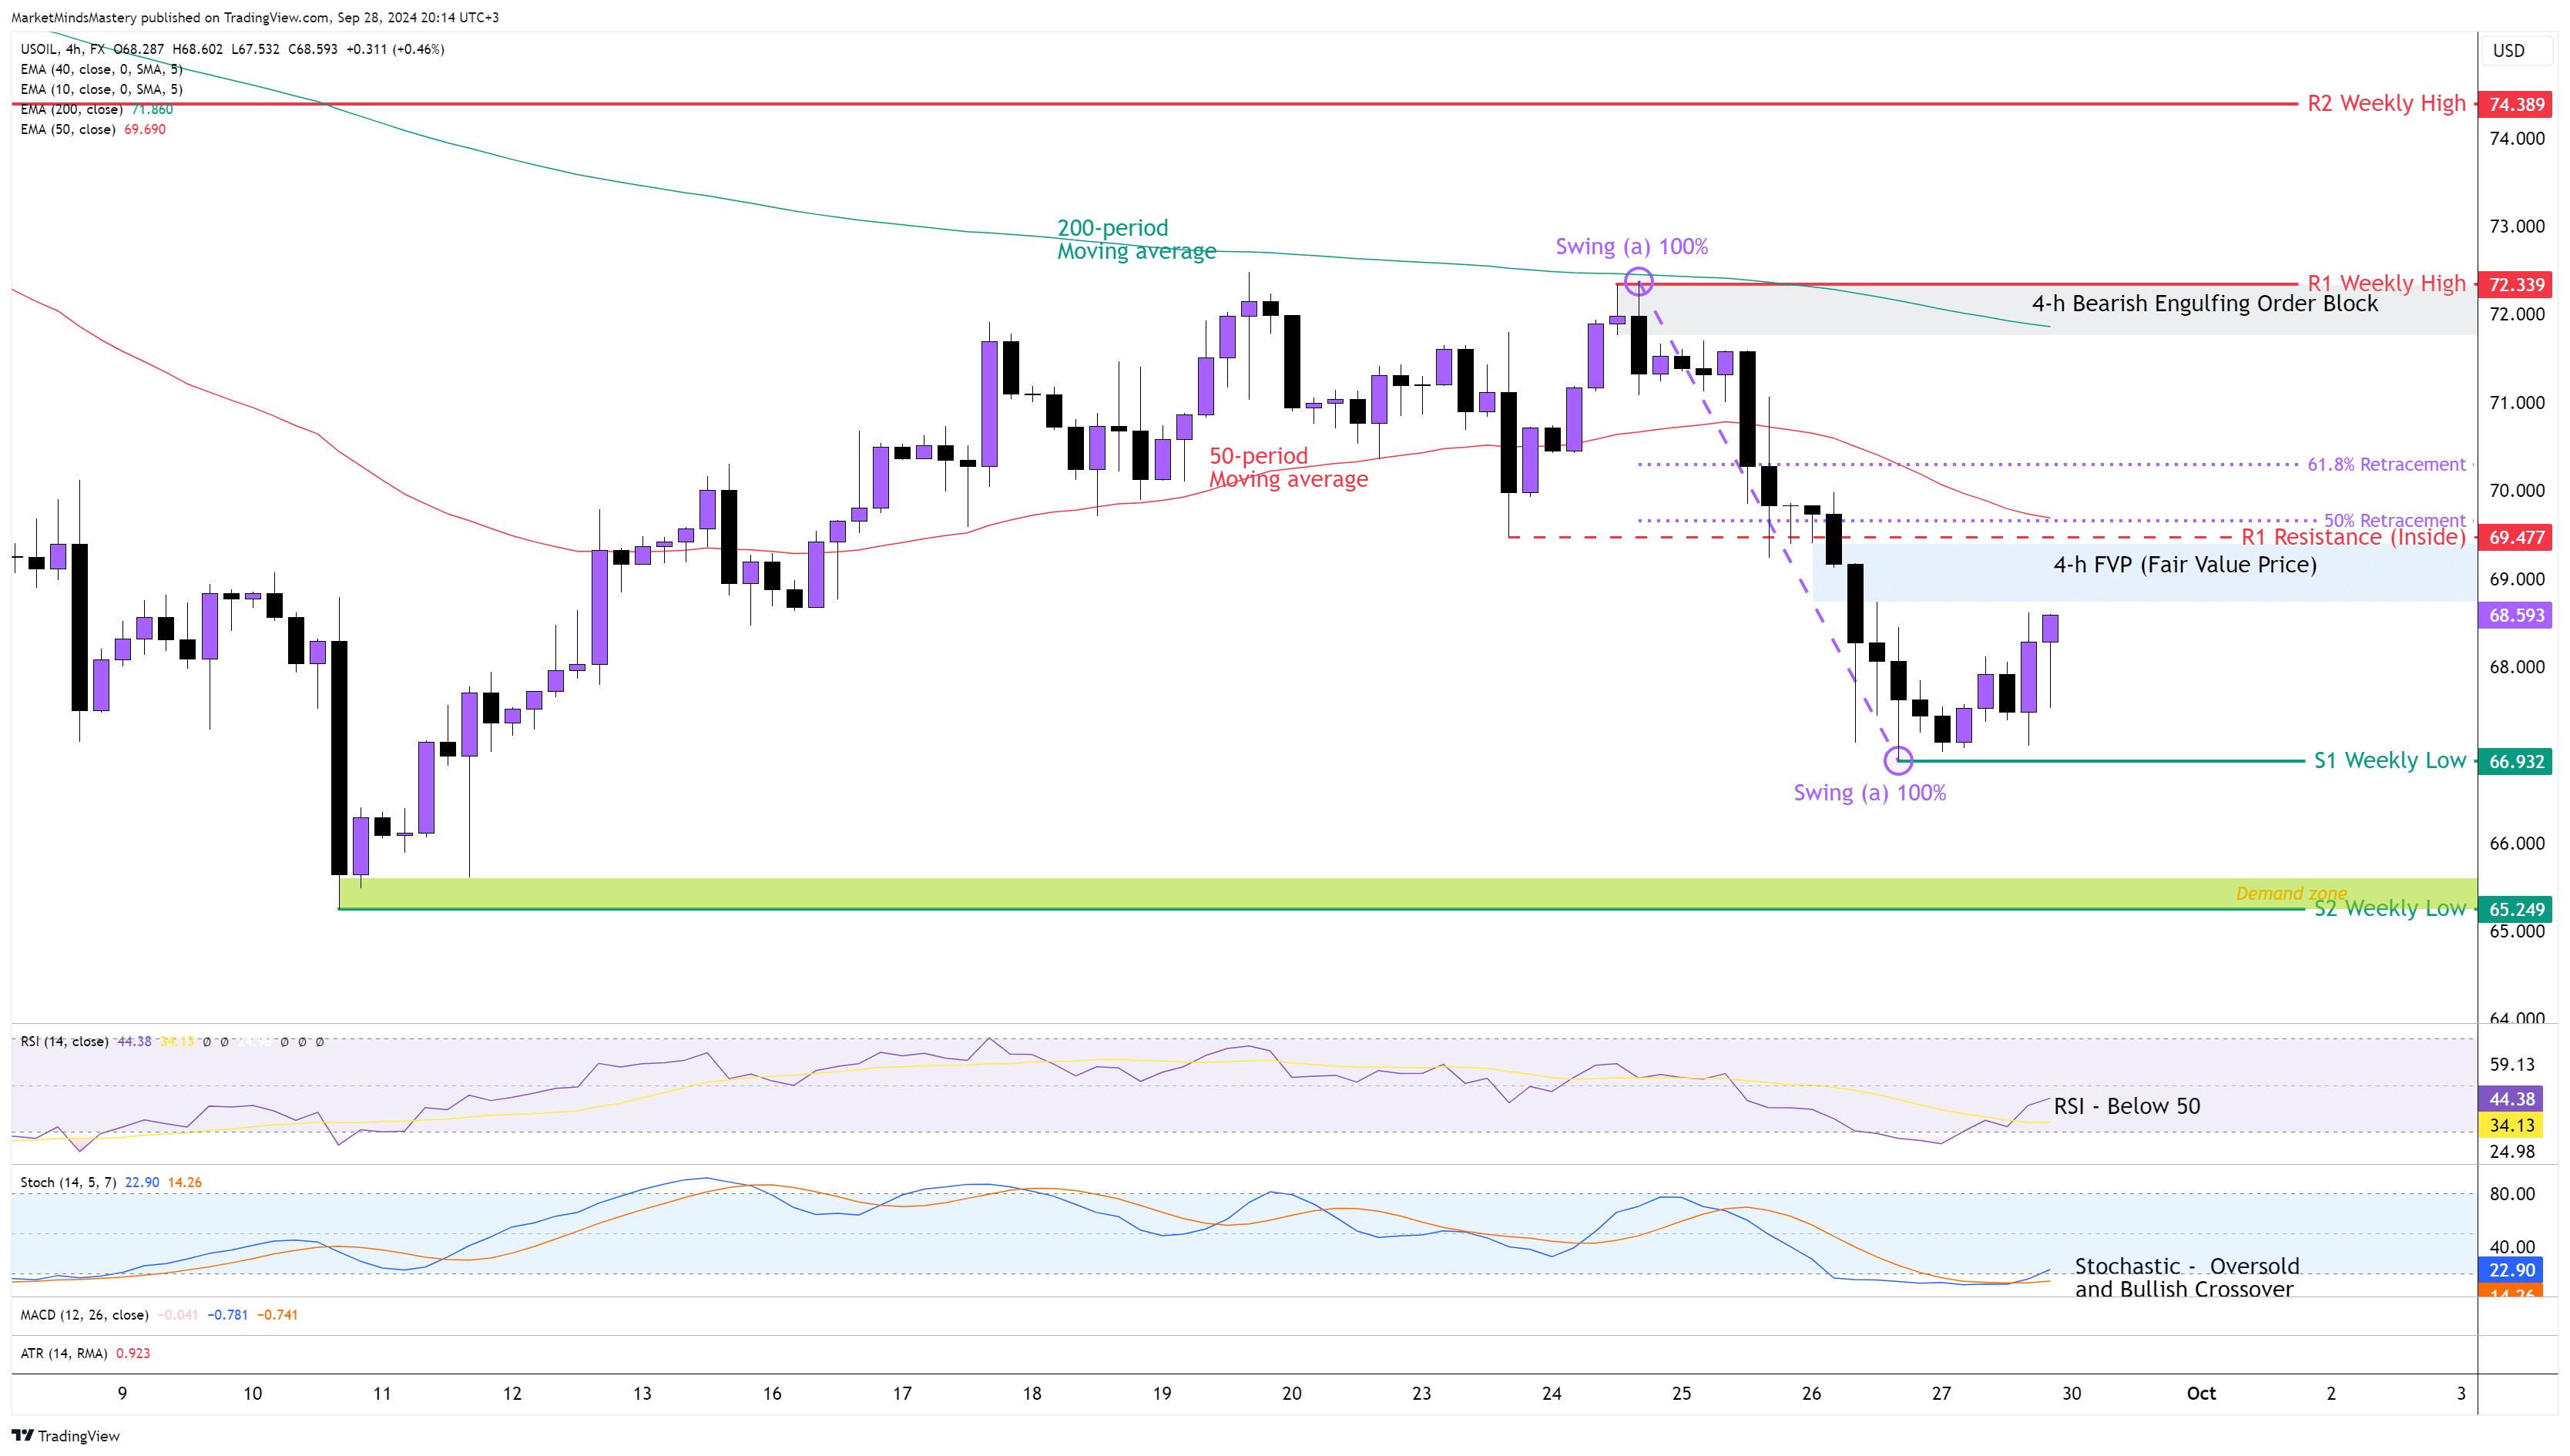
The price of the USOIL last week dropped significantly once the price reached a key level of resistance on the weekly chart. That price level was pointed out in the previous week’s Market Outlook. The price action on the weekly chart ended as a Bearish Engulfing reversal, which means the buying pressure shifted within one single candle to a selling pressure in the market. On the 4-hour chart, inevitably, the price stopped making higher highs and higher lows, and last Thursday, it created a lower low. On the same day, the price created an FVP(Fair Value Price), which hasn’t been tested yet. The 50-period being below the 200-period indicates bearishness. The RSI is below the middle line of 50, and this is also bearish. The Stochastic Oscillator is in an Oversold condition, and a Bullish crossover was created last Friday once the %K Line (Blue) crossed above the %D Line (Orange) while the Oscillator was below its lower boundary of 20. As the price starts a retracement phase, if it continues moving upwards, the first resistance area, R1, will have an Inside resistance of around $69.47. This level consists of the 50% Fibonacci level, the static resistance and the 50-period moving average. If the price penetrates the R1 and keeps moving upwards, the next resistance area, R2, will be around $72.33, which is the previous week’s high.
On the other hand, if the price declines and moves downwards, the first support area, S1, will be around $66.93, the previous week’s low. If the price surpasses S1 and moves further down, the next support area, S2, will be at $65.24, an older weekly low level.
BTC USD 4H
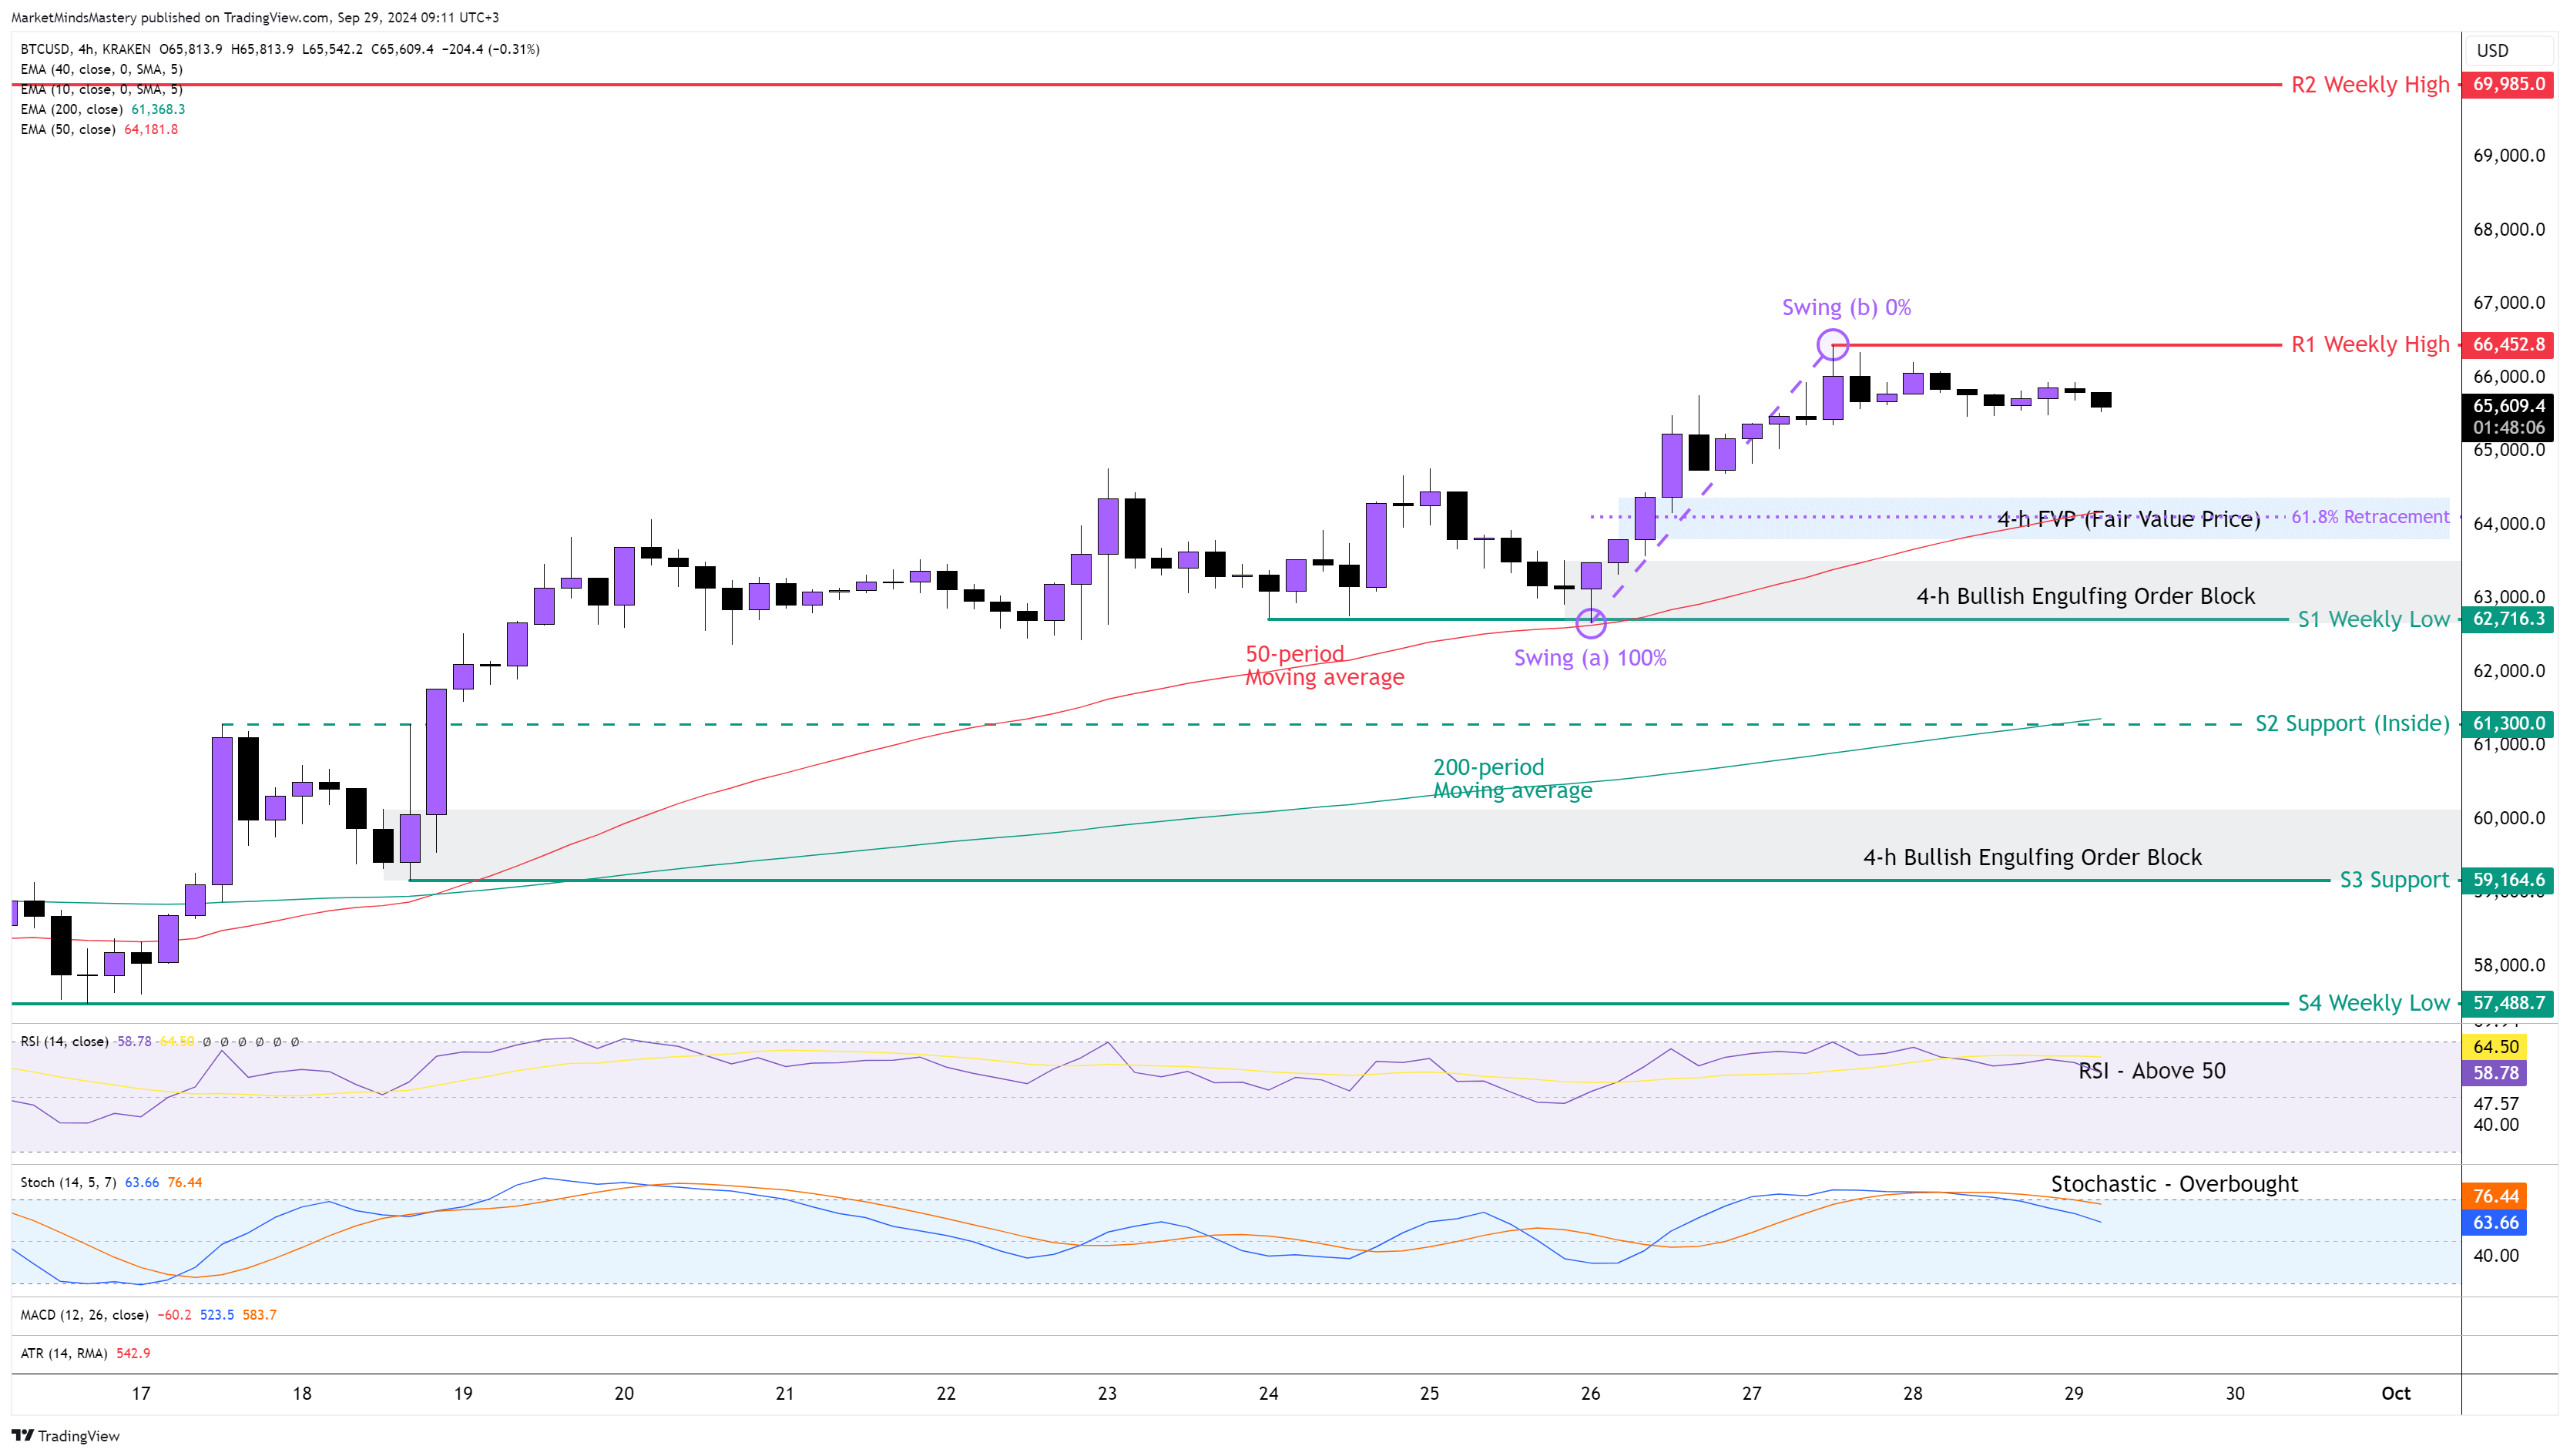
Following the primary trend on the weekly chart, the price of Bitcoin continued its upward move. The weekly chart’s price action ended as a Bullish continuation candle. Because of this, the price on the 4-hour chart continued, making higher highs and higher lows. The 50-period is above the 200-period, and this is bullish. The RSI is above its middle line of 50, which is bullish. The Stochastic Oscillator is in an Overbought condition, which is also bullish. Last Thursday, the price created a Bullish Engulfing Order Block of around $63000 and an FVP (Fair Value Price) of around $64000. Both haven’t been tested yet, but they can act as additional areas of support. Currently, the price is in a retracement phase.
Starting Monday, if the price moves downwards, a potential area of support can be around $64000, as at this level, the 61.8% Golden Ratio of the Fibonacci numbers coexists with the 50-period moving average and the FVP. If the price penetrates this area and keeps lowering, the first static area of support, S1, will be around $62716, which is the previous week’s low. If the price surpasses the S1 and keeps lowering, the next support area, S2, will be an Inside support, approximately $61300. If the price penetrates the S2 and keeps moving downwards, the next support area, S3, will be around $59164. On the other hand, if the price bounces off and moves upwards, the first resistance area, R1, will be around $66452, which is the previous week’s high. If the price penetrates the R1 and keeps increasing, the next resistance area, R2, will be the $69985, which is an older weekly high level.
SP 500 4H
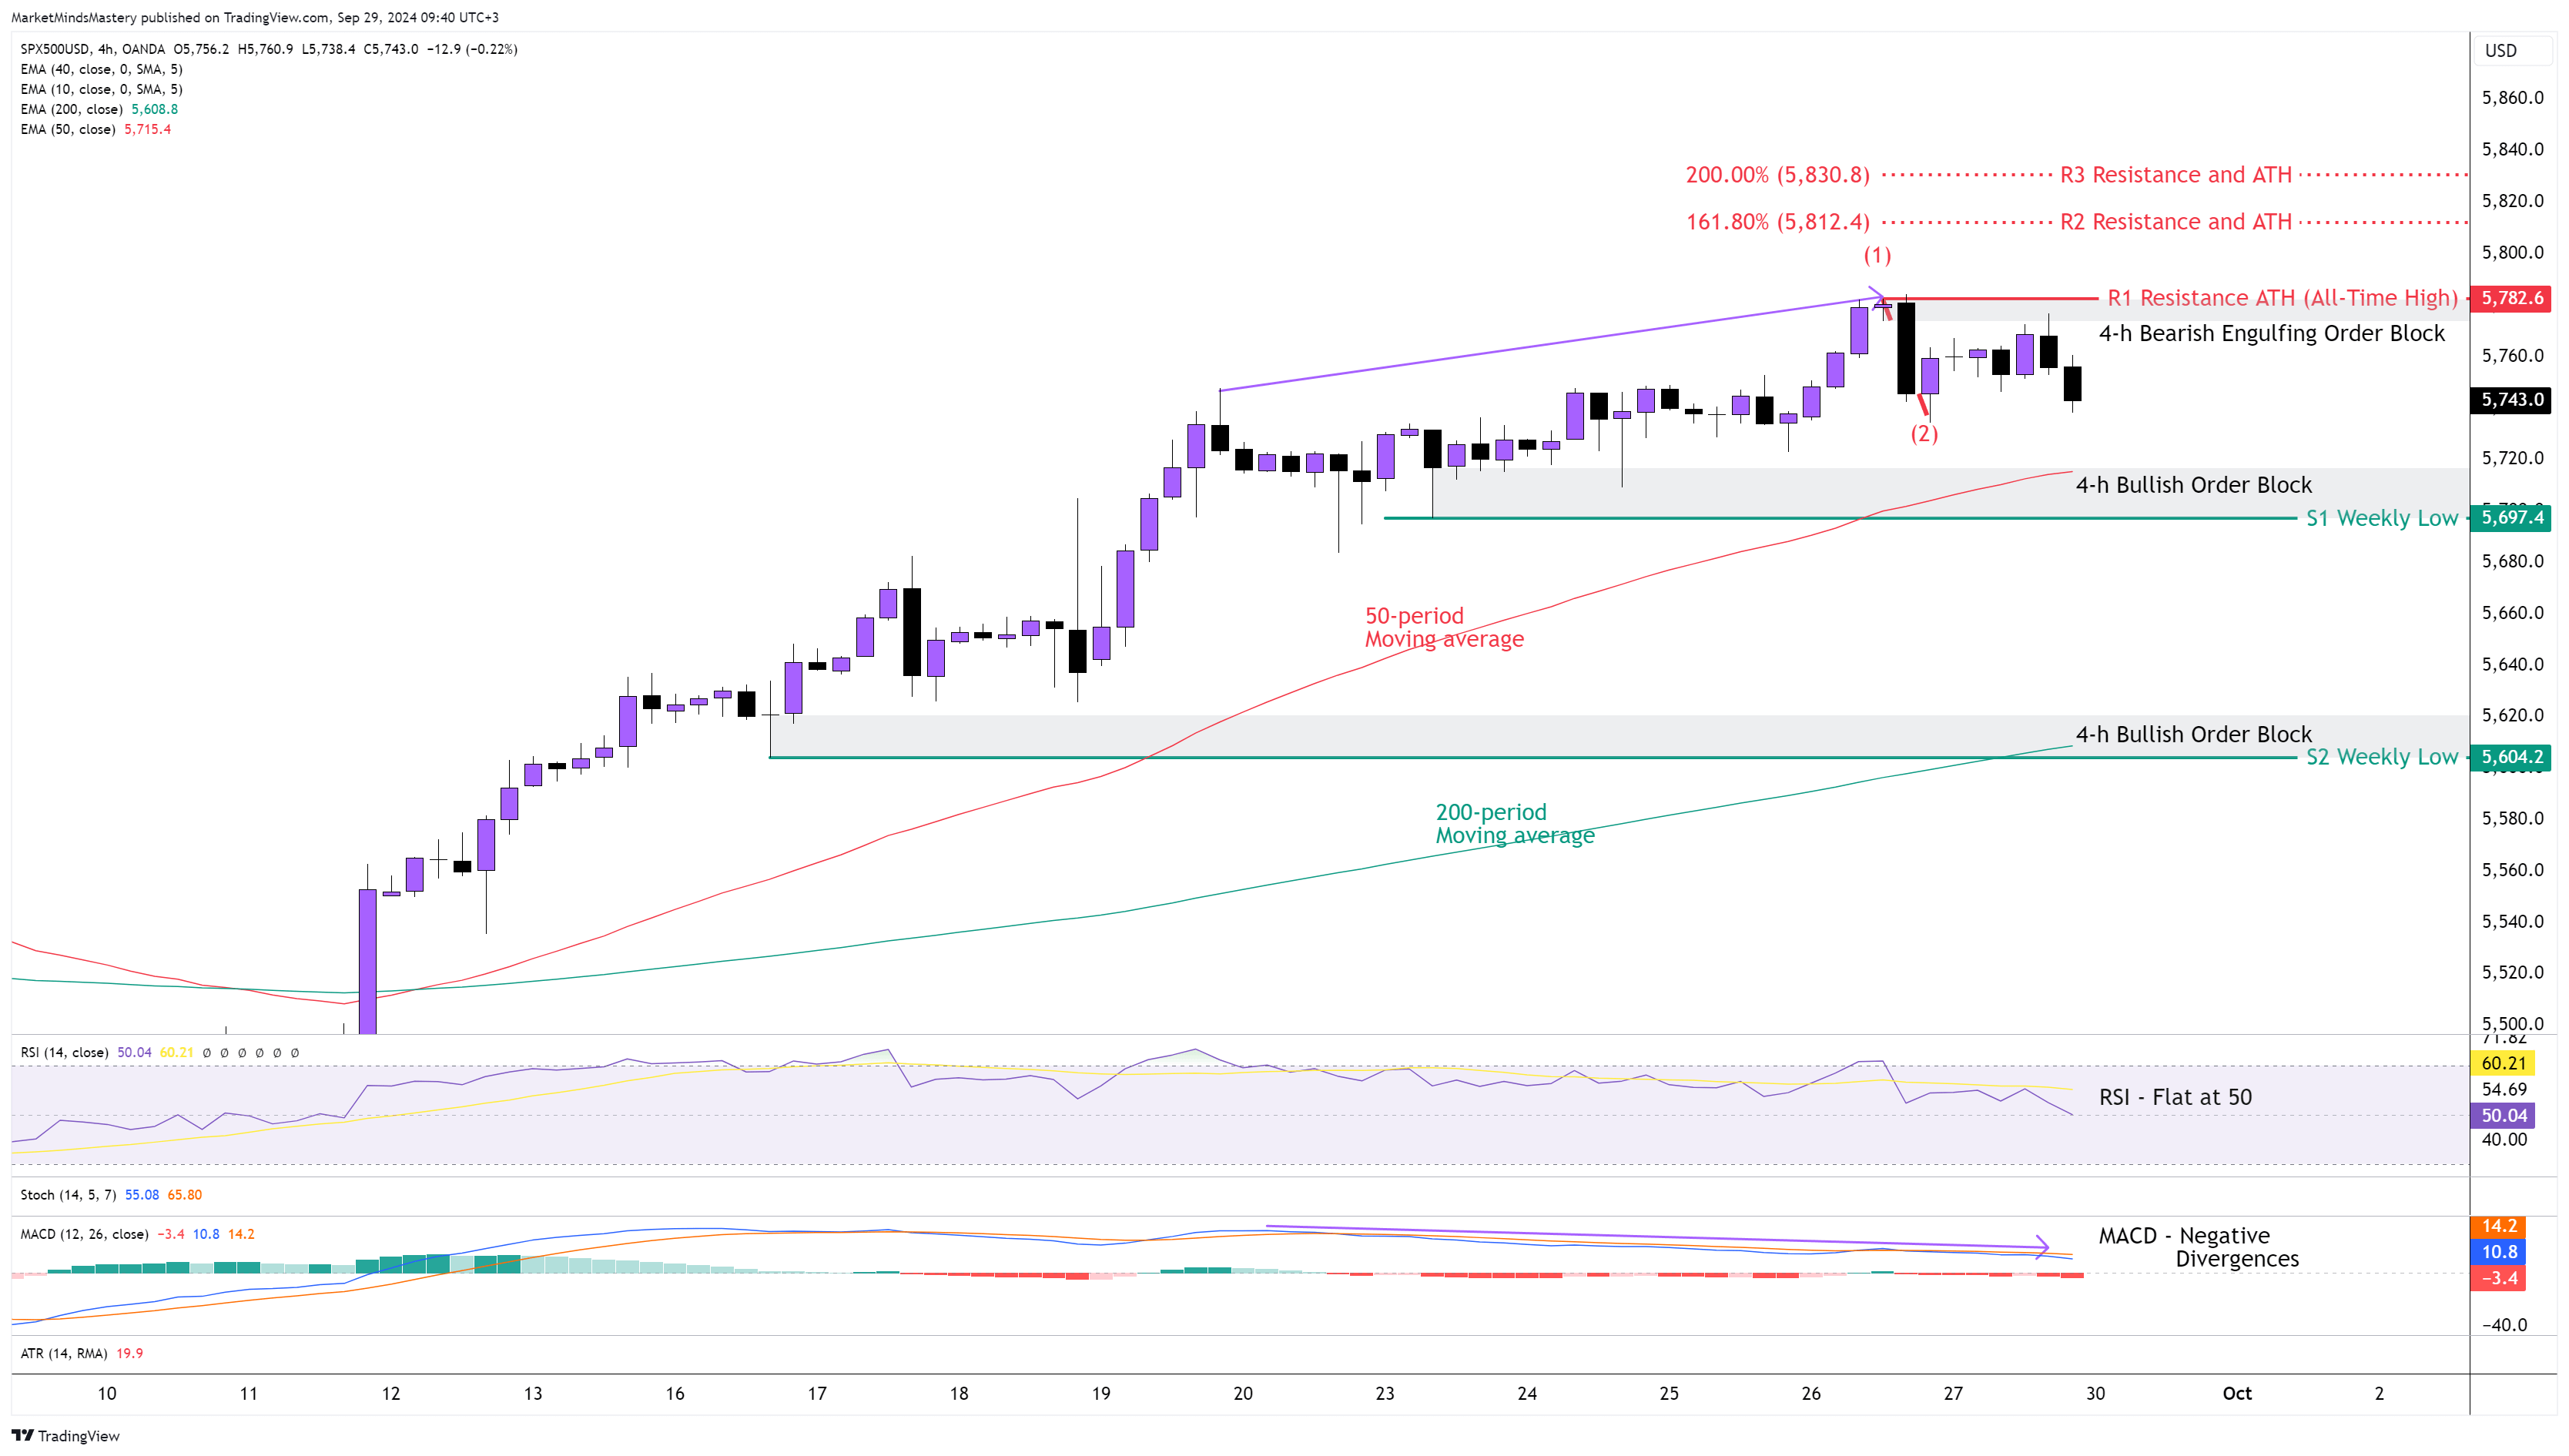
For another week, the price of the SP500 created a new ATH(All-Time High). The price on the weekly chart created a higher high, higher low formation, but it failed to close above the previous week’s high candlestick. This can be a sign that the market may start a retracement phase. On the 4-hour chart, the price made a new high, as shown at point (1), but under a lack of momentum because, as per the MACD, the indicator failed to follow through, and instead of this, it made a lower high which is called Negative Divergences A’ Class. The 50-period is above the 200-period moving average, and this is bullish. The RSI is above its middle line of 50, and this is also bullish. Starting Monday, if the price moves downwards, the first support area, S1, will be around $5697. This is considered a key level of support as it coexists with this static support, the 50-period moving average and a Bullish Order Block, as shown on the chart. If the price penetrates the S1 and keeps lowering, the next support area, S2, will be approximately $5604.
On the other hand, if the price bounces off and moves upward, the first resistance area, R1, will be the ATH (All-Time High) at $5782. If the price penetrates the R1 and keeps increasing, the next resistance R2 will be the $5812, which is the 161.8% Fibonacci Extension. If the price surpasses the R2 and keeps moving upwards, the next resistance R3 will be the $5830, which is the 200% Fibonacci extension, as shown on the chart.
US 30, 4H
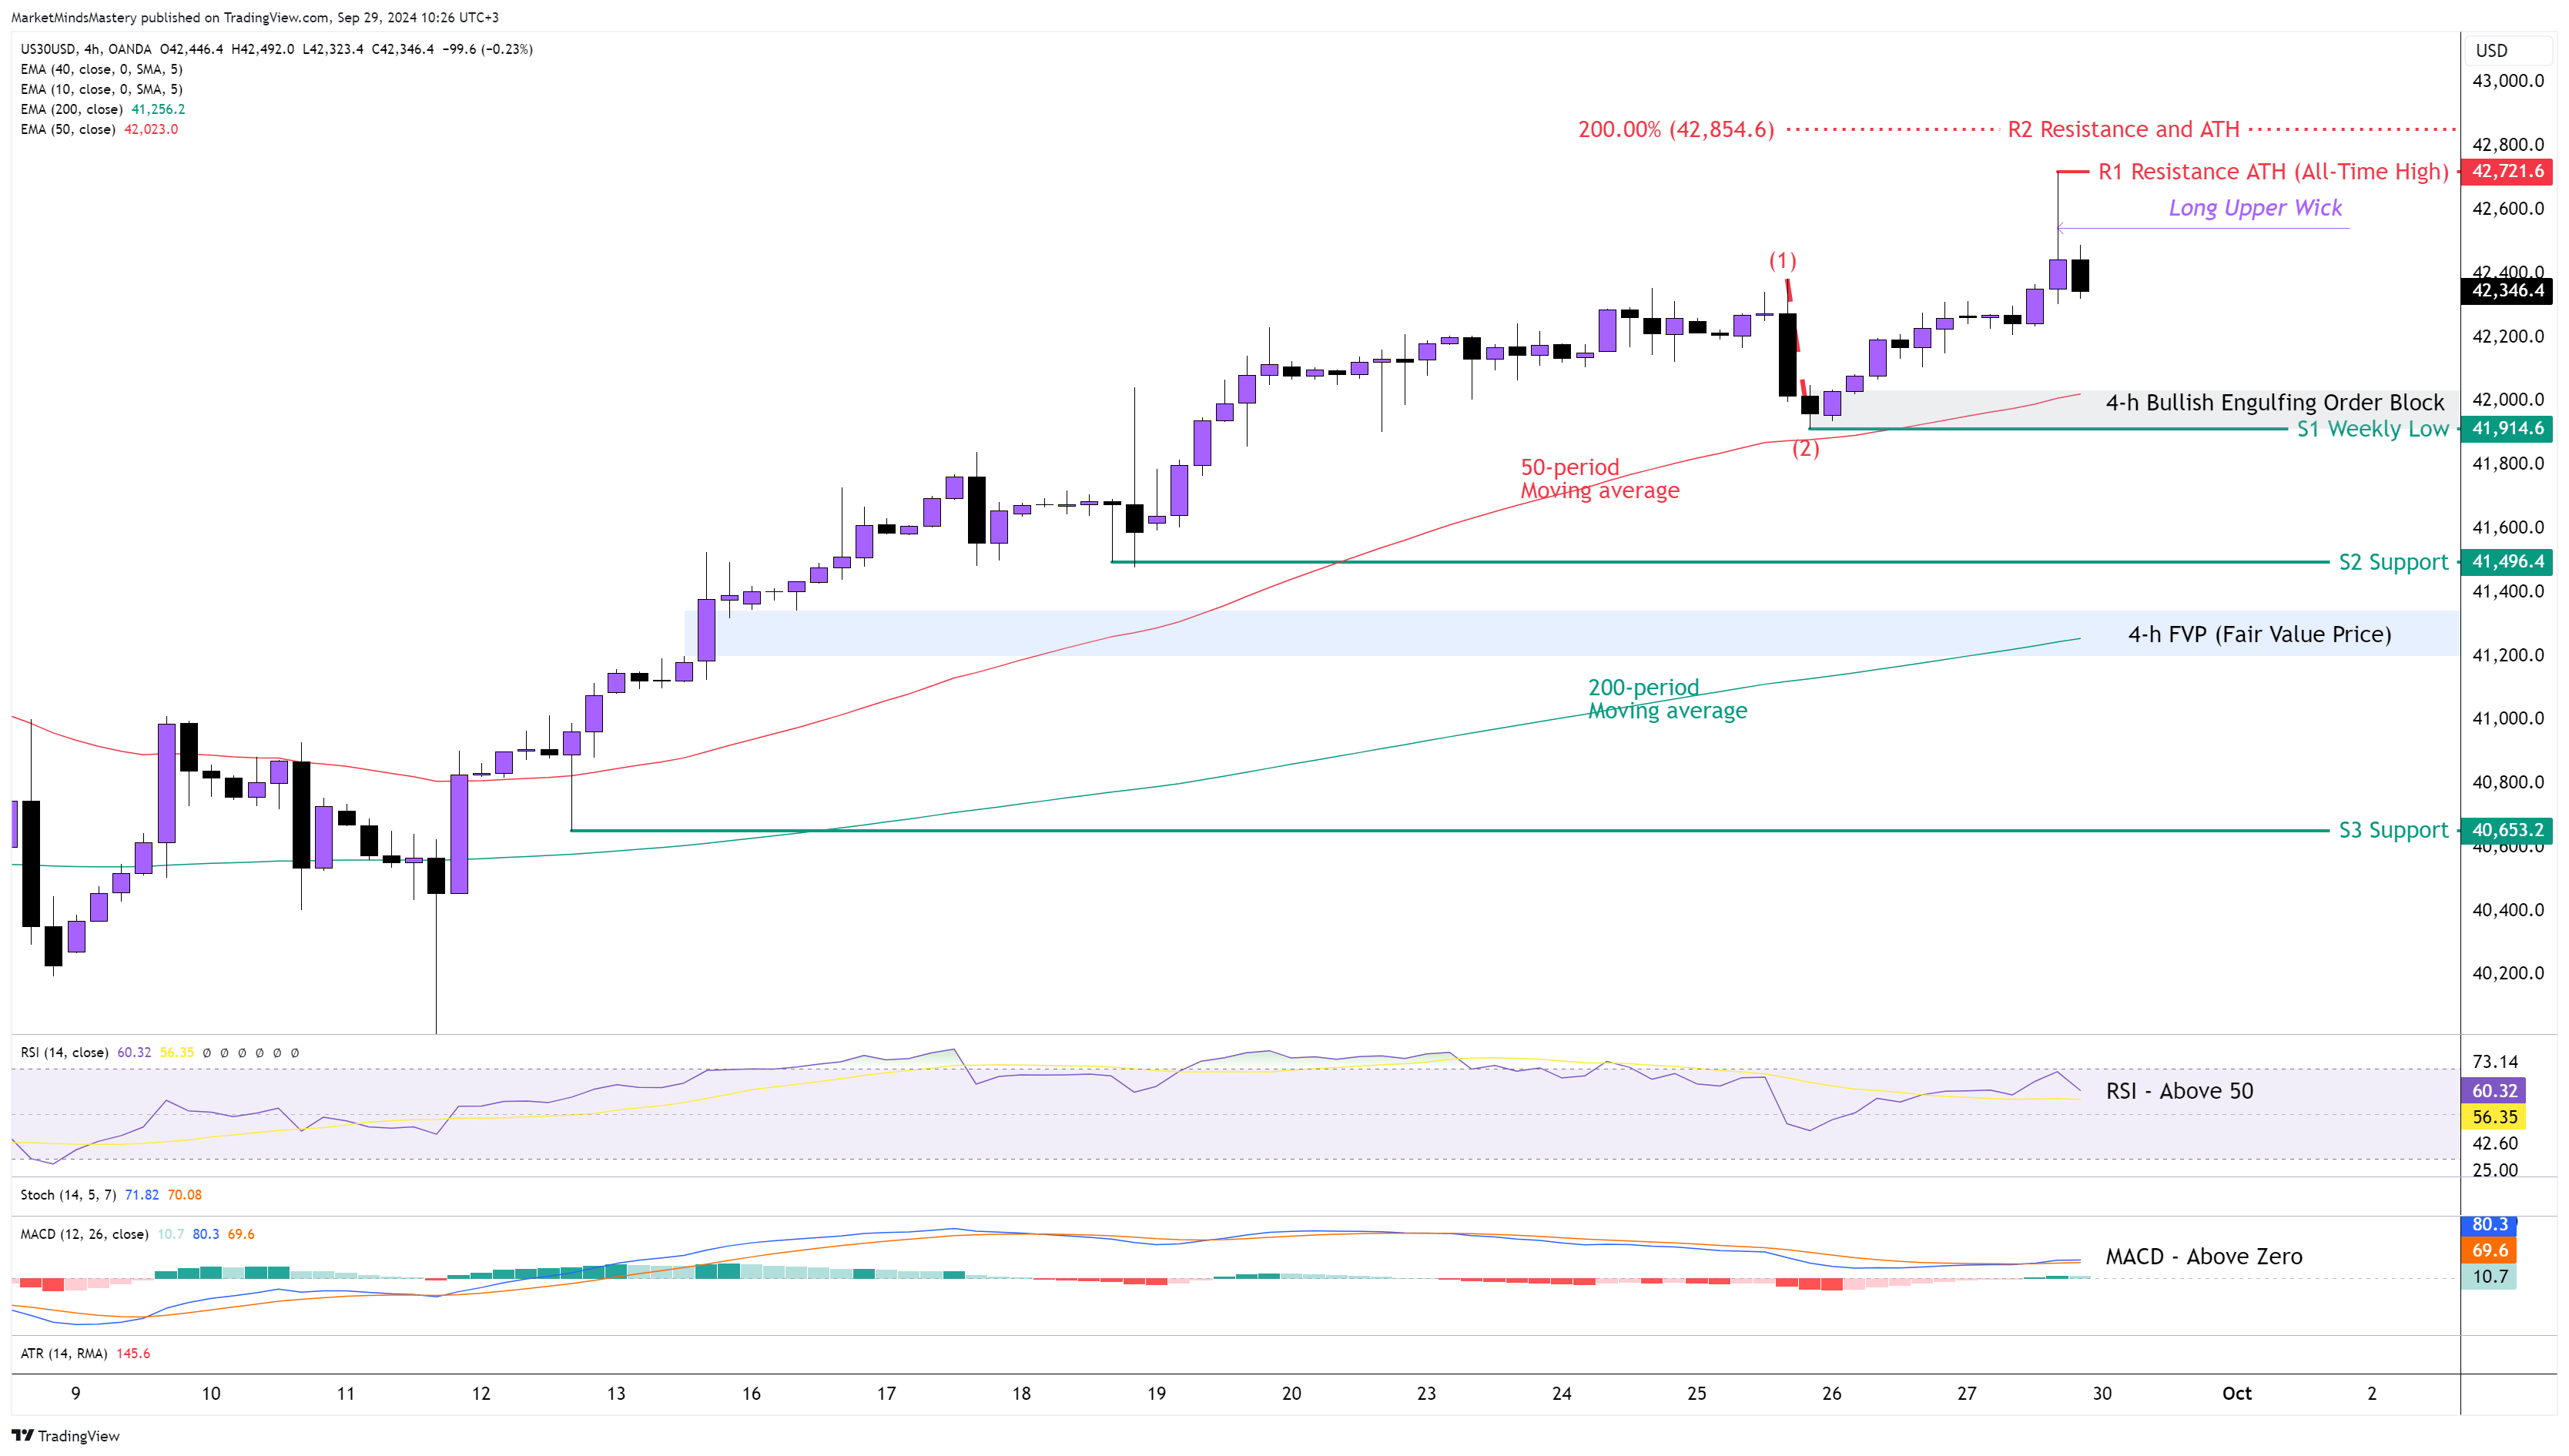
Last week, the price of the US30 reached $42560, which we pointed out in the previous week’s Market Outlook as the 200% Fibonacci Extension. The price afterwards was rejected, and it created a candlestick with a Long Upper Wick. As the price fails to create a new high with a Bullish continuation candlestick pattern, it can force the price to enter a retracement phase afterwards. The 50 is above the 200-period moving average, indicating a bullish market. The RSI Oscillator is above 50, and this has bullish implications. The MACD also indicates bullishness as it is above its zero line.
Starting Monday, if the price declines and moves downwards, the first support area, S1, will be around $41914, which is the previous week’s low. This is a key level of support as it consists of the static support, the 50-period moving average and a Bullish Engulfing Order Block. If the price penetrates the S1 and keeps lowering, the existing uptrend will end because the price will create a new market structure. If the price keeps moving downwards, the next support area, S2, will be around $41496. In case the price surpasses the S2 and keeps moving downward, the next support area, S3, will be around $40653.
Conversely, if the price moves upwards, the first resistance area, R1, will be $42721, which is the previous week’s high, and also the ATH. If the price penetrates the R1 and keeps increasing, the next resistance area, R2, will be the $42854, which is the 200% Fibonacci Extension level.
GER 30, 4H
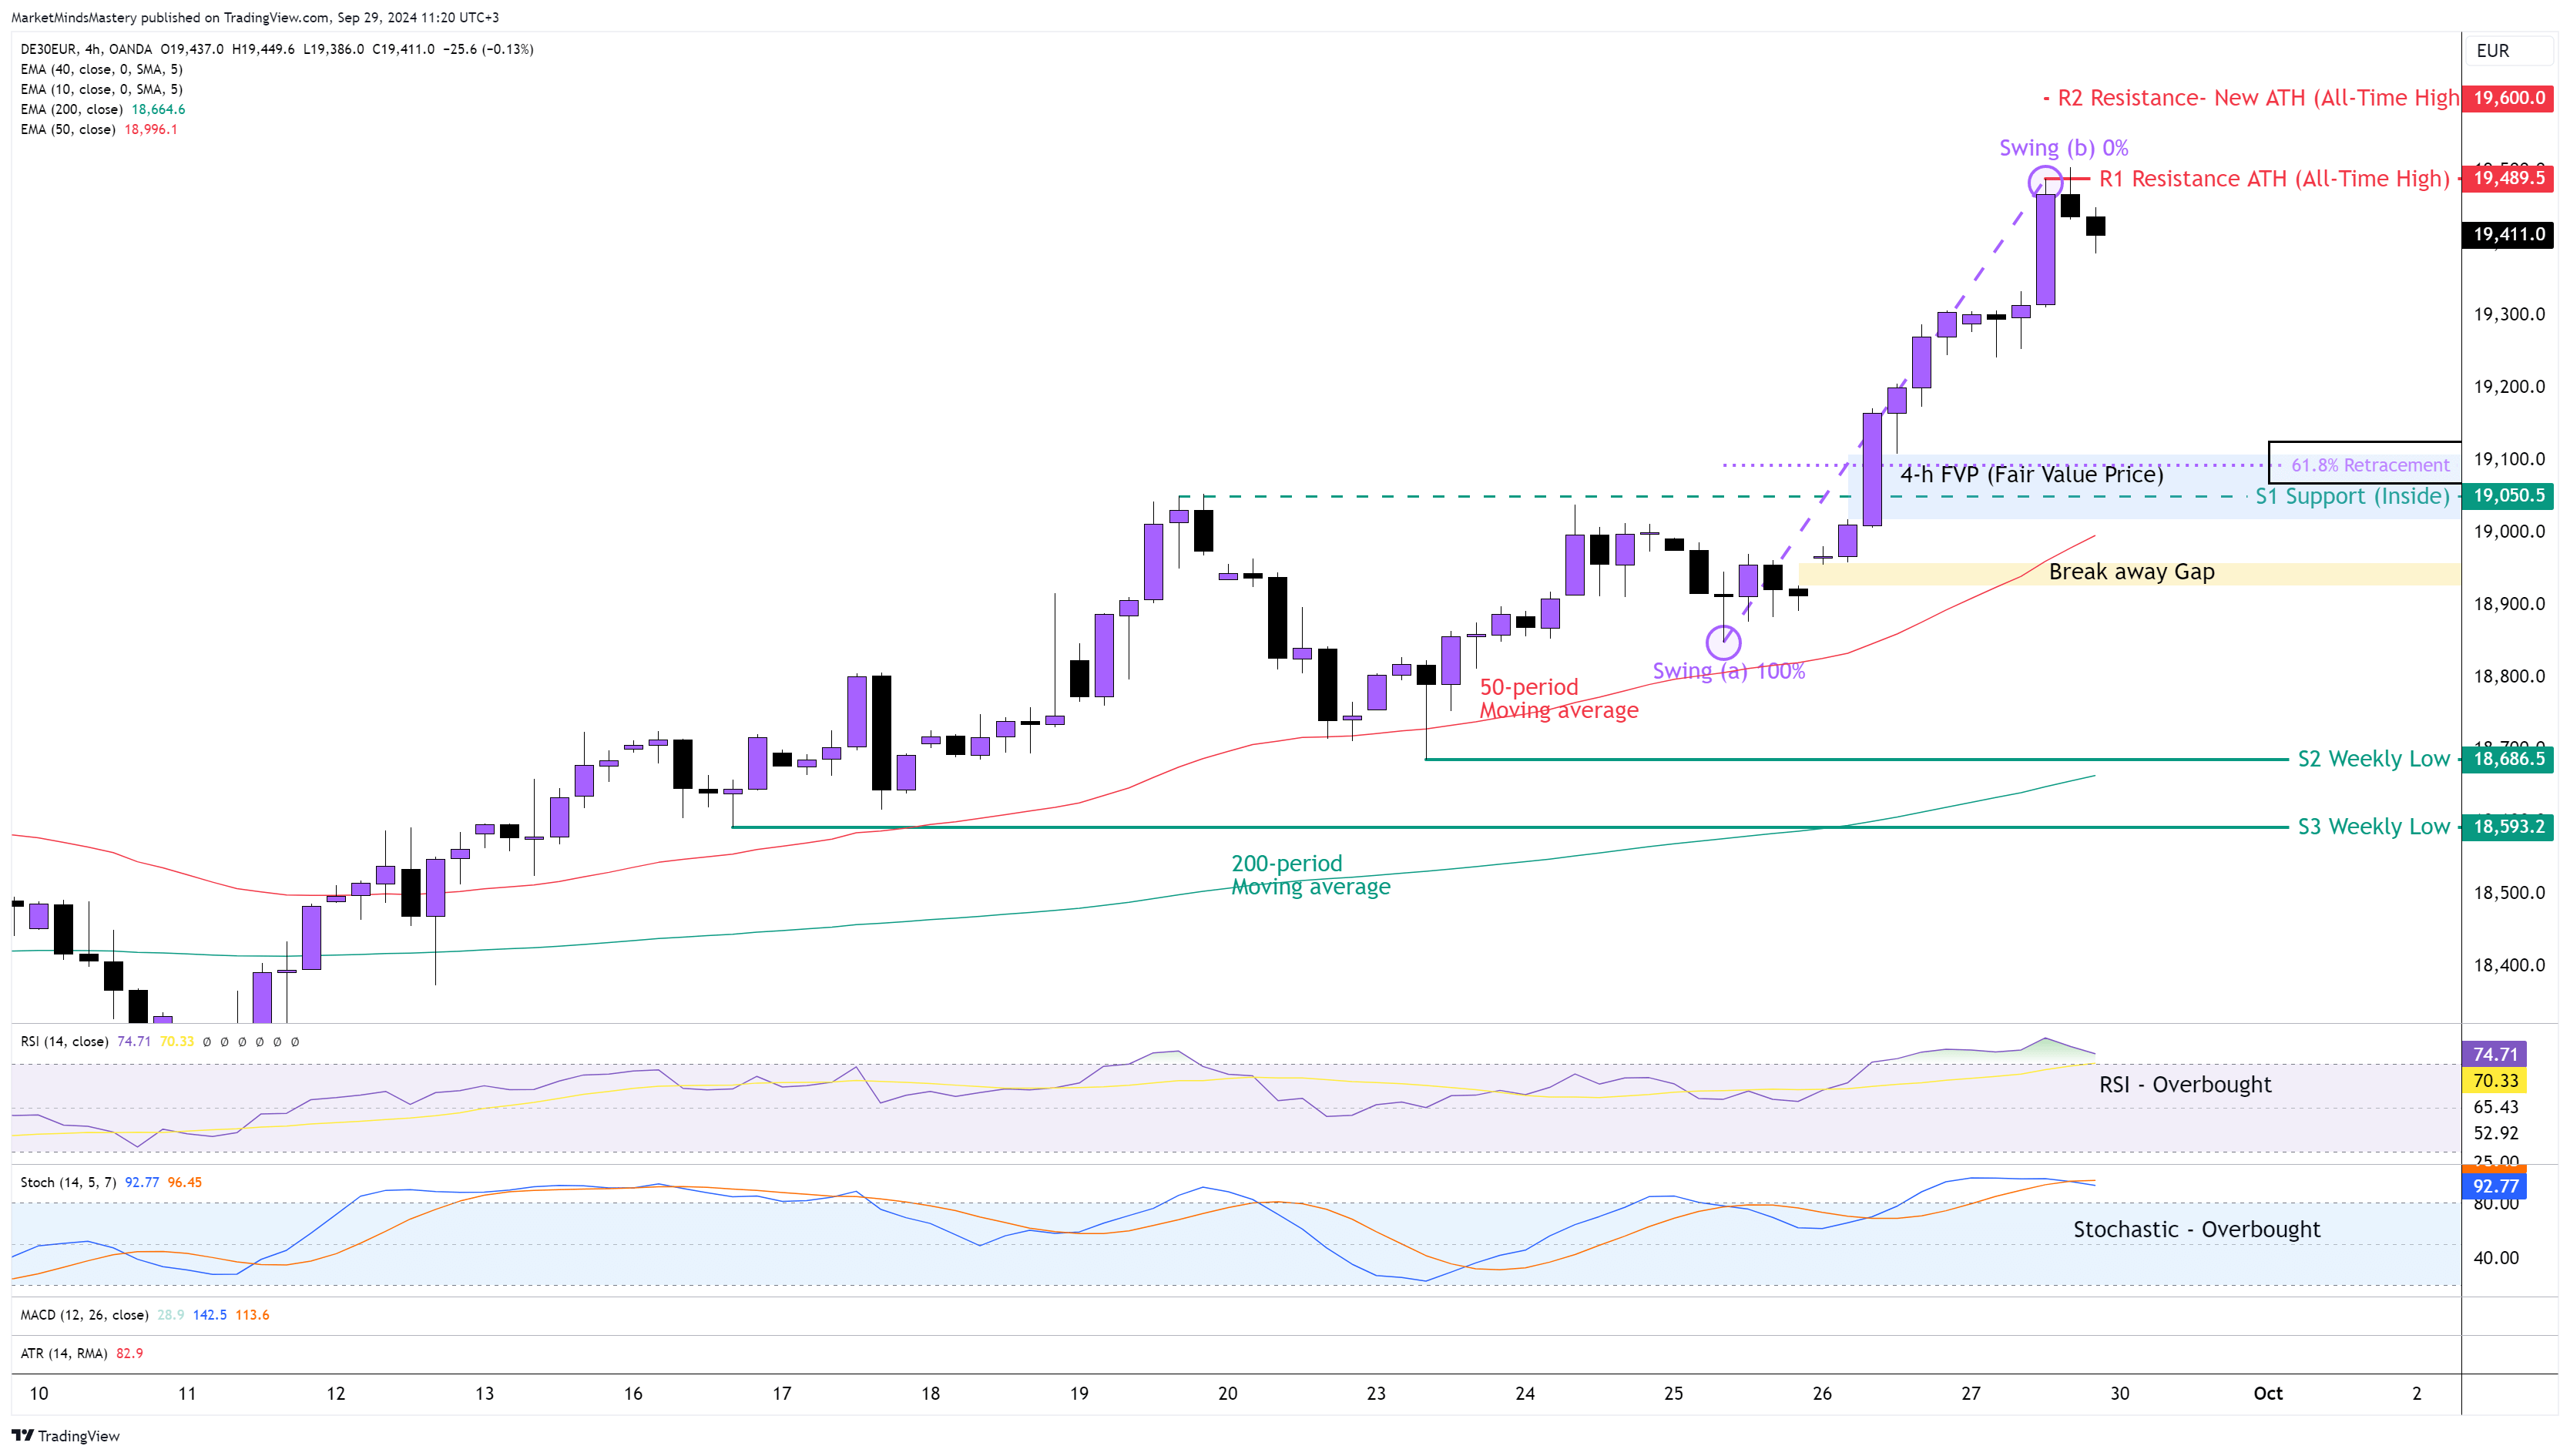
The GRE30 was among the top performers last week. The European Indicie broke above the previous week’s high price, and the weekly candlestick closed above the 19000 level, which is considered a round and psychological number and, therefore, a key price level in the market. The price of the 4-hour chart created a new ATH (All-Time High) last Thursday once the price broke above 19000, and since then, the price has moved upwards in a straight line without any retracement. On the same day, the market created a “Breakaway GAP”, which hasn’t been filled yet. As the price increased fast, the RSI entered into its Overbought condition, which has bullish implications. Additionally, the Stochastic Oscillator is above its upper boundary of 80, which is also a Bullish indication. As the Stochastic’s %K Line (Blue) crossed below the
%D Line (Orange), known as a Bearish Crossover, can start a price retracement.
If the price declines and moves downwards, the first support area, S1, will be an Inside support around 19050. This price level coexists with the FVP (Fair Value Price), which can act as additional support, as well as the 61.8% Fibonacci retracement. If the price penetrates the S1 and keeps moving downwards, it will fill the Breakaway Gap, and if it keeps lowering, the next support area, S2, will be approximately 18686, which is the previous week’s low.
Conversely, if the price moves upwards, the first resistance area, R1, will be the previous week’s high, the ATH around 19489. If the price penetrates the R1 and keeps moving upwards, the next resistance area is expected to be approximately 19600.