Last week, three of the major countries reported their monthly interest rates. The RBA (Reserve Bank of Australia) kept the interest rates at 4.35%, and the Aussie appreciated by traders and investors around the world, lifting the value of the AUD higher. In Switzerland, the SNB (Swiss National Bank) dropped the rates from 1.5% to 1.25%, and the Swissy became one of the weakest currencies. On the other hand, the BoE (Bank of England) kept the rates at 5.25%, but the CPI numbers in the UK dropped, which caused the pound weakness.
As usual, in the last trading week of each calendar month, the significant news events are fewer than in the middle of the month. Starting Monday, the Bank of Canada’s Governor Maclem will give a speech. Usually, he refers to how Canada’s economy has looked up until now, and sometimes, he leaves clues on how the BoC will act on the interest rates next month. Approximately an hour after his speech, the Bank of Canada press conference will take place.
On Tuesday, the Canadian dollar is expected to be at the centre of the scope as the CPI (Consumer Price Index) number will be reported. This report is significant because it compares the CPI this month with the same month but a year ago. The CPI report referred to the number of the previous month and not the currency month. Specifically, in May last year, the CPI number was 2.7%, and this year, the forecast shows a drop to 2.6%. If the actual number confirms the forecast and the market follows through, we expect to trade a weak Canadian Dollar. This can be a good fit with last week’s AUD strength, and perhaps the AUDCAD will move higher. Additionally, the USD is also a strong currency, as per last week’s reports, and we expect an upward move on the USDCAD.
In Australia, the economy looks promising as per the forecast. As of Wednesday, they will report the Consumer Price Index for the previous month, and the forecast shows a significant increase of 0.2%. Currently, the CPi in Australia is 3.6% and is expected to increase to 3.8%. If we pair this with a weak Canadian dollar, then it adds more confluence on the AUDCAD long, considering the forecast numbers we have in front of us up until now. We know that in the markets, many things can change at any point and at any time, so it is important to remember that we work based on what information we have at the moment.
In the US, May’s New Home Sales will be reported, and the -4.7% that was reported previously is expected to increase to 2.5%. If the actual forecast is confirmed and the market follows through, it can be a bullish sign for the US dollar.
On Thursday, in Japan, they will report the Retail Sales, which is expected to be 2%. If the actual will remains the same or greater than the forecast, we might see a strong Japanese Yen. Currently, the Japanese Yen is one of the weakest currencies, and pairs like the USDJPY and the GBPJPY keep trading in strong uptrends, as we will see in the relevant chart analysis that follows. The last few significant events of the day will be in the US. The first will be the GDP (Gross Domestic Product) for the first quarter, which is expected to remain the same as it was previously, at 1.3%. The last one will be the Durable Goods Orders, and as per the forecast, it is likely to drop from 0.7% to 0.3%. That can cause a weakness in the USD, at least temporarily.
The next big event for Japan will be the CPI number report on Friday, which will be the last trading day of this week. Currently, the Consumer Price Index in Japan is 2.2%, and the forecast indicates a significant increase to 2.4%. If this happens and if the market follows through, a promising strength on the Japanese Yen will follow, and the chart will most likely will show retracements, especially on the USDJPY, which has approached the ATH (All-Time High) around 160 level. Additionally, the Unemployment Rate in Japan will also be reported at the same time, and the forecast shows an unchanged number of 2.6%.
Next, in Germany, the Retail Sales will be reported, and the number is expected to remain the same at -0.6%. A directional move on the Euro will possibly occur if the actual number will be greater than the forecast. Next, the GDP (Gross Domestic Product) in the UK is expected to remain at 0.6%. Also, Canada will report its GDP, and the forecast shows an increase from 0% to 0.3%. This can be a bullish sign for the Canadian dollar, but it will always depend on whether the market will follow through with the expected outcome.
EUR USD 4H

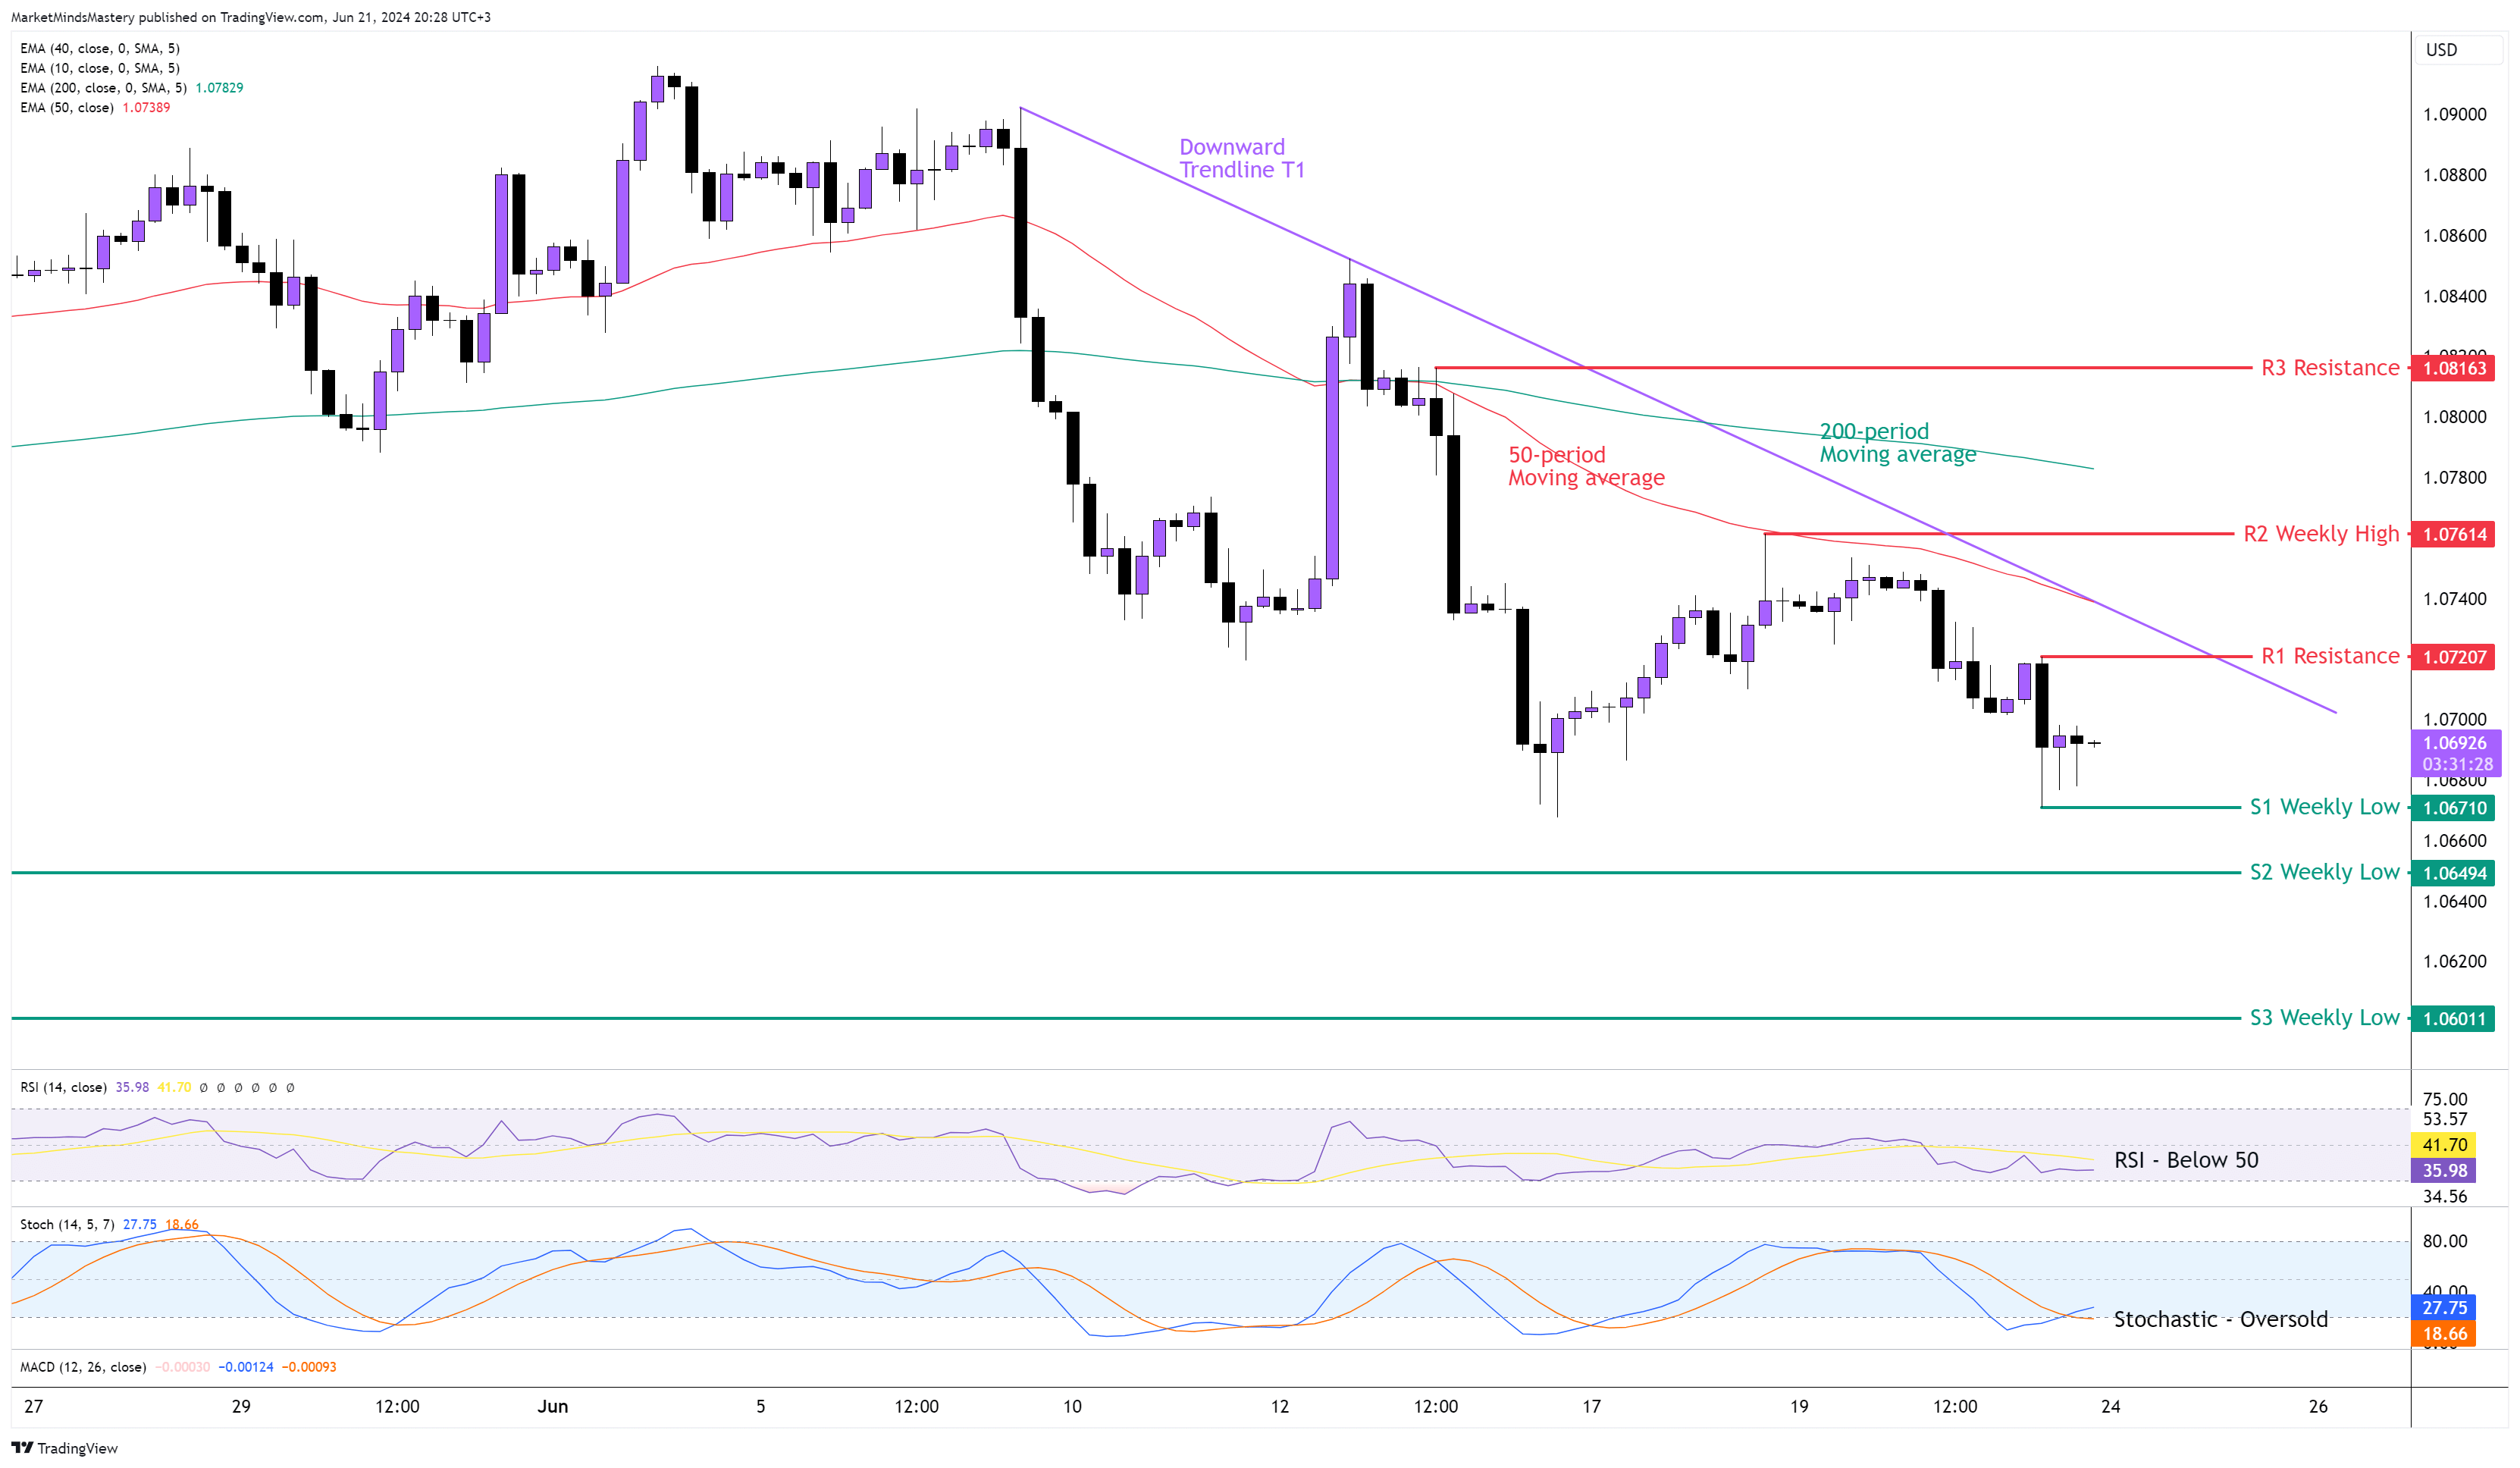
Following the previous week’s market outlook, the price tested the 50-period moving average, the FVP and the 50% Fibonacci level last Tuesday successfully and declined. It traded until the weekly support S1 we marked on the chart last Friday, and then it bounced off.
As the price still maintains the lower highs, the market is in a downtrend. The weekly price action is an inside candle with a long upper wick.
The 50-period is under the 200-period moving average, and this is bearish. The RSI is below the 50 middle line, which is a bearish indication. The Stochastic Oscillator is oversold with a Bullish Crossover as the %K crossed above the %D. The downtrend is valid for as long as the price remains below the Downward Trendline T1.
If the price continues to move downwards, the first support area, S1, is the previous week’s low, around 1.0671. If the price penetrates the S1 and moves lower, the next support area, S2, is an older weekly low of around 1.06494. A further downward move finds the S3 support around 1.06011. On the other hand, if the price bounces off and moves upwards, the first resistance, R1, is around 1.07207. If the price closes above the R1, it will break the T1 Trendline and invalidate the downtrend. If it continues moving upwards, the next resistance area, R2, is the previous week’s high, approximately 1.07614.
GBP USD 4H
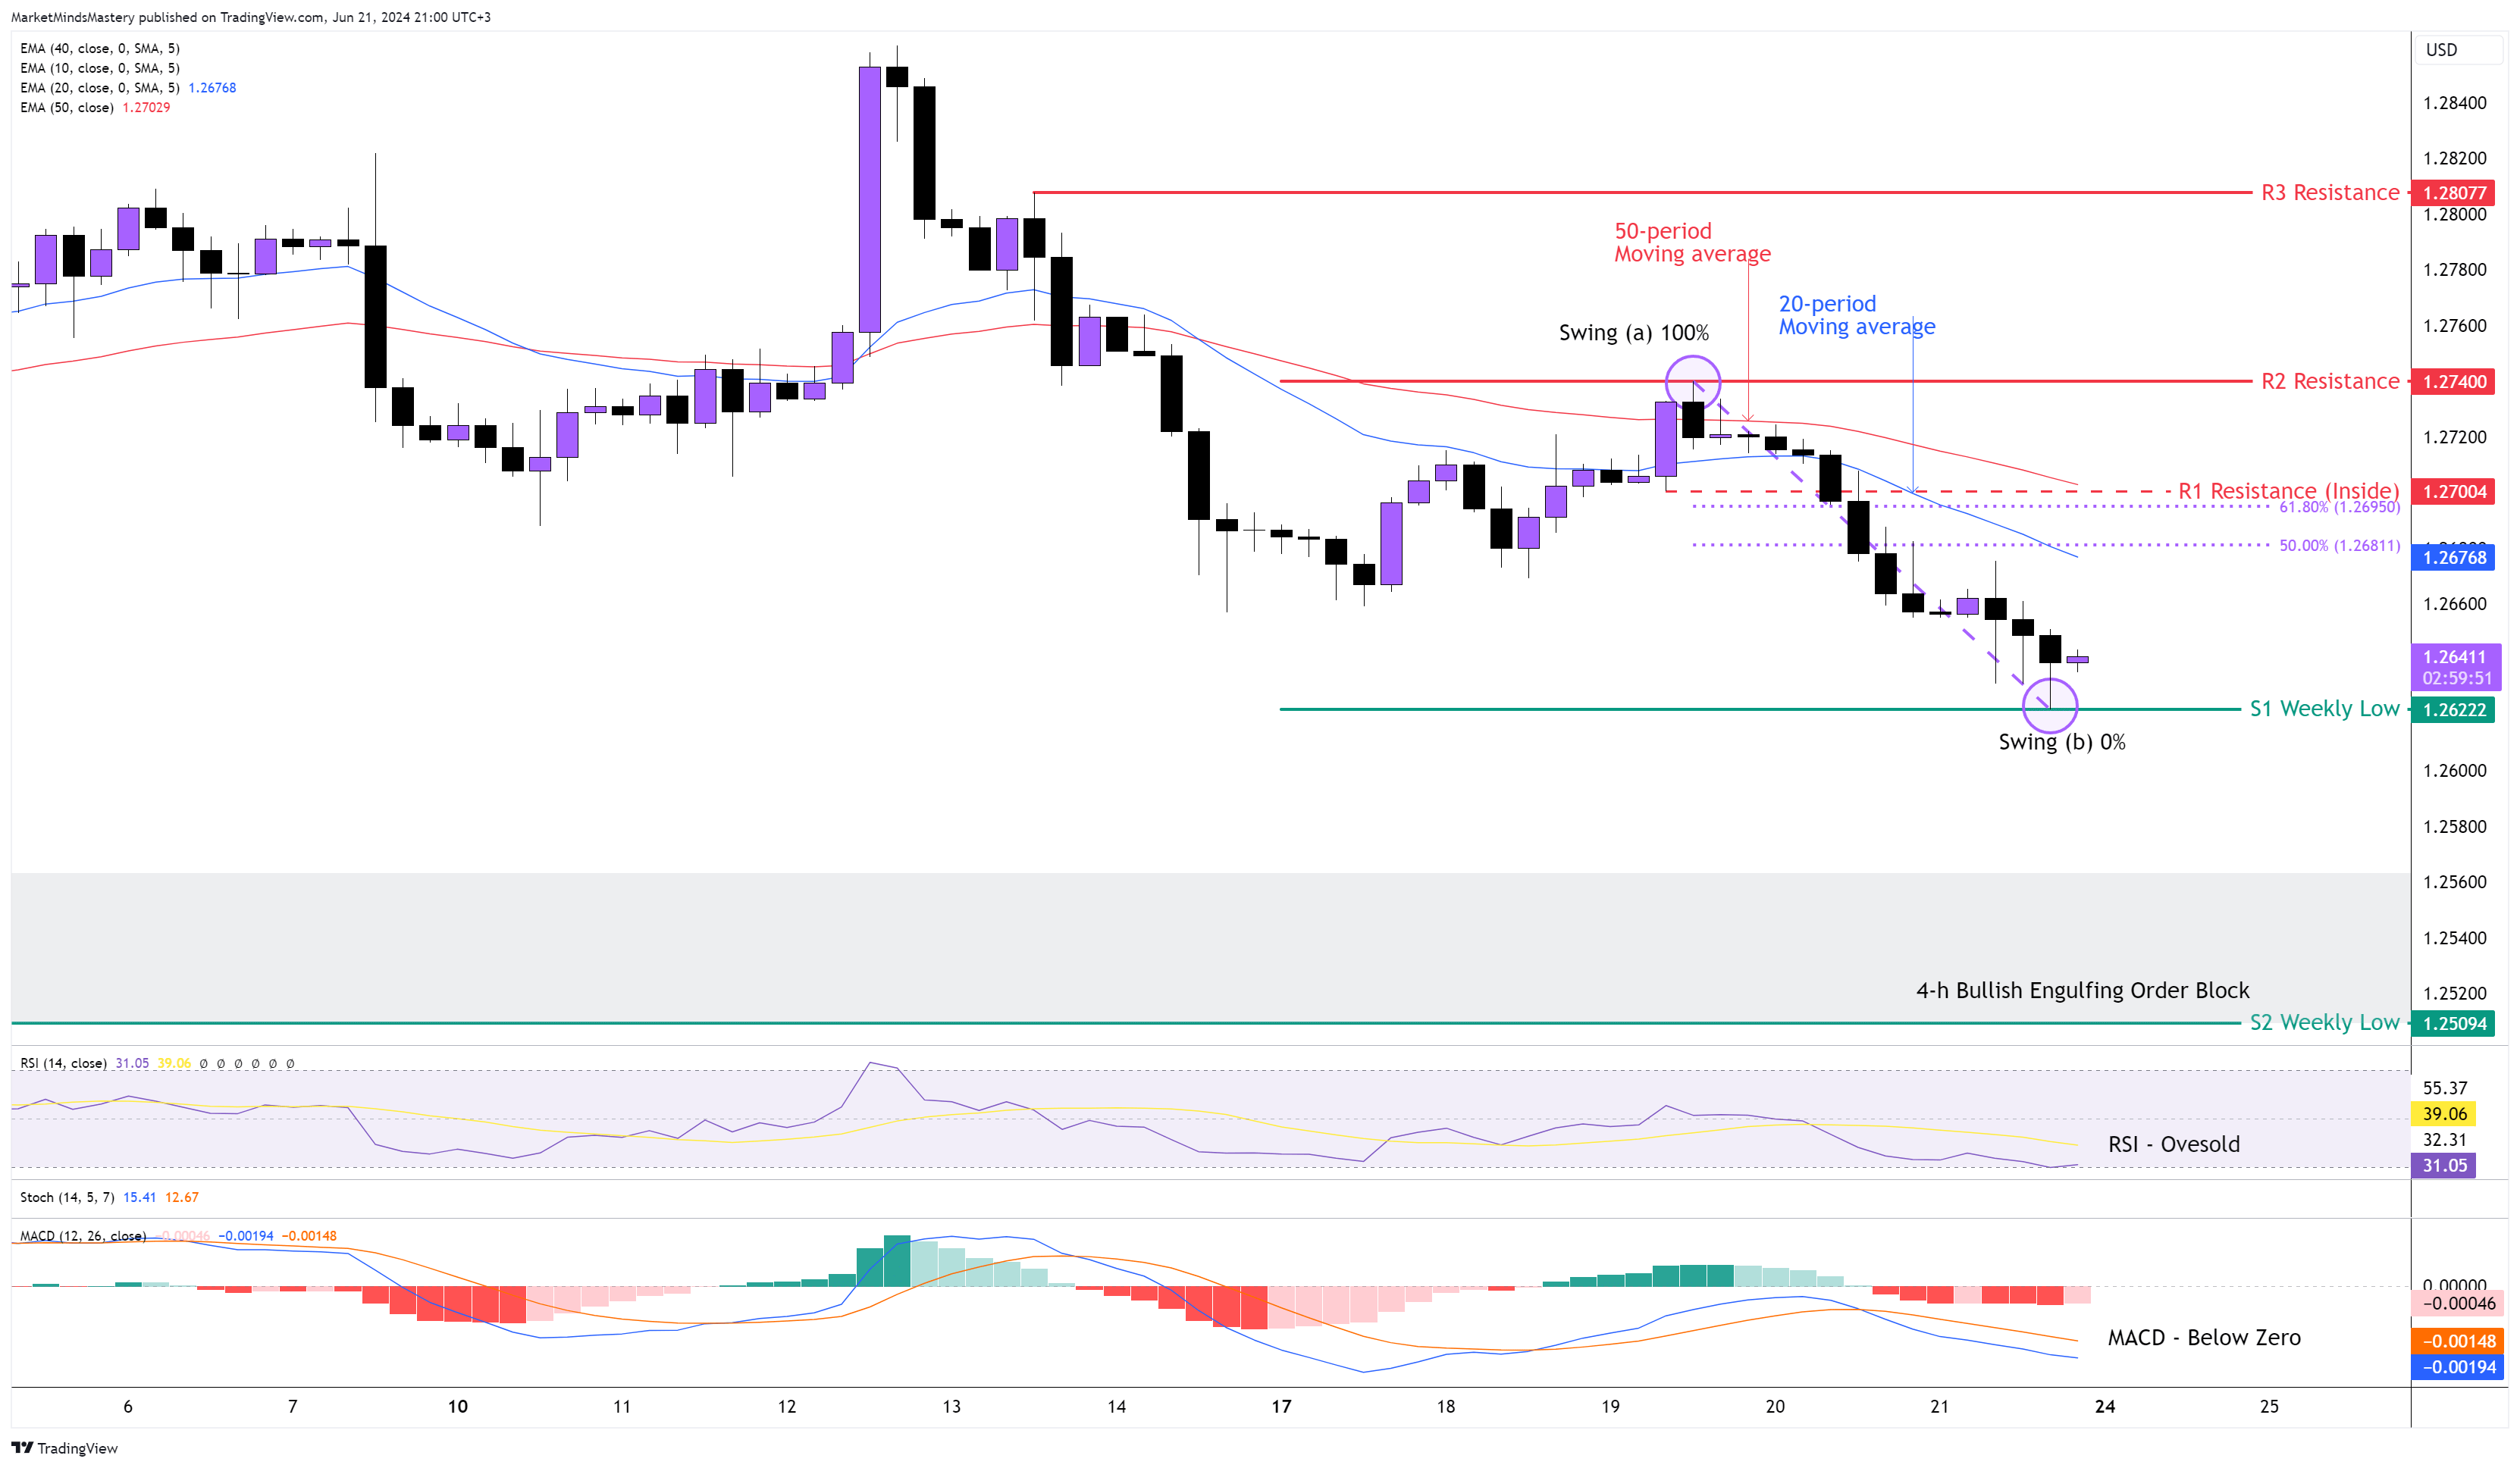
Last week, the price entered into the FVP declined, and a new market structure of lower high and lower low was created, pointing out Sterling’s weakness as the CPI reported lower than expected. Also, the Interest Rates remaining the same in the UK didn’t help the Pound gain strength against the US Dollar.
The price on the 4-hour chart makes lower highs and lower lows, and this has bearish implications. The RSI Oscillator is in an oversold condition, and this is bearish. The MACD is below zero, confirming the downtrend. The 20-period moving average is below the 50-period, and the distance between them gets widened.
Starting Monday, if the price continues to move lower, the first support area, S1, will be the previous week’s low, around 1.26222. If the price breaks below the S1 and declines further, the next support area, S2, will be approximately 110 pips below 1.25094. At this level, a Bullish Engulfing Order block was formed a while ago, and it hasn’t been tested. Oppositely, if the price finds support and moves upwards, the first area of resistance will be the R1 inside resistance around 1.2700. It is almost at the same level as the 61.8% Fibonacci level and the 20-period moving average. A further upward move finds the next resistance area, R2, approximately 1.27400, and this is the previous week’s high.
AUD USD 4H
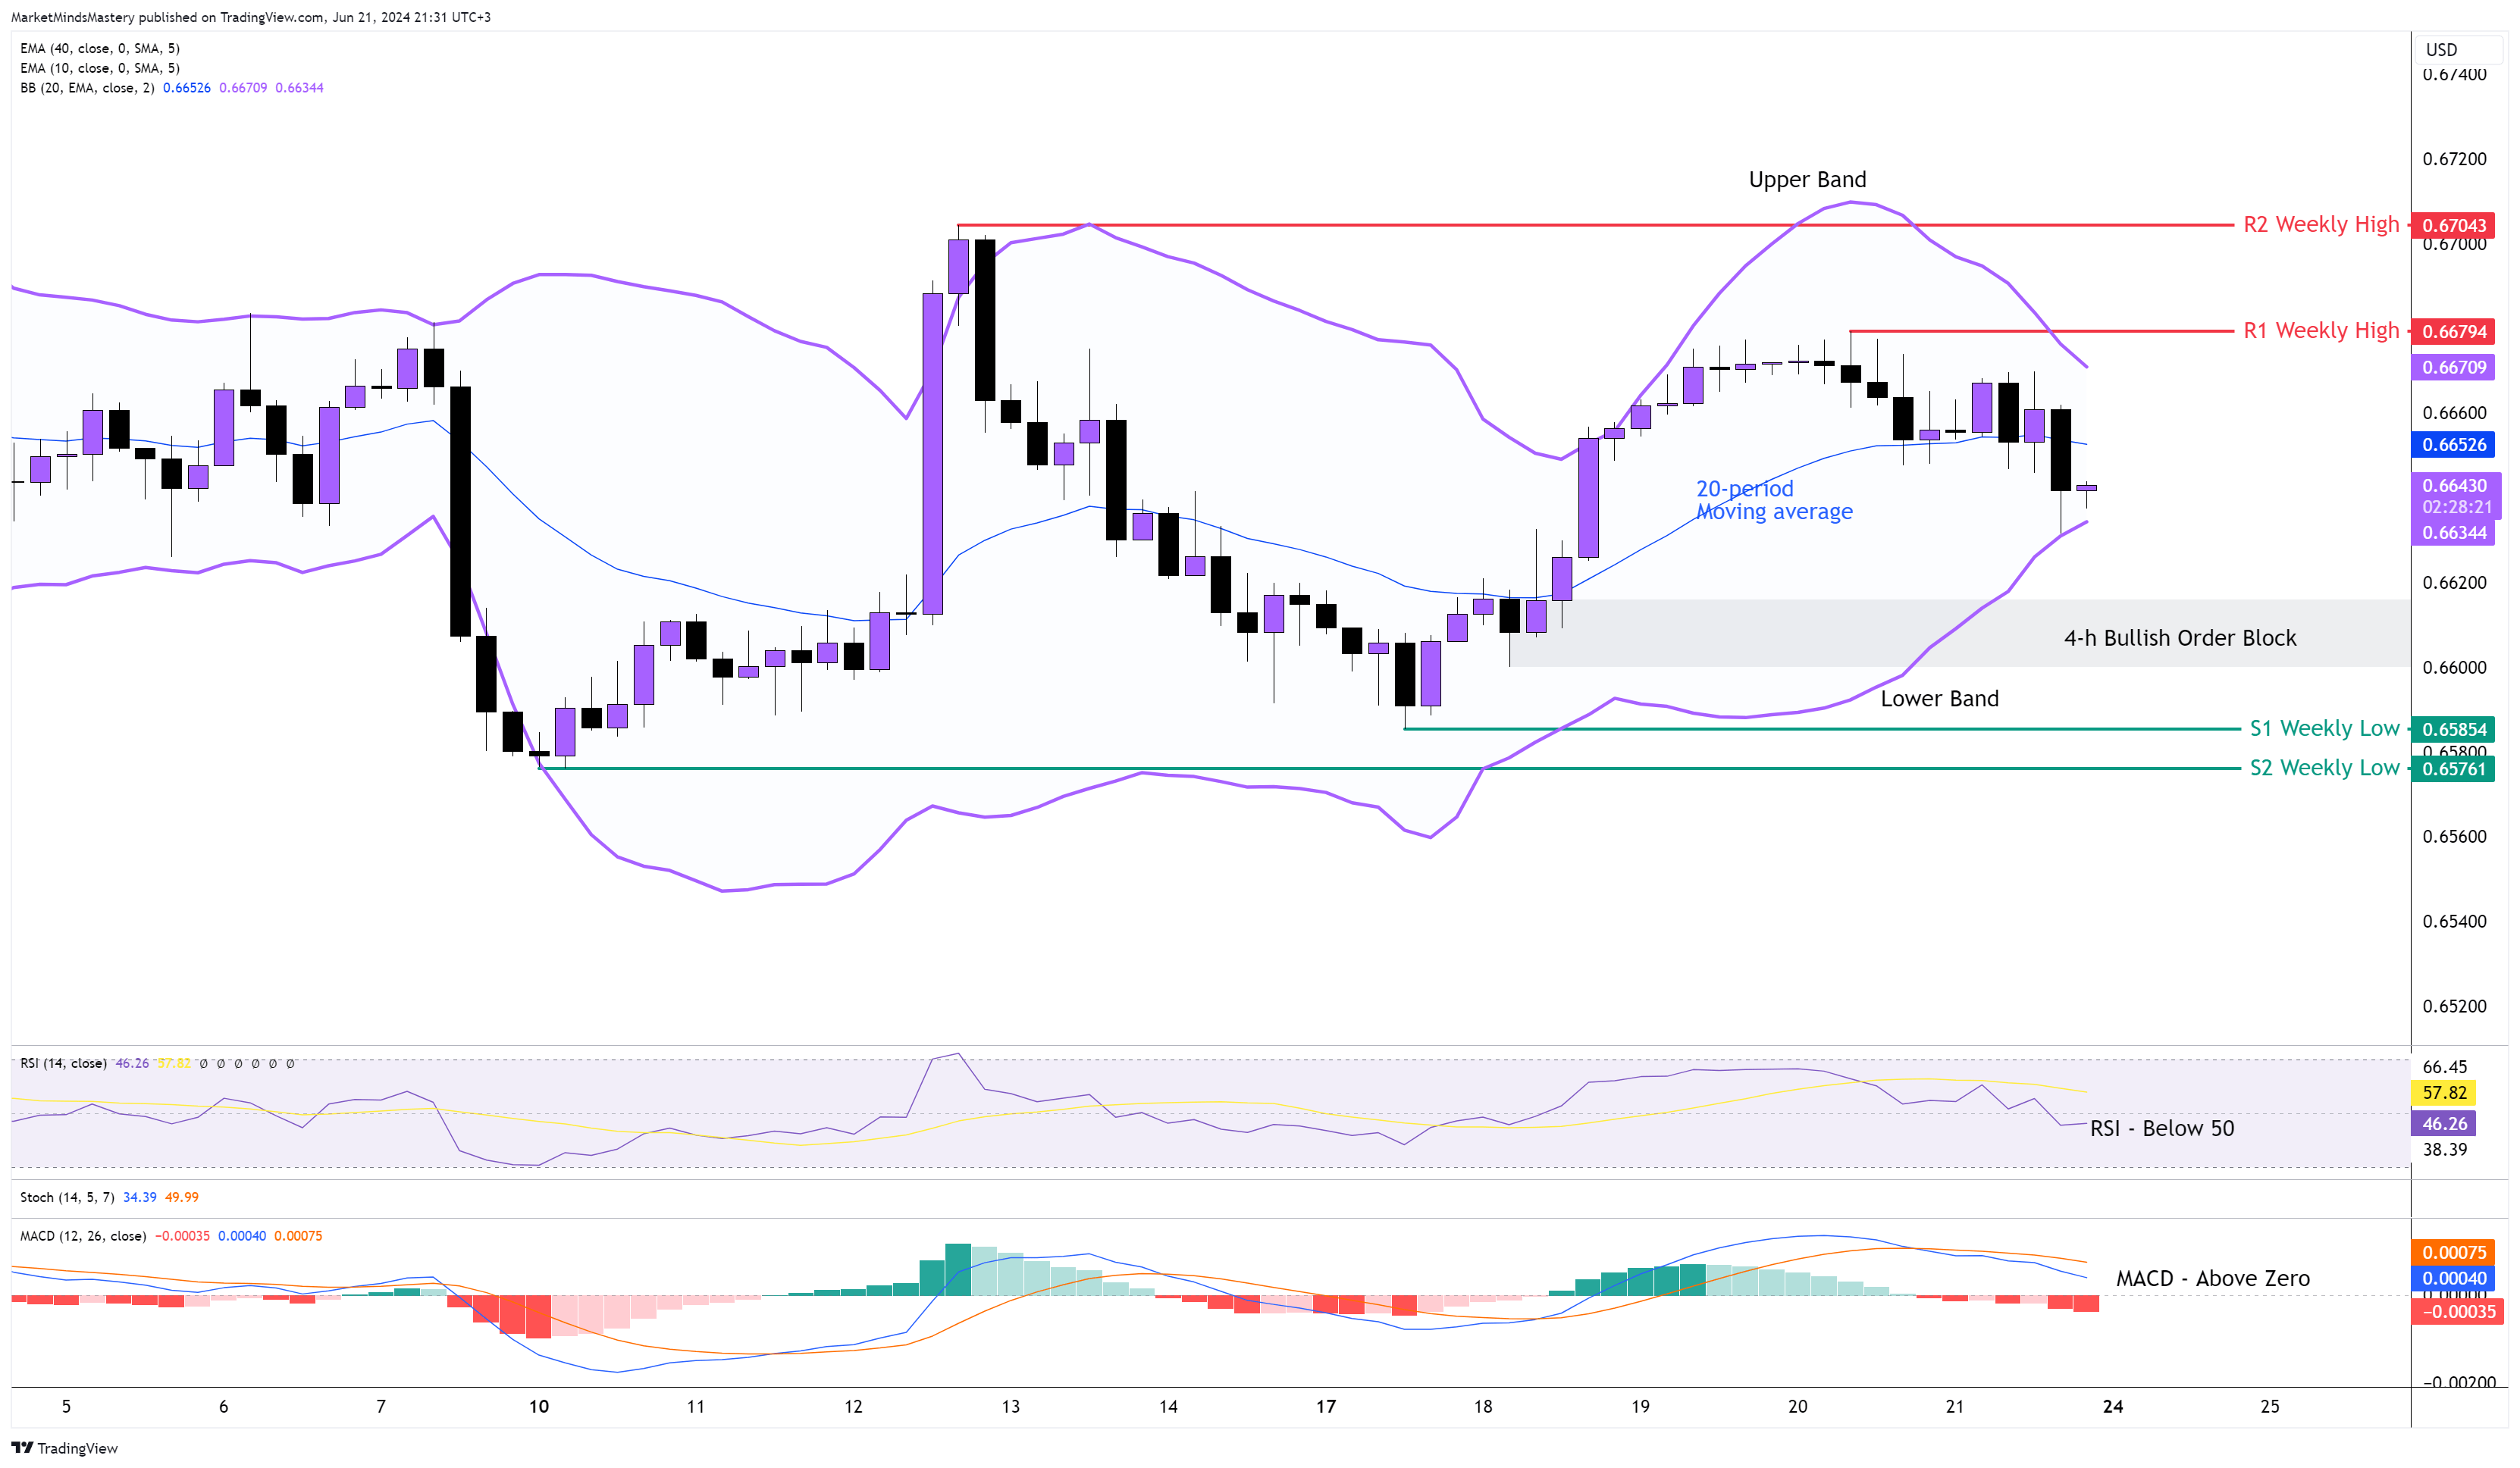
Last week, the price remained within the boundaries of the weekly highs and lows. Therefore, no directional move occurred. Traders and investors appreciated the Australian dollar as the RBA kept the interest rates unchanged. Despite that, the US dollar’s strength was more obvious, which is why the AUD didn't lift higher.
As the price trades in a sideways range, the Bollinger Band show a price contraction as the Upper Band and the Lower Band are pointing to each other. The RSI Oscillator is below 50, which indicates there is most recent selling pressure in the price rather than buying pressure. The MACD is above the zero line, which is bullish, but the histogram is under zero, which indicates that the price declines. This is a usual and often price behaviour of any market that ranges.
If the price finds support at the Lower Band and moves upward, the first resistance area, R1, is the previous week’s high, around 0.66794. If the price breaks above the R1 and keeps increasing, the next resistance area, R2, is an older weekly high at 0.67043.
On the contrary, if the price is rejected and moves downwards, the first support area, S1, is the previous week’s low at 0.65854. At a small distance above this level, as shown on the chart, there is a Bullish Order Block that caused the price to rally on the previous Tuesday. As we mentioned earlier, the weekly candle was an inside candle hence, the next support area, S2, is the low of that weekly candle, approximately 8 pips below the S1, at 0.65761.
USD JPY 4H
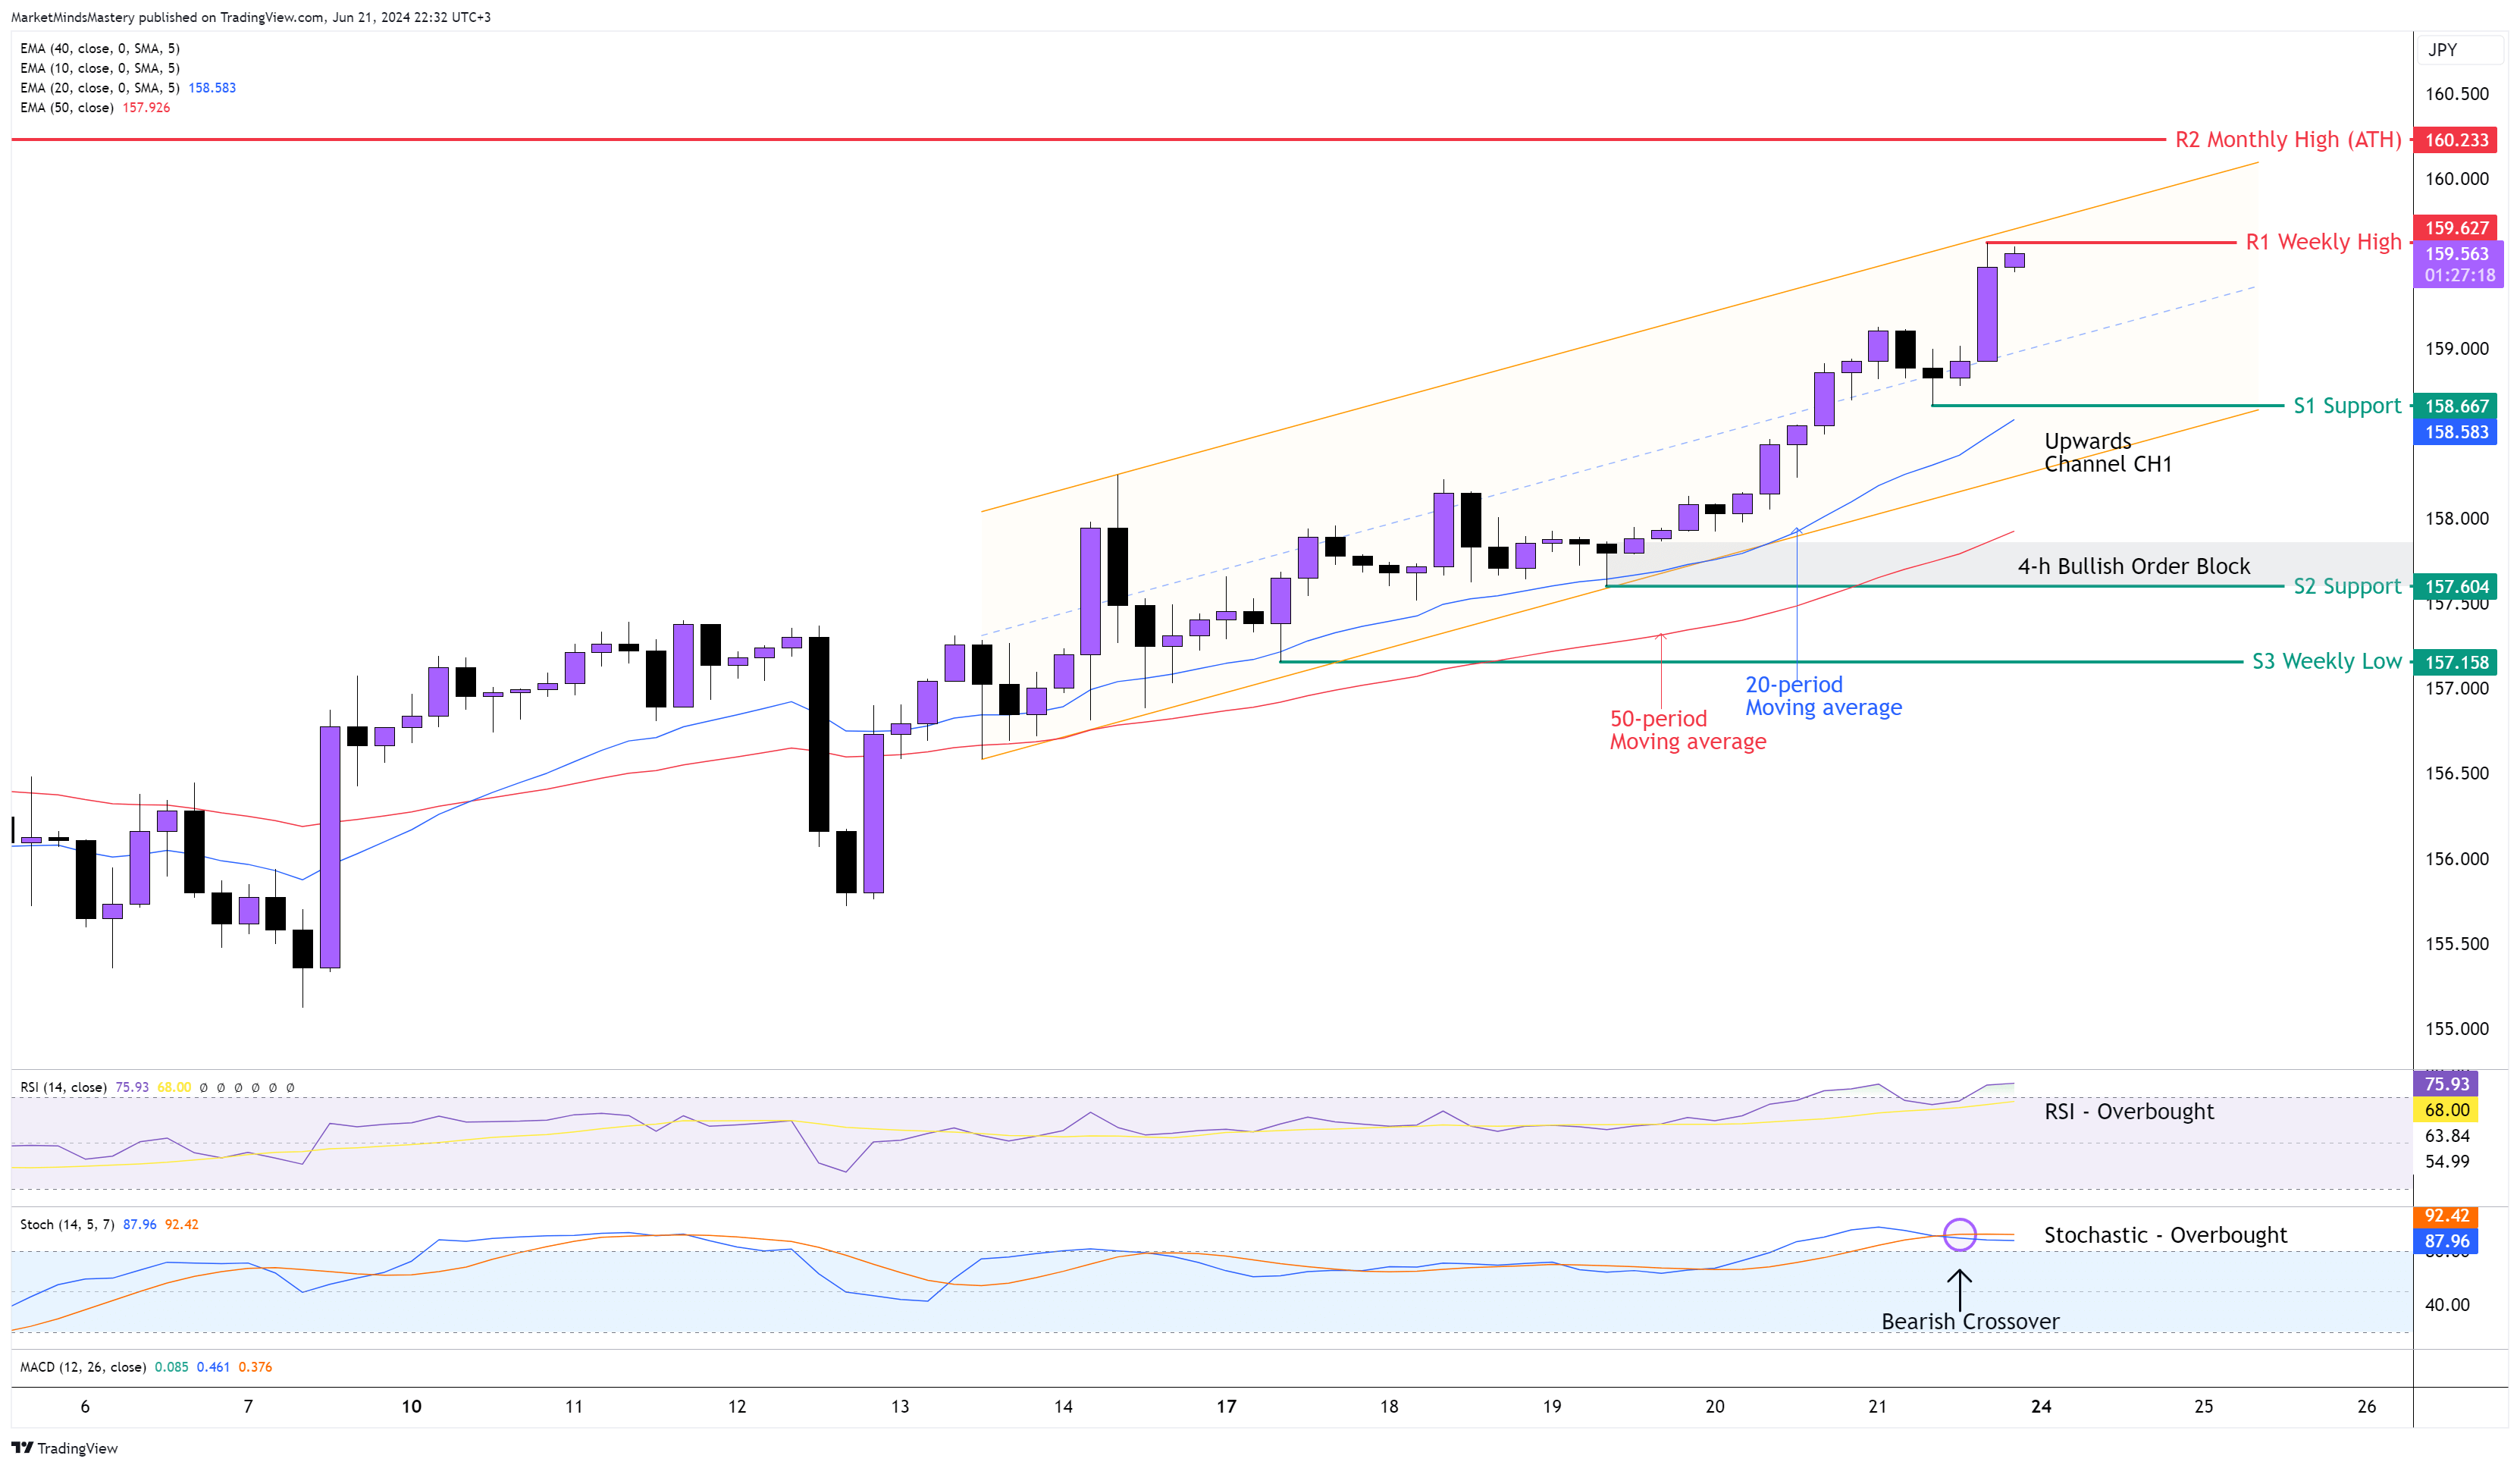
Following the previous week’s explanation about this currency pair's macroeconomic and technical scale, the price continued to show a strong upward move, barely touching the 20-period moving average on the 4-hour chart. That was a strong, bullish indication last week. The weekly candle closed almost at the same price as the high of the candle.
The price is trading within the trendlines of the UIpwards Channel CH1, and it makes a higher high and higher low with the retracement being shallow as we see on the chart that the black (bearish) candles are very small and much less compared with the bullish candles.
The 20-period moving average is still above the 50-period, and this has bullish implications. The RSI Oscillator is in an overbought condition, showing the bullish strength of the price. The Stochastic Oscillator is also in an overbought condition above 80, with recently a bearish crossover, which led to a shallow retracement, as shown on the chart. Last Wednesday, the price created a Bullish Order Block on this 4-hour chart, and it has not been filled yet.
Starting Monday, if the price continues to move upwards, the first resistance area, R1, will be the previous week's high, around 159.627. If the price penetrates the R1 and keeps increasing, the next resistance, R2, will be the ATH (All-Time High) at 160.233. In case the price declines and moves downwards, the first support area, S1, will be the recent swing low at 158.667. If the price breaks below the S1 and declines further, the next support area, S2, will be around 157.60. This level is a confluence of the 50-period moving average, the S2 support and the Bullish Order Block. If the price penetrates the S2 and moves lower, the next support area, S3, is the previous week’s low, around 157.158.
USD CHF 4H
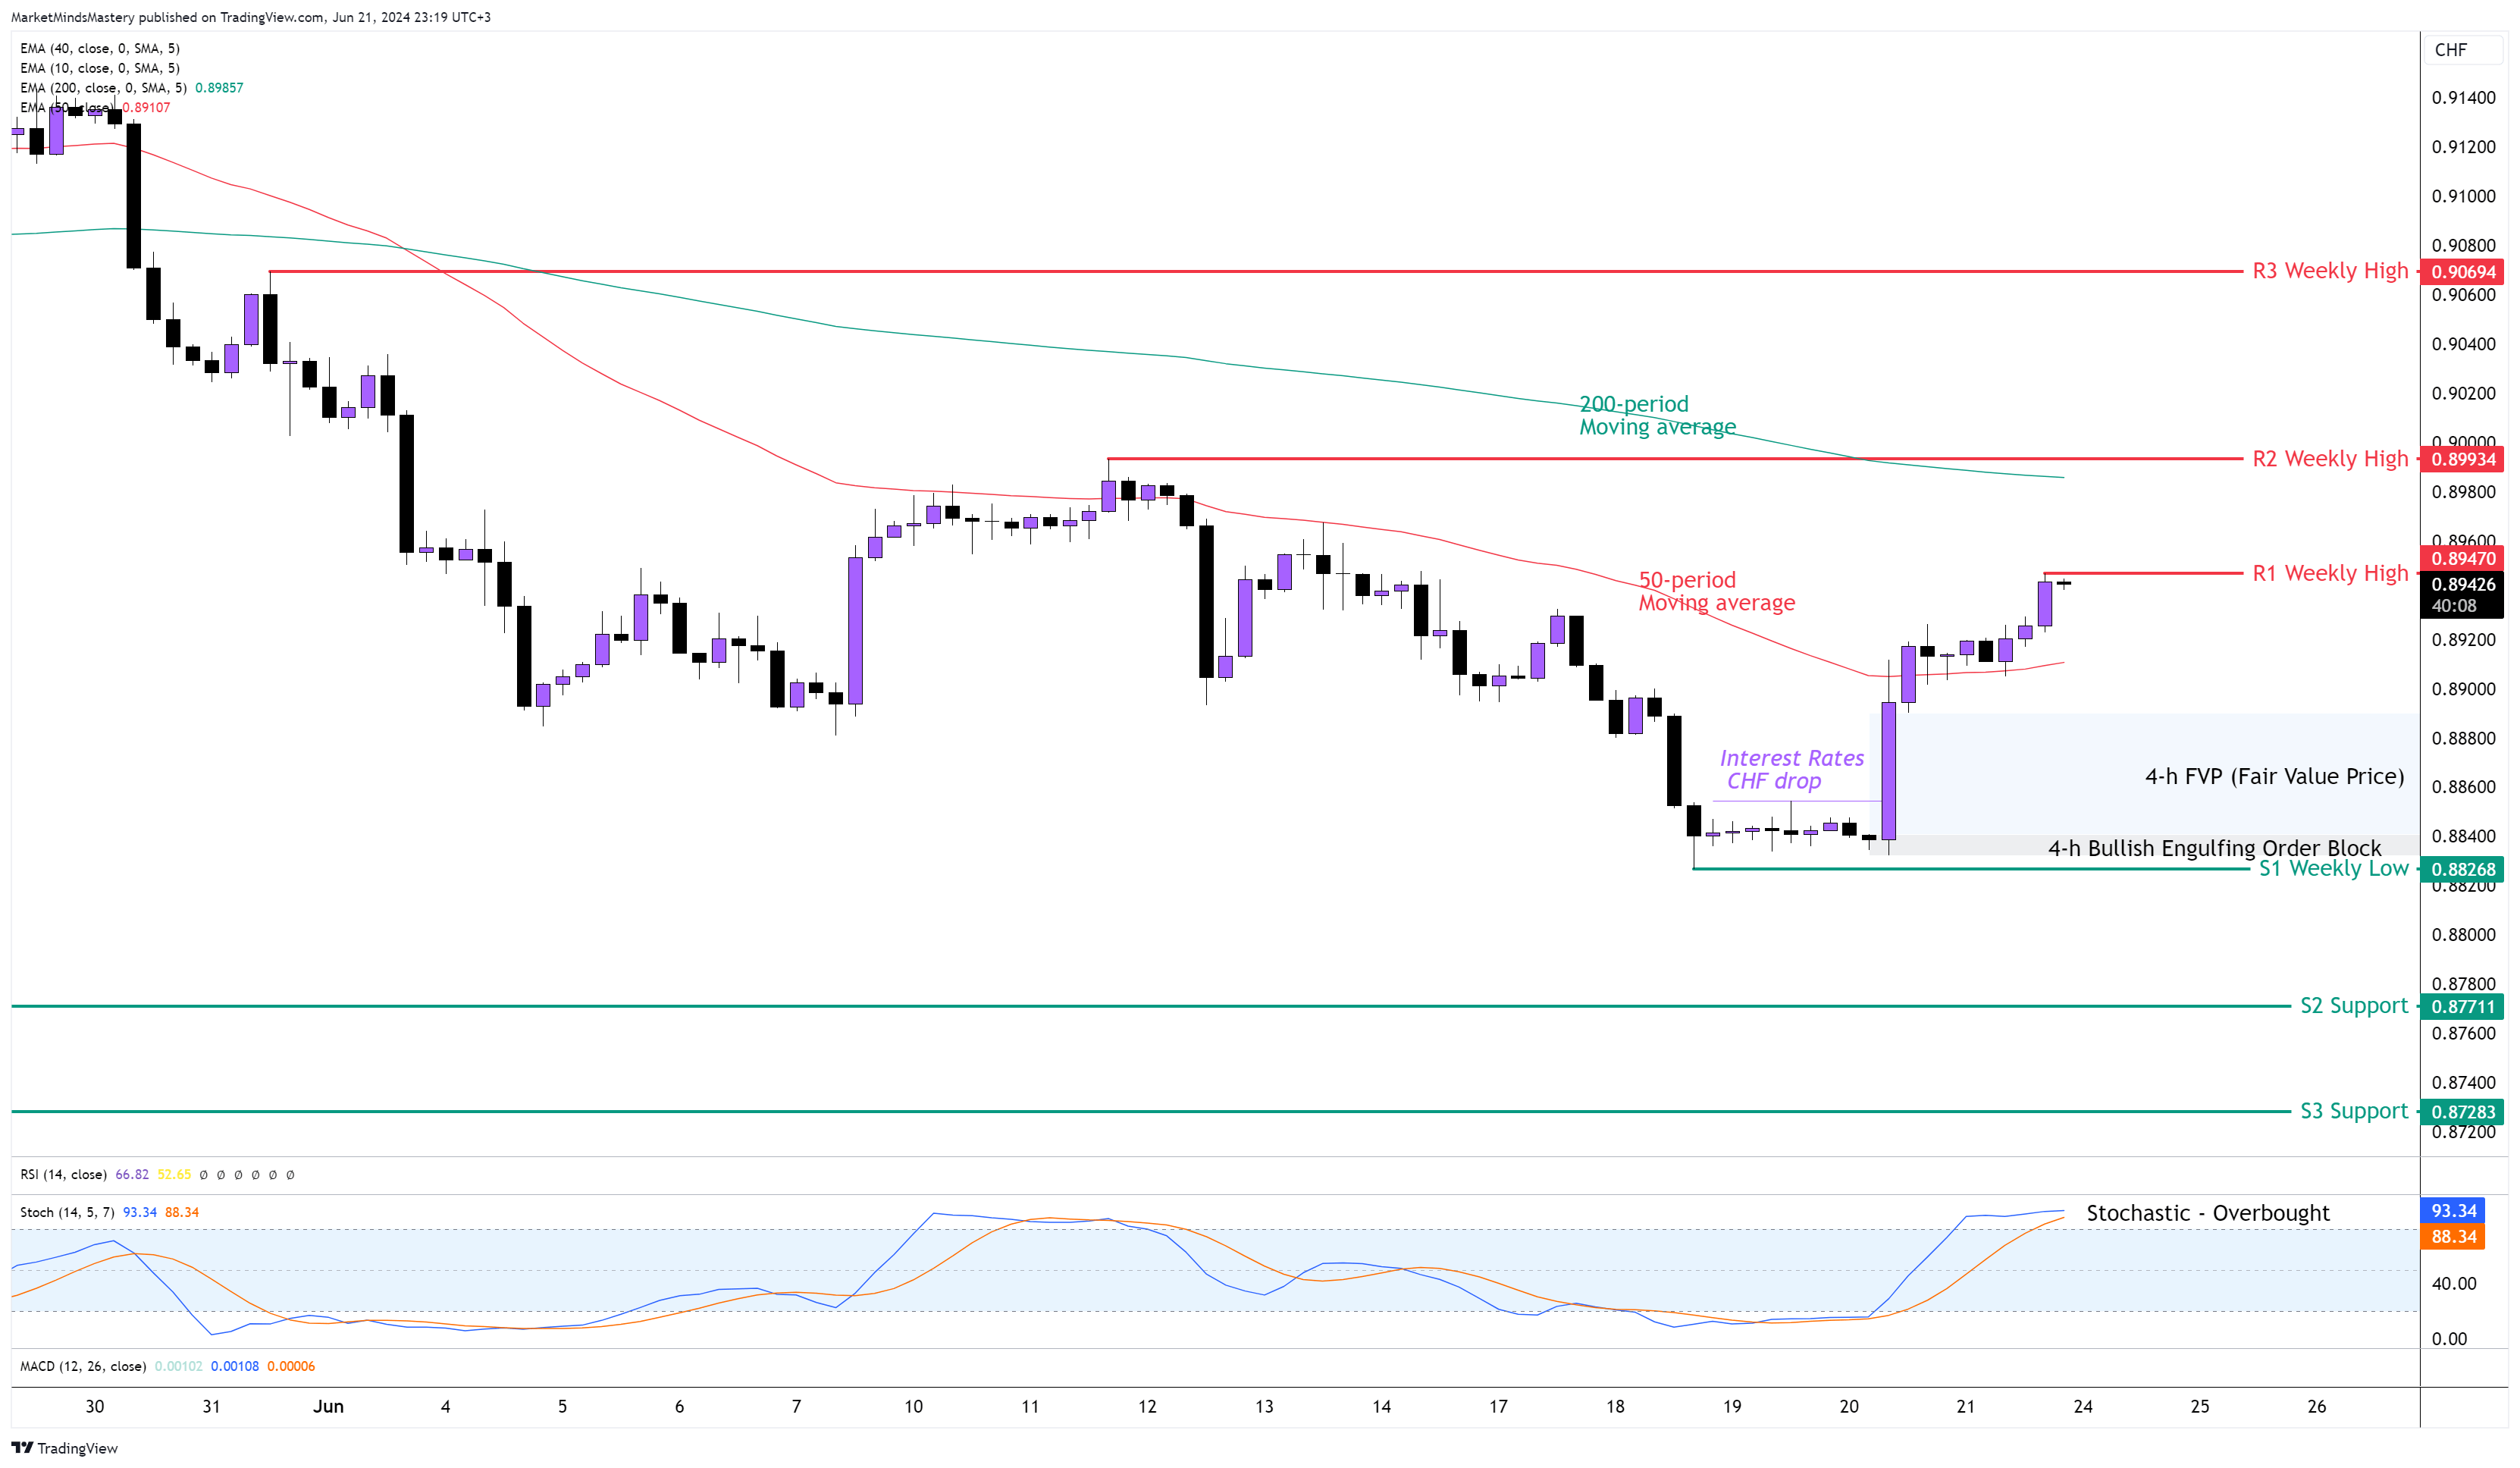
The SNB (Switzerland National Bank) is the 3rd major band that reduced the Interest rates this month by 25 basis points. During and after the report, traders mainly appreciated the USD, and the bullish candles overcame the bearish candles, as seen in the chart above. On the weekly chart, the price created a hammer reversal price action. As it didn't come from a strong support area, a market structure of higher highs and higher lows on the 4-hour chart is needed to confirm a bullish trend and apply trending trading strategies.
The 50-period moving average is below the 200-period moving average, and this is bearish. The Stochastic Oscillator is overbought, which means that during the last 7 periods on the 4-hour chart, the price was driven by significant buying pressure. After the interest rates announcement last Thursday, the price moved upwards, leaving behind an FVP and a Bullish Engulfing Order Block. The price closed almost at the same level as the weekly high. Therefore, if the price continues to move upwards, the first resistance area R1 will be the previous week’s high around 0.89470. If the price penetrates the R1 and closes above it, the next resistance area, R2, will be around 0.89934, which is another weekly high.
On the other hand, if the price is rejected and moves downwards, the first support area, S1, will be around 0.88268, which is the previous week’s low. If the S1 support penetrates, it is expected to be a significant penetration because the FVP and the Bullish Order block won’t cause the price to bounce off from it. In this case, the next support area, S2, will be around 0.87111. A further decline finds the next support area, S3 approximately 0.87283.
GBP JPY 4H
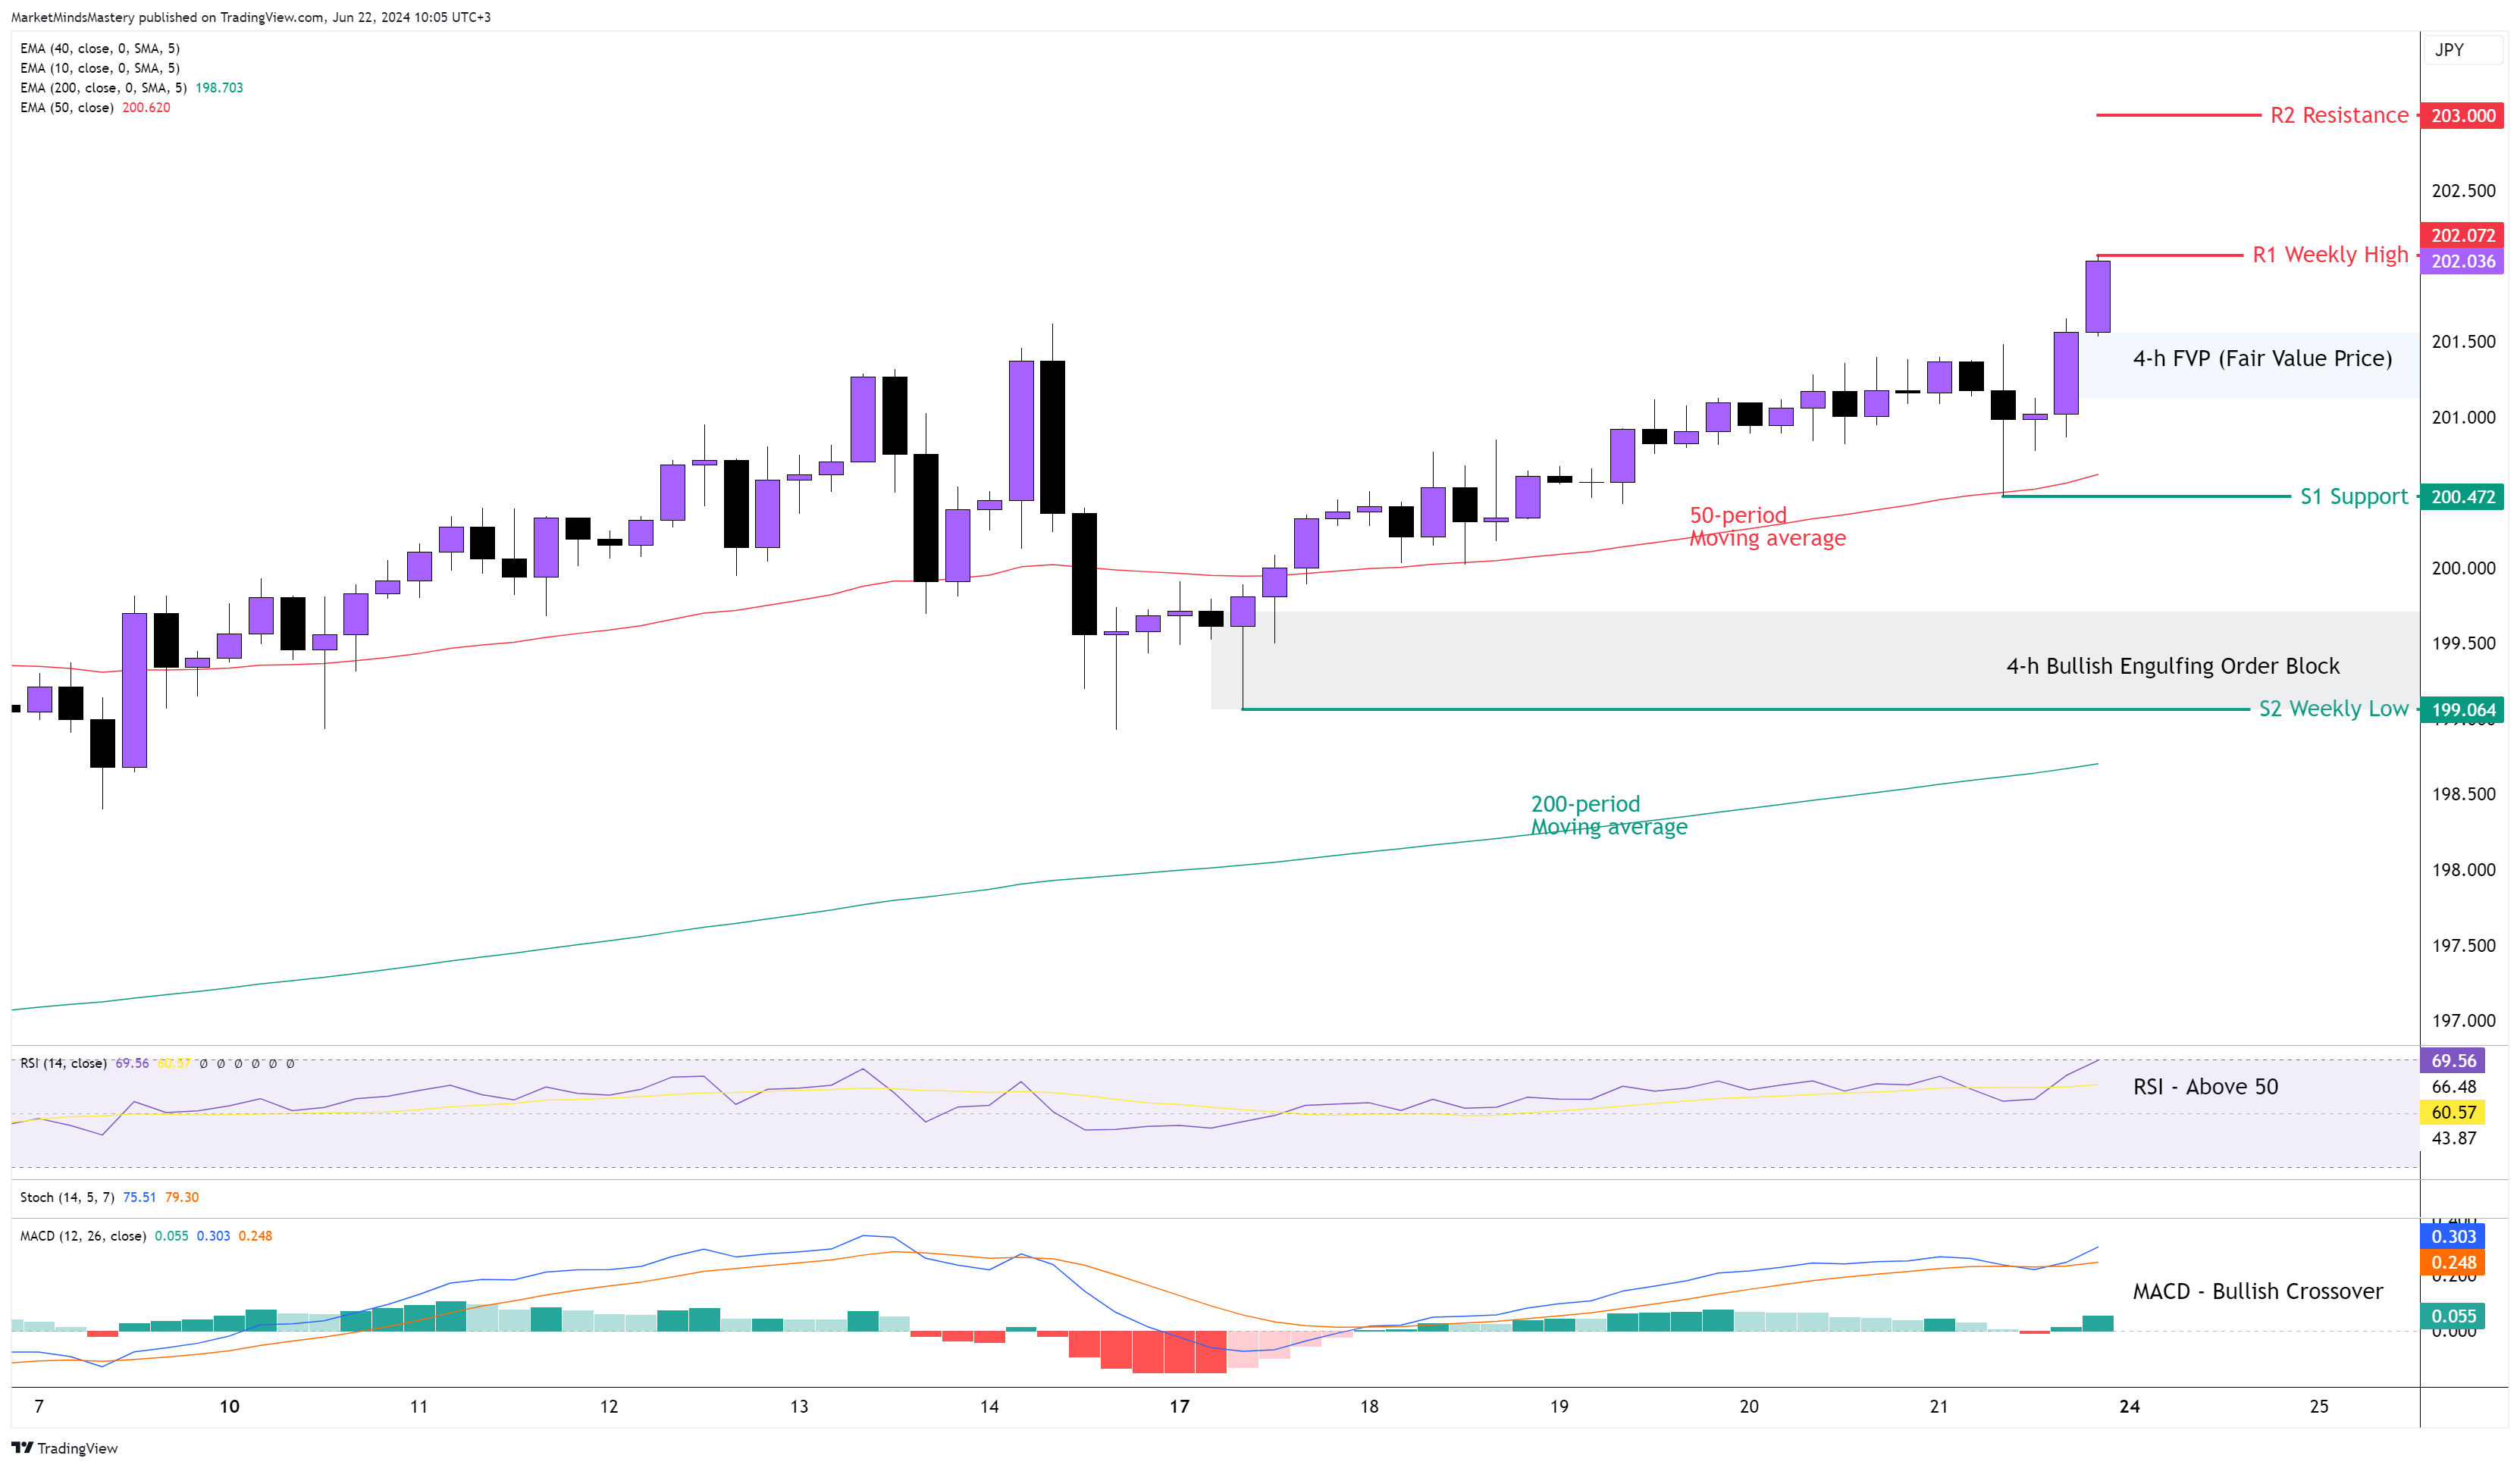
The Japanese Yen is known for its “tradition” to try and be always a “|weak” currency to support the import purposes of Japan. Although the Sterling was also a weak currency last week, the chart shows that the Yen was much weaker, which is why the GBPJPY currency pair was appreciated.
Following their uptrend continuation on the 4-hour chart, the price kept moving upwards with a series of higher highs and higher lows. After the price interacted with the 1-H Bearish Engulfing Order Block as per last week’s market outlook, it was rejected and moved downwards until the 50-period moving average, where it found support, bounced off and pushed upwards, registering a new weekly high.
The 50-period is above the 200-period moving average, and this is bullish. The RSI is almost in an overbought condition, which is a strong bullish indication. The MACD created a Bullish Crossover above the zero line, which is also a bullish indication.
If the price continues its upward move, the first resistance area, R1, will be the previous week’s high, around 202.072, almost the same level as the weekly candle’s close. If the price penetrates the R1 and increases, the next resistance area, R2, will be the 203 level. However, if the price moves downwards, the FVP created last Friday can act as a support area, and the price can bounce off from there. If not, and the price declines further or goes for a deep retracement, the first static support, S1, will be the 200.472 area. If the price closes below the S1 and moves downwards, the next static support, S2, will be the previous week’s low, around 199.064. In this area, there is a well-defined Bullish Engulfing Order Block, which can be an add-on to the support.
GOLD 4H
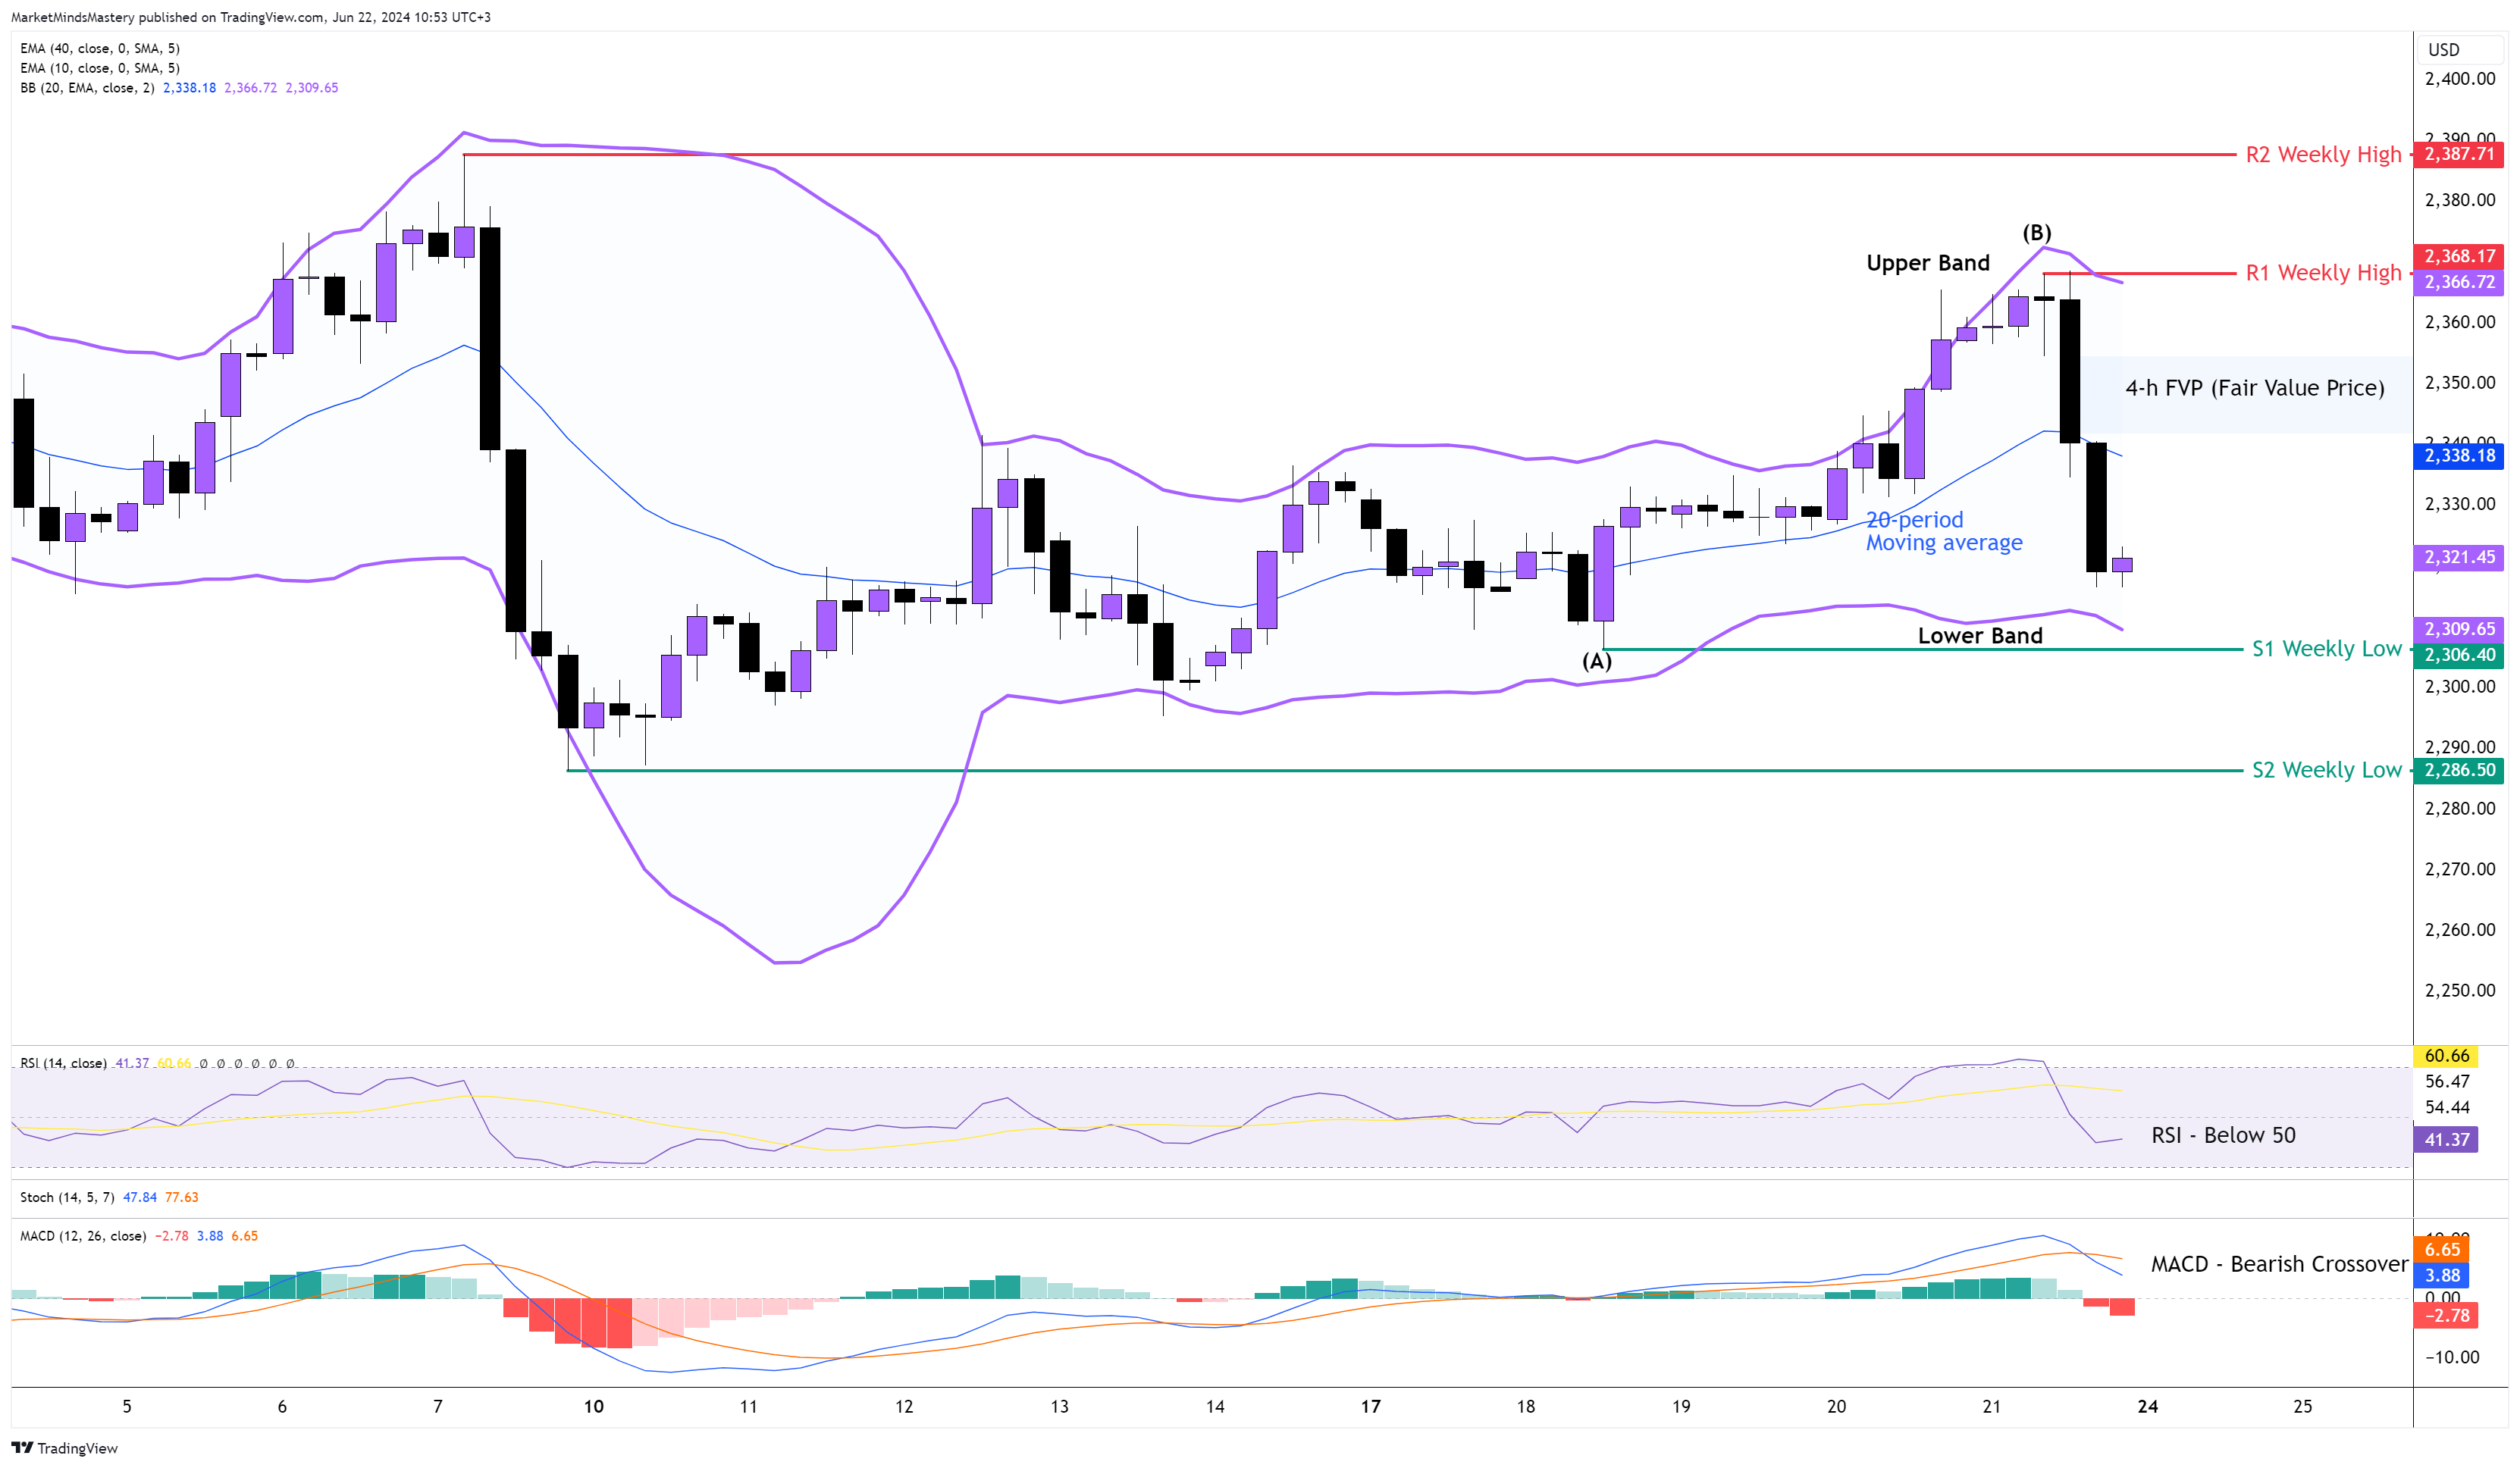
The inside candle on the weekly chart acted as a temporary bullish reversal last week until the price reached the top of the FVP we marked on the previous week’s market outlook and declined last Friday. The weekly price action ended up as a doji candle, and the 4-h chart retraced on Friday, almost 100% of the move from point (A) to point (B).
Currently, the price is below the middle line of the Bollinger Band indicator, which represents the 20-period moving average. The Long Bearish (Black) candles show the significant number of sell orders that entered the market last Friday. That was due to the strength of the US dollar during the New York trading session, which was the last session of the week.
The Bollinger Upper and Lower Bands are pointing downwards following the price drop. The RSI is below 50, which has bearish implications. The MACD is above the zero line, and it shows a bearish crossover which is bearish.
Starting Monday, if the price moves downwards, the first support area will be the previous week’s low, around $2306. If it penetrates the S1 and declines further, the next support S2 will be approximately $2286.
On the other hand, if the price finds support and moves upwards, the first resistance area, R1, will be around $2368 at the previous week’s high. In order to reach that, the price first needs to penetrate the FVP (Fair Value Price) area successfully. A further upward move finds the next resistance area, R2, around $2387.
US OIL 4H
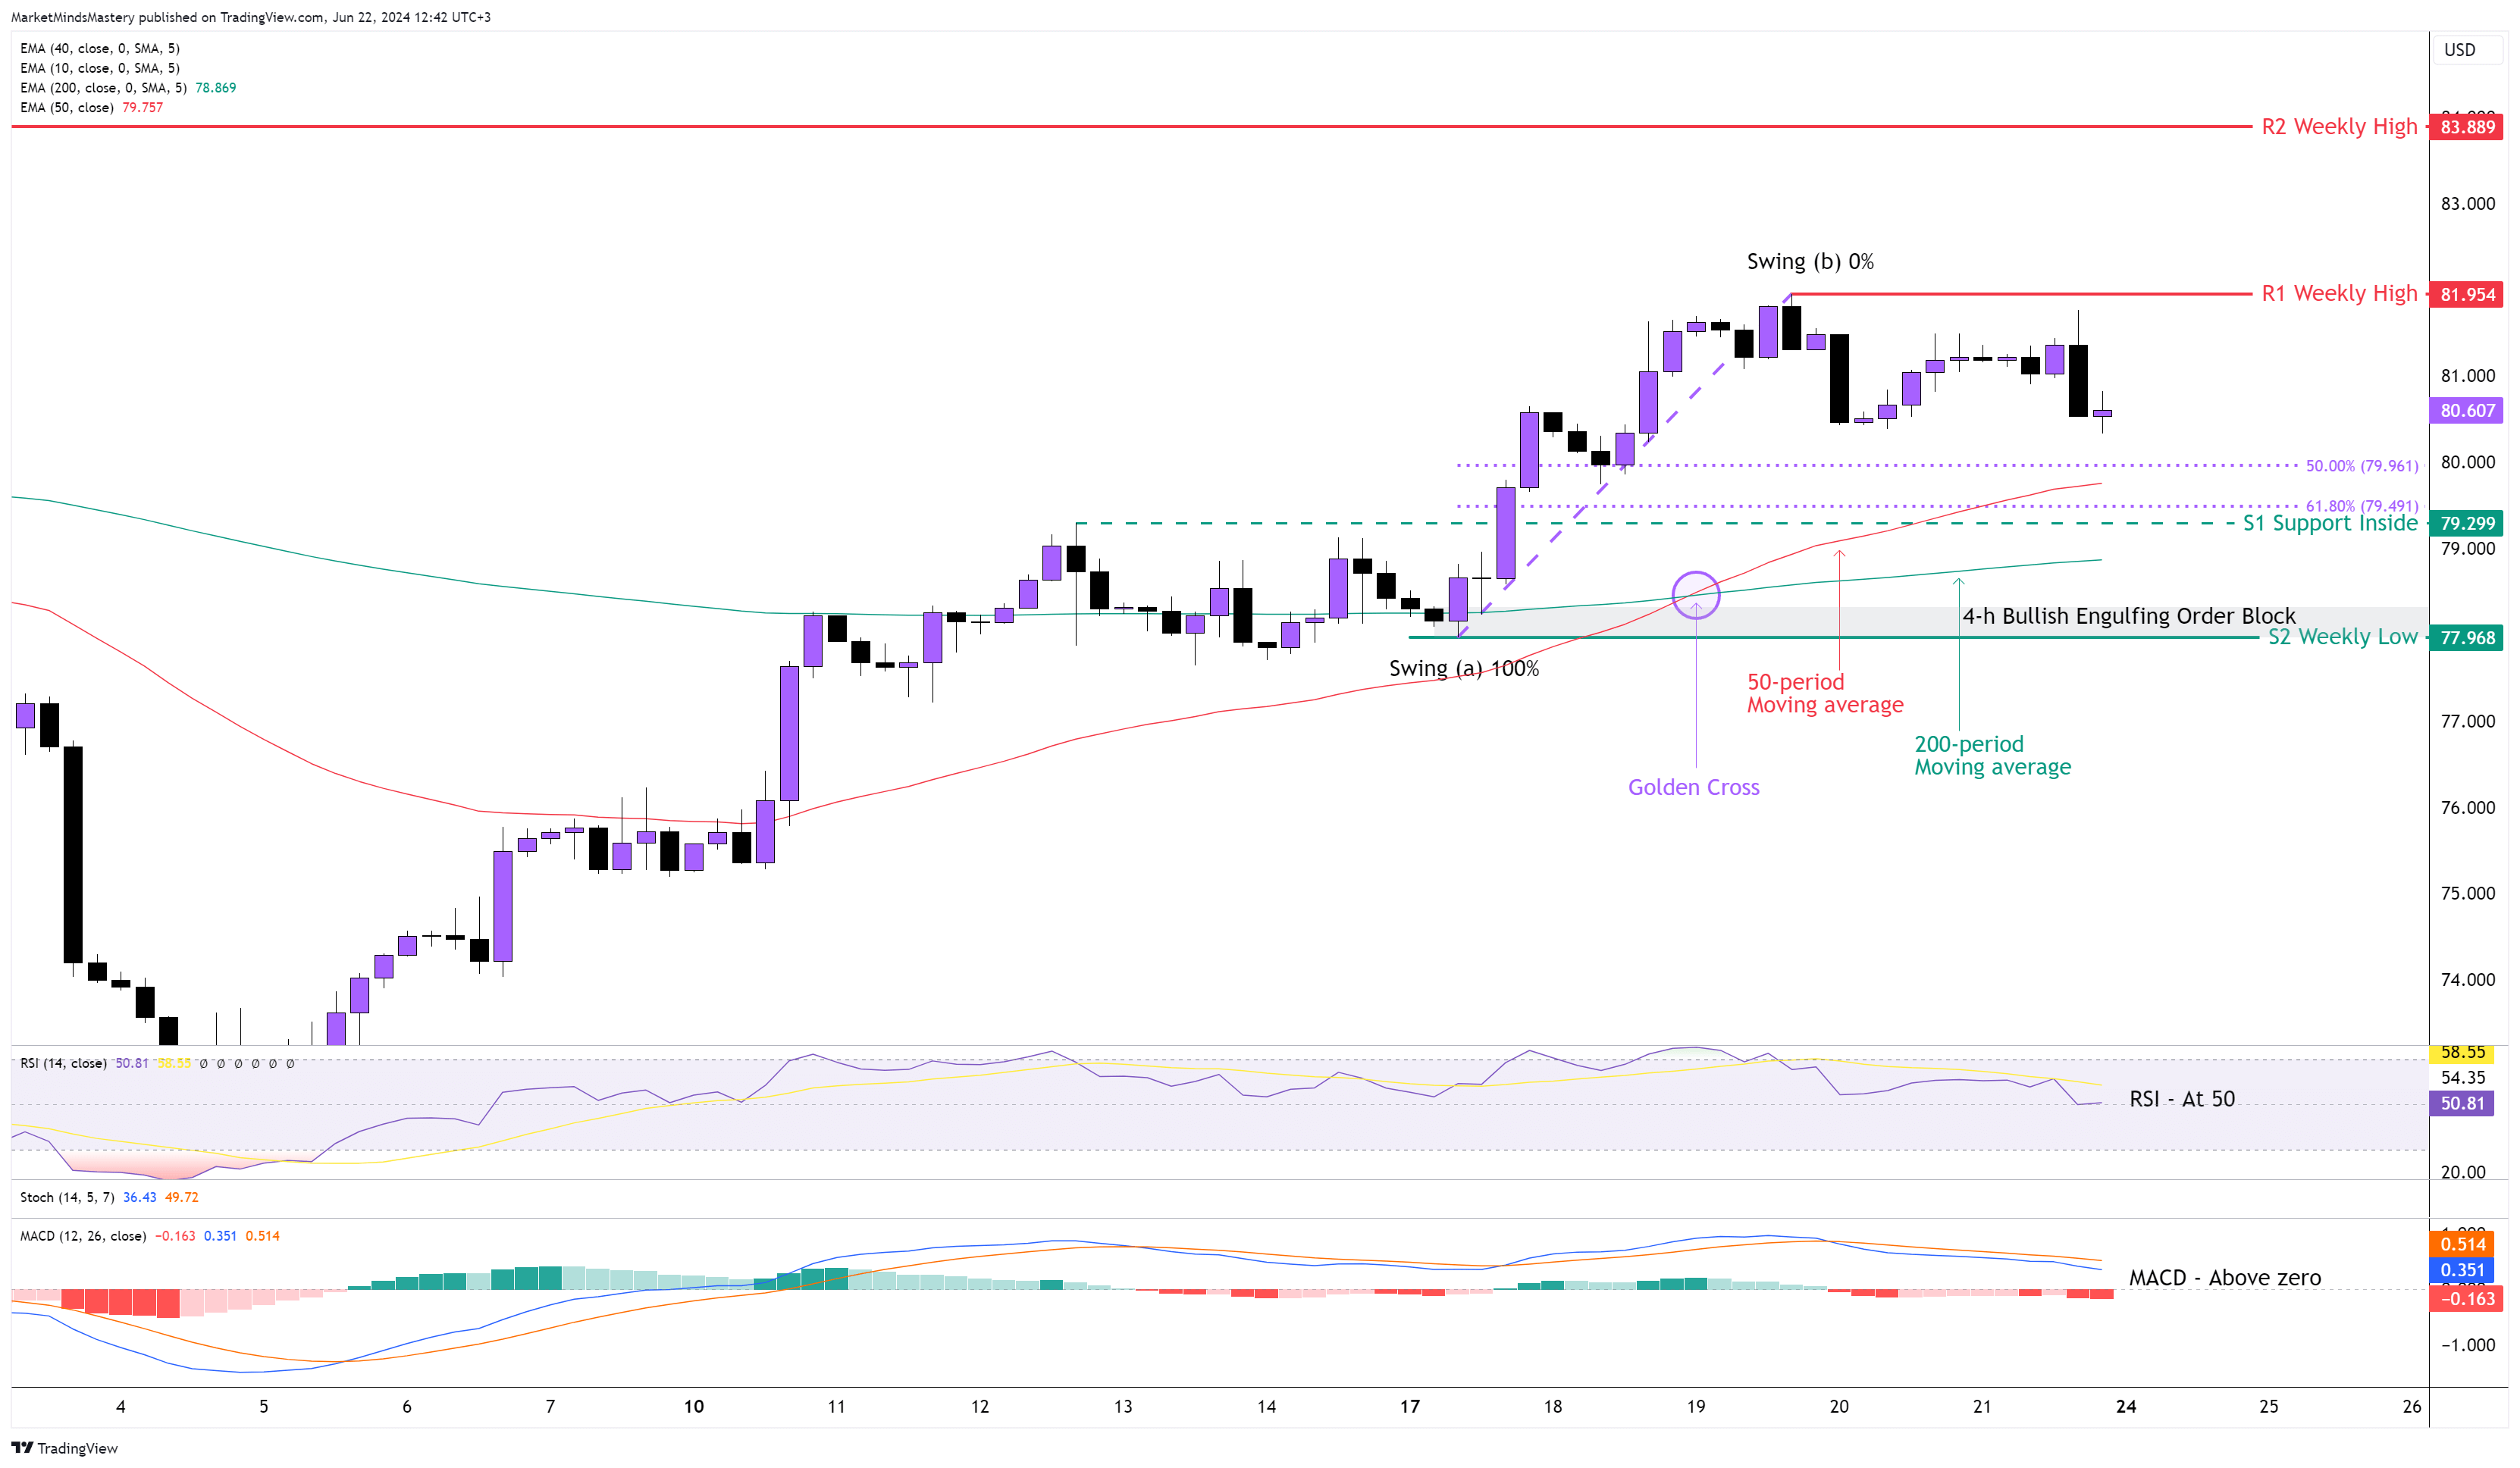
The weekly price action on the USOIL ended up as a bullish candle with a close above the previous week’s candle.
On the 4-hour chart, the price makes higher highs and higher lows, and last Wednesday, the moving averages created the Golden Cross as the 50-period crossed above the 200-period moving average.
The RSI is above the middle line 50, which is bullish, and the MACD is above the zero line, which is also a bullish indication.
Last Friday, the price created a Bearish Engulfing candle approximately at the same level as the most recent swing high at point (b). Therefore, if the price declines further, the first support area, S1, will be the inside support around $79.99, which consists of the 50-period moving average and the 61.8% Fibonacci number. If the price does not find support to bounce off and it keeps declining, the next support area, S2, will be the previous week’s low, around $77.96. As seen in the chart, there is a Bullish Engulfing Order Block that created the S2 support.
Oppositely, if the price finds support and moves upwards, the first resistance area, R1, will be the previous week’s high, around $81.95. If the price penetrates the R1 and keeps its upward move, the uptrend will continue, and the next resistance area, R2, will be around $83.88, which this level is an old weekly high.
BTC USD 4H
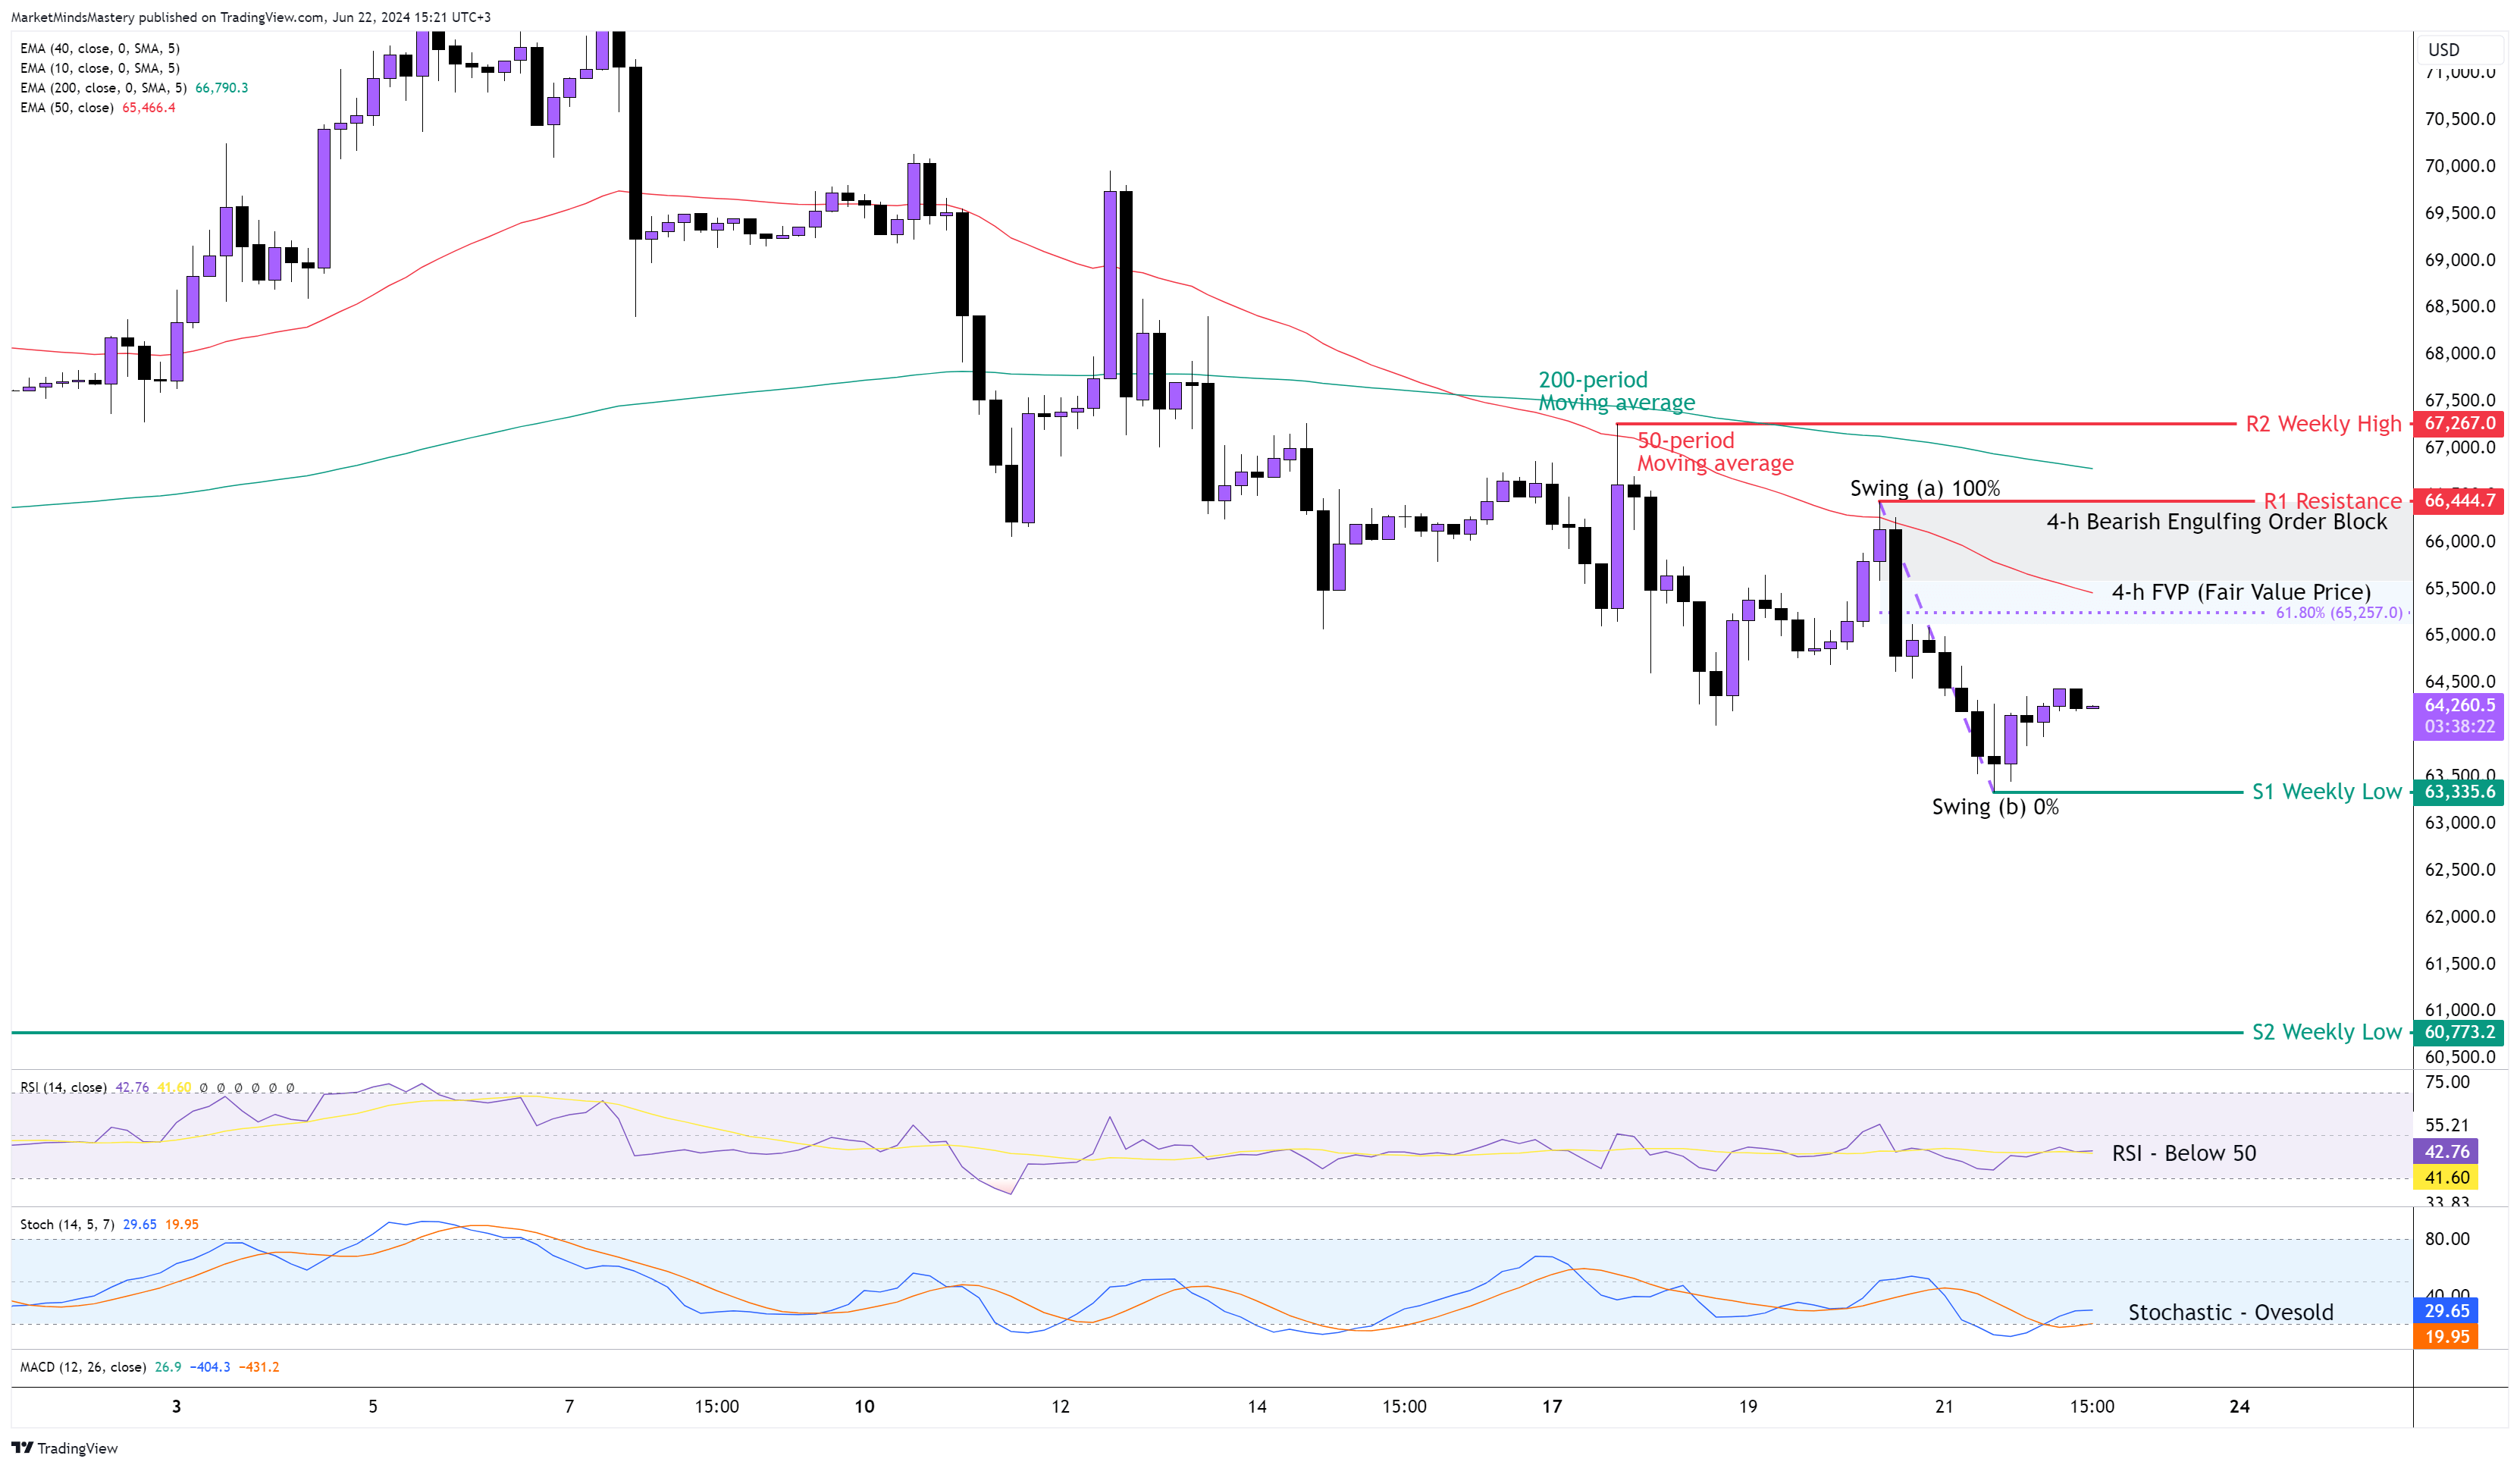
Last week, the price of the Bitcoin was retraced at the Order Block we marked on the chart and declined instantly, moving downwards and creating a new lower low, and the downtrend continued. The price action on the weekly chart was a bearish continuation candle, but the primary trend (weekly trend) is still an uptrend.
As the price created a correction on the 4-hour chart, the market makes successfully lower lows and lower highs. The RSI Oscillator is below 50, which has bearish implications, and the Stochastic Oscillator also has bearish implications as it is in an oversold condition, which means the downtrend is strong.
The 50-period is still below the 200-period moving average, and the distance between the two is widening, indicating that the price is selling off rapidly.
As the price created a new swing low at point (b), we forecast a retracement using the Fibonacci 61.8% Golden Ration at around $65250.
If the price continues its downward move, the first support area, S1, will be the previous week’s low, around $63335. If the price penetrates the S1, closes below it and keeps moving downwards, the next support area, S2, will have another weekly low of around $60773.
On the other hand, if the price moves upwards, it will continue the price retracement, and the first resistance area will be the Fibonacci 61.8%. As this level does not provide any static support, traders need to be aware of this. If the price penetrates 61.8% and keeps increasing, the next static resistance, based on the swing analysis, will be $66444. At this level, a Bearish engulfing Order Block formed last week. A further upward move finds the next resistance area, R2, around $67267.
SP 500 4H
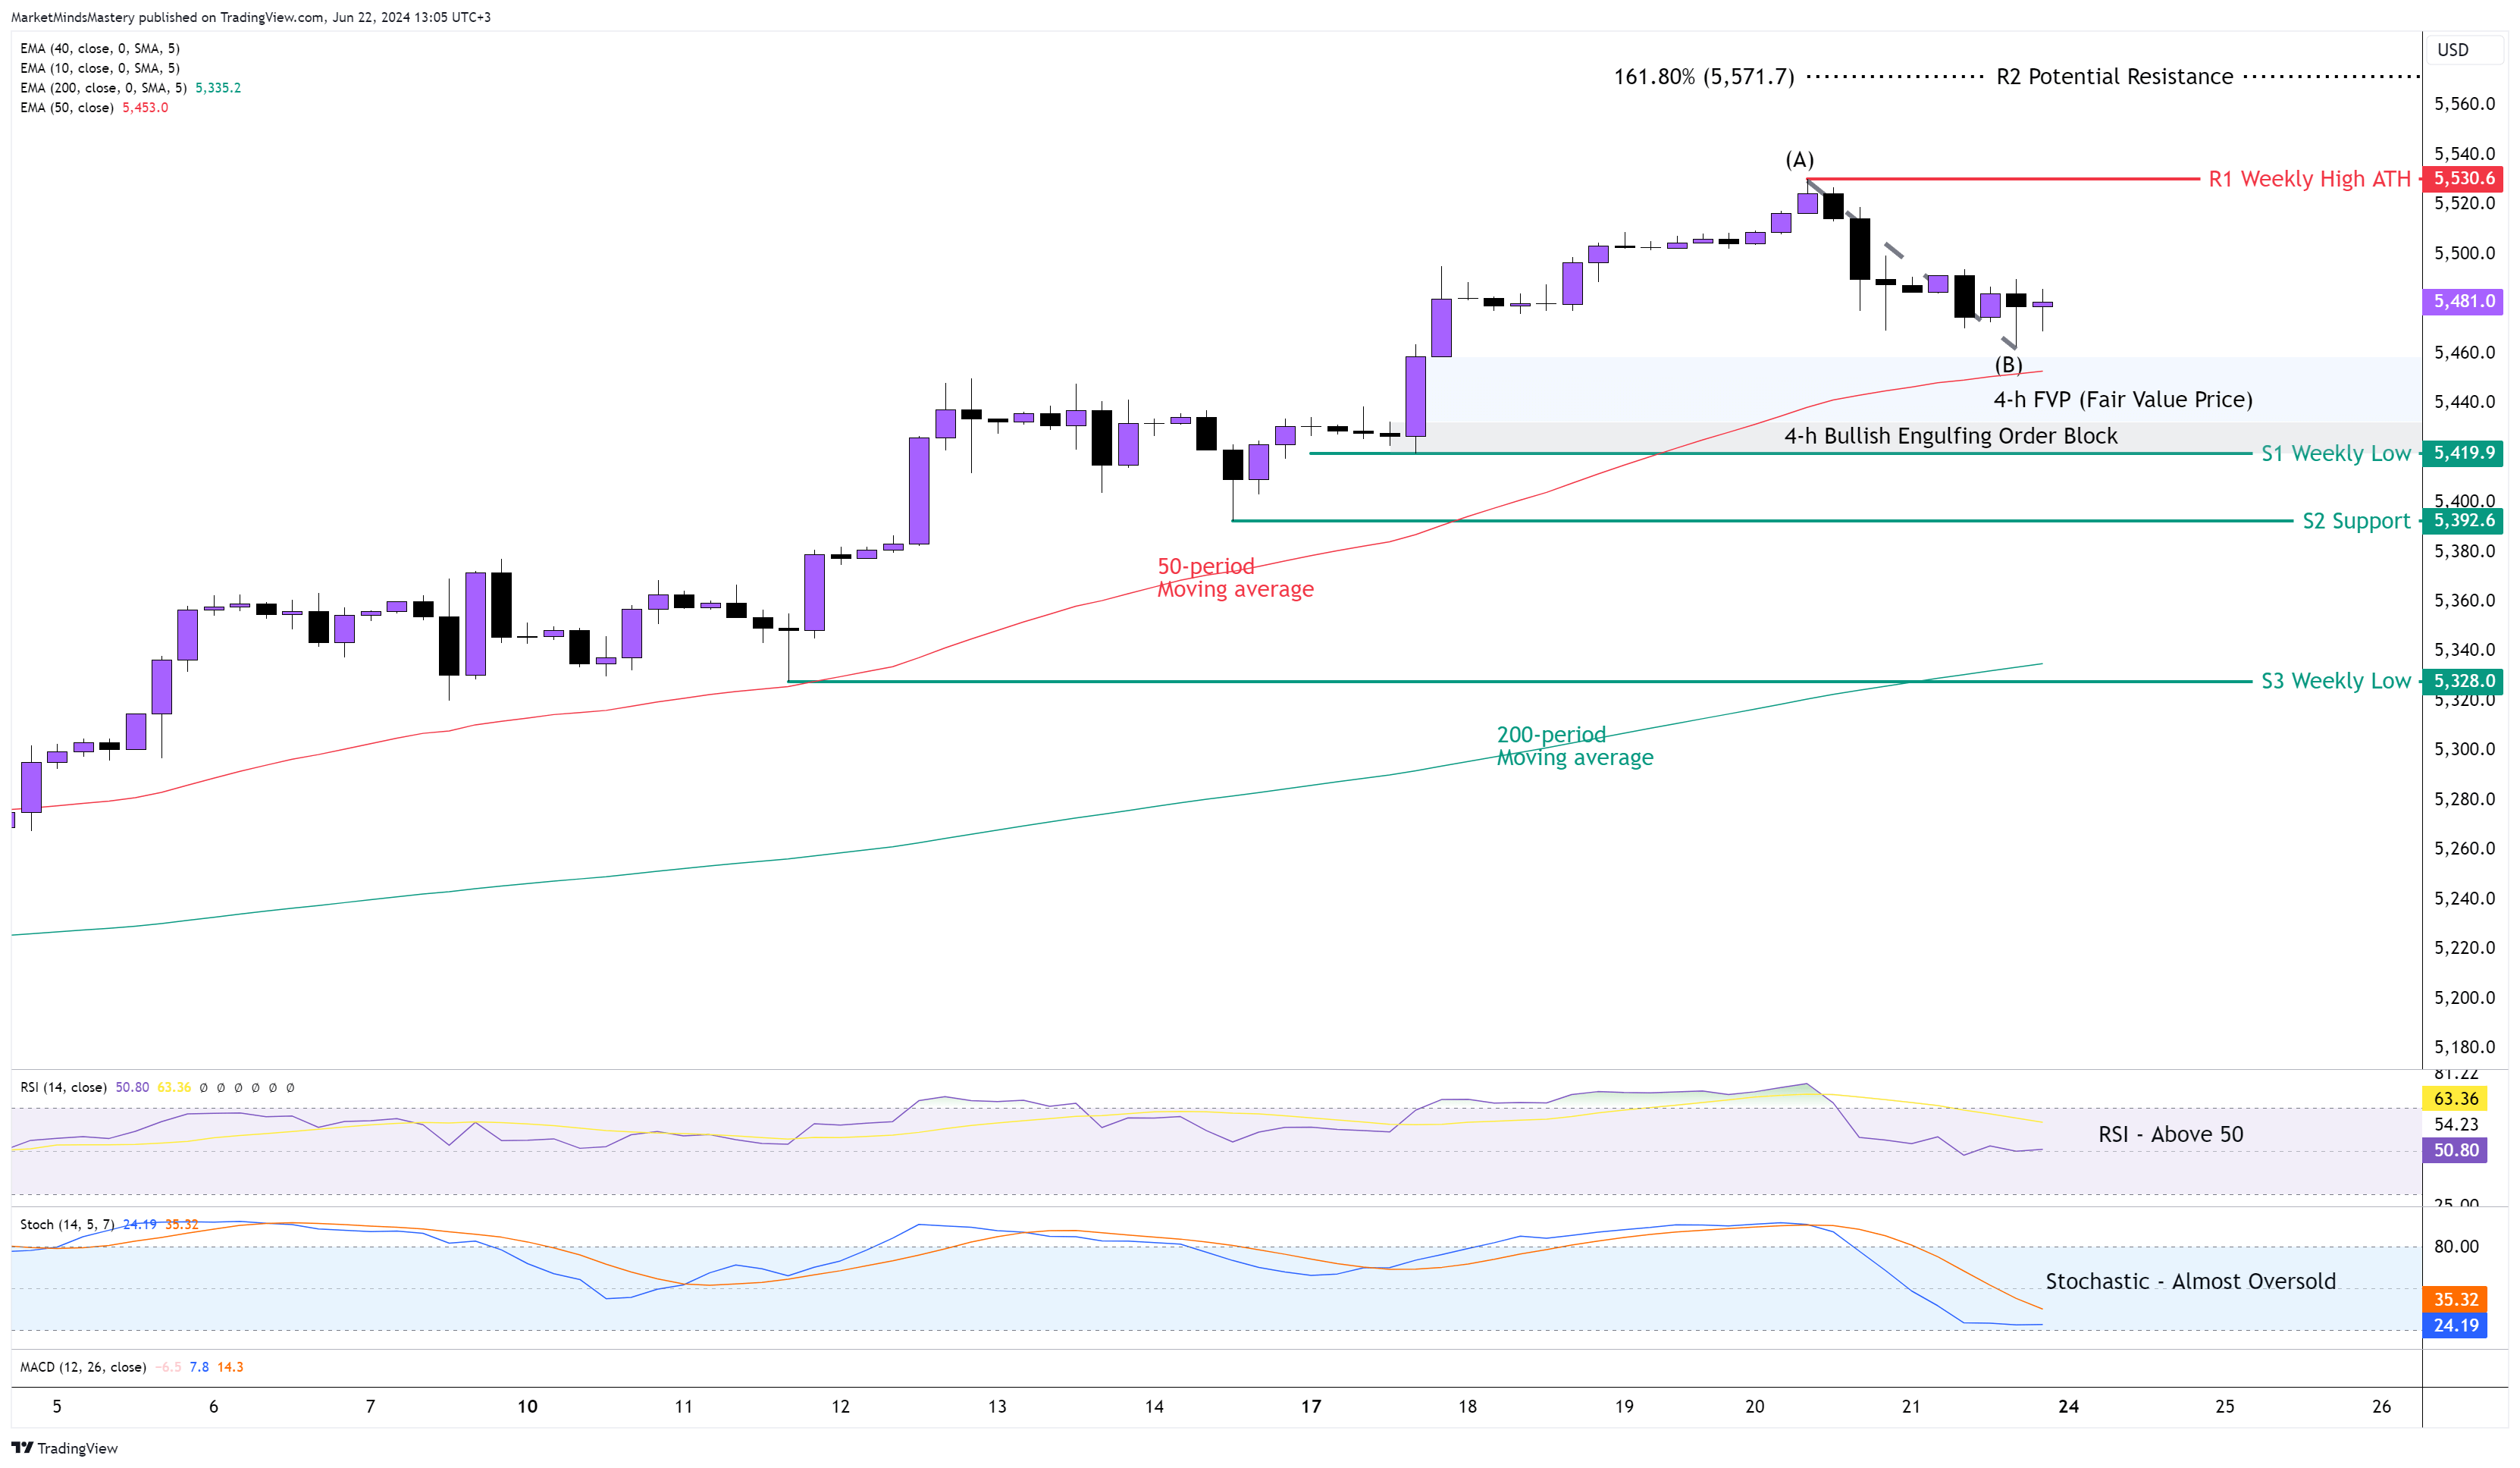
With a new ATH (All-Time High) last Wednesday, the price on the SP500 reached the 200% Fibonacci Extension we pointed out in the previous week’s market outlook as the final price target if the price kept its upward move.
The 4-hour chart keeps a strong upward move, with the uptrend being defined by the series of higher highs and higher lows.
The 50-period is above the 200-period moving average, and this is bullish. The RSI Oscillator is around the 50 level, and this has bullish implications. The Stochastic Oscillator is almost oversold, which means that the price is in a corrective phase, but the uptrend is still valid.
Last Monday, once the price created a bullish breakout, it left behind an FVP (Fair Value Price) area. Starting Monday, if the price finds support and moves upward, the first resistance area, R1, will be the previous week’s high, around $5530, which is also the ATH (All-time High). If the price penetrates the R1 and keeps increasing, the next resistance area, R2, is forecasted to be the 161.8% Fibonacci Extension number, which is around $5571.
On the other hand, if the price keeps moving downwards, it will enter into the FVP area, and it will interact with the 50-period moving average, which can experience significant buying pressure. In case it keeps dropping, the first static support S1 will be the previous week’s low, around $5419. If the price penetrates the S1 and moves further downwards, the next support area, S2, will be around $5392.
US 30 4H
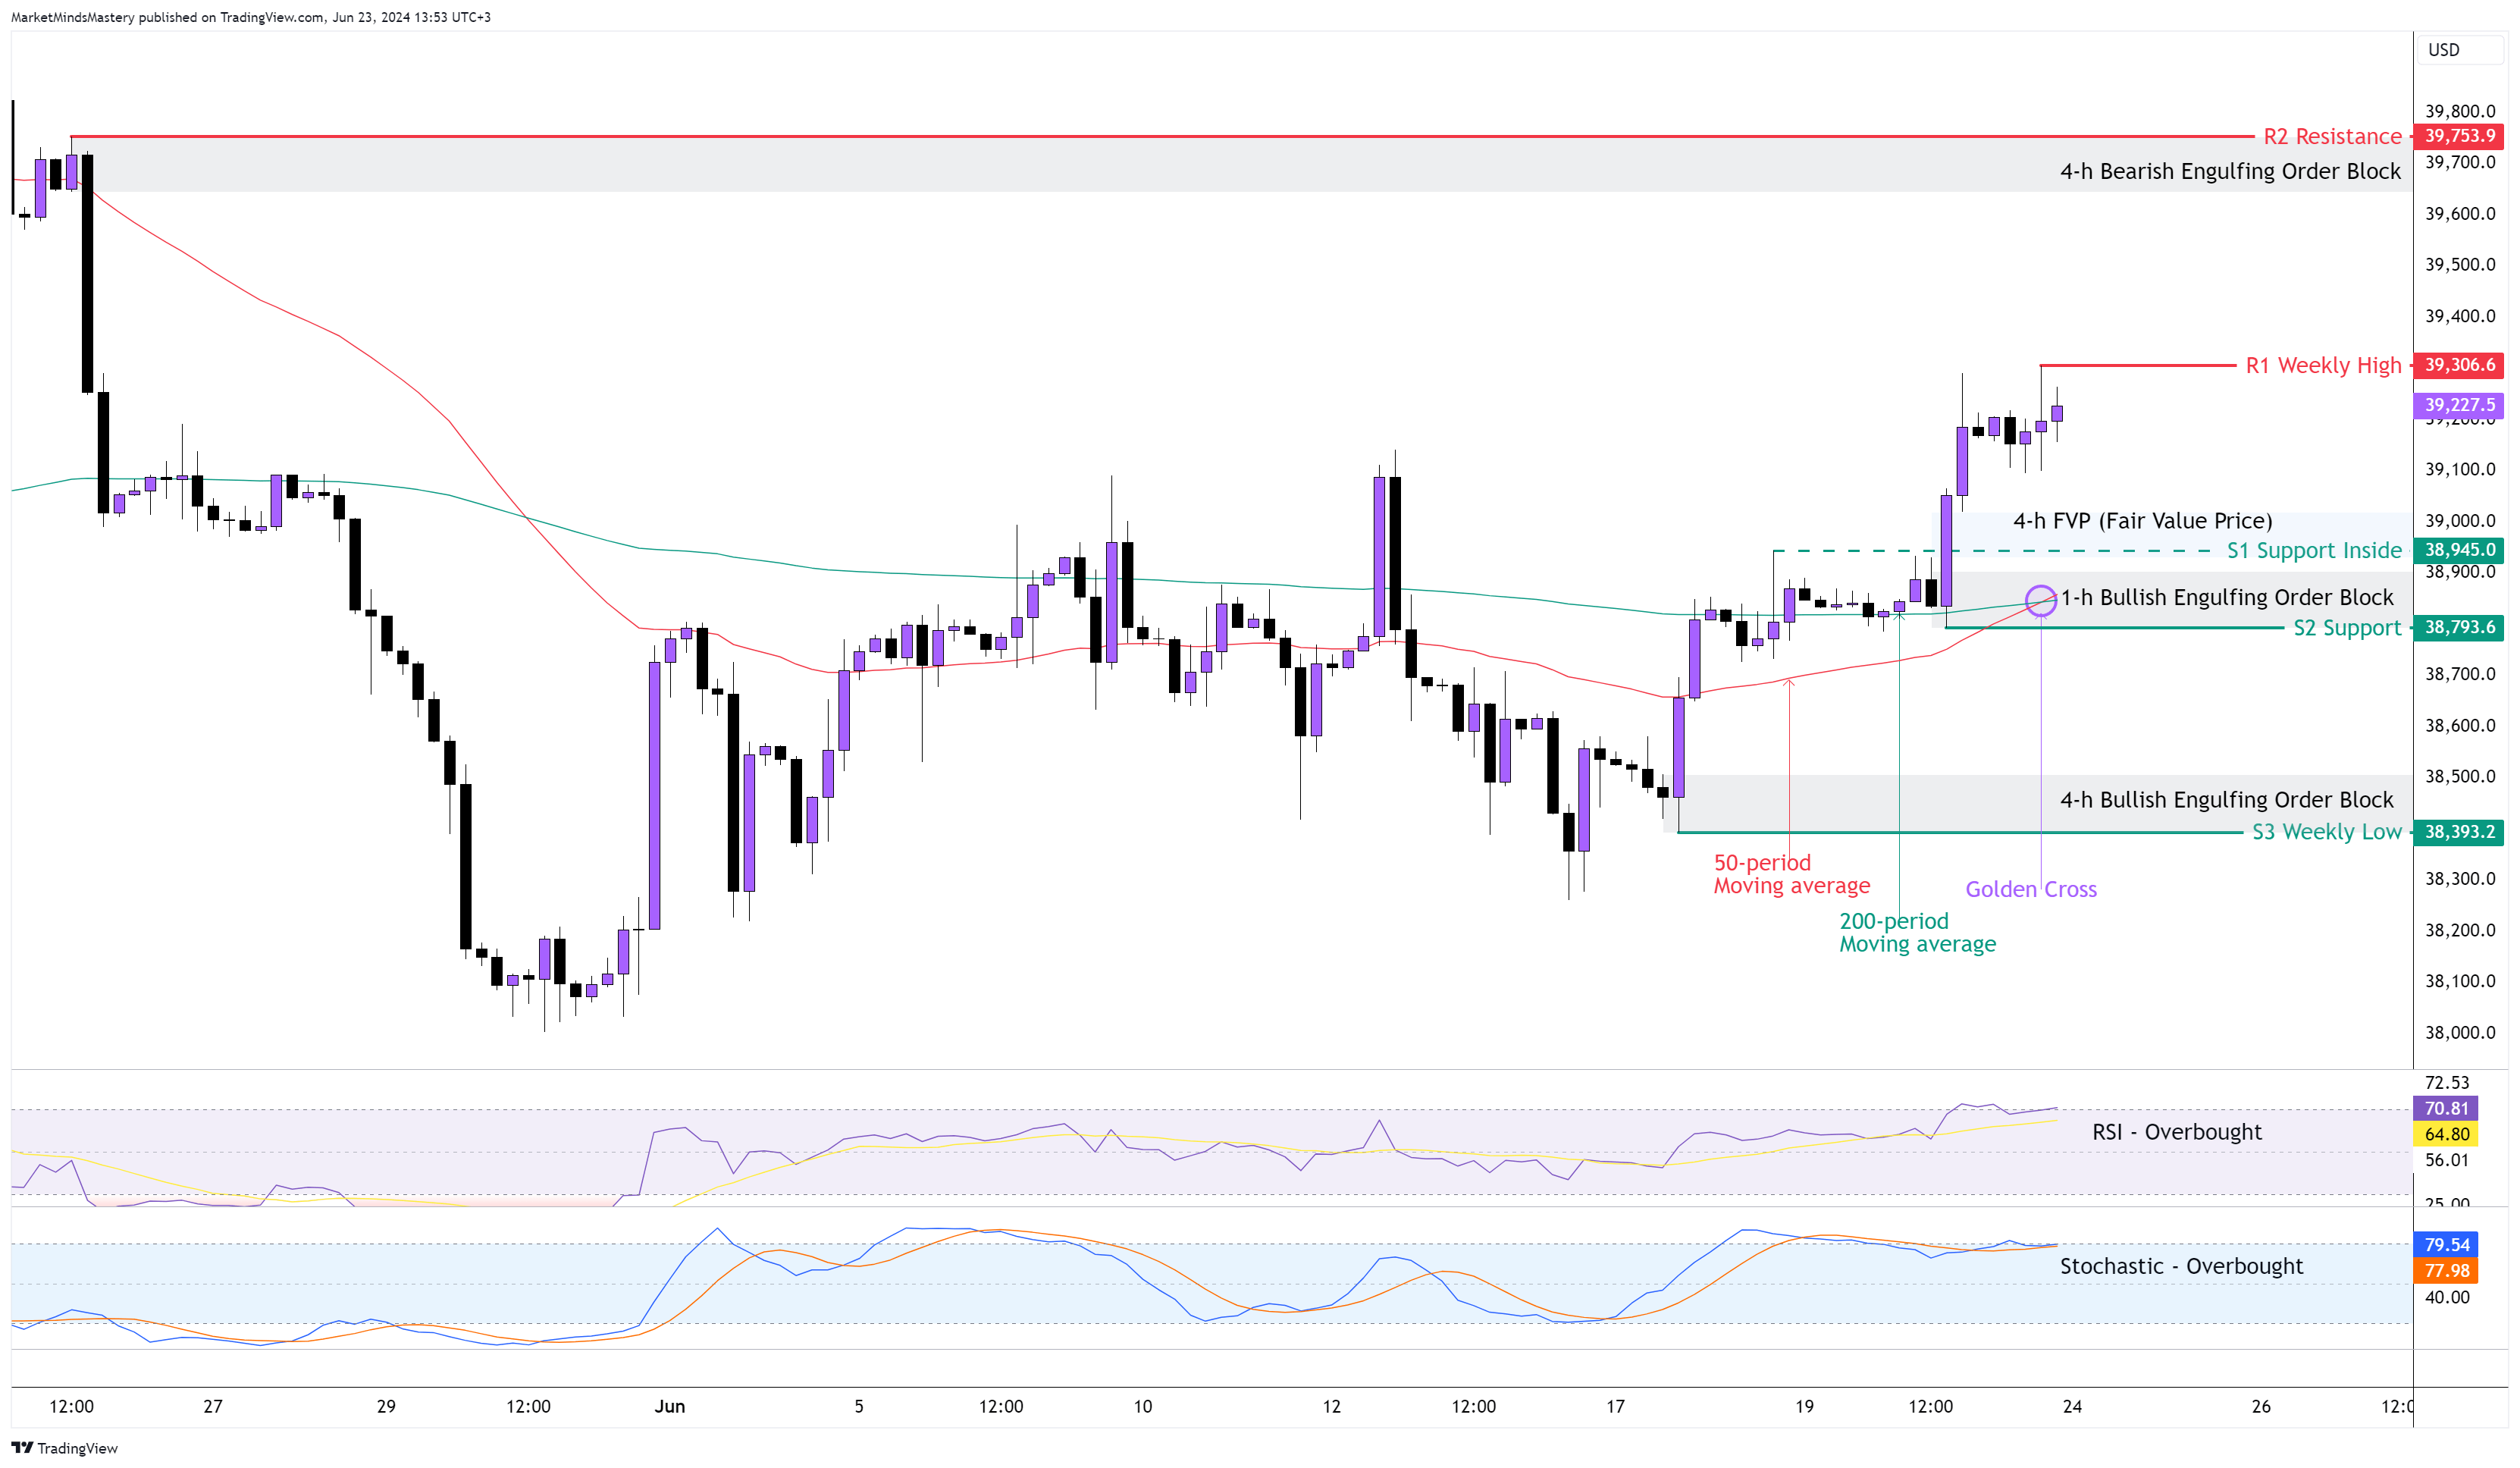
Following the previous week’s market outlook, the price on the US30 ended up being a bullish candle with a strong bullish close to the weekly chart. On the 4-hour chart, the price created a series of higher highs and higher lows, establishing an uptrend. During the last upward move, the price left an FVG ( Fair Value Price), as shown on the chart, and a few pips below it, a Bullish Engulfing Order Block, which was the cause of the upward move.
The 50-period crossed above the 200-period moving average, pointing to a Golden Crossover as marked on the chart.
The RSI is above its 70 line, and this has bullish implications. Similarly, the Stochastic Oscillator is in an overbought condition, which also indicates that the buying pressure overcomes the selling pressure in the US30.
If the price maintains the uptrend, it will continue to move upwards, and the first resistance area, R1, will be the previous week’s high, around 39306. If the price penetrates the R1 and moves higher, the next resistance is quite far away, around 39753. At this level, there is a Bearish Engulfing Order Block, which can attract intense trading activity.
Oppositely, if the price is rejected and moves downwards, the first support area, S1, will be an inside support of approximately 38945. A further downward move will find the next support, S2, around 38793 and the S3 support, around 38393.
As the price at this moment didn't create a swing high to consider it as the beginning of the retracement, we can not use the Fibonacci tool to make the Goilden ratio of 61.8%.
GER 30, 4H
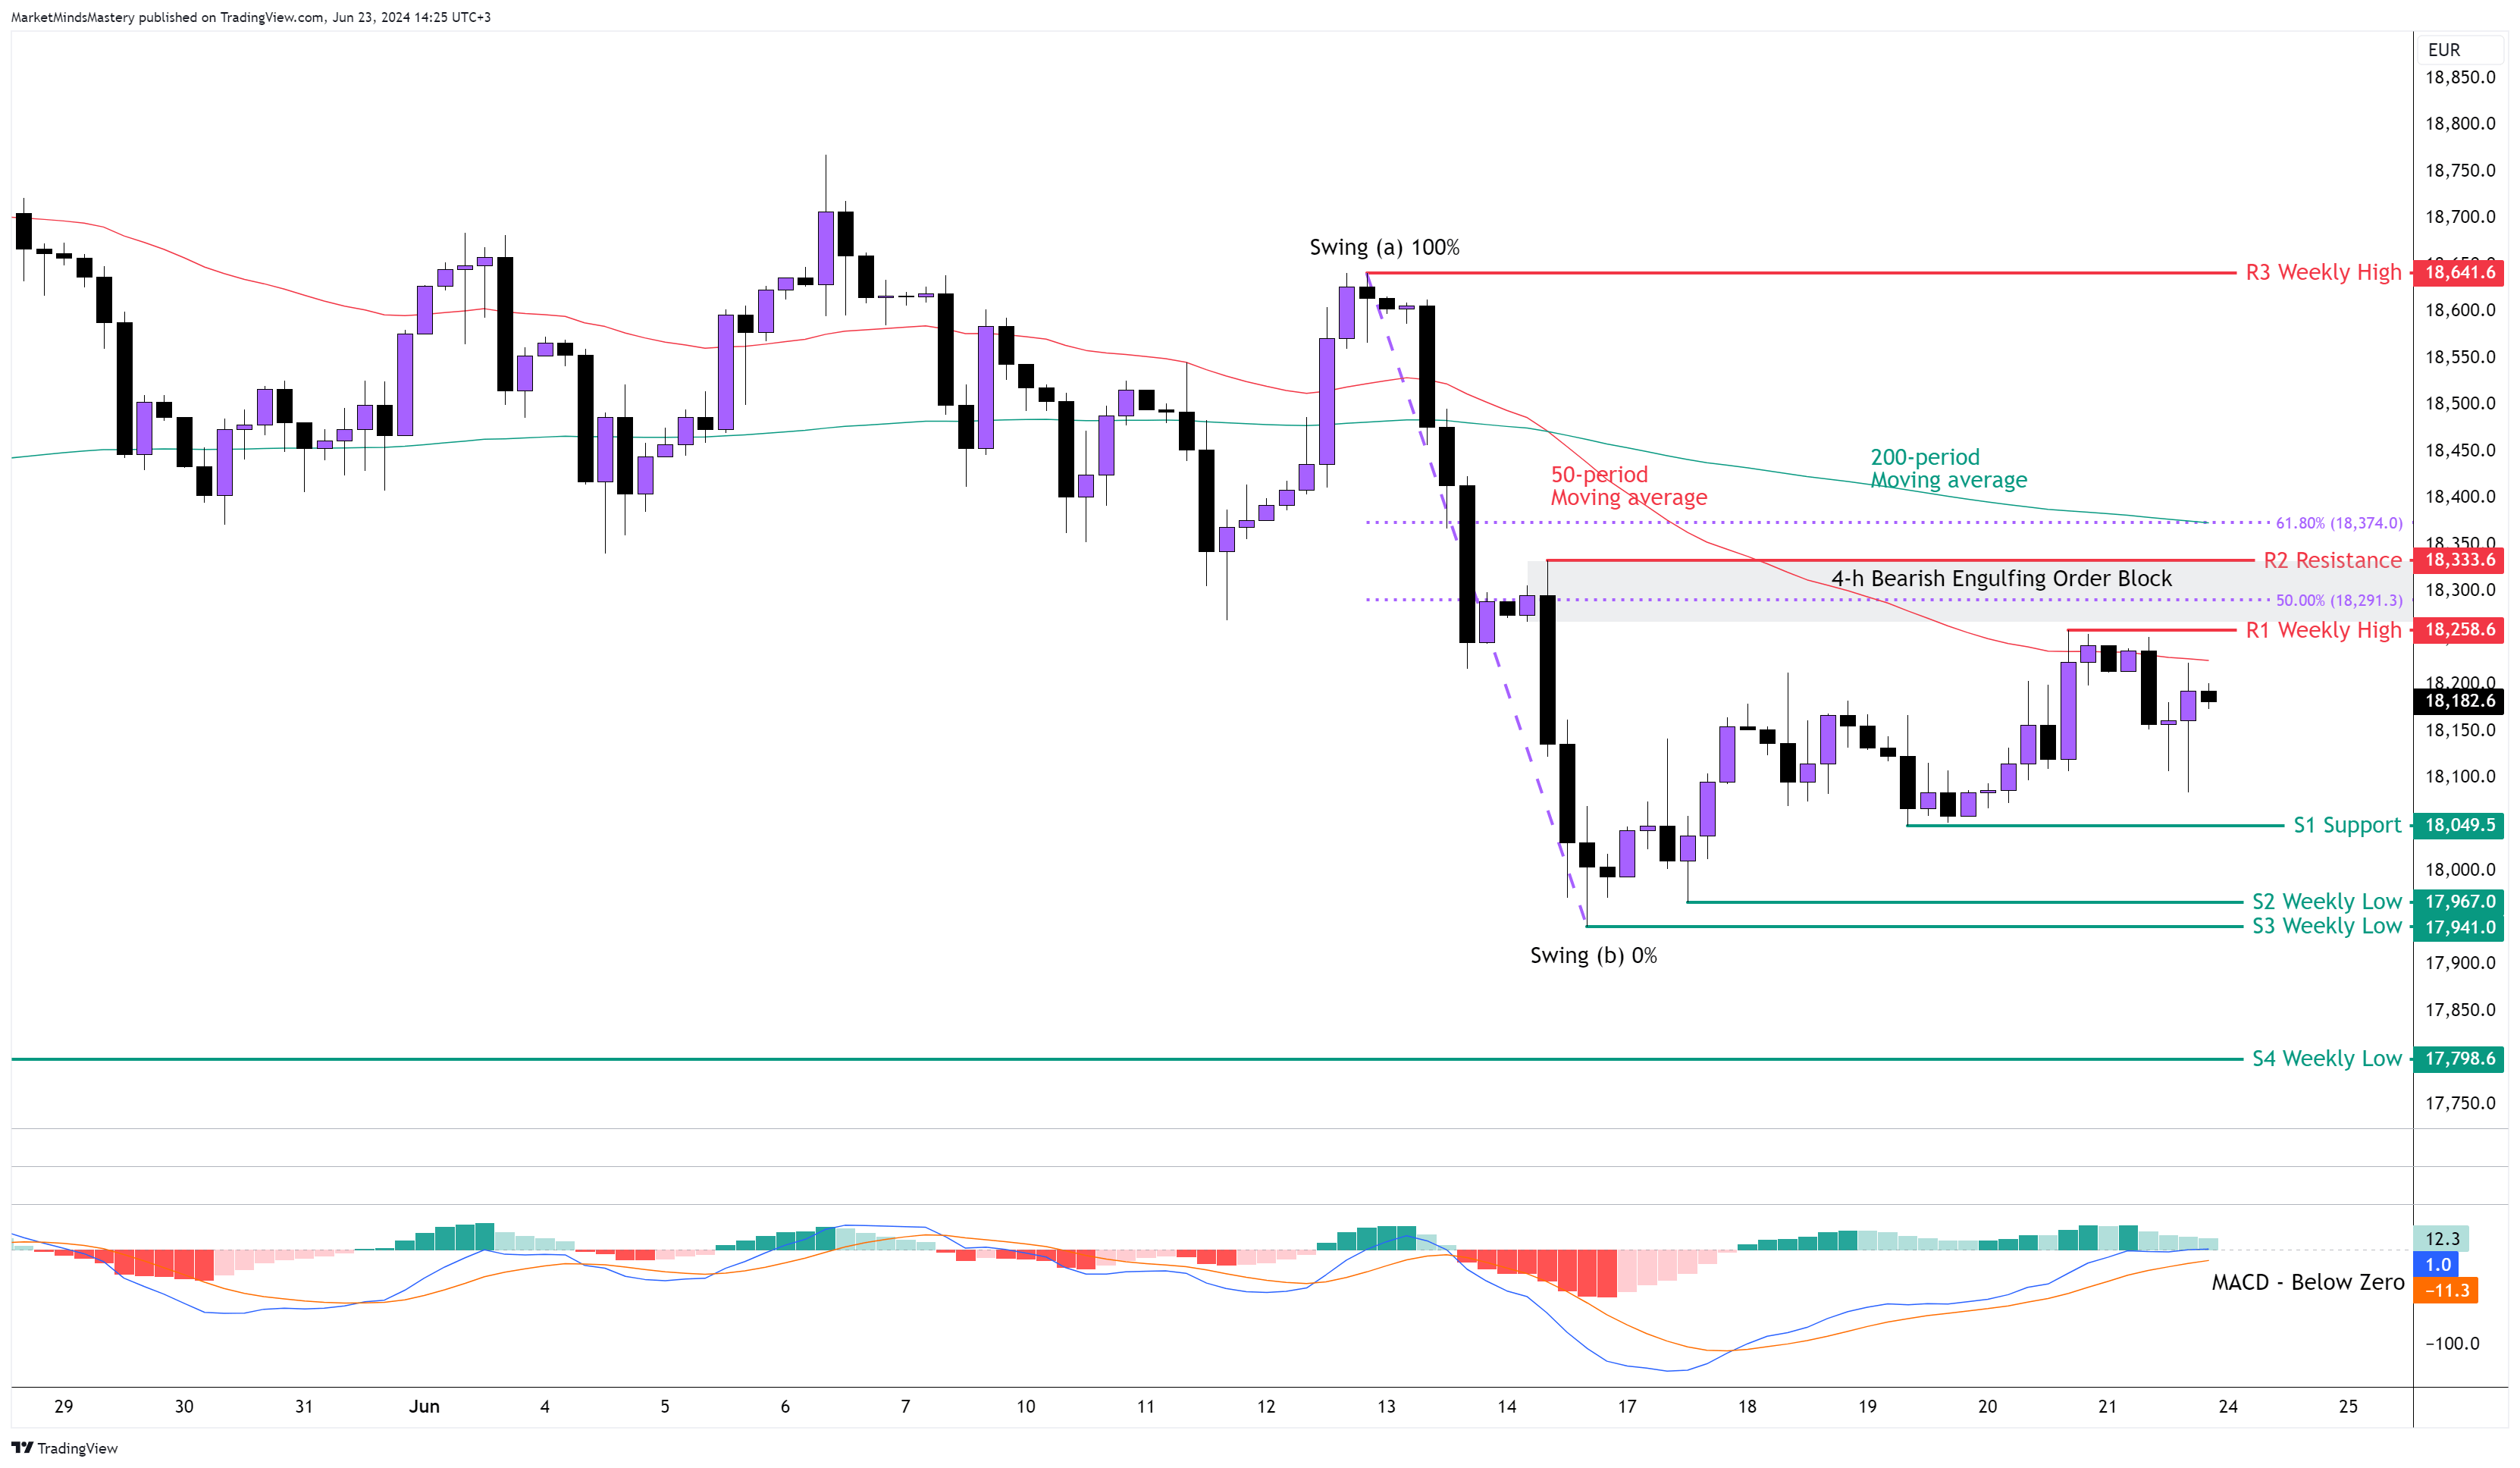
Following the previous week’s downtrend, the GER30 entered into a corrective phase, interacted with the 50-period moving average and declined last Friday. Hence, the weekly chart formed an inside candle. As per the swing analysis, the downtrend is still valid, as the market didn't violate the relevant swing highs and lows.
The 50-period is still trading below the 200-period moving average, and this is bearish. The MACD is still below the zero line, which means that the market is in a downtrend. The MACD’s Histogram is above zero, which indicates that the price right now is moving upwards, as this is expected due to the price correction.
Starting Monday, if the price keeps trading downwards, the first support area, S1, will be around 18049. In case the price penetrates the S1 and declines further, the next support areas, S2 and S3, are both weekly lows around 17967 and 17941, respectively. A further downward move finds the S4 support, around 17798, which is another weekly low. Oppositely, if the price finds support and moves upwards, the first resistance area R1 will be the previous week’s high, around 18258. If the price penetrates the R1 and moves higher, in order to move to the next resistance, R2, it has to penetrate the 50% Fibonacci level and the Bearish Engulfing Order Block. If the price successfully goes through these, the R2 resistance is around 18333.