The USD was the strongest currency last week, and this is because of the final report of the NFP (Non-Farm Payrolls). The actual number reported was 272 thousand compared to the consensus, which forecasted only 185 thousand. This essentially means that 272 thousand new payrolls were added to the US economy. For the first time, after more than 12 months, the ECB (European Central Bank) dropped the interest rates to 4.25%, and the BOC (Bank of Canada) also lowered their interest rates to 4.75%.
On Monday, the trading activity will continue from early morning. In Japan, they will report the GDP (Gross Domestic Product), and the forecast shows the same number of 0.5%. This is the same as it was during the previous quarter. Generally, the GDP is usually reported every quarter, and it measures the all value of all goods and services they produced in the country in the last three months.
On Tuesday, the main focus will be on the UK as the unemployment rate will be reported. As per the forecast, it is expected to remain at 4.3%. That can be negative for Sterling because the claimant count change, which measures the jobless benefits claims, is forecast to increase by almost 2K. Ultimately, it depends on whether the GBP will follow through.
On Wednesday, the major news will start with the Consumer Price Index report in China, which is forecasted to remain unchanged at 0.3%. Usually, we don’t trade the Chinese Yaun currency. The volatility is expected to pick up early before the London trading session starts. They will report the Harmonise Consumer Price Index in Germany, which is expected to remain the same at 2.8%. Also, the Consumer Price Index is estimated to stay the same in the US at 3.4%. So far, as the forecasts have given an unchanged CPI in these major economies, we have to wait for the outcome in case it deviates from the forecast. If the currency follows through, we will have a clear bias of strength or weakness in one currency.
At the same time, in the US, the CPI exclusive Food and Energy will be reported, and this time, it is estimated to drop to 3.5% from the current 3.6%.
Despite all the CPI events today, the market participants will remain focused and alert on the next event, which will be the Fed's announcement of interest rates. The forecast shows that the FEDs will keep the same interest rates at 5.5%. This can be the key event for the day because the ECB and the BOC reduced their interest rates by 0.25% last week. If the FED keeps its rates the same today, there is a high probability of seeing a strong downtrend in the EURUSD and an uptrend in the USDCAD.
Thirty minutes later, the FOMC Press Conference will follow. The last event for the day will be the Bank of Canada’s Governor Macklem's speech.
Moving into Thursday’s events, the primary focus will be on Australia as, for the first time in a whole, the unemployment rate is expected to be reported lower than in other months. Currently, it is 4.1%, and the consensus forecast a drop to 4%. If the reported number confirms the forest and the Australian dollar follows through, we can expect strength in the Aussie. If the USD also gains strength, maybe the AUDUSD won't be the favourite currency pair for trading, but traders will look to cross pairs to identify a weak currency and trade it against the AUD.
This lays down the currency's correlation in terms of strength and weakness. The last significant event for the day will be the Producer Price Index exclusive Food and Energy in the US. As per the forecast, we expect to read a number of 2.3%, which is lower than the previous one, which was 2.4%.
The last trading day of this week will host another significant event, and this time, it will be the Interest Rates in Japan. The Bank of Japan is expected to keep the Interest Rates unchanged at 0.05%. As we experienced two months ago, the first increase in the interest rates in Japan after 17 years, it will be interesting to see if they will keep at least a positive rate this time. It has been a while since the Japanese Yen’s weak against all the other major currencies across the board, and as you will see on the USDJPY and GBPJPY chart analysis, the primary trends are uptrends. If the Bank of Japan increases their rates and the Japanese Yen follows through, we can see retracements on these currency pairs.
EUR USD 4H

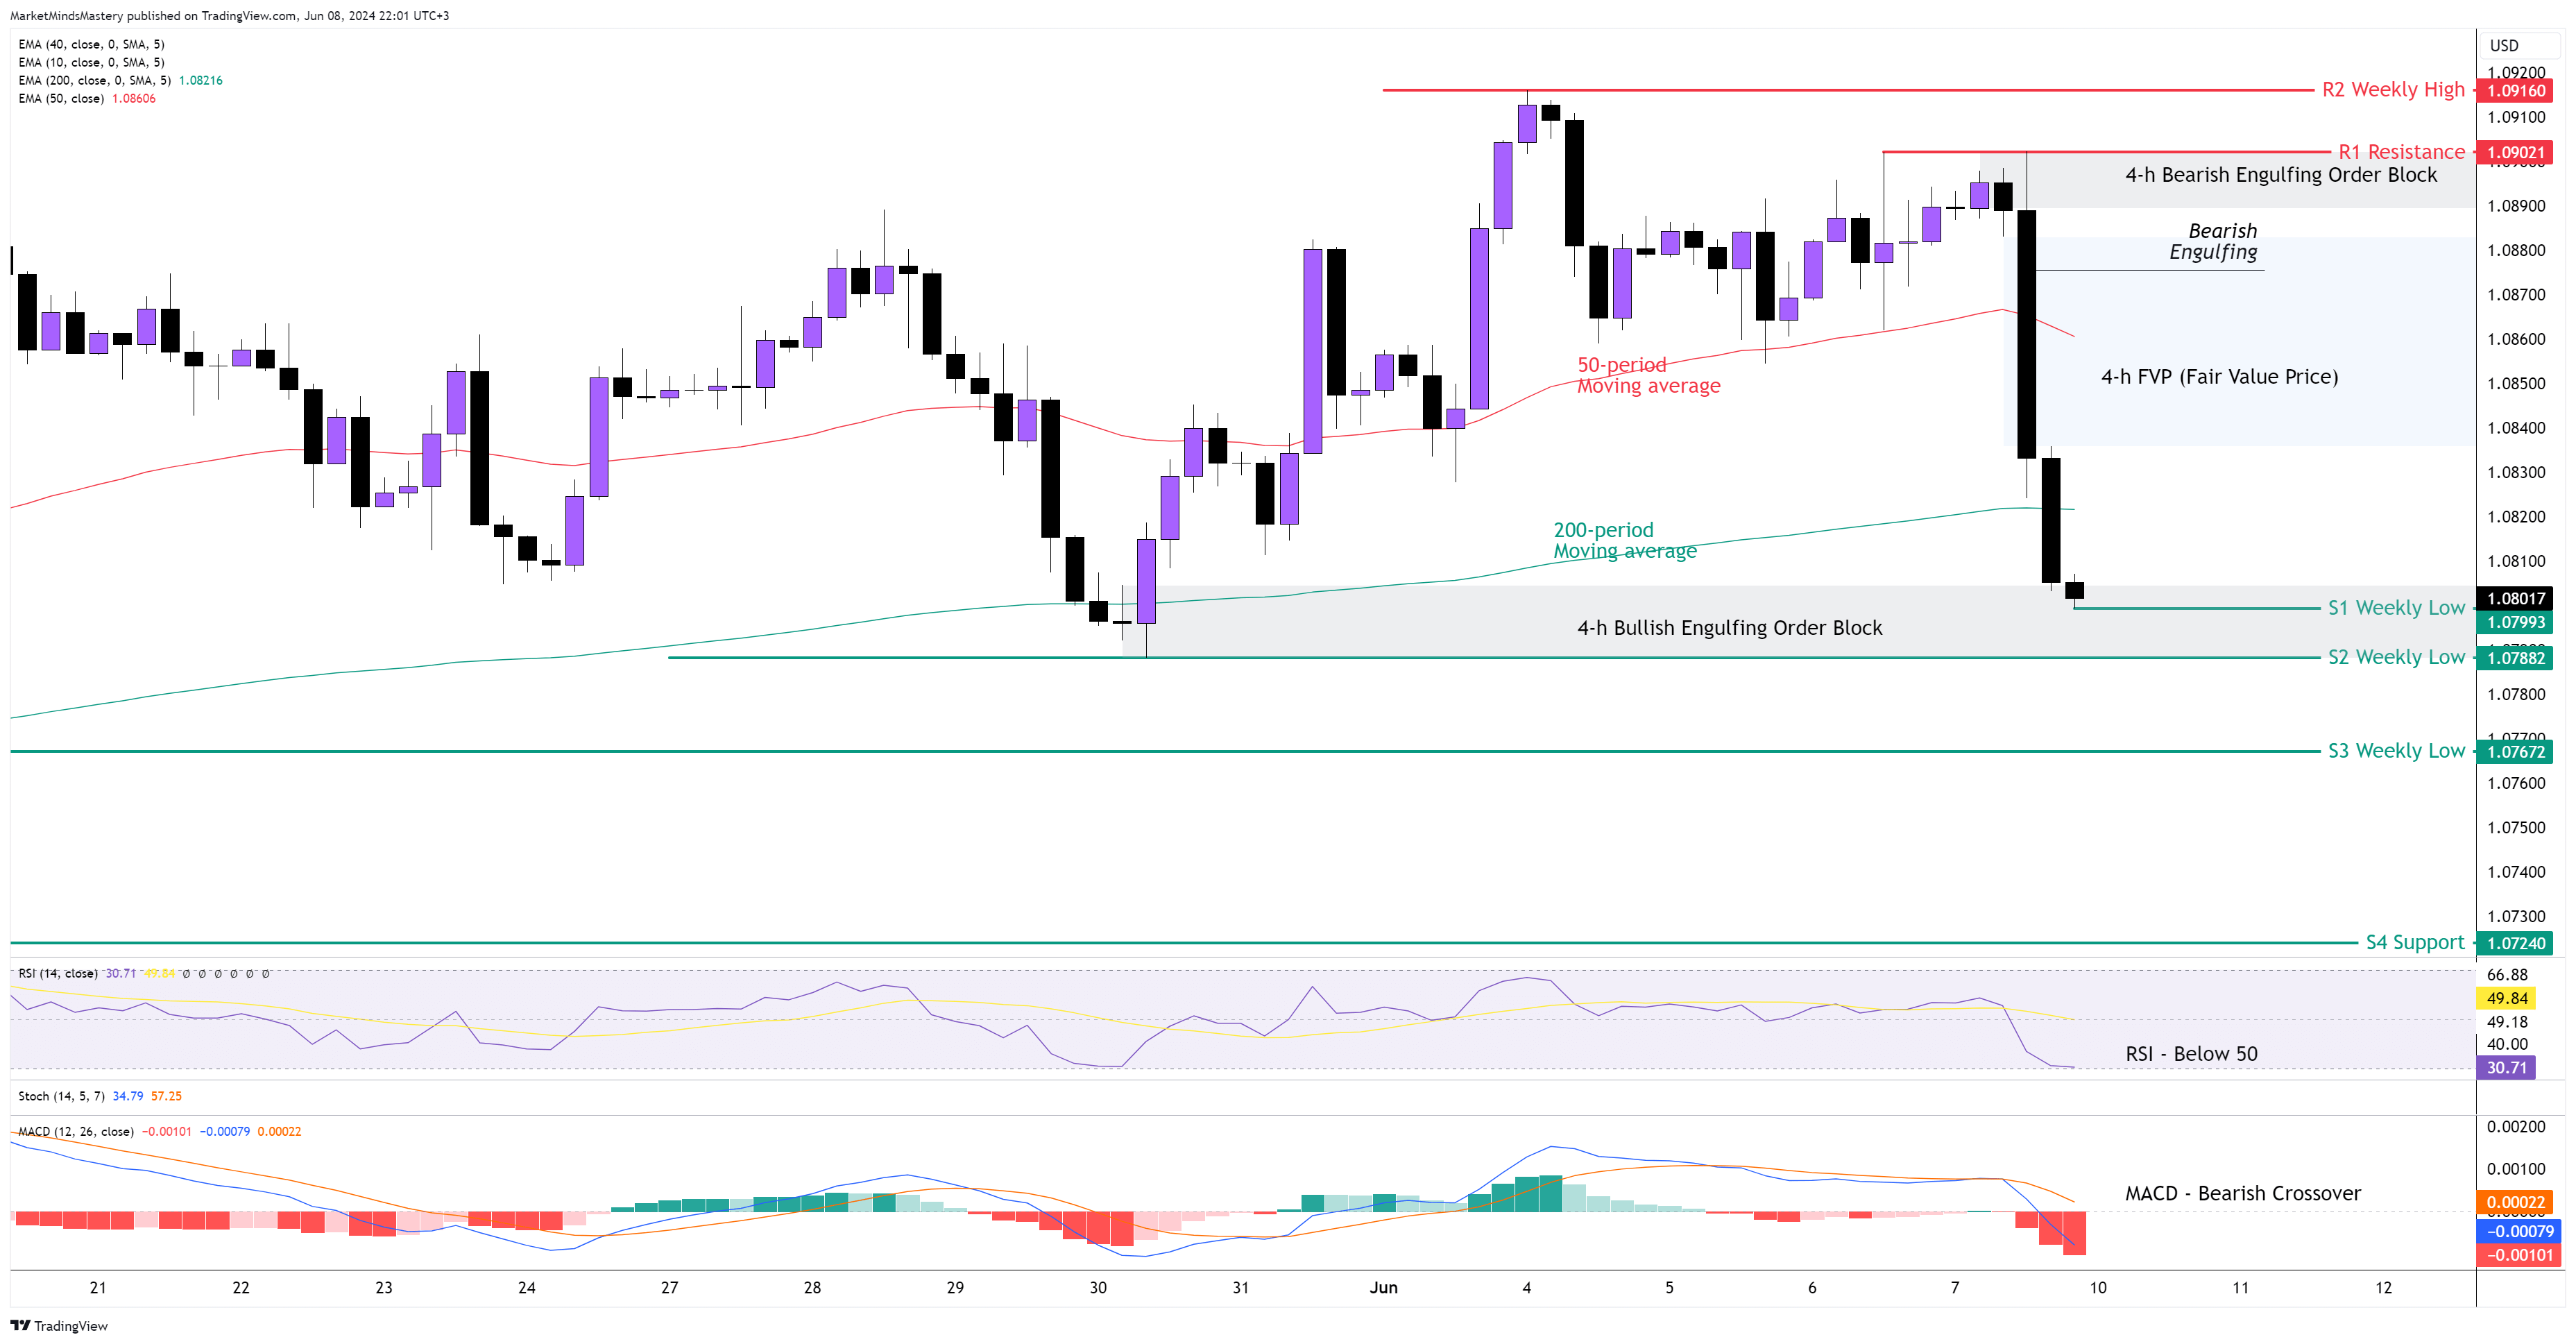
Following last Friday's NFP (Non-Farm Payrolls) report, The USD followed the positive outcome and gained so much strength that it caused the Euro to drop approximately 50 pips lower within the first minute. That set the tone for the rest of the trading day. This dynamic downward move led the price into the Bearish Engulfing Order Block, which was marked on the previous week’s market outlook and is still valid. The 4H chart is still in a range market structure. Currently, the price closes under the 200-period moving average, which has bearish implications. For the market to have a trending bias, the price must break below the S2 weekly support, as shown on the chart, or above the R1 weekly high. The RSI below 50 indicates a bearish market, while at the same time, the MACD created a bearish crossover above zero, which also has bearish implications.
Suppose the price keeps moving downwards and penetrates the S1 weekly low around 1.07993 and the S2 weekly low around 1.07882 without finding support within the Bullish Engulfing Order Block to bounce off, it means it will keep moving lower until the S3 support area, which is around 1.07672.
On the other hand, if the price finds support, bounces off, and moves upwards, the first resistance area, R1, will be 1.09021. In this case, the price will fill up the FVP area. A further move to the upside will find the next resistance area, R2, around 1.09160, which is the previous week’s high.
GBP USD 4H
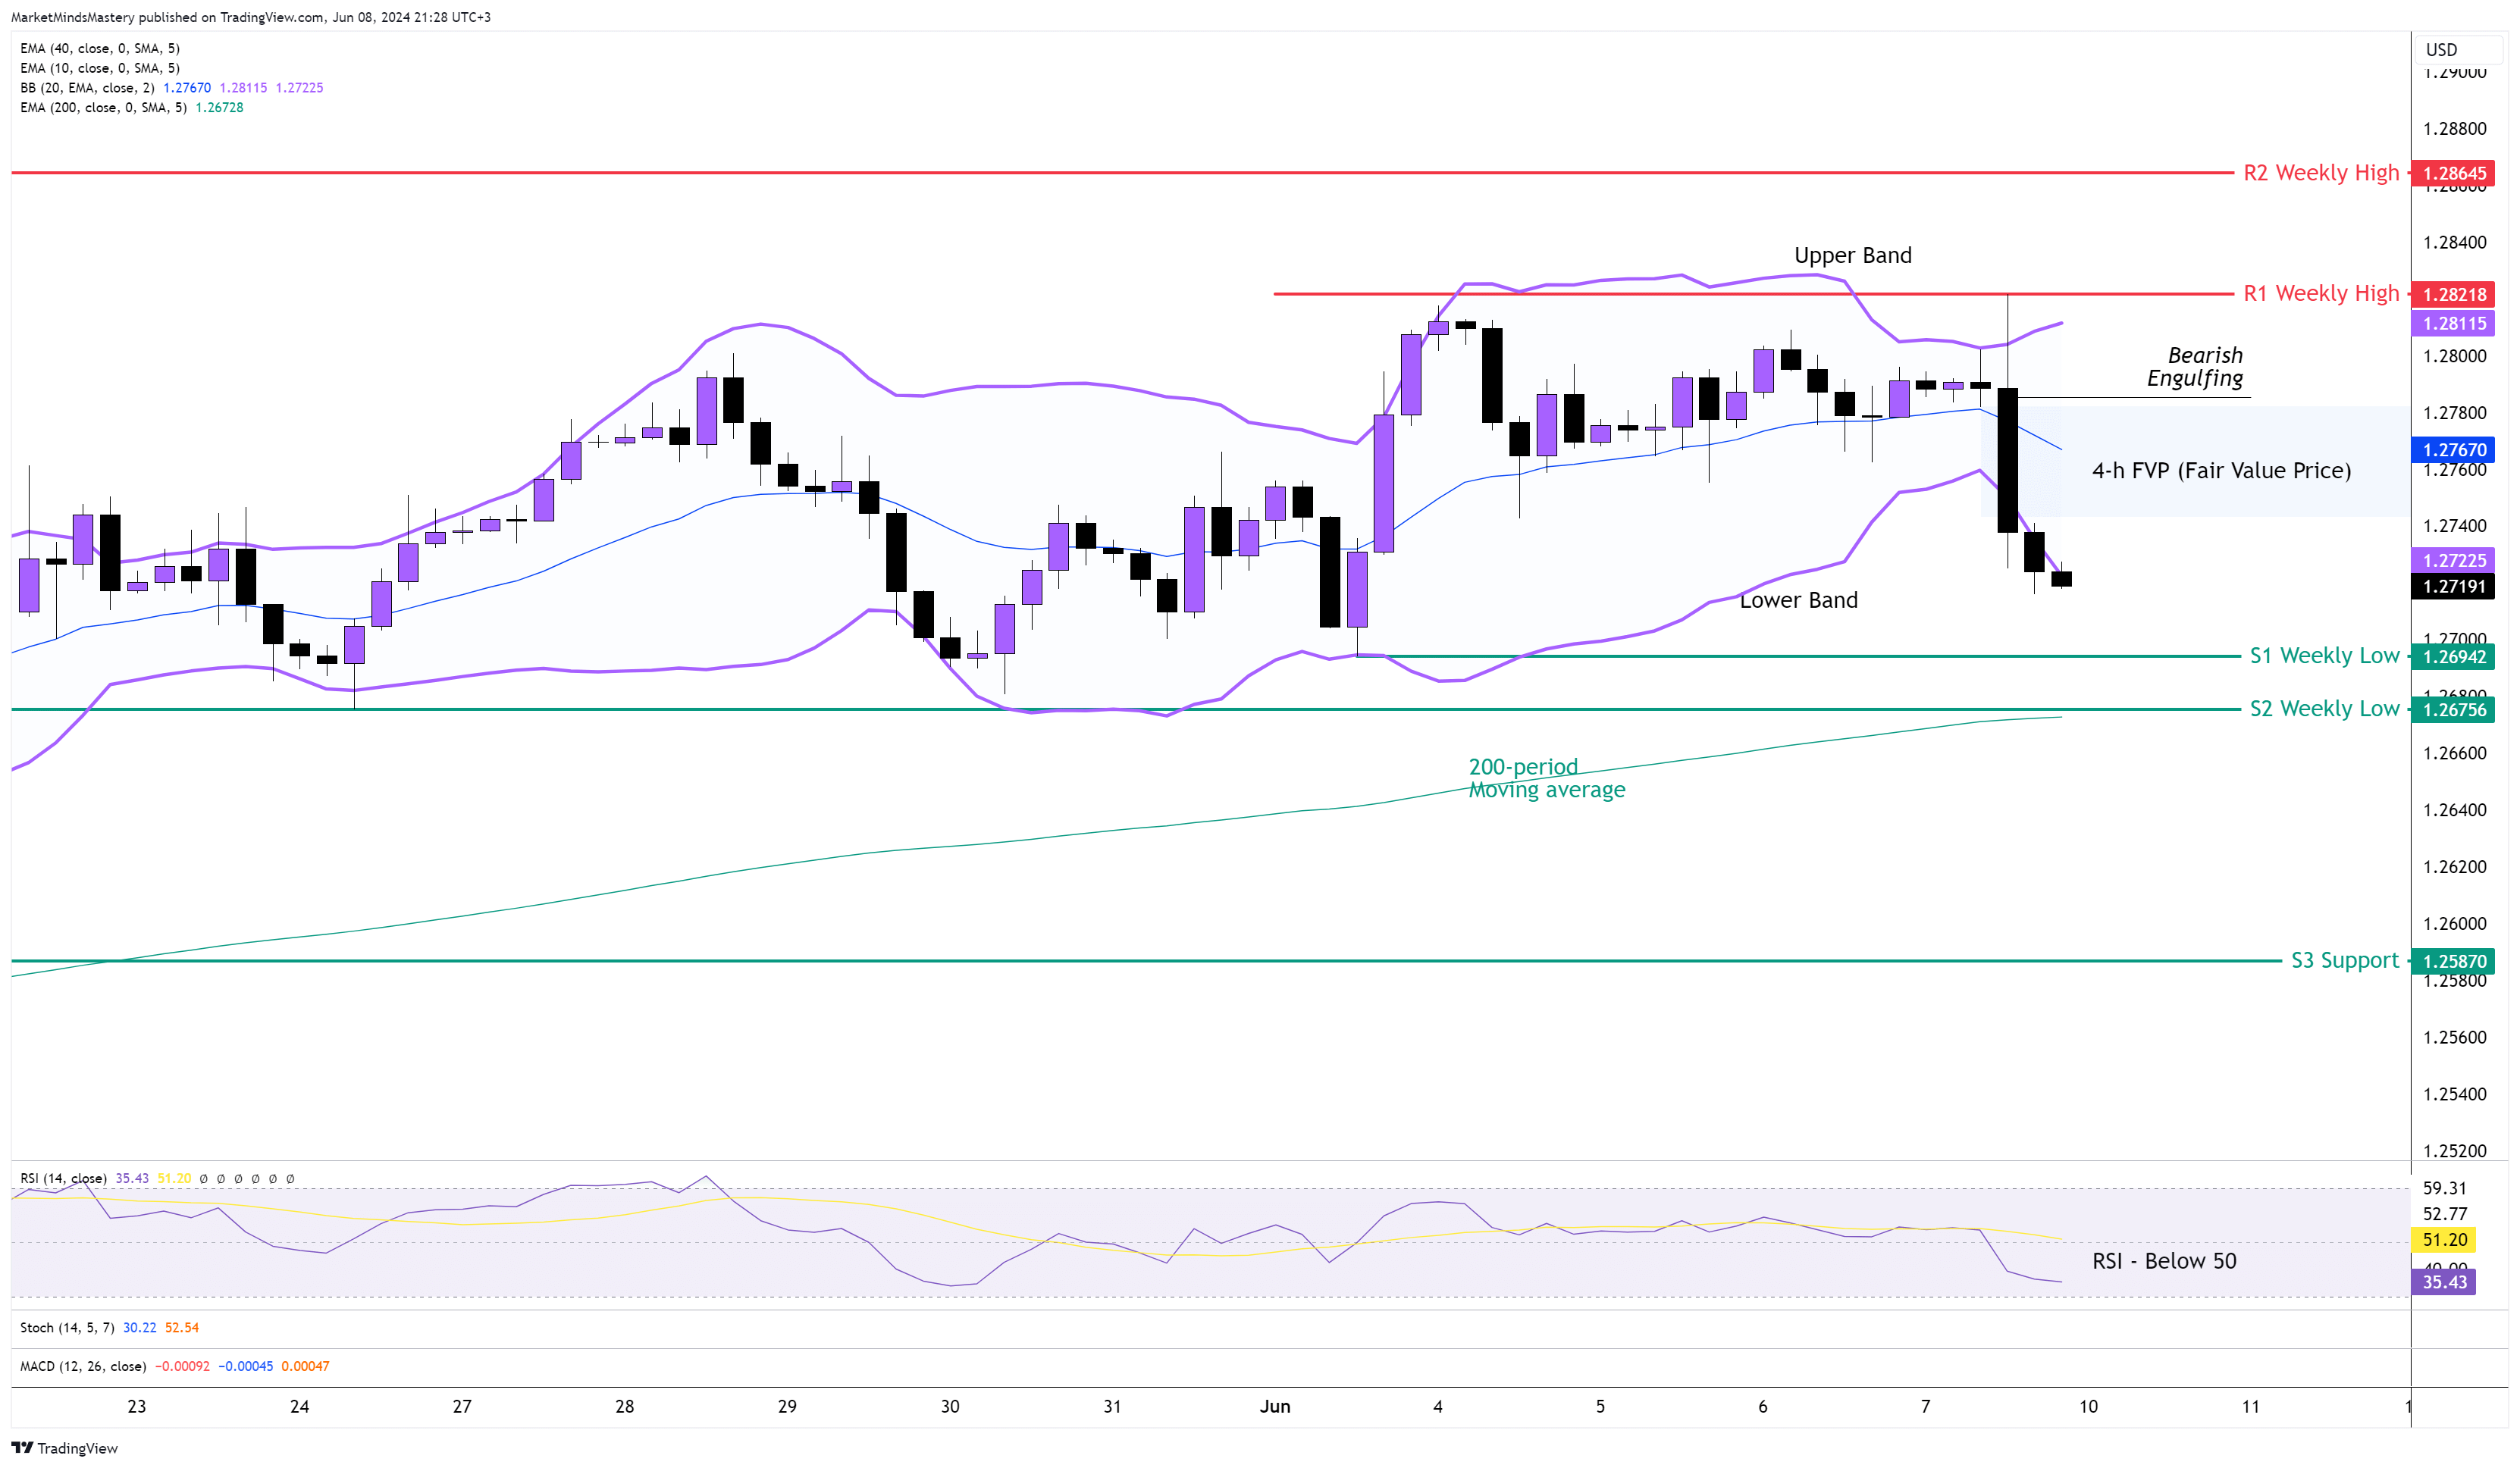
The USD became much stronger than the Sterling after the NFP last Friday. The price reached the weekly high per the previous market outlook analysis and declined, leaving behind an FVP (Fair Value Price) area.
The price trades sideways. Therefore, the Bollinger Bands can better describe the GBPUSD market.
Currently, the price “walks the lower band”, and the upper band points upwards. This is an indication of a strong downwards breakout. The RSI is below 50, which has bearish implications. As per the swing analysis on the 4H chart, the market is trendless.
If the price continues to move downwards, the first support area, S1, will be the previous week’s low of around 1.26942. If the price doesn’t bounce off the S1 and declines, the next support area S2 will be 1.26756, which is another weekly low. If the price moves further downwards, we will find the S3 support around 1.25870. Oppositely, if the price moves upwards, the first resistance area, R1, will be the previous week’s high of around 1.28218. If it penetrates the R1 and increases, the next resistance area, R2, will be 1.28645.
AUD USD 4H
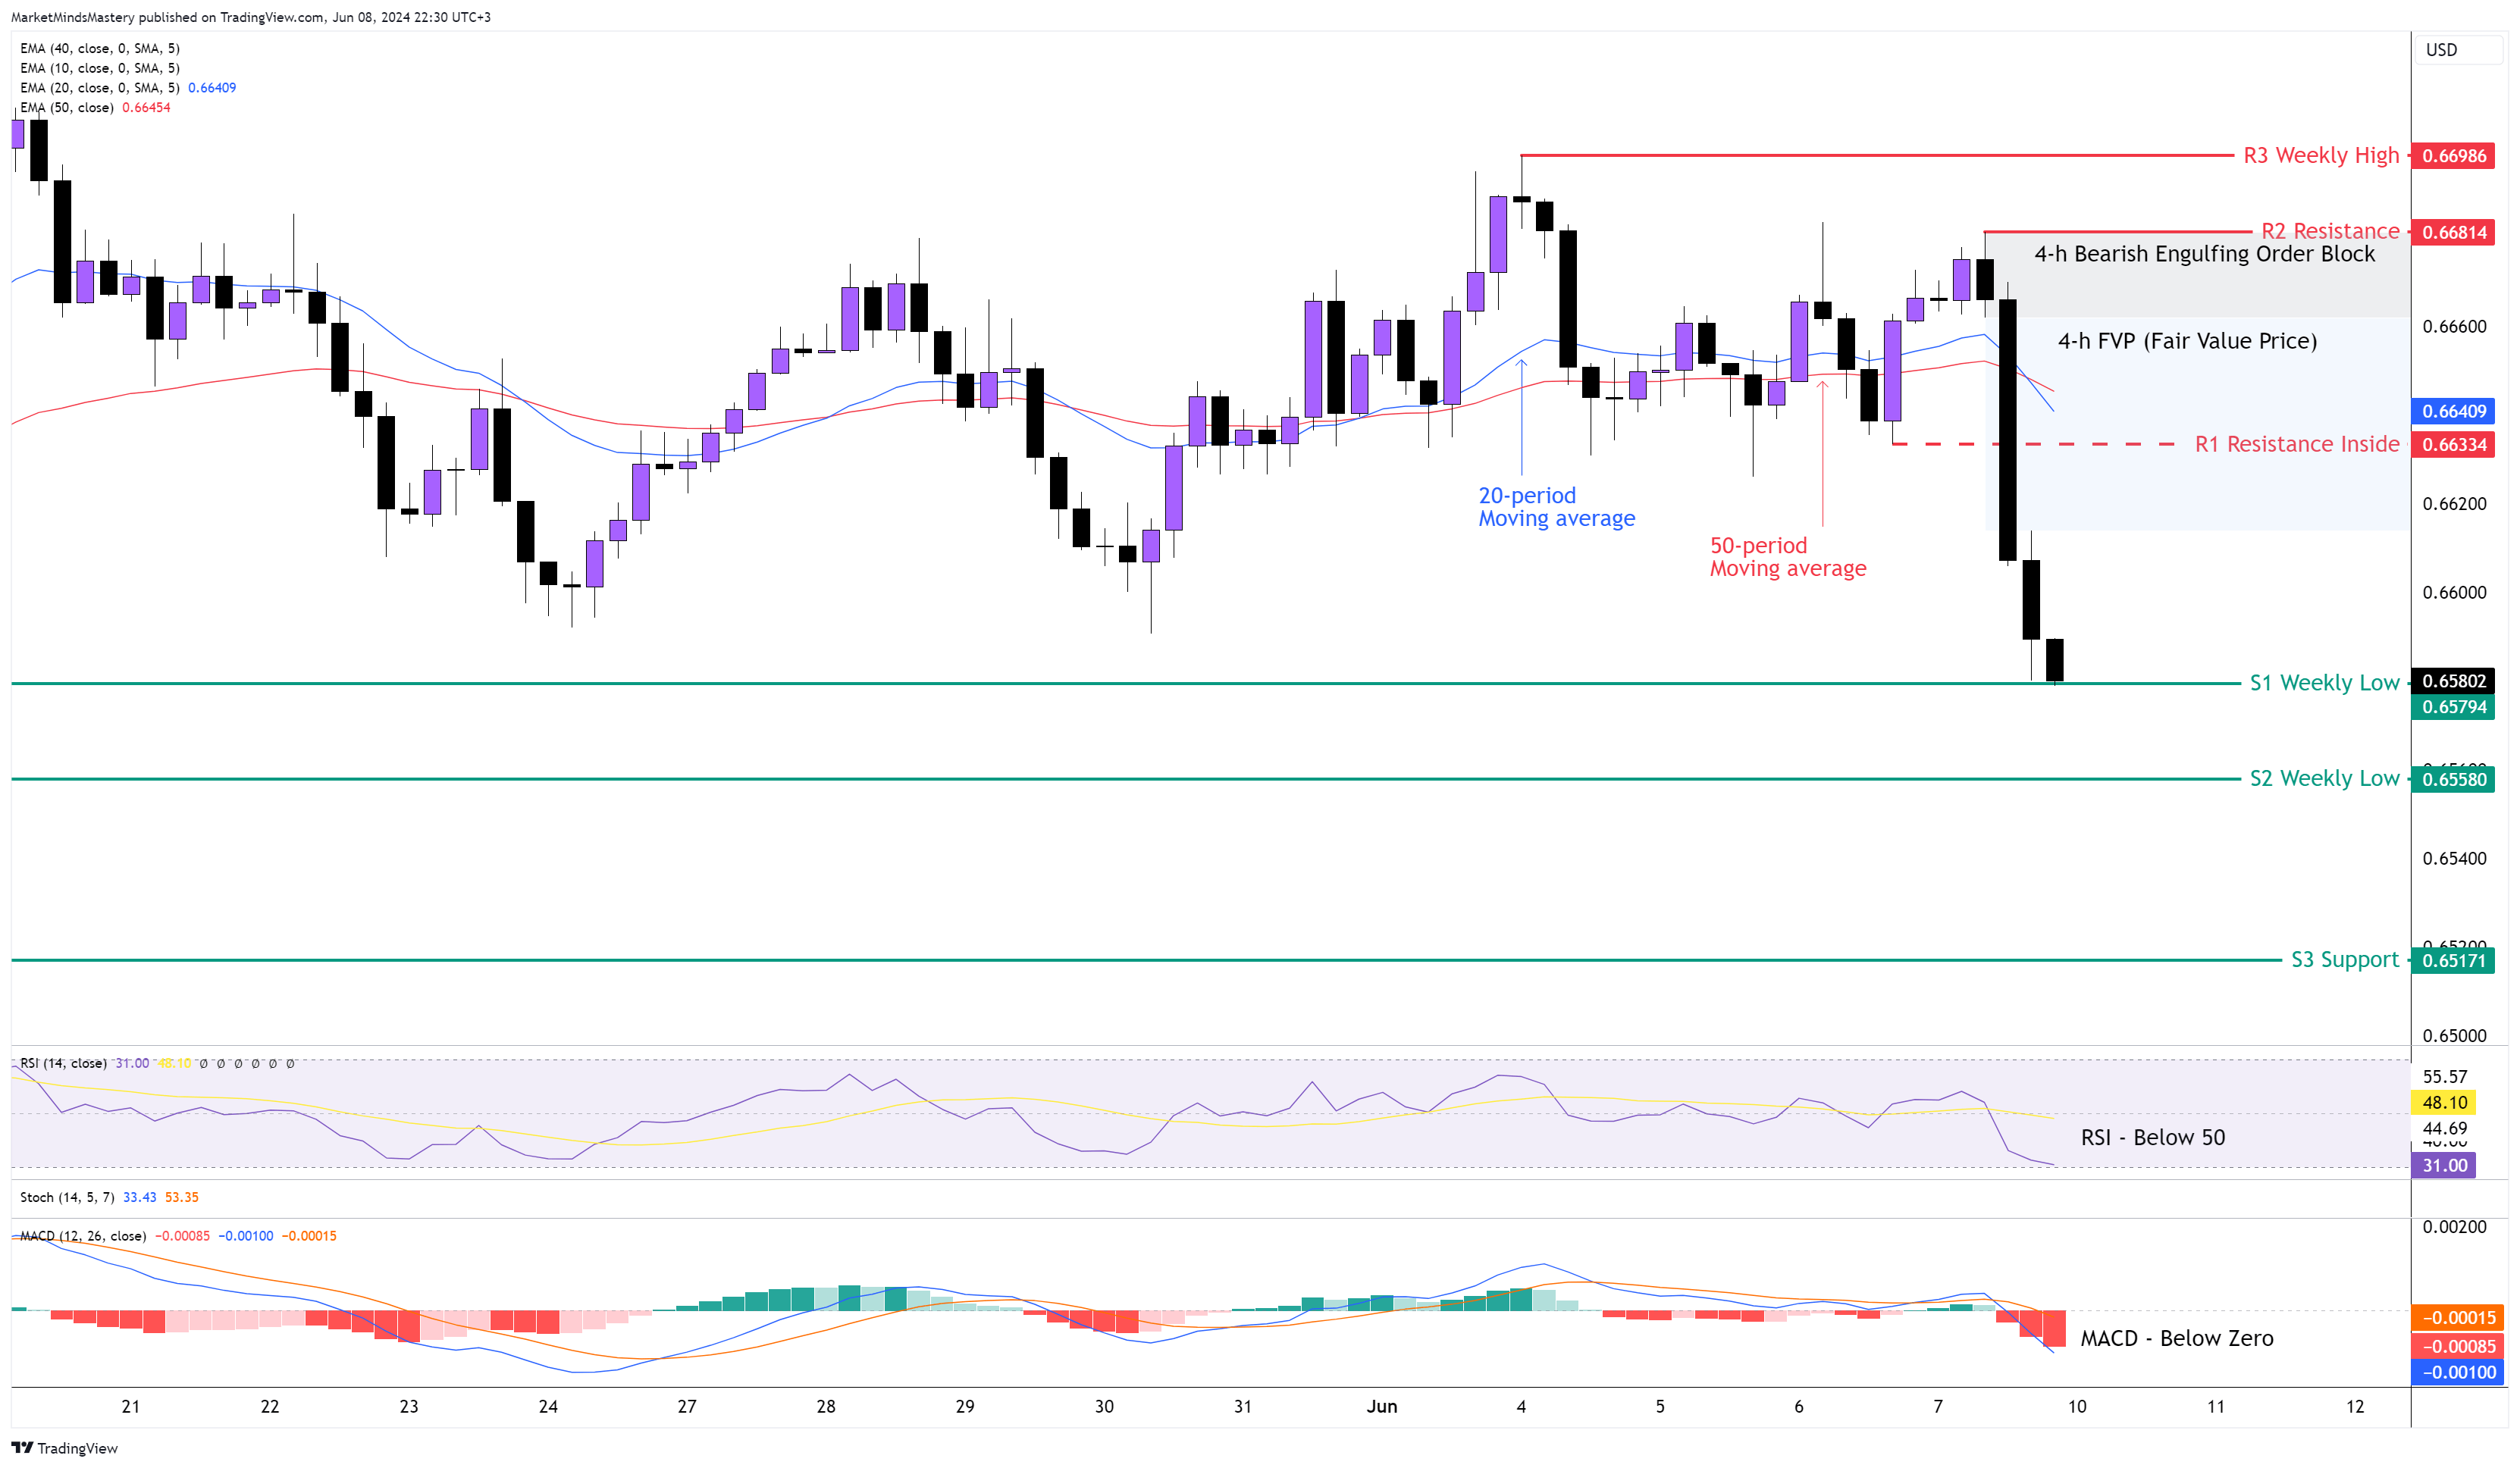
The Australian dollar could be considered the weakest currency last week. The NFP outcome obviously impacted the drop of the currency pair, giving a boost to the USD. The weekly chart ended with the Bearish Engulfing candle and a close under the previous week’s candle. On the 4H chart, the price broke outside the range, which is the first sign of the beginning of a downtrend. The 20-period moving average crossed under the 50-period moving average and is a bearish sign. The RSI oscillator is under 50, and this has bearish implications. Also, the MACD created a bearish crossover, which is now under the zero line.
Starting Monday, the first support area is around 0.65794 if the price keeps lowering. This is the previous week’s low, and currently, the price is resting on it. If the price penetrates the S1 and moves downwards, the next support area, S2, will be 0.65580. On the other hand, if the price moves upwards, the first resistance area, R1, will be around 0.66334. This is an inside resistance and within the FVP, as shown on the chart above., If the price penetrates the R1 and keeps moving upwards, the next resistance area, R2, will be around 0.66814, with a Bearish Engulfing Order Block being there.
USD JPY 4H
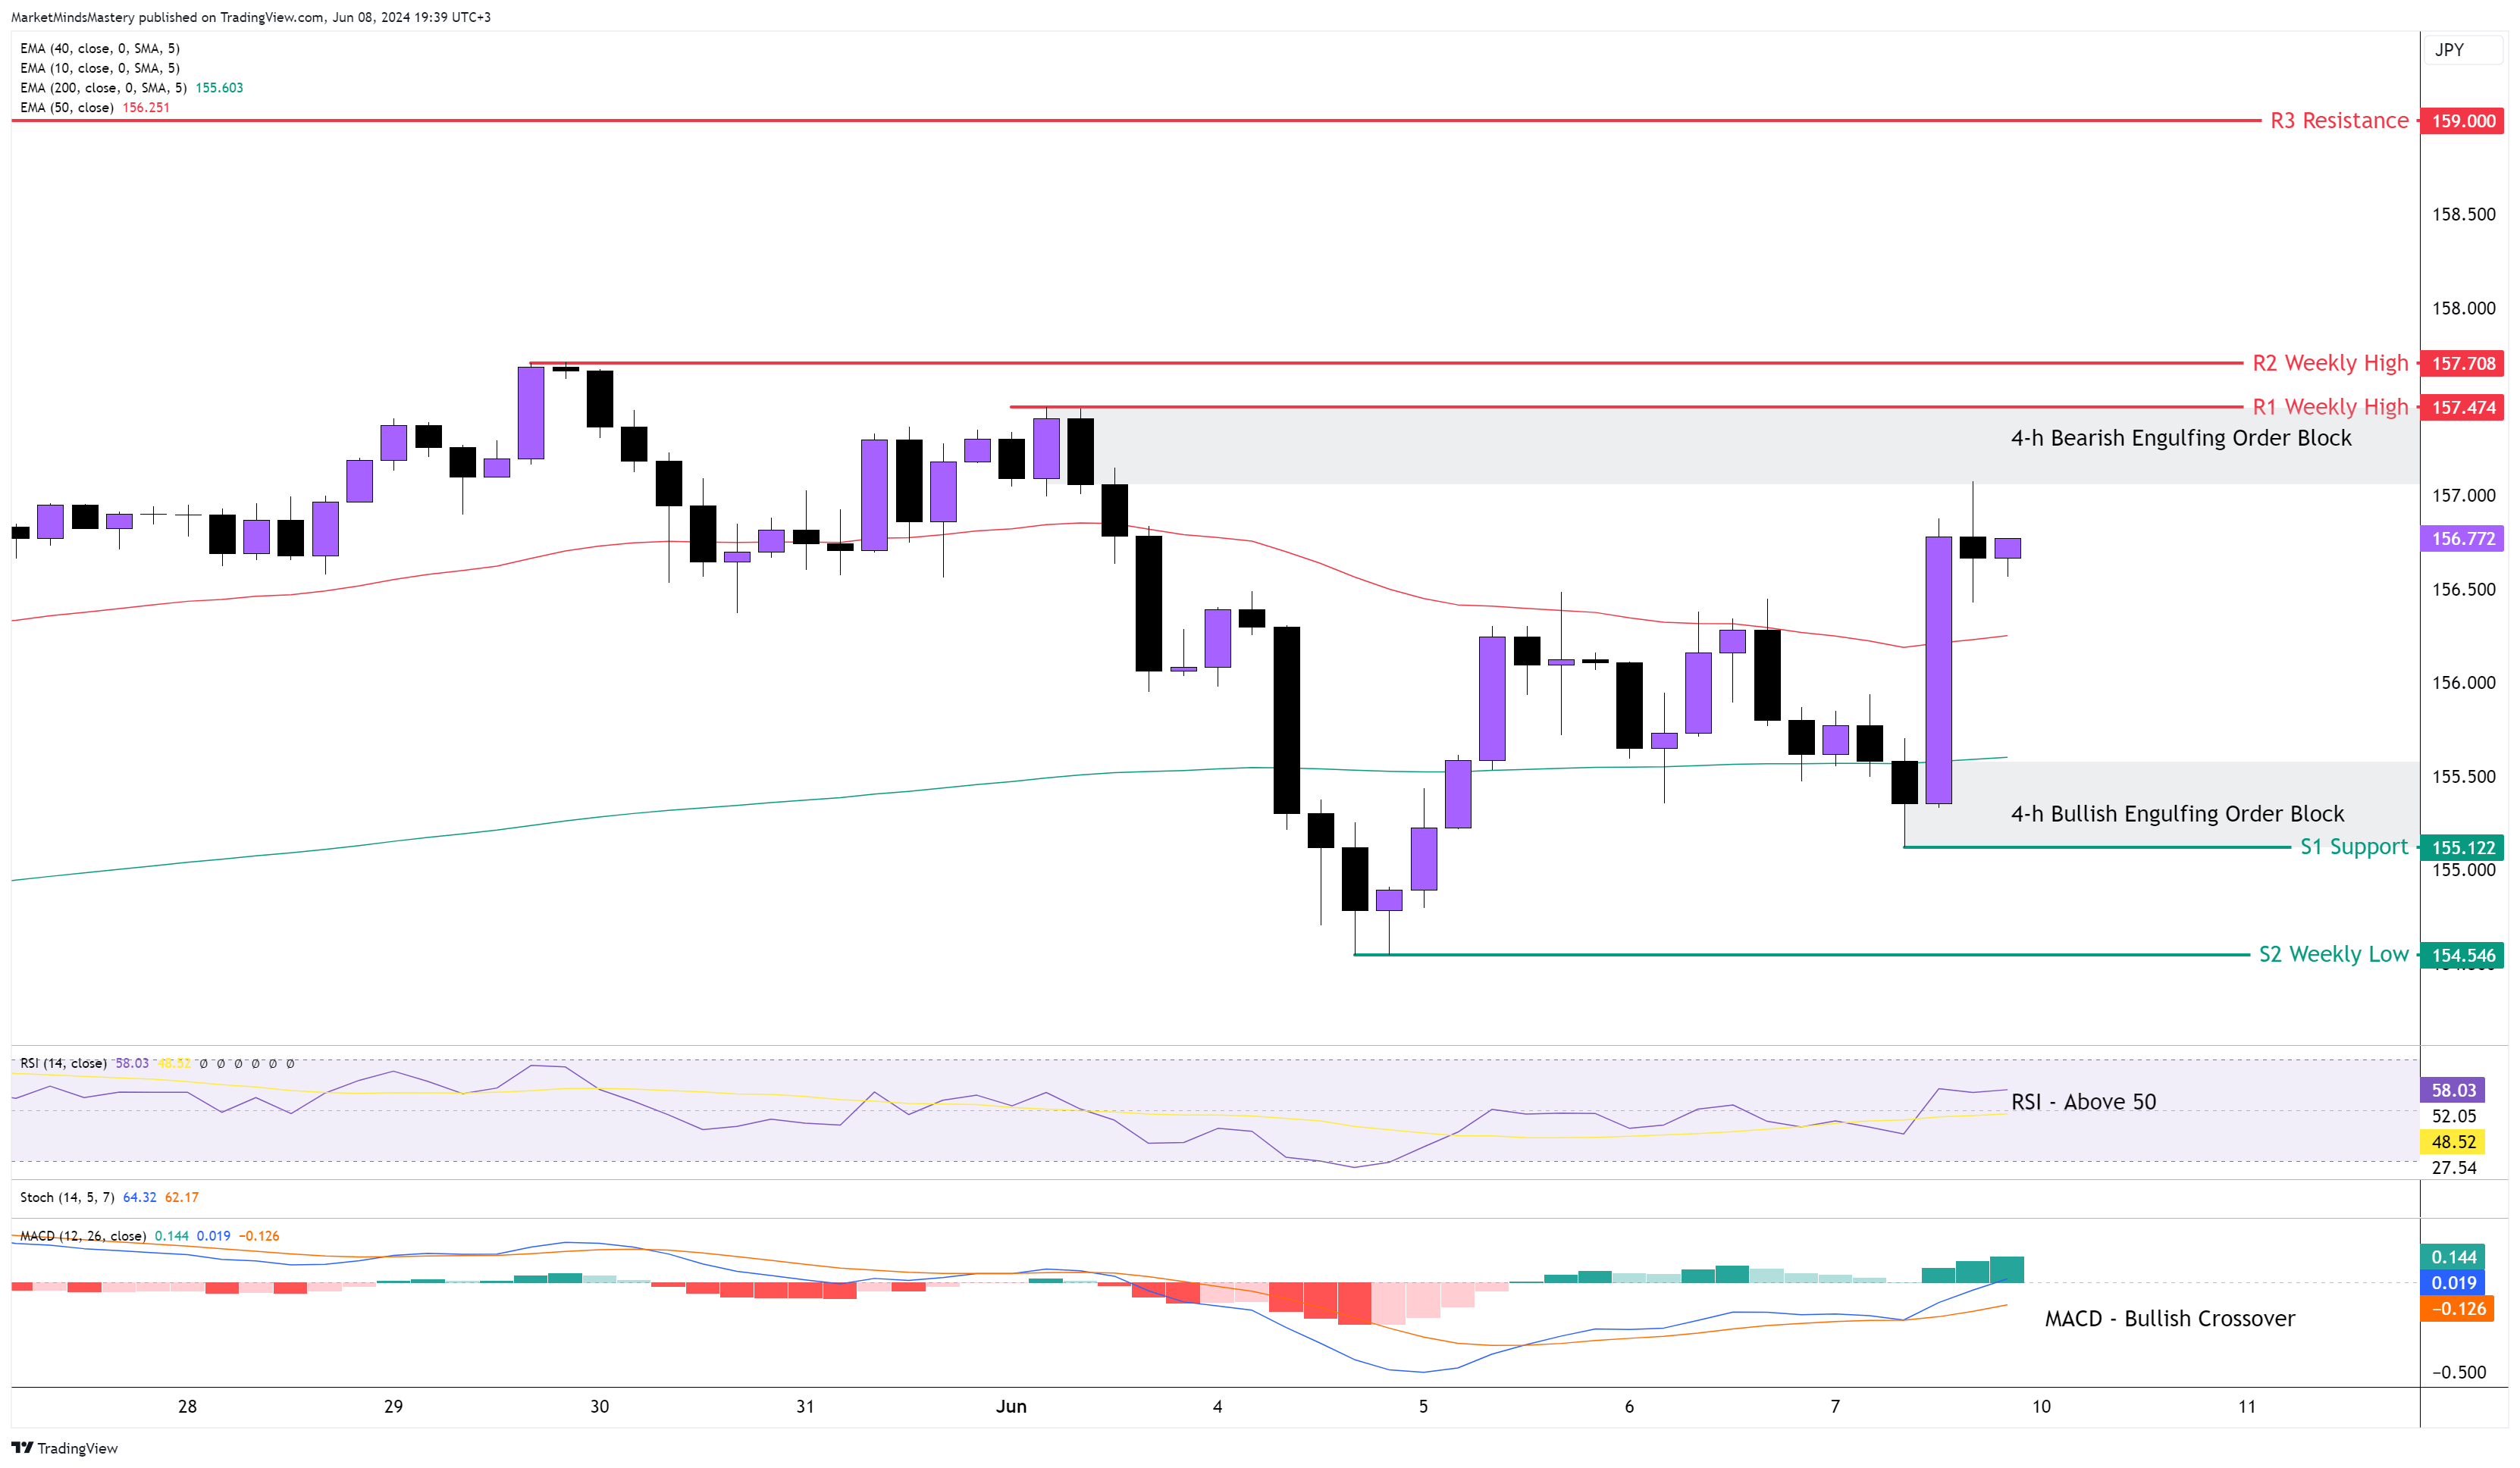
Following the weekly price action, the price closed as a long lower wick candle. The primary trend on the weekly chart is an uptrend, as both market structure and moving averages support it. On the 4H chart, the price doesn’t have a clear market structure because the swings do not define consecutive higher highs or lower lows. The 50-period is above the 200-period moving average, which has bullish implications. The RSI oscillator is above 50, which has bullish implications. The MACD created a Bullish Crossover as the MACD line (blue) crossed above the signal line (orange). The fact that the price is currently above the 50-period moving average indicates a more bullish bias.
Starting Monday, if the price continues to move upwards, the first resistance area, R1, will be 157.47. This is the previous week’s highest price and the beginning of a Bearish Engulfing Order Block. In a small distance above the R1 is the R2 resistance area around 157.70, which is another weekly high. On the other hand, if the price moves downwards, the first support area, S1, will be 155.122, which is right under the 200-period moving average. At this level, a Bullish Engulfing Order Block was created last Friday. If the price closes under S1 and moves lower, the next support area, S2, will be the previous week’s low, around 154.54.
USD CHF 4H
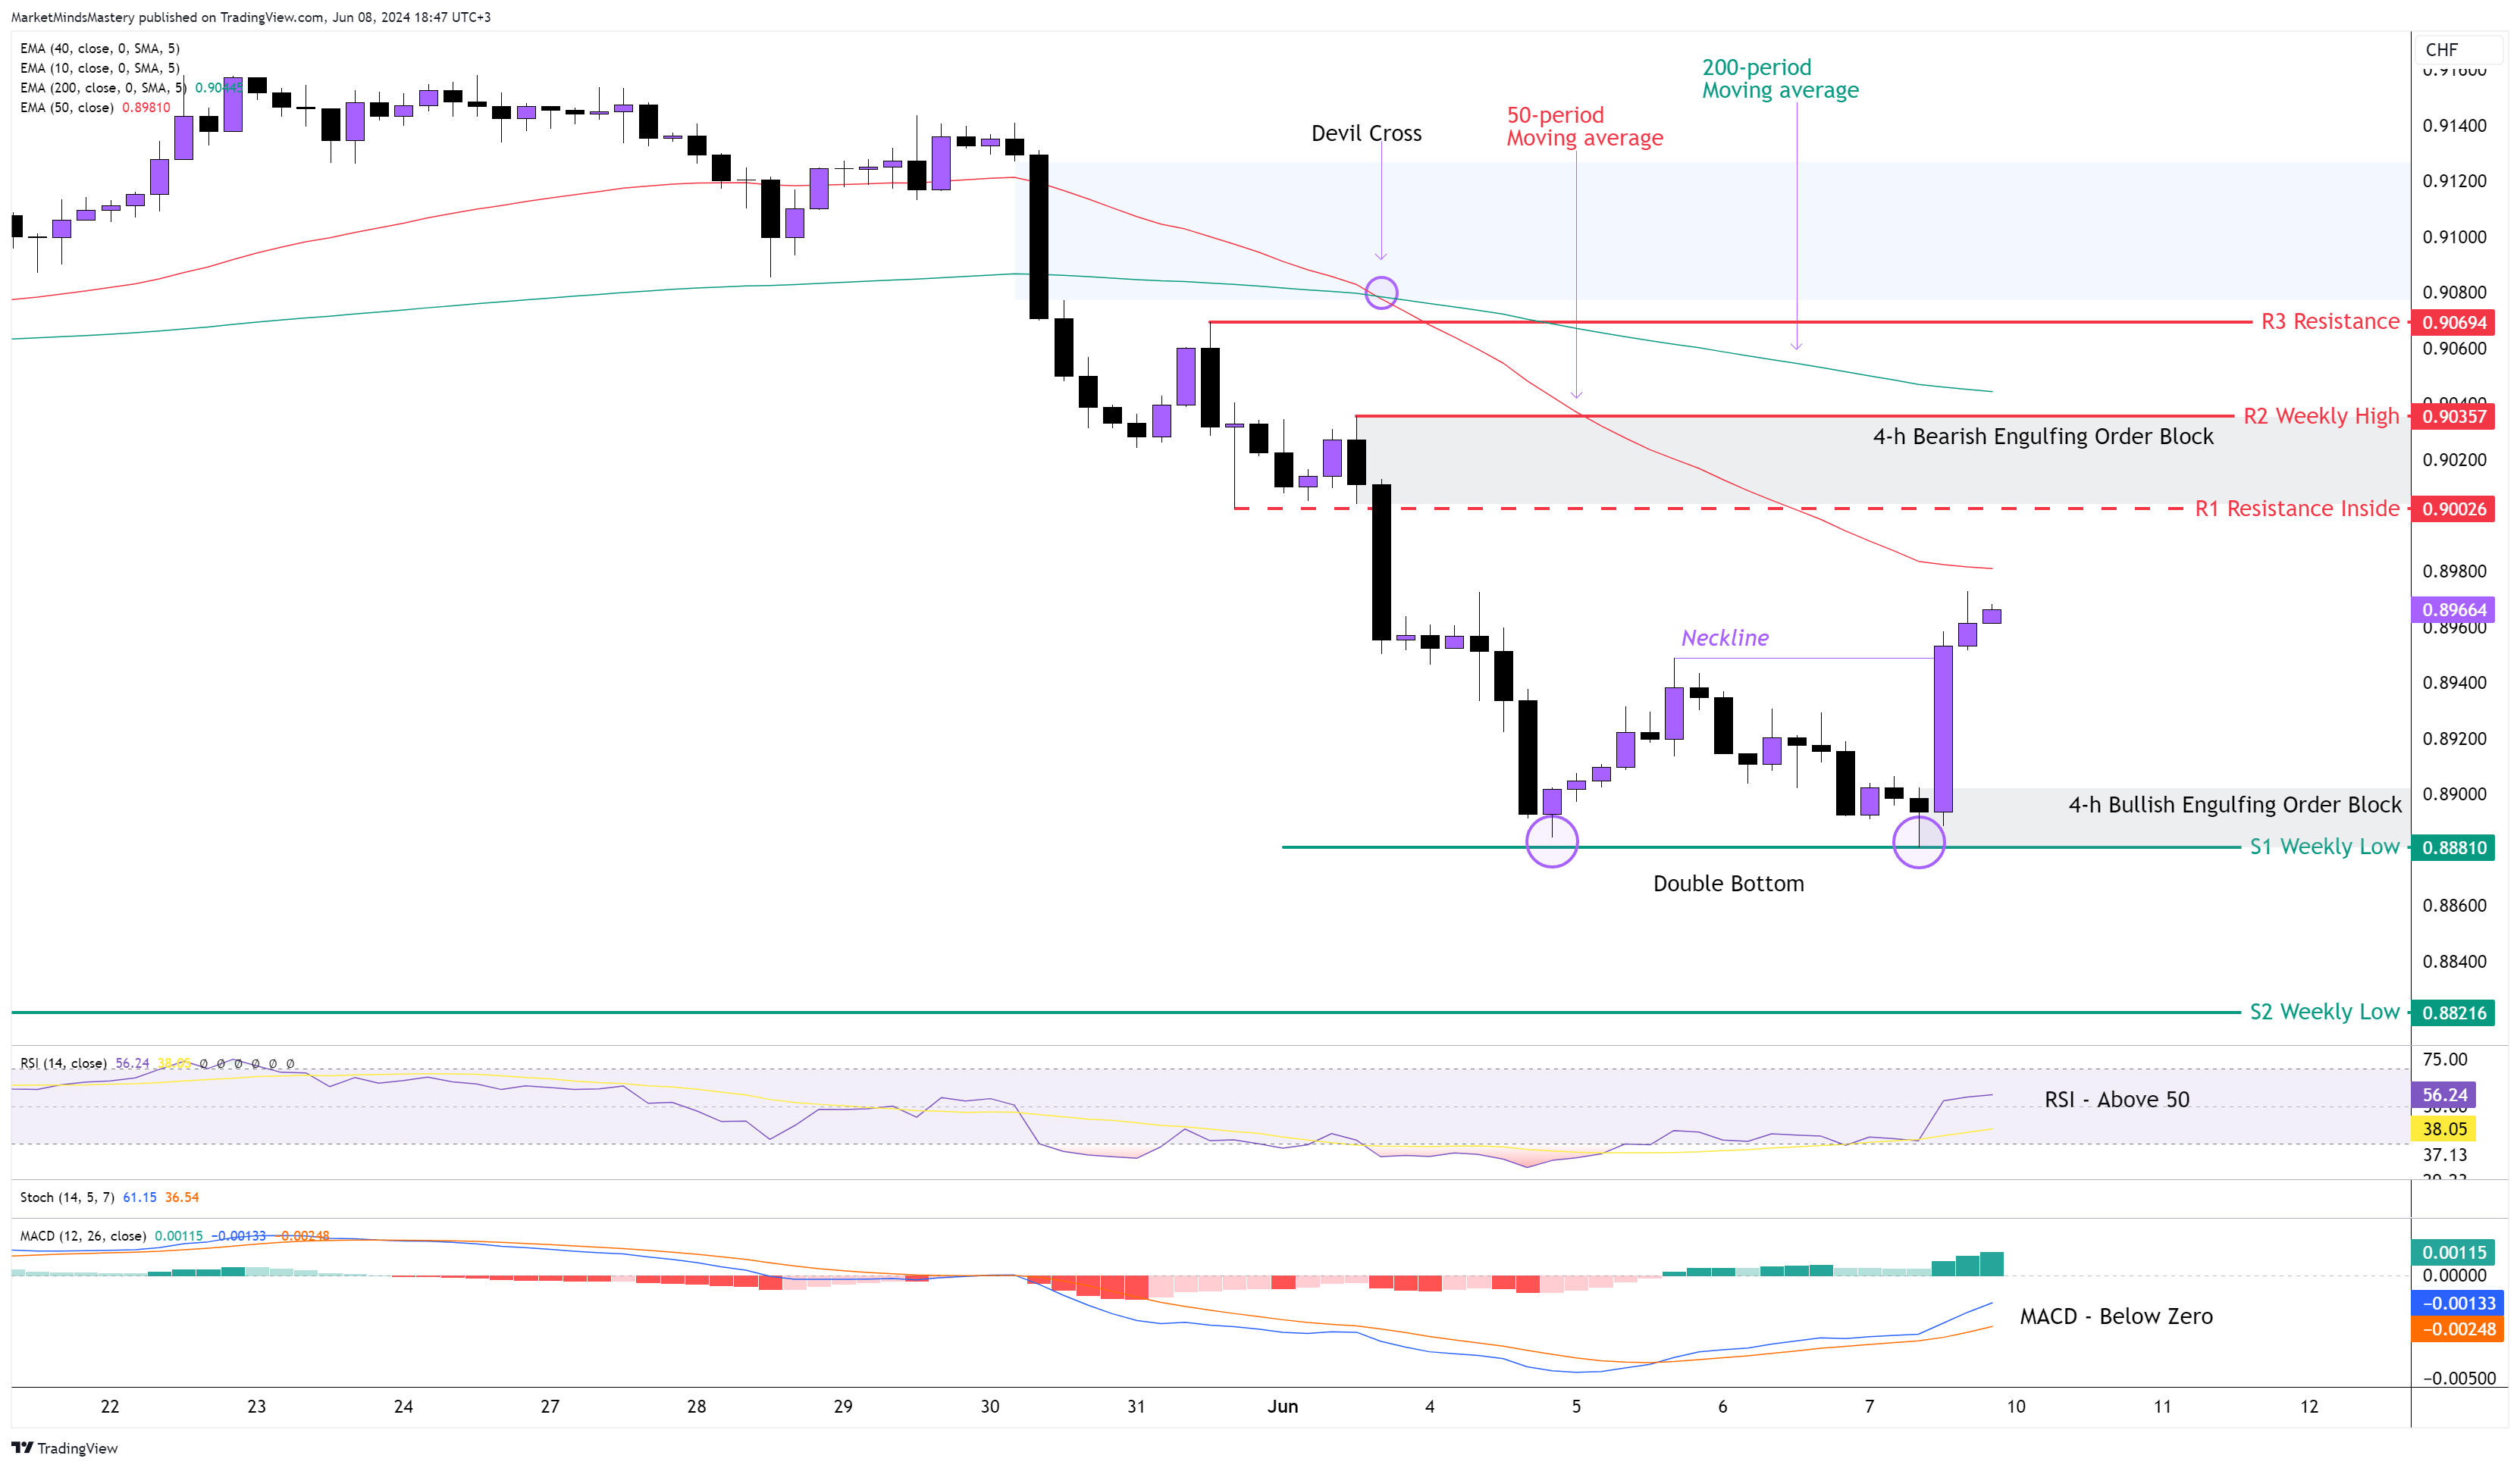
Out of all the major currency pairs, the USDCHF was the only pair that has been trending for the last two weeks. The series of lower highs and lower lows on the 4H chart ended last Friday as the price created a double-bottom reversal pattern. During the NFP, the price penetrated the pattern’s neckline, completing the pattern.
The 50-period moving average crossed under the 200-period moving average. This phenomenon is known as the “devil crossover”.
The RSI Oscillator is above 50, which indicates bullishness. The MACD is still under the zero line, but the MACD line (blue) is above the Signal line (orange), which is a bullish crossover.
Starting Monday, if the price moves upwards, the first resistance area, R1, will be 0.9000, a round number and an inside resistance. If the price penetrates the R1 and moves higher, the next resistance area, R2, is approximately 0.90357. This level is the previous week's high and created a Bearish Engulfing Order Block. On the other hand, if the price is rejected and moves lower, the first support area, S1, will be approximately 0.88810 and the previous week’s low. If the price doesn’t bounce off the S1 and close under it, the next support area, S2, is an older weekly low of around 0.88216.
GBP JPY 4H
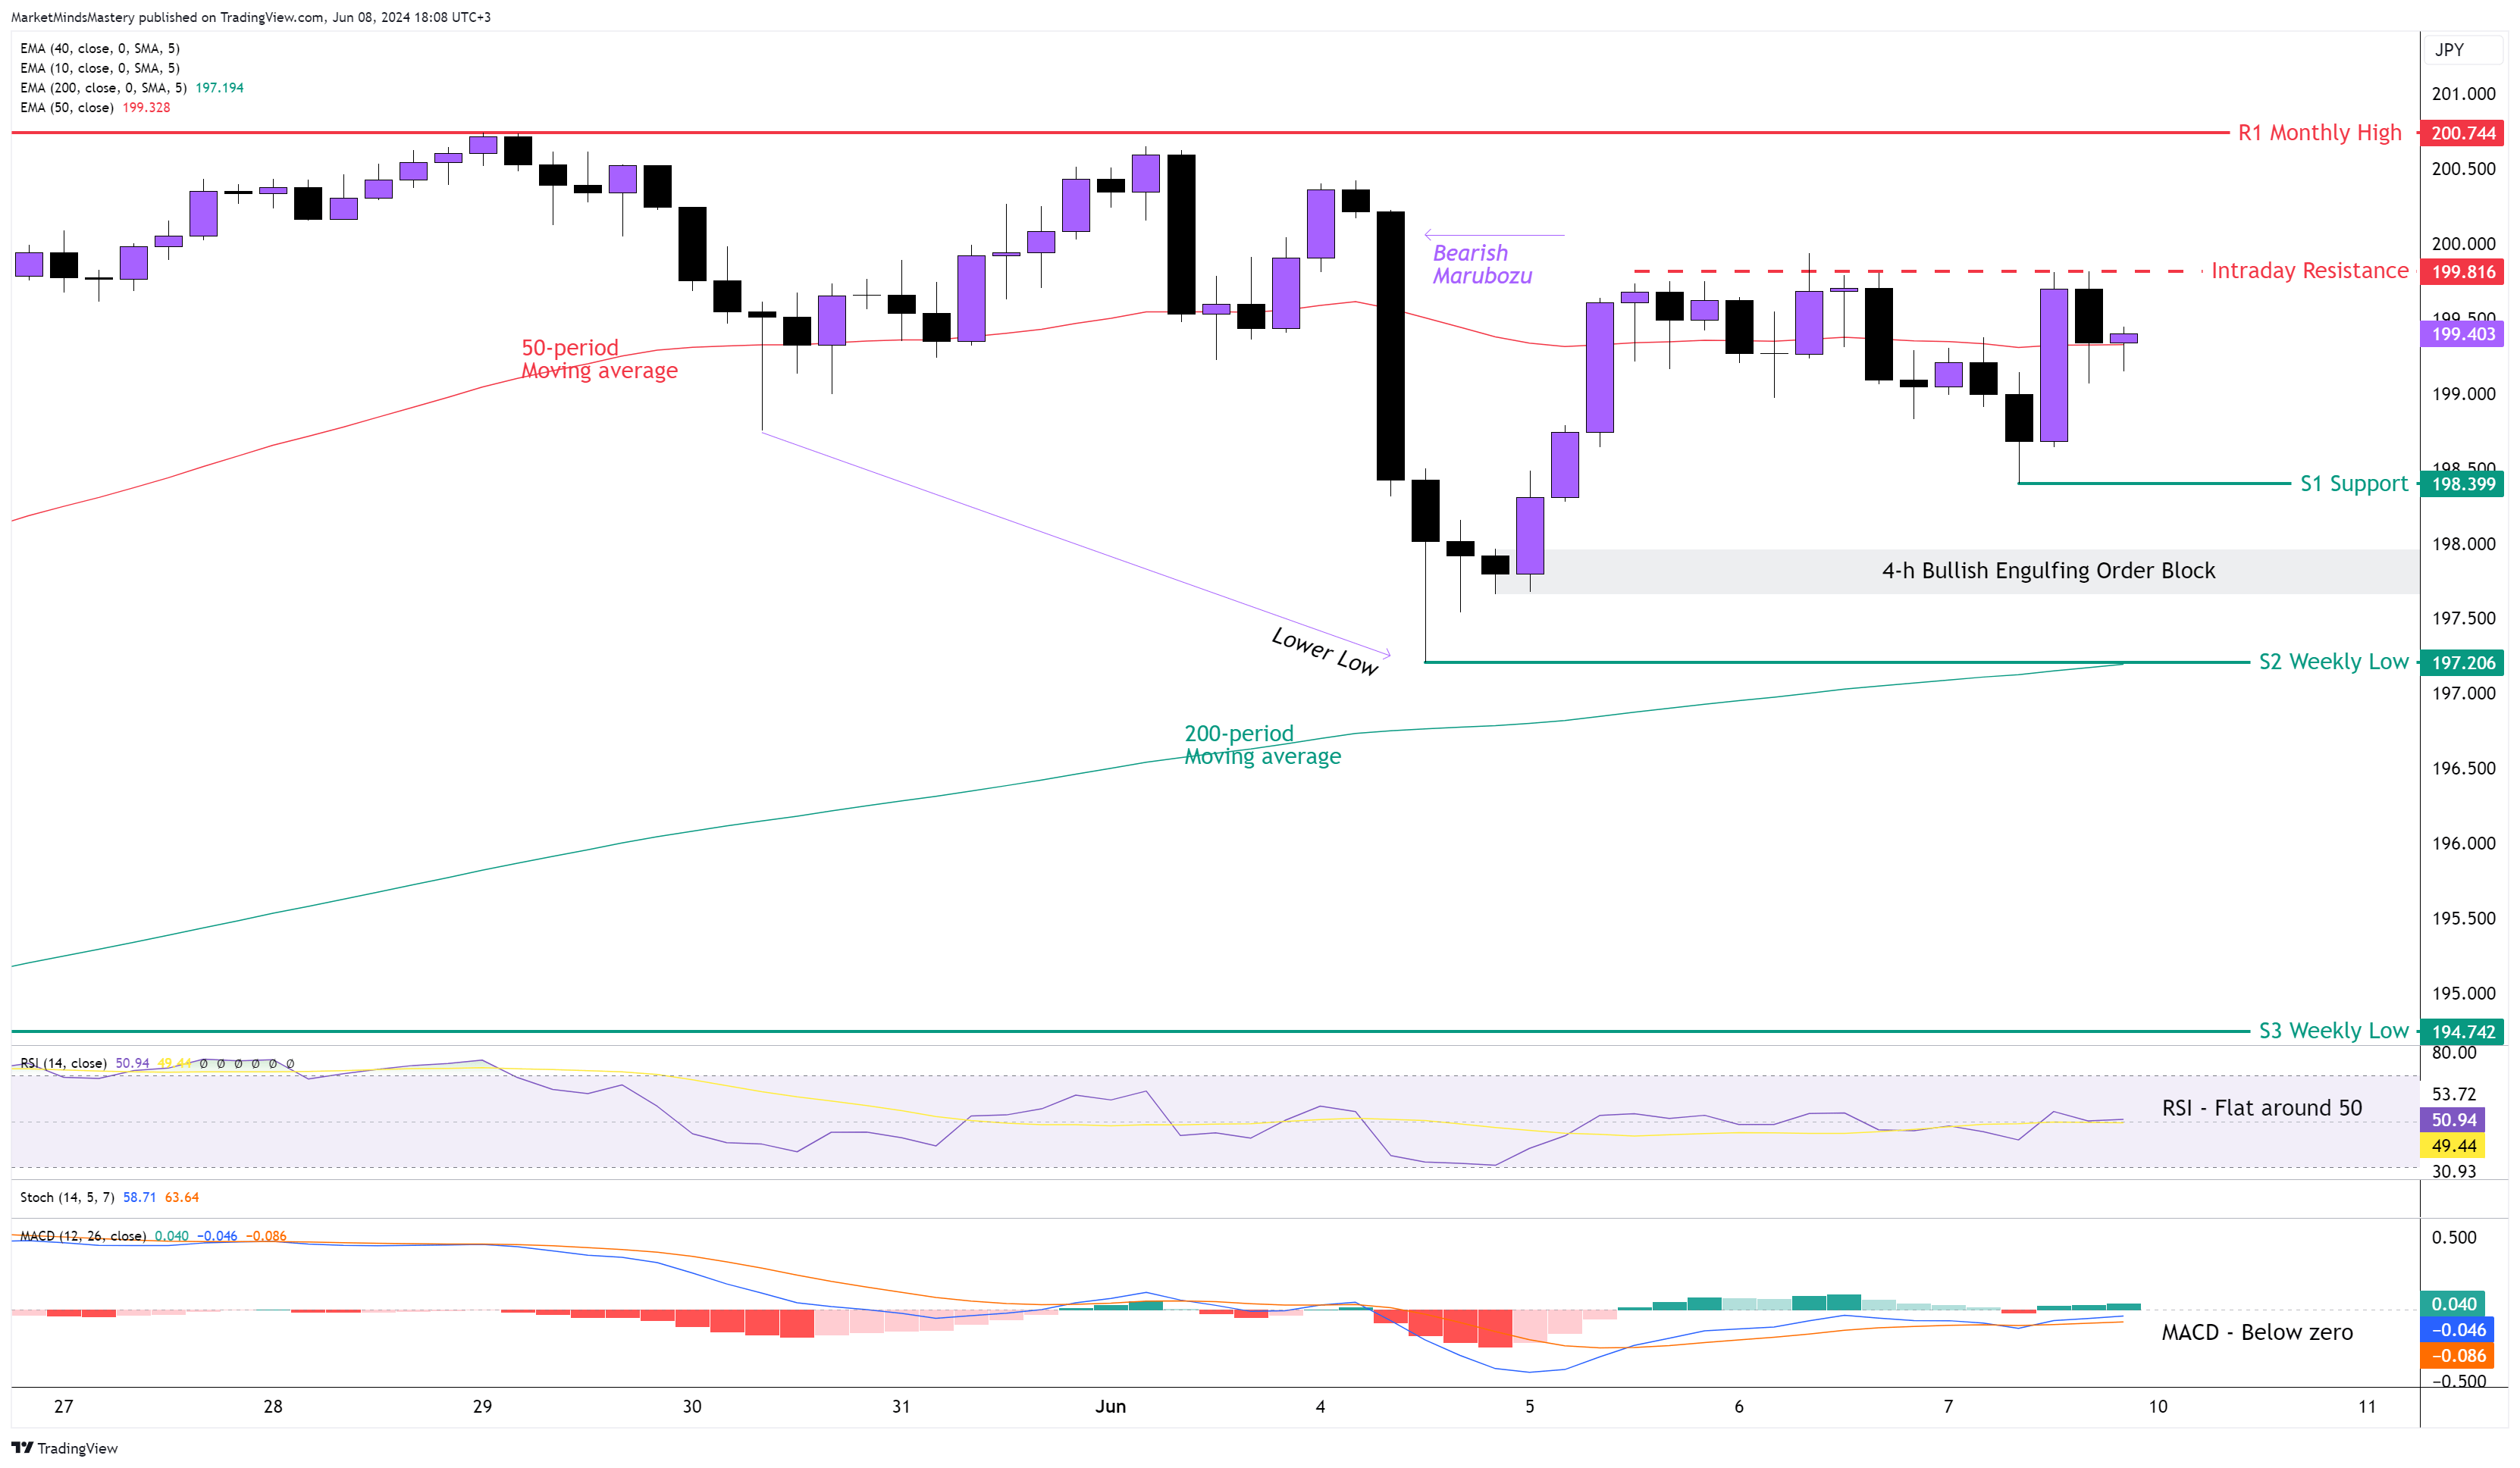
Following the previous week’s market outlook, the price moved upwards as expected, entered into the Bearish Engulfing’s Order Block area and was rejected, leaving behind a Bearish Marubozu. Since then, the price has created a lower low formation. The 50-period is above the 200-period moving average, which has bullish implications. The RSI Oscillator is flat around the middle line because the price in the last almost 20 periods is moving sideways. The MACD is also flat around its middle line but still under zero, which can be interpreted as a bearish indication.
As the weekly chart ended with another Hanging man reversal, therefore, if the price is rejected and moves lower, the first support area, S1, will be 198.39. If it penetrates the S1 and moves downwards, the price will enter the Bullish Engulfing Order Block around 198. If the Order Block doesn’t hold, which means the price will not bounce off, the next area of support, S2, will be around 197.20, which is the previous week’s low.
On the other hand, if the price moves upward from any level. This can be after it bounces off from a support or if it remains above the 50-period moving average, then the first resistance seen is the intraday resistance created last week at around 199.81. If it penetrates this resistance and moves higher, the next resistance area is the previous month's high, around 200.75.
GOLD 4H
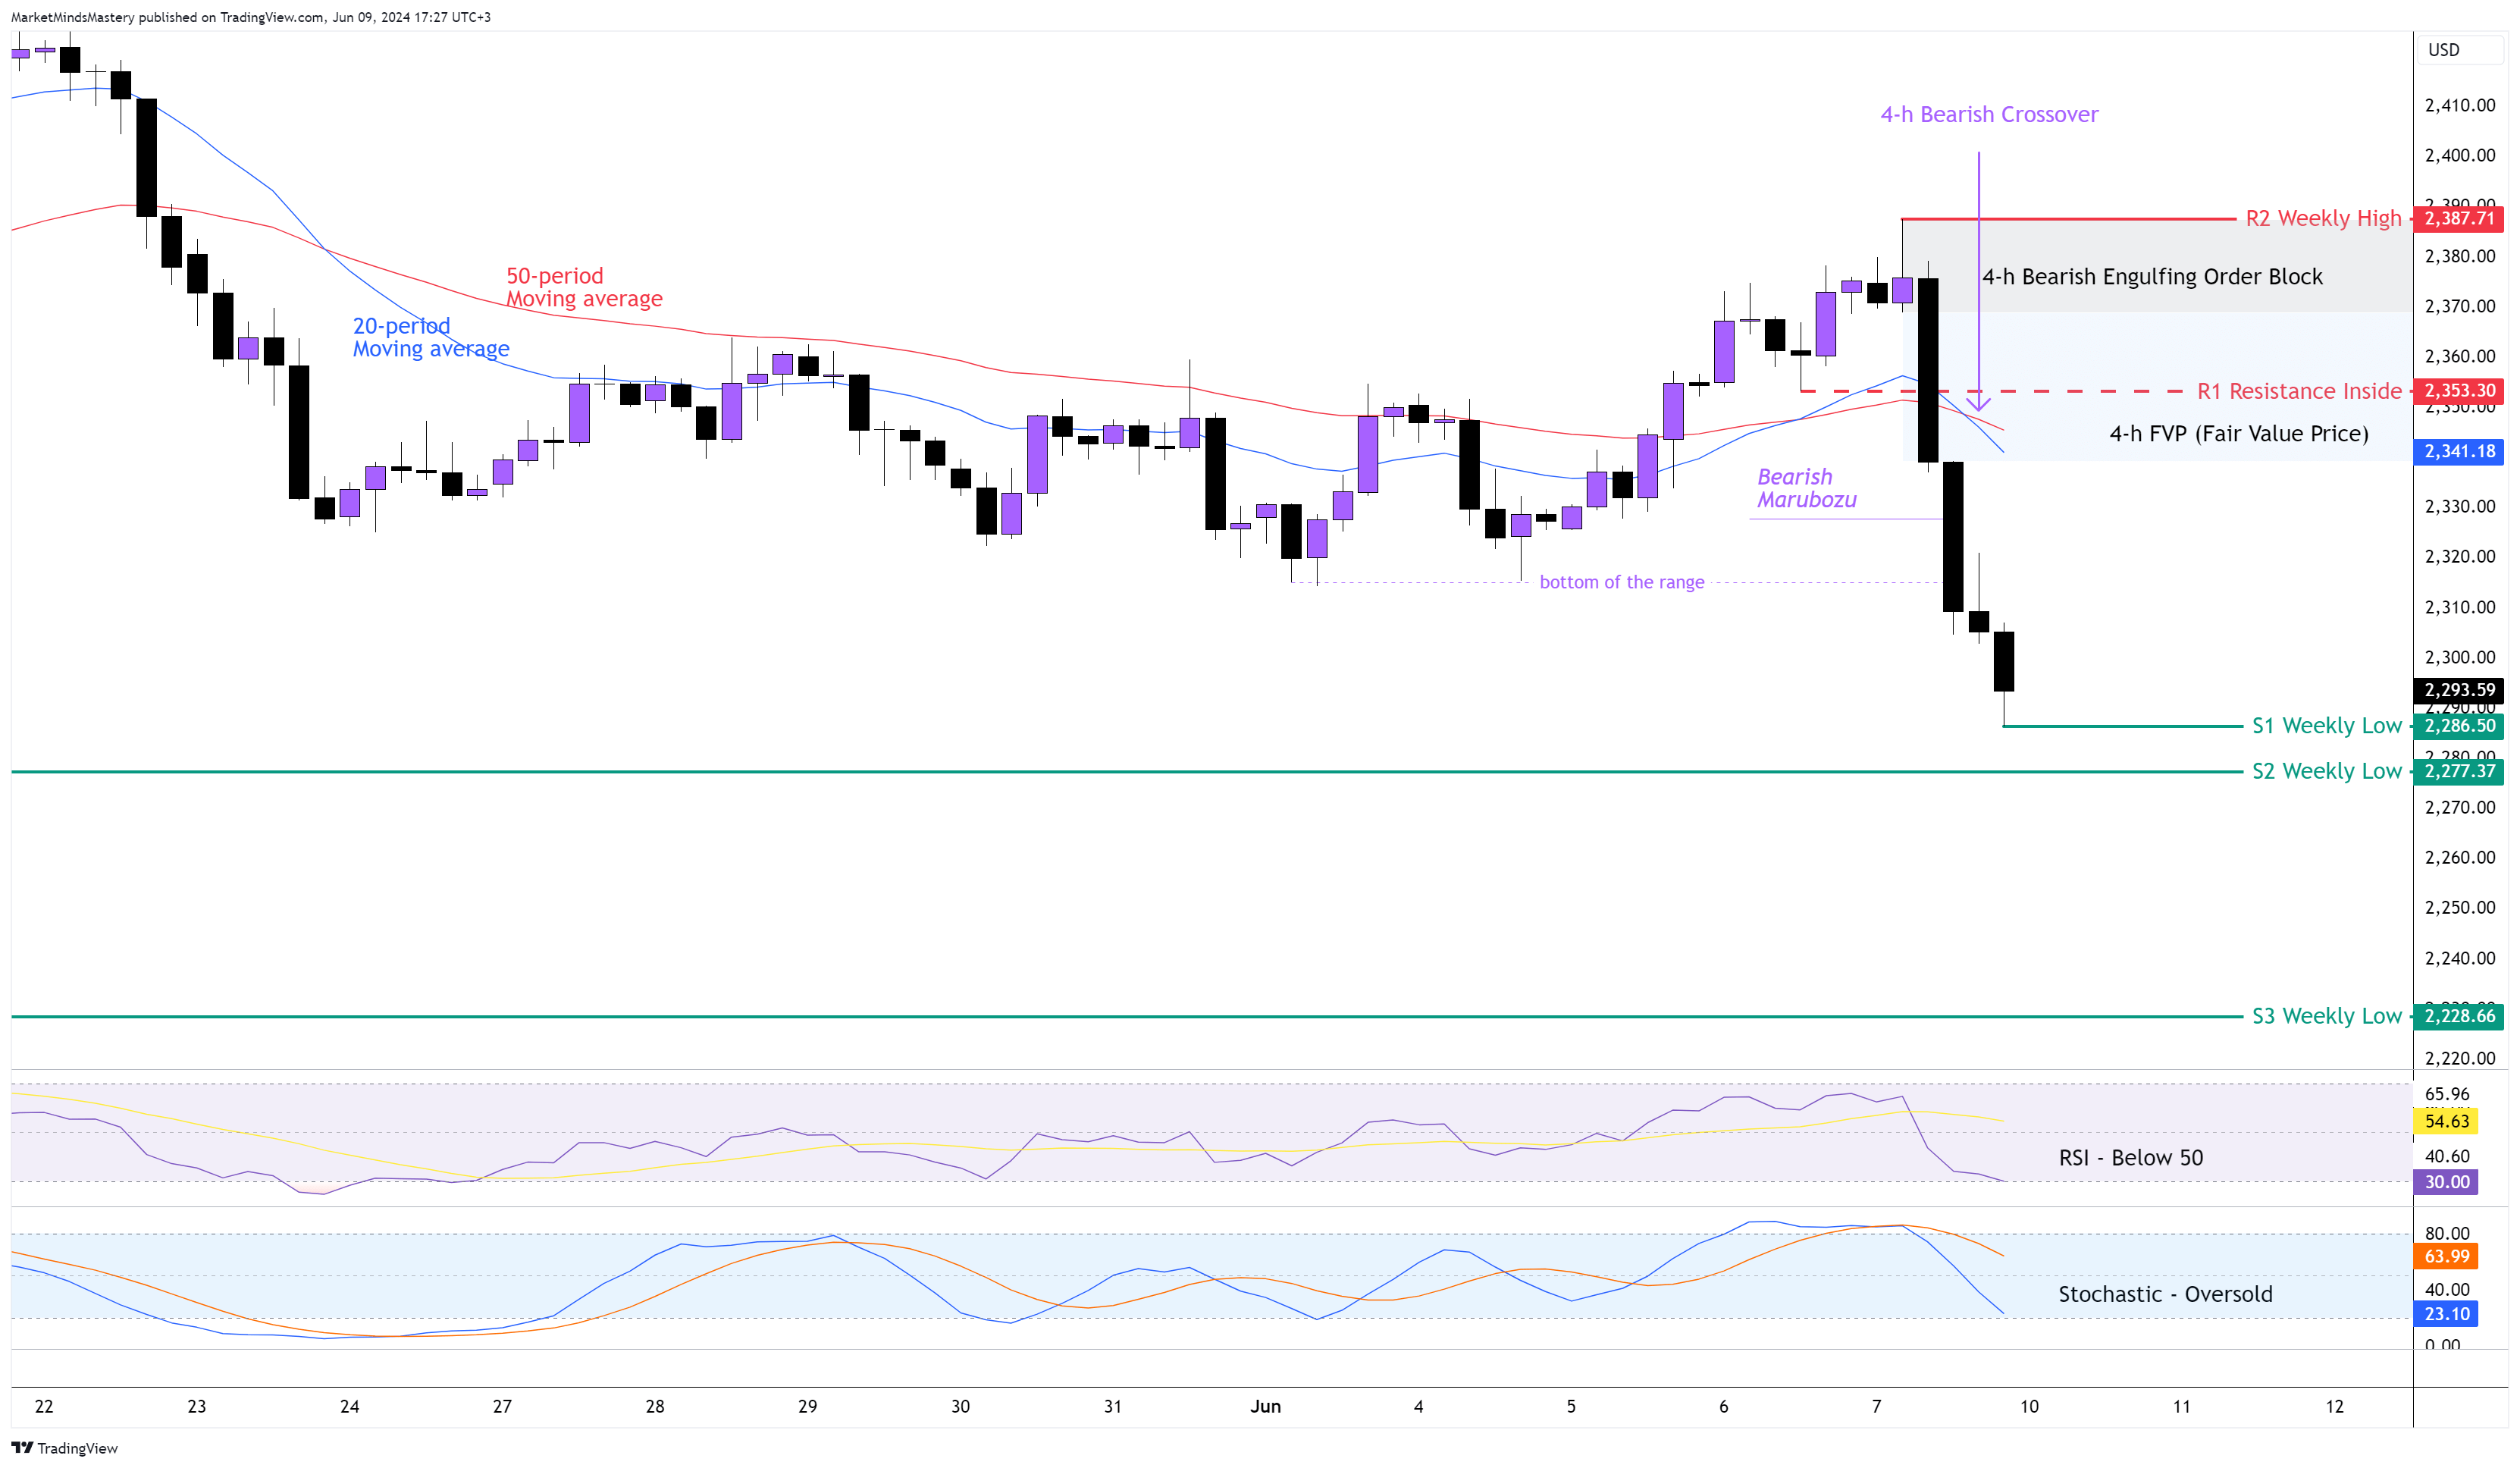
Following the long-term double-top pattern on the weekly chart, Gold created a Bearish engulfing reversal candlestick last week because of the NFP outcome, which favoured the USD.
Looking at the 4H chart, the price successfully broke the bottom of the range, as shown above. The close of the weekly candle was at the same level as its low.
The 20-period moving average crossed under the 50-period, known as a Bearish Crossover. The RSI Oscillator is under 50 and almost oversold, and the Stochastic oscillator is also almost oversold. Both have bearish implications. As per the swing analysis, the swing that created this downward move left behind a Bearish Engulfing Order Block and an FVP (Fair Value Price).
Starting Monday, if the price continues to move downward, the first support area, S1, will be the previous week’s low, around $2286, only 10 pips below the prior candle’s close. If the price penetrates the S1 and continues to move downwards, the next support area, S2, is another weekly low of around $2277. A further downward move finds the S3 support at approximately $2277. On the other hand, if the price moves upwards, the first resistance area is the R1, roughly $2353. This is an inside resistance and is within the FGP area. A move above the R1 finds the R2 resistance around $2387, which is the previous week’s high.
US OIL 4H
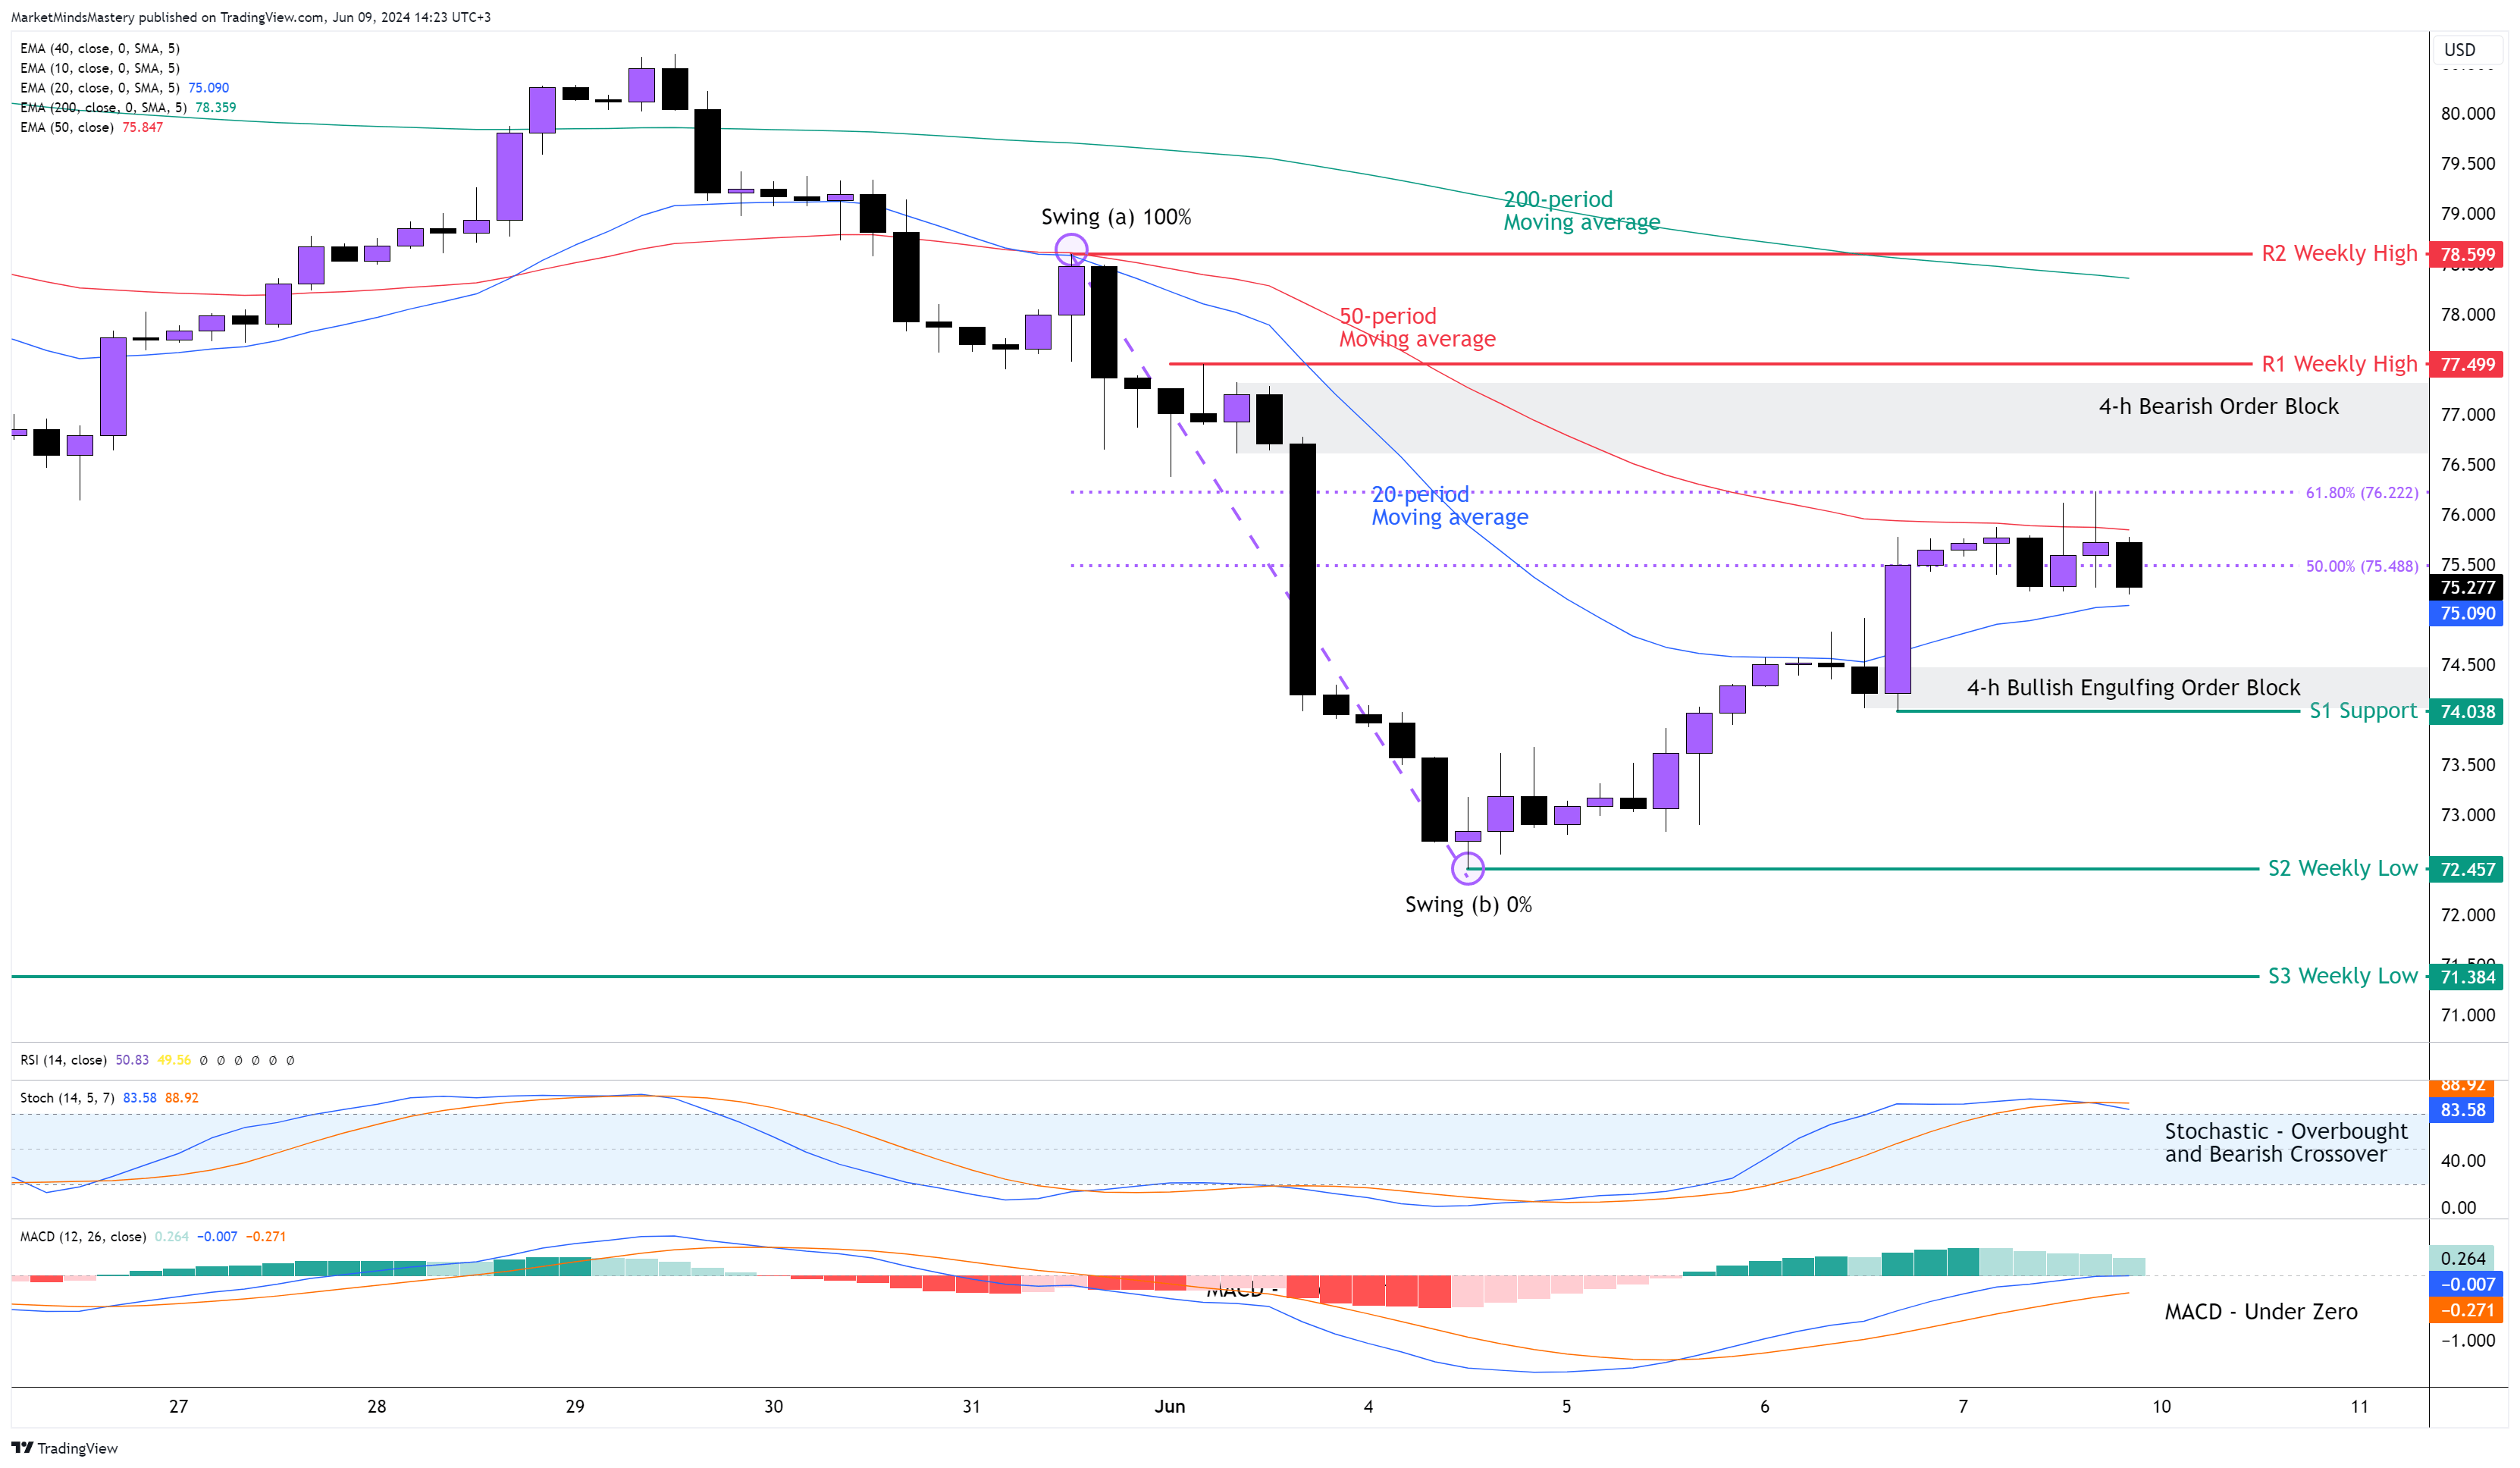
One of the most technical markets was the USOIL last week. The Inside candle with the long upper wick forced the price to create a downtrend on the 4H chart and offered lucrative trading opportunities for intraday trading.
The 20-period moving average is under the 50-period, and they are both under the long-term 200-period moving average. This moving average combination has bearish implications.
The Stochastic Oscillator is in an overbought condition, and at the same time, it created a bearish crossover. Additionally, the MACD is under zero. The price maintains the lower highs and lower lows. Therefore, the downtrend is still valid.
The price is currently touching the 50-period moving average and the 61.8% of the Fibonacci retracement, known as the Golden Ratio. If the price is rejected and moves downward, the first support area will be $74. This level created a Bullish Engulfing Order Block. If the price penetrates the S1 and moves further downwards, the next support area, S2, will be the $72.45, an old weekly low price. A move under the S2 will continue the downtrend. On the other hand, if the price moves upwards, the first resistance area, R1, will be $77.49, which is the previous week’s high, with a Bearish Order Block being there. A further upward movie will find the next resistance area R2, approximately $78.59.
BTC USD 4H
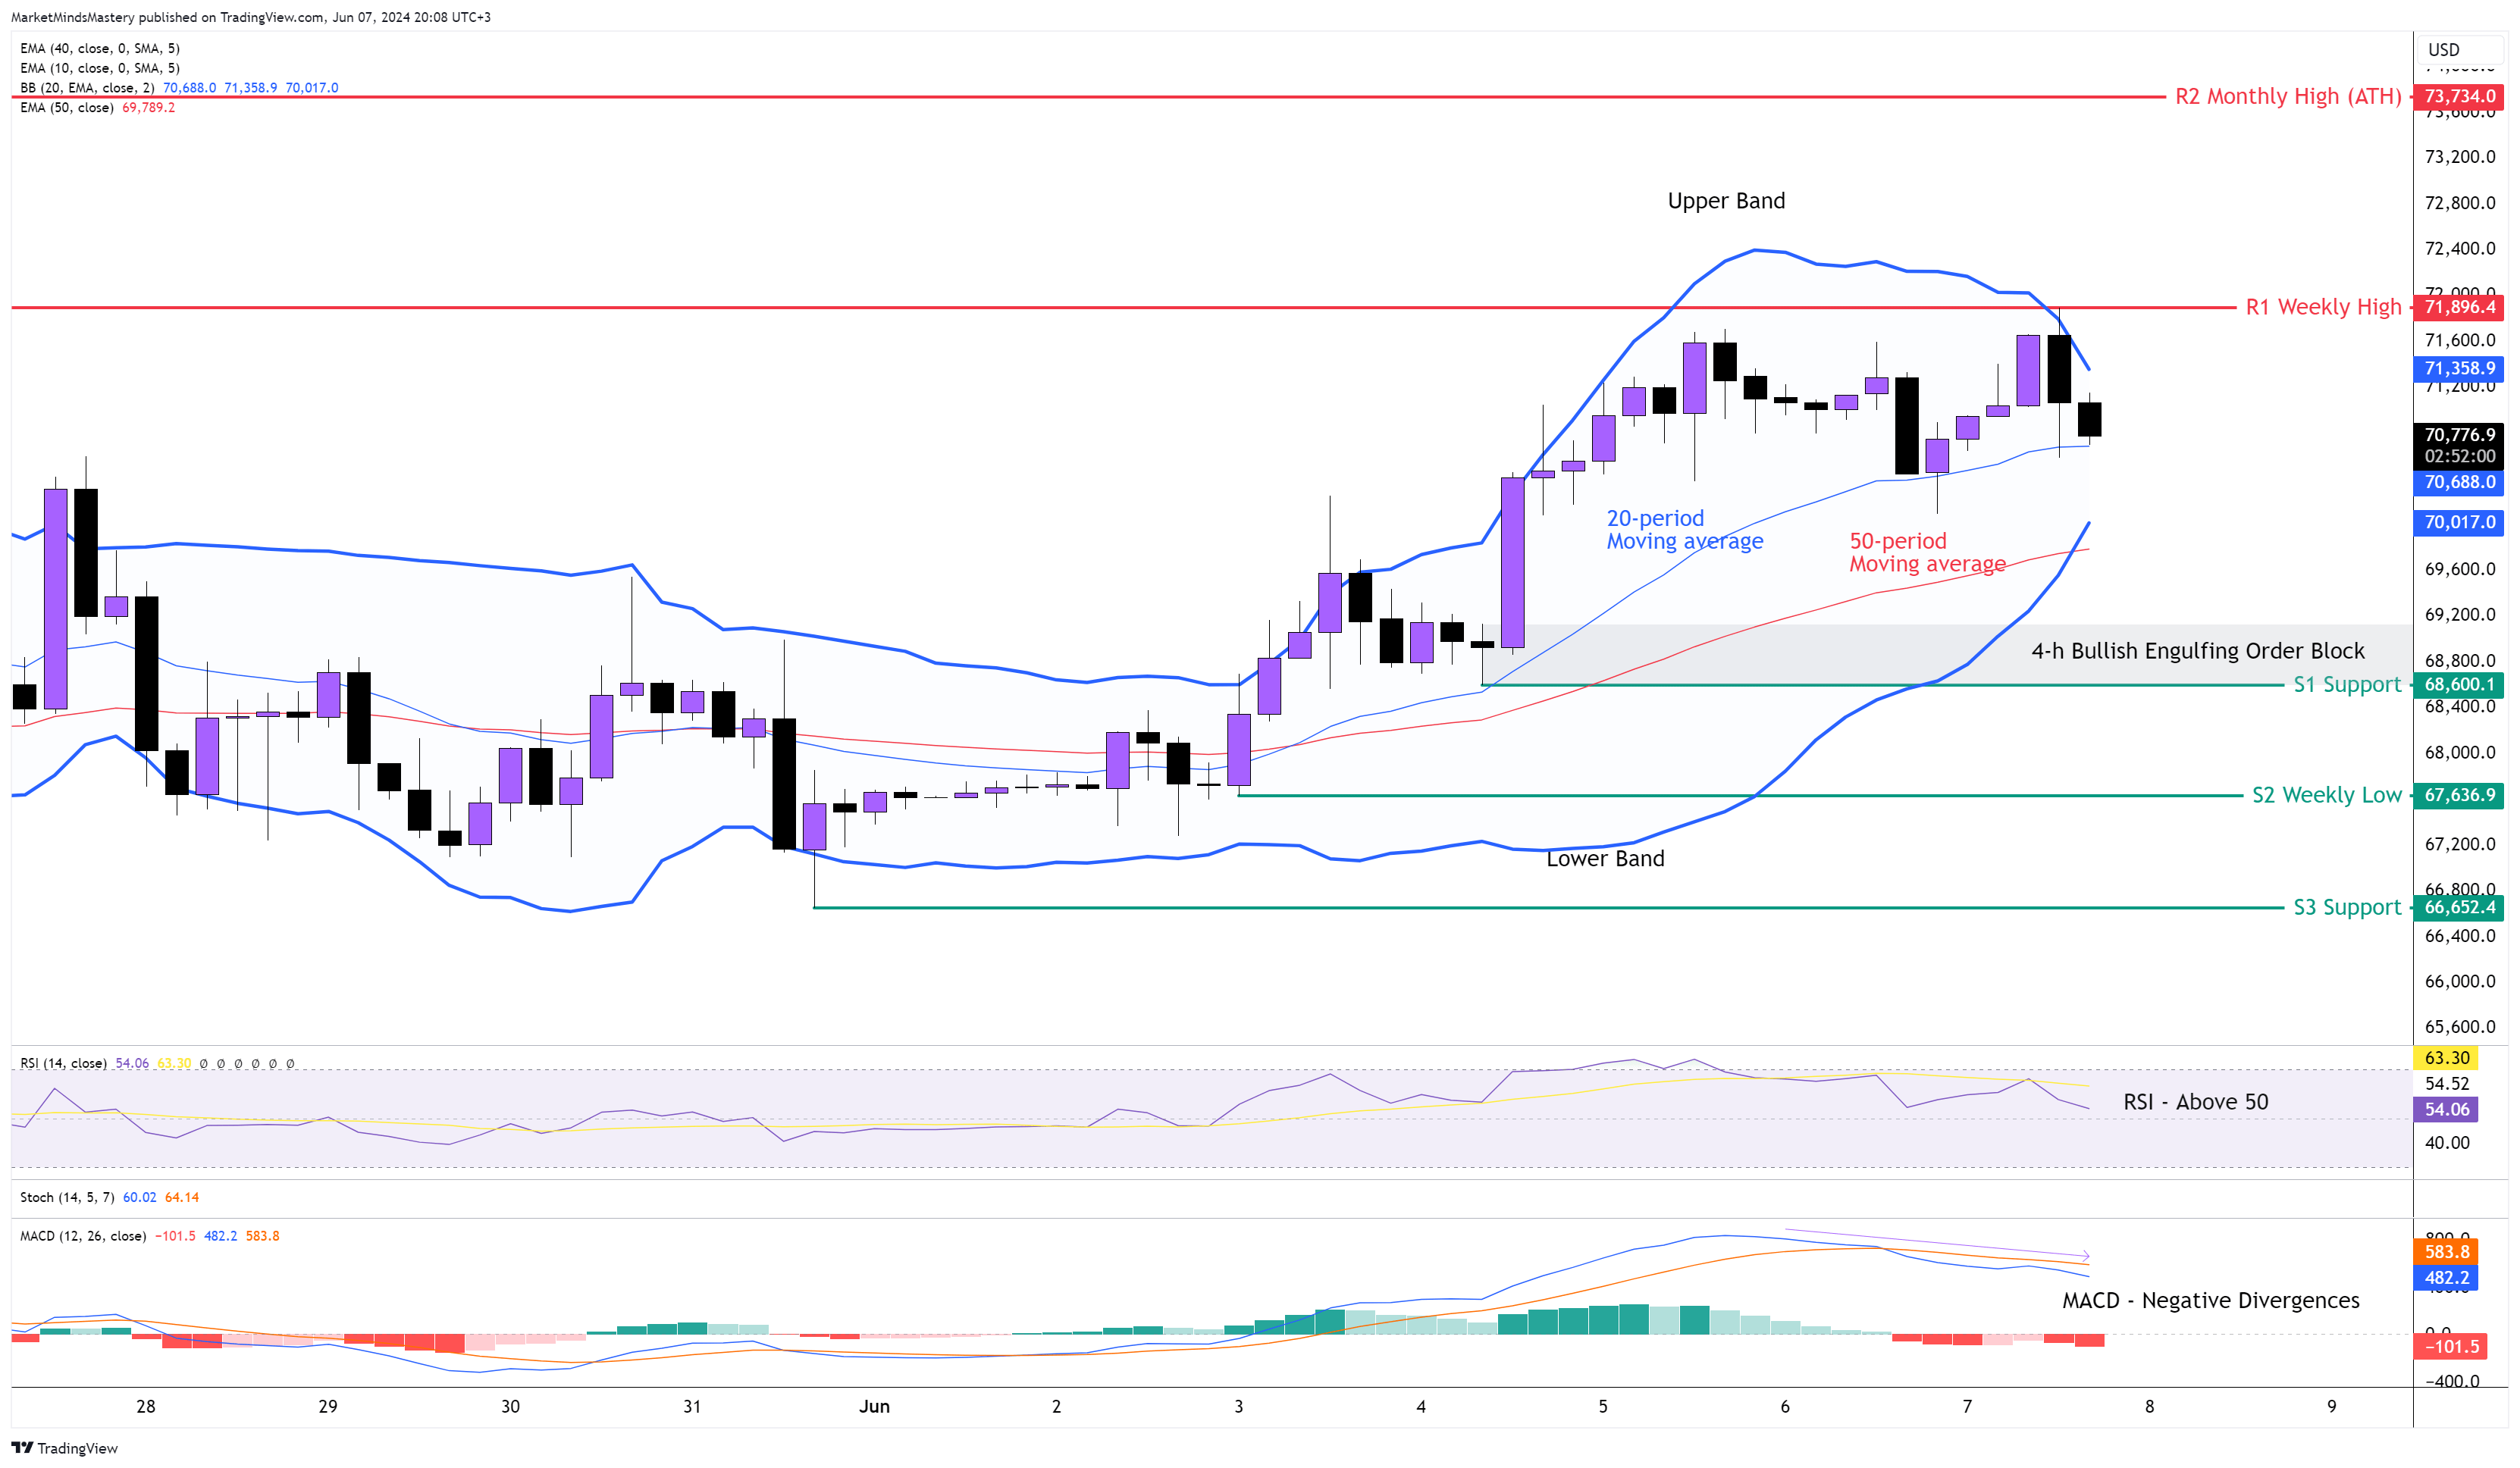
Following the Symmetrical Triangle pattern formed last week, the price of Bitcoin broke above the upper line and moved upwards as expected. The price respected all the levels we marked on the previous week’s analysis, and the price was rejected from the monthly level of around $72,000.
The price, in this timeframe, is in an uptrend. Based on the swing analysis, the market didn't break any major structure. However, based on the Bollinger Bands, the price lacks momentum, and it shows in the bands as the upper band declines and the lower band increases. The price squeezes within the bands, and significant momentum should accompany a breakout.
The 20-period is above the 50-period moving average and is a bullish indication. The RSI shows a bullish market as it is above its middle line of 50. The MACD shows Negative Divergences, indicating that the last upward move lacks momentum compared to the preceding one.
If the price continues moving upwards, the first resistance area, R1, will be approximately $72,000, which is the previous week’s high. If it closes above the R1 and moves upwards, the next resistance area, R2, will be the ATH (All-Time High) just below $74,000.
On the other hand, if the price declines and moves downwards, the first support area, S1, will be $68,600. At that level, there is a Bullish Engulfing Order Block. If the price breaks below the S1 and declines more, the next support area, S2, will be around $67,630. A level that was the previous week’s lowest price. Underneath that, we find the support area, S3, around $66,650.
SP 500 4H
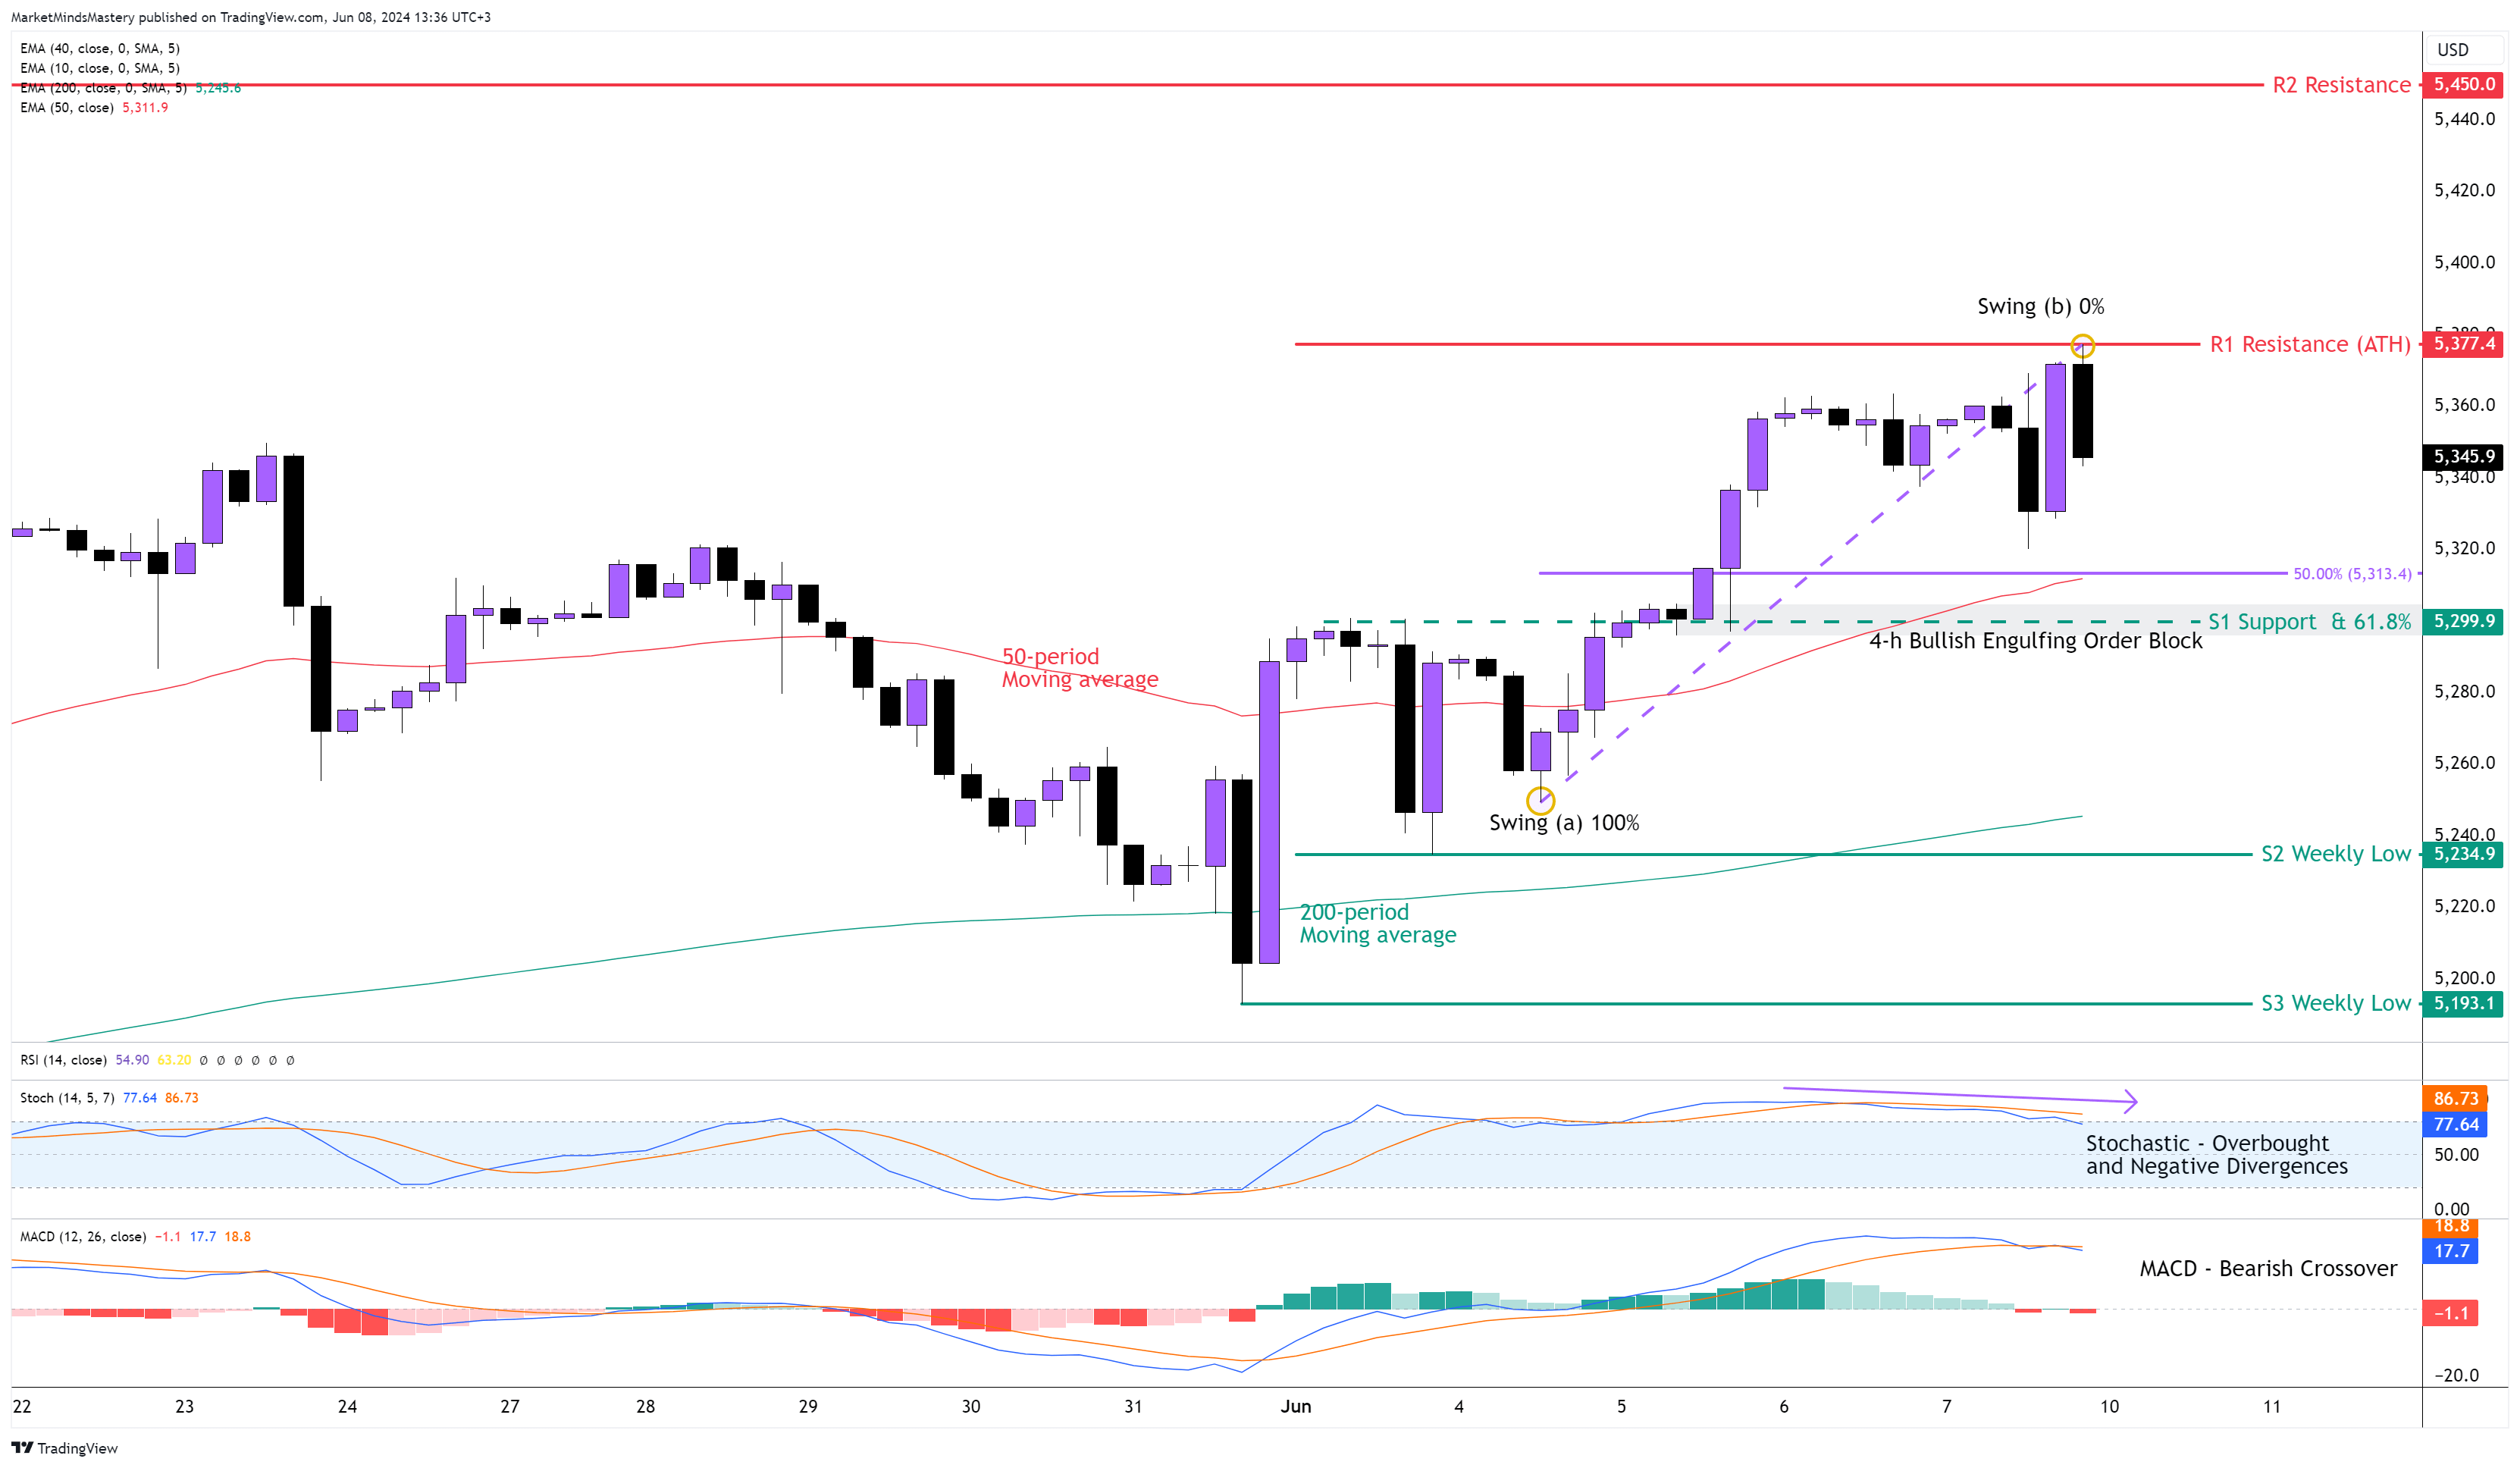
In the last week, the SP500 performed exceptionally well, creating a new ATH (All-Time High).
The overall market is in a strong uptrend. The week it ended with a bullish candle that could not close above the previous candle's high on the weekly chart.
On the 4H chart, the price is made as a higher high and higher low formation hence, a retracement is expected. The 50-period is above the 200-period moving average, indicating a bullish trend.
The Stochastic Oscillator is in an overbought condition and shows Negative Divergences. The MACD showed a Bearish Crossover as the MACD line (blue) crossed under the Signal line (orange). These kinds of indications can set the market for a temporary retracement. If the price retraces all the original moves, then it will likely cause a market reversal.
If the price moves downwards, the first support area is a confluence of the inside support at S1, the 50-period moving average, the 4H bearish Engulfing Order Block and the 61,8% Fibonacci level. If the price doesn’t bounce off from this level to continue the uptrend and declines further, the next support area, S2, will be the previous week’s low, around 5235. If the price declines further, the uptrend move is over, and the next support area, S3, becomes an old weekly low of around 5193.
On the other hand, if the price moves upwards, the ATH will become the first resistance R1, around 5377. A further upward move can find the price to reach a new ATH, possibly around 5450.
US 30 4H
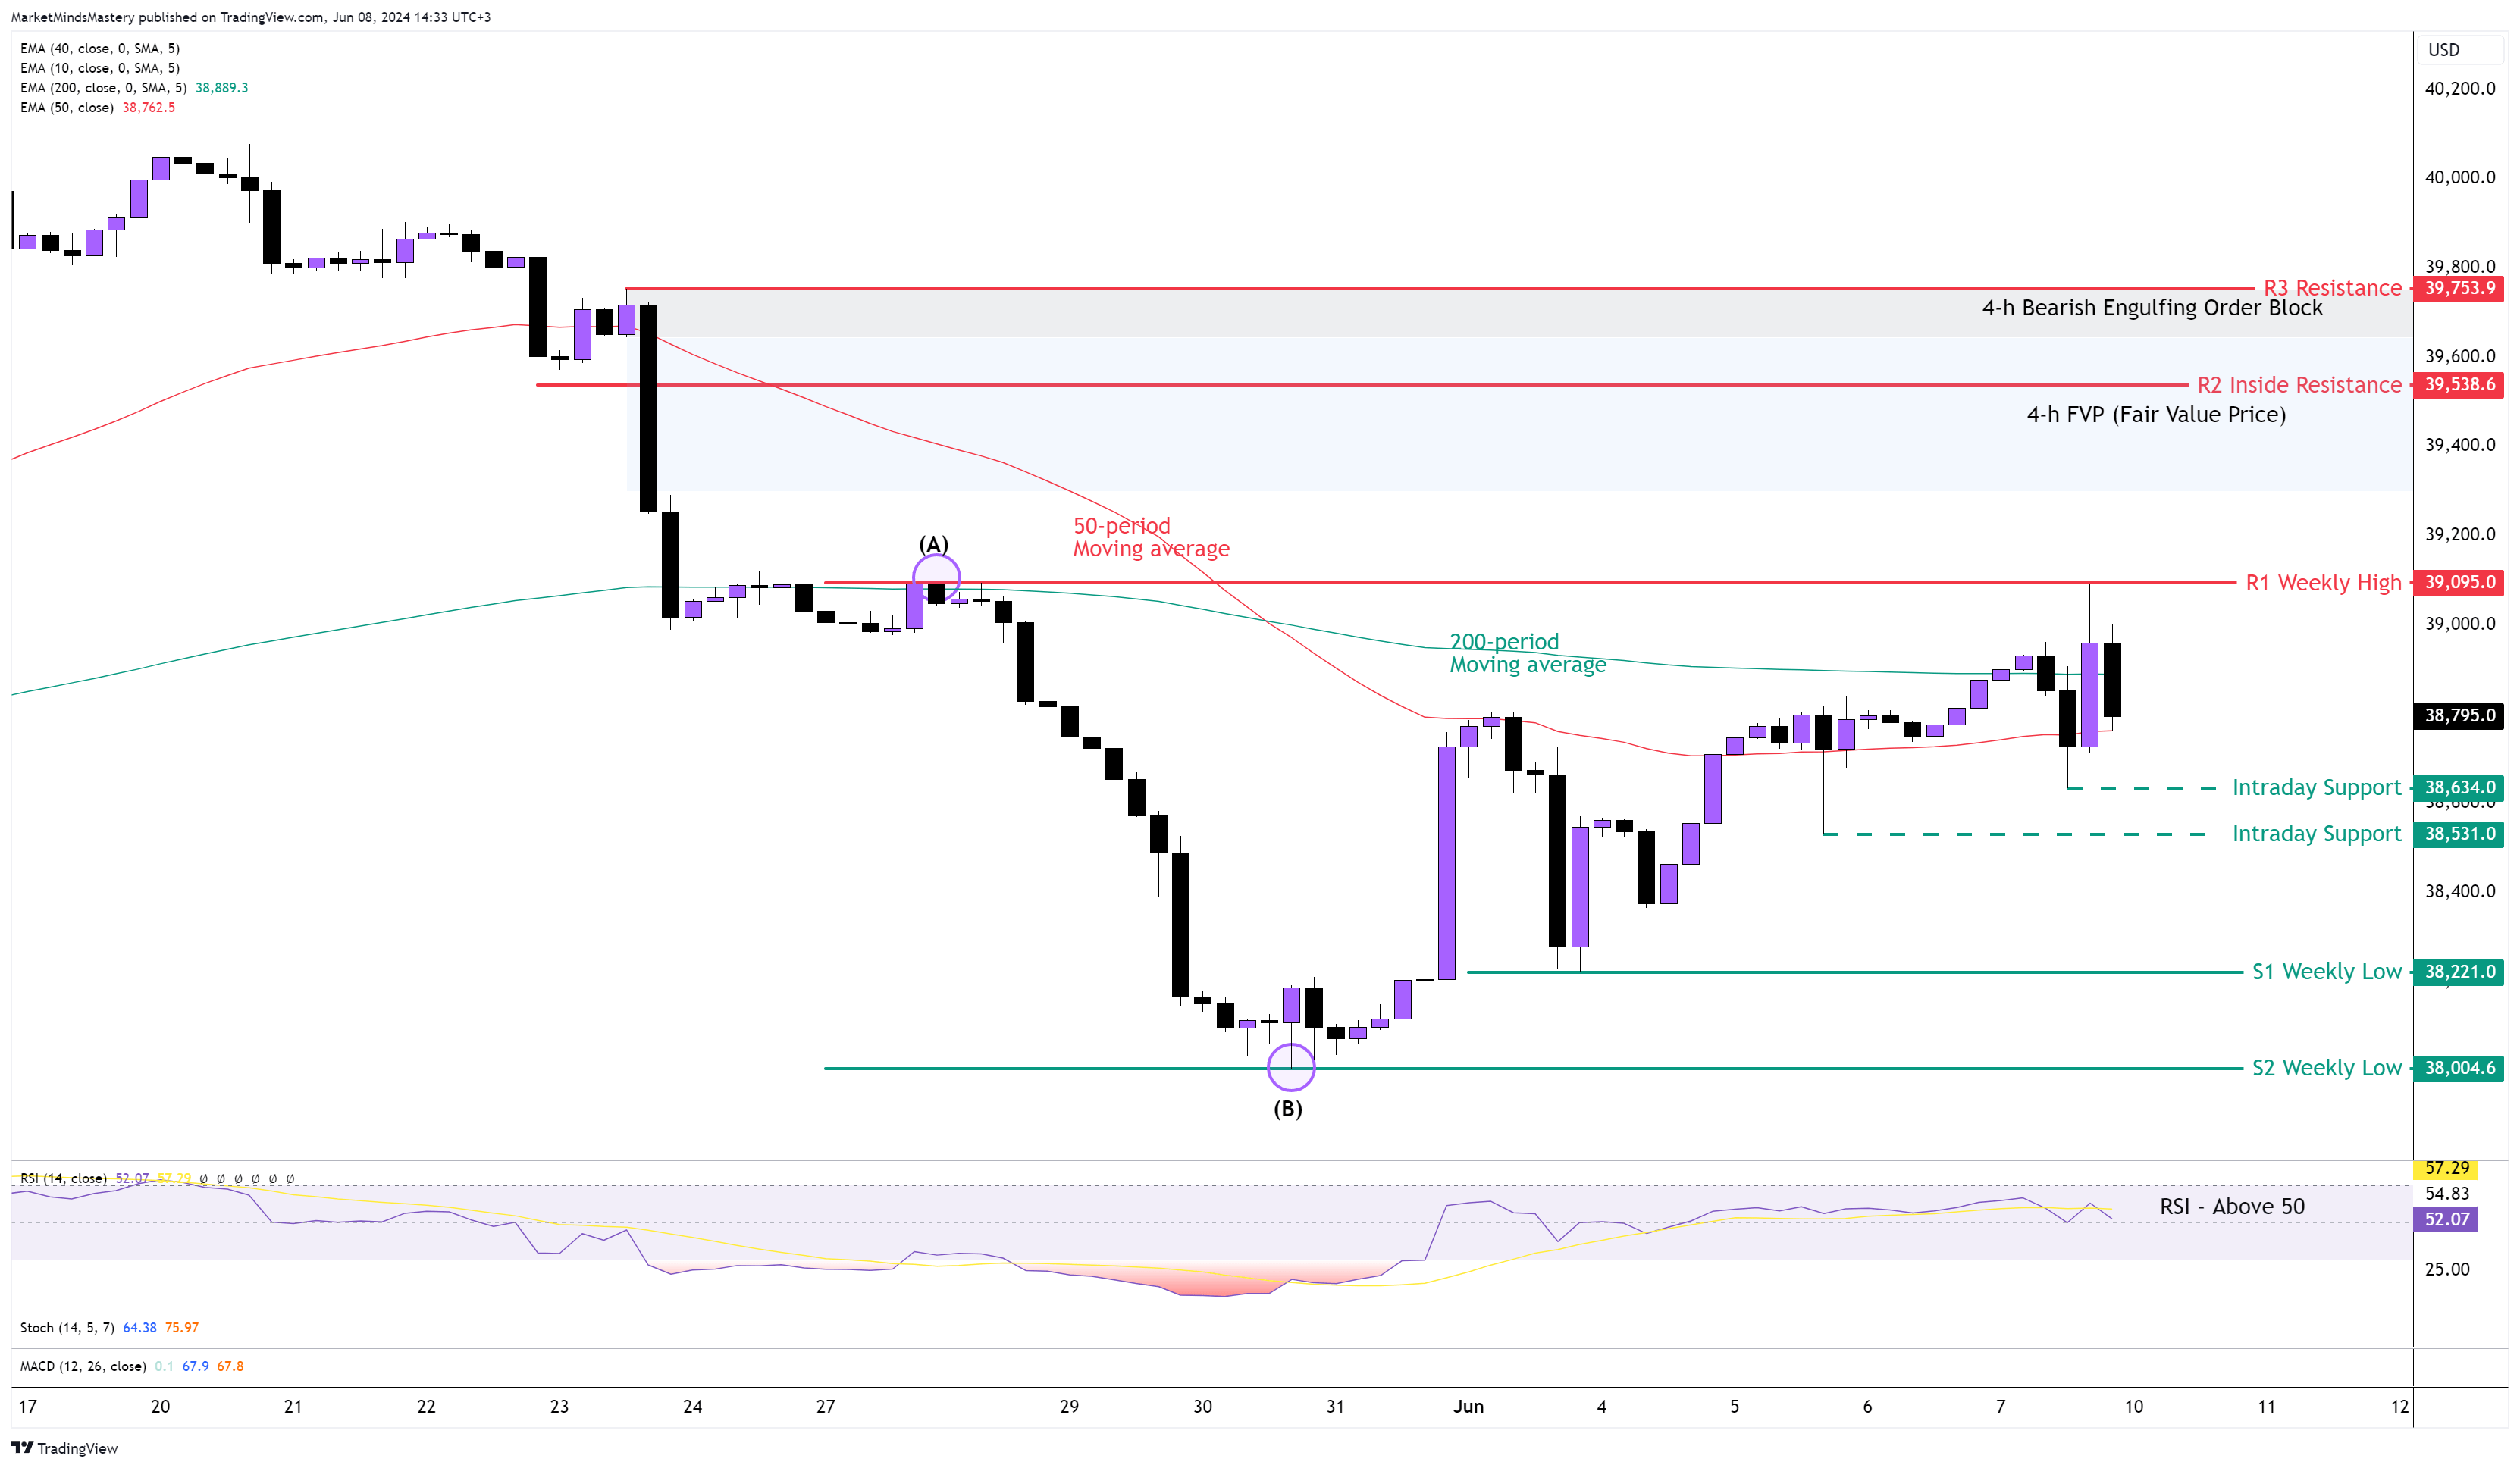
Last week, the price was trading within the previous week’s candle’s high and low, and it ended up as an inside doji candle.
On the 4H chart, the price was retraced back to fill up the FVP (Fair Value Price) as we had marked on the previous week’s market outlook.
Currently, the price trades within the 50-period and the 200-period moving averages.
The RSI Oscillator is above 50, indicating a bullish market.
On the 4H chart, the market structure hasn’t changed, as we consider the major swing high at point A and the low at point B valid as the price didn't penetrate them. We can interpret this as a downtrend. However, considering the weekly chart is in an uptrend, we must approach this cautiously.
If the price is rejected and moves downwards, the first support area, S1, will be the previous week's low, around $38221. If the price penetrates the S1 and moves lower, the next support, S2, is around the round number of $38000, which is an old weekly low.
Oppositely, if the price increases and moves upwards, the first resistance area, R1, will be around $39095, which is the previous week’s high. In case it surpasses the R1 and moves higher, it can fill the FVP until it reaches the next resistance area, R1, around $39538. This can be a significant resistance area as it is an inside and right under a Bearish Engulfing Order Block.
GER 30, 4H
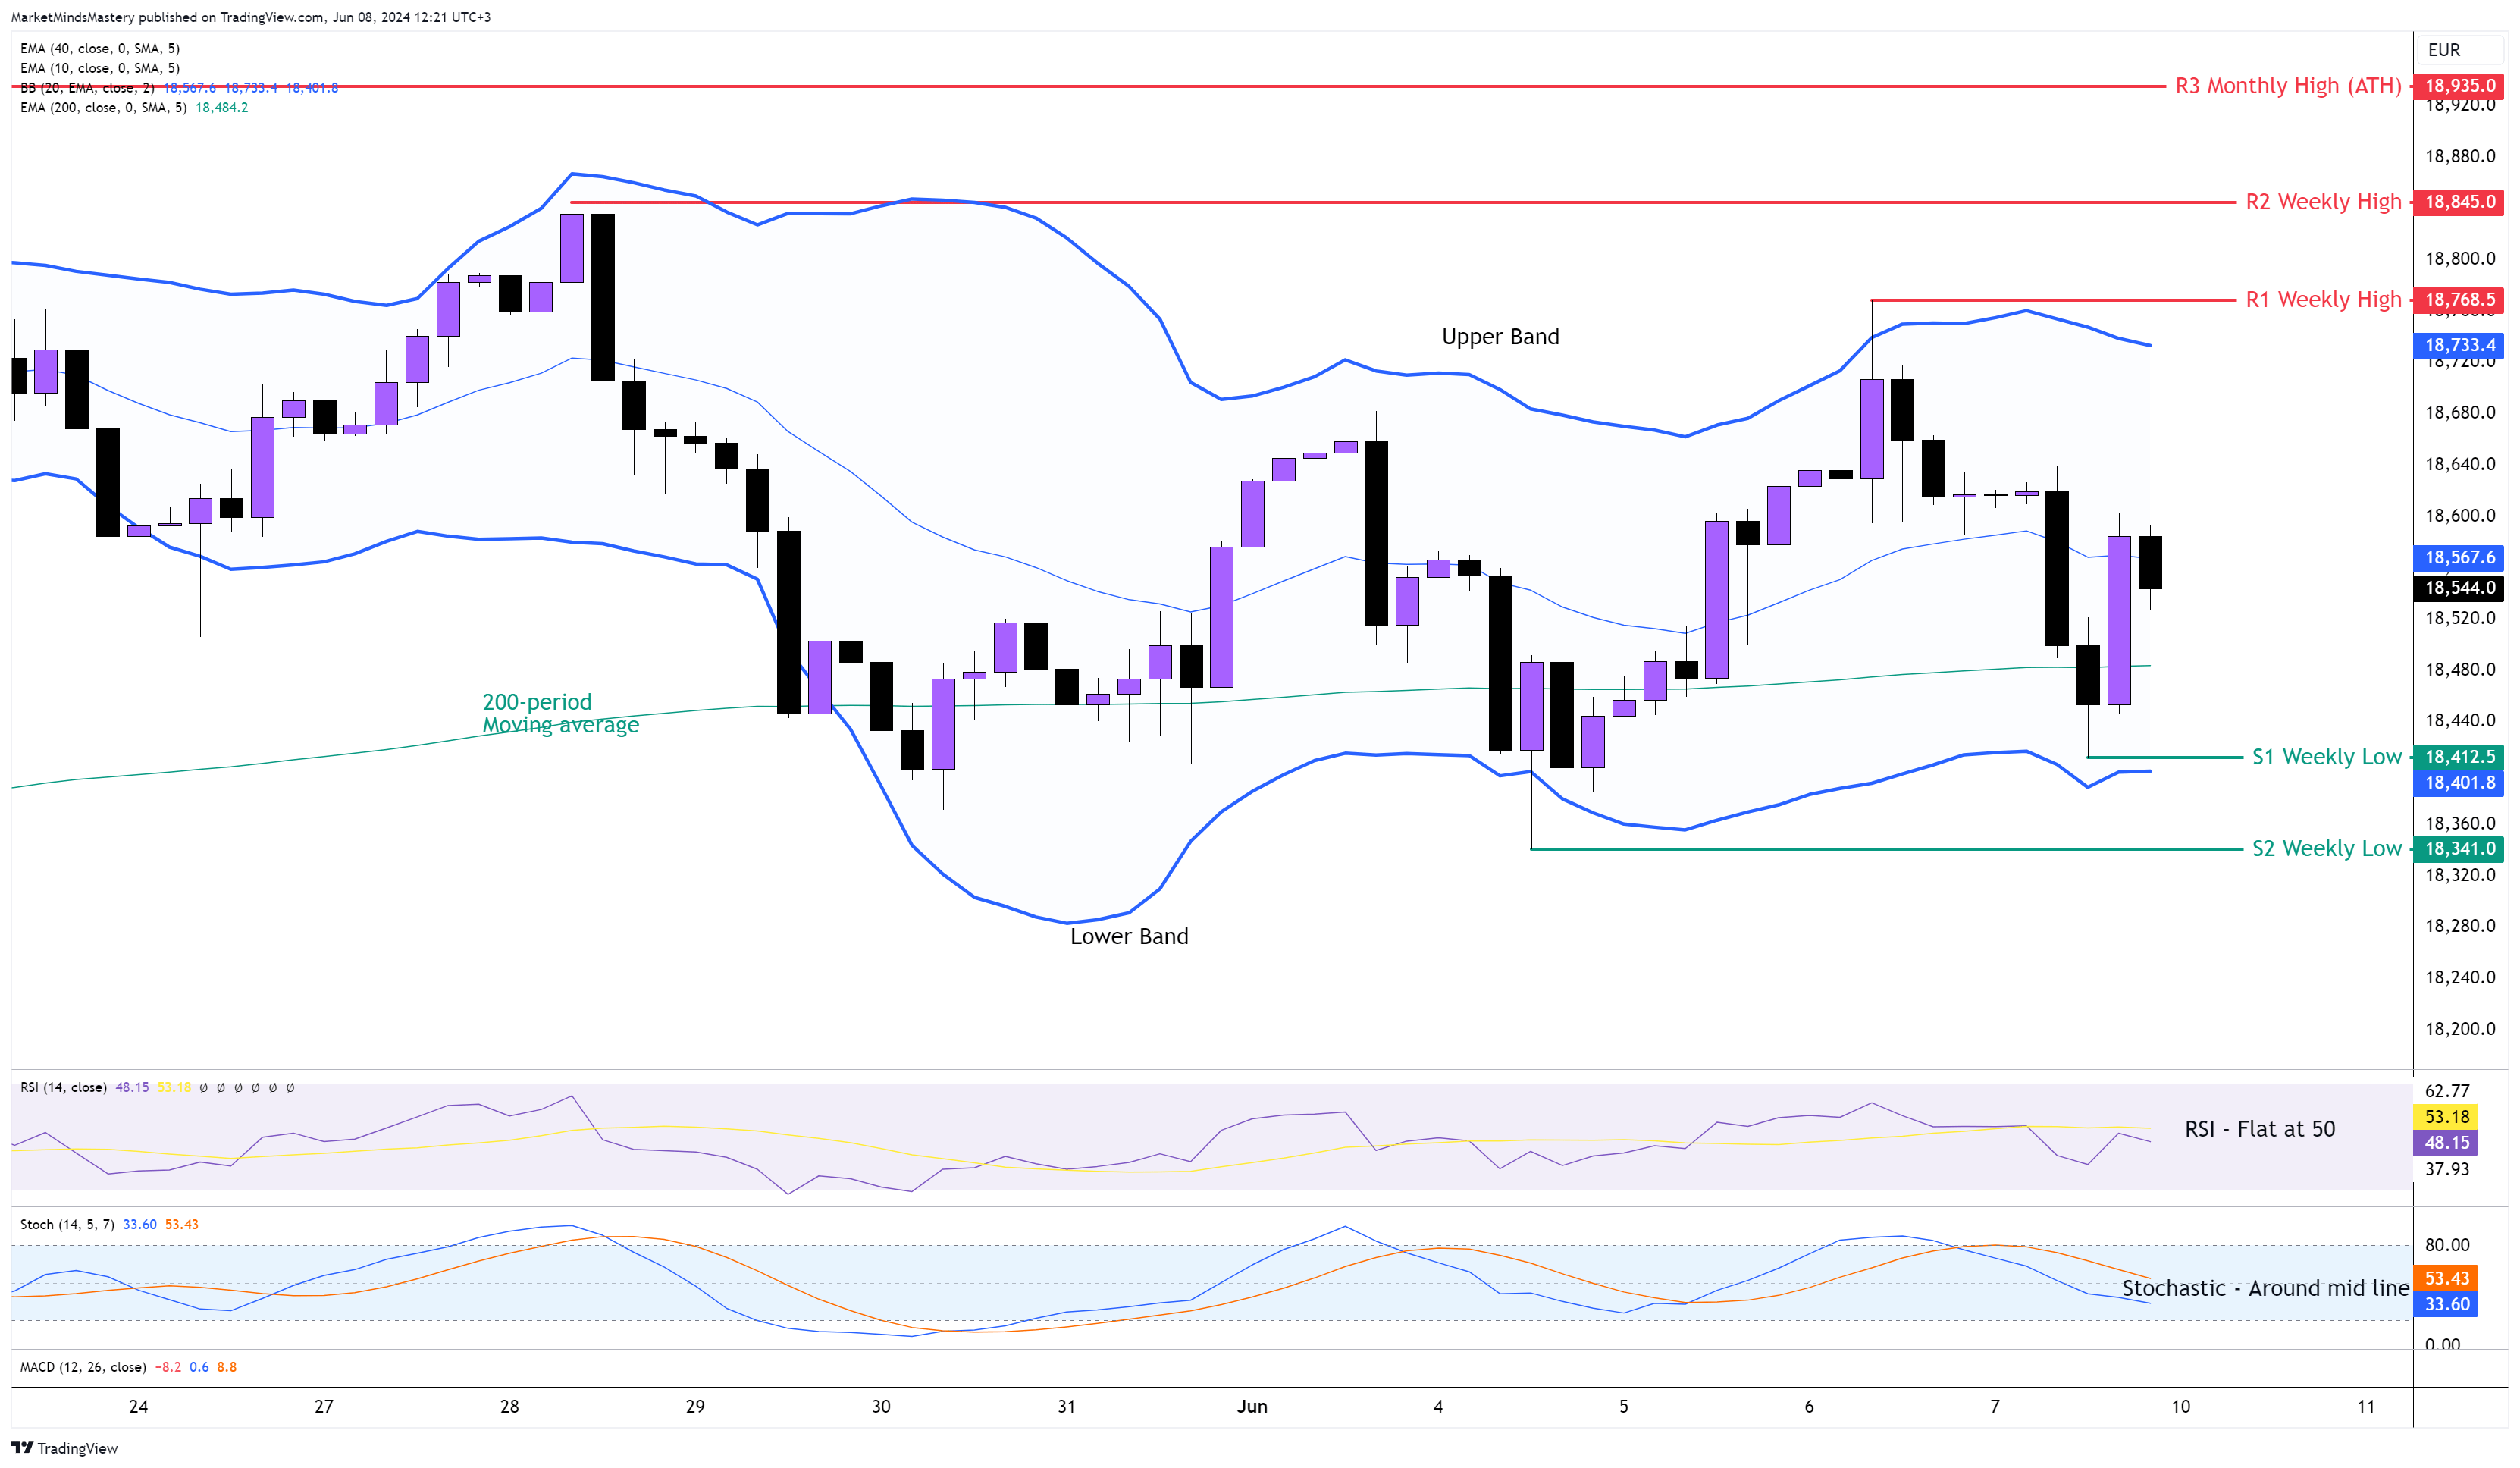
The 4H Bullish and Bearish Engulfing Order Blocks from last week were held throughout the week, and great trading opportunities arose.
In the last four weeks, the price traded within a Bullish Marubozu candle that created the ATH.
On the weekly chart, the price created a Doji candle while it remained inside the previous candle's boundaries.
The price didn’t make any directional move. Therefore, the market is considered a range market on the 4H chart.
The price currently is at the middle line of the Bollinger Bands, which is the 20-period moving average. The 200-period moving average shows more long-term price behaviour, and as the price is above it, it indicates that the long-term bias is bullish.
Both Oscillators, the RSI and the Stochastic, are flat around their middle lines, confirming the ranging price behaviour.
If the price breaks out of the upper band and moves upwards, the first resistance area, R1, will consider the previous week’s high around 18768. If the price penetrates the R1 and moves higher, the next resistance area, R2, is an older weekly high around 18845. A move above the R2 finds the next resistance area, R3, the ATH approximately at 18935.
On the other hand, if the price moves downwards, the first support area, S1, will be the previous week’s low, around 18412, which also consists of the lower band of the Bollinger Bands. A further price rejection finds the next support area, S2, around 18341.
👉 Click here to check our Challenges
👉 Don’t miss our Free Live Webinars
👉Join us on Discord
Risk Disclosure:
The Trading Pit offers only demo accounts to all users within the Challenges and Signal Provider Agreements (Scaling Plan). All assets and trading activities are purely virtual. Please note that we do not offer CFD (Contract for Difference) challenges to residents of Canada and the United States. All content and information on this website is for informational purposes only and should not be interpreted as financial advice. Also, remember that results achieved in the past are no guarantee of future results. It is essential to understand the risks associated with trading. If you are unsure, always consult an independent financial advisor.