There were a few surprising events last week that marked all the market moves last week. The most surprising was the drop in the Intertest Rates in New Zealand. We mentioned in the previous week's Market Outlook that we expected almost all the major banks to drop their rates in the next quarter, but the Kiwis were a surprise. From Tuesday onwards, the Sterling showed a strong bullish bias after the Unemployment Rate was reported in the UK as much less than what was forecasted. This helped the Great British Pound to advance over most of the currency pairs across the board. The Australian’s employment change exceeded expectations, and the Aussie gained significant strength. In many currency pairs, the macroeconomic and price charts were converging, and this offered high-probability trading opportunities for day traders and swing traders.
On Monday, the markets are expected to have normal volatility, as there will be no significant news that will directly affect any currency. The FOMC Member Waller's speech will take place during the New York Trading Session and the US Conference Board Leading Indicators. On Mondays, the markets usually “digest” the price moves of last Friday. Additionally, all Traders, especially day traders, need to pay attention during the markets' open and during the Ovel lap sessions due to the political updates during the weekend.
On Tuesday, during the Tokyo trading session, the Loan Rate in China will be reported, along with the forecast estimates for both 1 and 5 years to maintain it at 3.35% and 3.75%, respectively. Only half an hour later, in Australia, the RBA (Reserve Bank of Australia) will have its Policy Meeting Minutes. We will likely find out if they are interested in dropping their interest rates, as last week, the RBNZ (Reserve Bank of New Zealand) did. The next important event will be in Europe. In Germany, the PPI (Producer Price Index) is expected to report at the current rate of 0.2%. Although this can directly affect the Euro currency, it is not an event that can create a significant change in market structure in the price charts. Next will be the Trade Balance report in Switzerland. The forecast shows a decrease from 6.1B to 5.44 B. Usually, trade balance events attract significant amounts of volatility in the markets. It will be interesting to see how the Swissy will react after this event, as last week, the Swiss Frank was among the weakest performance currencies. A while later, the SNB (Switzerland’s National Bank) Chairman Jordan will give a speech. Usually, he gives us some clues on how they see the overall economic situation within Switzerland and the inflation rate, and we can understand if they will proceed with an Interest Rate cut next month.
Moving into the New York trading session, in Canada, they will report the CPI (Consumer Price Index). This can be one of the most attractive events for traders today because the forecast estimates a significant drop from 2.9% to 2.4%. If the actual report confirms the forecast, such as a 0.5% reduction in the CPI, the Canadian Dollar is expected to weaken. If the market follows through, we will observe significant price moves in the price charts. For example, the AUDCAD currency pair’s primary trend is up. This event can increase the odds of the AUDCAD uptrend continuation. The same happens with the EURCAD and GBPCAD. The primary trends are up, and a noticeable weakness in the Canadian Dollar can help maintain the uptrends. The last important event for the day will be the Weekly Crude Oil Stocks in the US.
Wednesday is also expected to be a short week in terms of news events, with the second out of the two being enough to keep trades alert all day. The first one is the Trade Balance in Japan. The forecast shows an improved number this month. From -0.82 T to increase to -0.73 T. As a country heavily dependent on imported products, Japan’s currency usually fluctuates with noticeable volatility during this event. All eyes and trade's attention will be on the last event, the FOMC Meeting Minutes in the US. The closer we get to the US Presidential Elections, the more volatile this event is expected.
Additionally, due to all the political and geopolitical changes around the globe happening every week, the “standard” expectations throughout this event are not applicable. Hence, we must pay close attention to how the FOMC members see the economy and what procedures they will take upon making the interest rate decision in the middle of September.
In the next few days, volatility is expected to pick up in the markets. On Thursday, during the Sydney trading sessions and just one hour before the Asian trading activity begins, the Manufacturers, Services, and Composite PMI (Purchase Manufacturing Indexes) will be reported in Australia, with all of them expected to remain around their benchmark of 50. The same three indexes will be reported in Japan, and they are also expected to report around 50. Moving into the London Trading Session, in the Eurozone, the Manufacturing PMI is expected to be reported around 46, the Services PMI around 51.9 and the Composite PMI around 50.3. The same three events will be reported in the UK thirty minutes later. The Manufacturing PMI is expected to be reported at around 52.8, the Services PMI at around 52.1, and the Composite PMI at around 52.5. As long as the numbers exceed 50, which is used as the benchmark, the currencies are expected to be positively impacted by the outcome. Oppositely, if the Indexes drop below 50, it can harm the relevant currency. Moving into the New York trading session, in the US, the weekly Initial Jobless claims are expected to increase from 227K to 233K. In case the actual report confirms the forecast, this is definitely a negative sign for the US Dollar as more people are seeking to claim benefits from the Government. The Dollar Index is in a downtrend as per the primary trend, and this can add to the Greenback’s weakness, advantaging the Euro, The Aussie and the Sterling. The next three events in the US will be the Manufacturing PMI, which is expected to be reported at around 53.7, the Services PMI at around 49.5, and the Composite PMI at around 54.
The last important event of the day will be the Existing Home Sales in the US. As per the consensus, the previous report at -5.4% is expected to be significantly imported, always as per the forecast to 0.3%, something that can positively impact the US Dollar.
The Jackson Hole Symposium started today. It will last three days and take place in Kasan City, which is close to the press.
The Jackson symposium will continue for the second day (out of the three days) on Friday. Early in the morning, during the Asian (Sydney) trading session in New Zealand, they will report their Retail Sales. The forecast estimates a significant drop in the number from 0.5% to -1%. Based on the previous week’s rate cut by the RBNZ, if the retail sales number is equal to or less than the forecast, this will be a catalyst for more weakness in the Kiwi. In this case, the NZD against the USD, the AUD, the EUR, and the GBP can be the weak currency of the pair. The next important event will be in Japan. The CPI (Consumer Price Index) is expected to be reported at 2.7% compared to the 2.6% from the previous report. A confirmed report like this can push the Japanese Yen to a higher price. The Japanese Yen is always the second currency in every currency pair. This means that if the yen strengthens, the price charts that have the Japanese yen as the quoted currency will drop. Afterwards, the BoJ Governor Ueda and the Japanese Finance Minister Suzuki will give a speech. The volatility during the London session is expected to be as normal as there won't be any important news announcements. However, during the New York trading session, markets are expected to pick up. In Canada, Retail Sales are expected to improve, as the forecast shows and from -0.8%, they are now increasing to -0.3%. Next, in the US, they expected improvement in New Home Sales from -0.6% to 2.3%. This can be good enough for some bullishness in the Greenback, but the most important market action will come after FED Chairman Powell finishes his speech. The trading day and week will finish with the BoE (Bank of England’s) Governor Bailey speech.
EUR USD 4H

The Doji candle shown in the weekly chart from last week's Market Outlook, in the content of the primary uptrend, didn’t cause the price to move downwards. Oppositely, the price followed the primary market’s direction and moved upwards. Following the 4-hour chart uptrend, the price kept increasing, and last Wednesday, it created a new higher high above the significant resistance level of 1.10000. The 20-period moving average is above the 50-period. The 50-period is above the 200-period moving average, and it is bullish. The RSI Oscillator is above its middle line of 50. The MACD is above its zero line, and it has bullish implications.
Starting Monday, if the price continues to move upwards, the first resistance area, R1, will be the previous week’s high, around 1.10474. As we can see on the chart, the price printed a Gravestone Doji reversal price action last Wednesday. If the price penetrates the R1 level and keeps increasing, the next resistance area, R2, will be 1.11396. This is a price level that was created from a weekly high price some time ago.
On the other hand, if the price declines and moves downwards, the first support area, S1, will be around 1.09496. In case the price penetrates the S1 and keeps lowering, the next support area, S2, will be the previous week’s low, approximately 1.09102. The Bullish Engulfing Order Block marked on the chart above is around 1.0920, and it can be an additional supporting factor for any price decline. A further downward move will find the next support S3, around 1.08814, which also coexists with the 200-period moving average.
GBP USD 4H
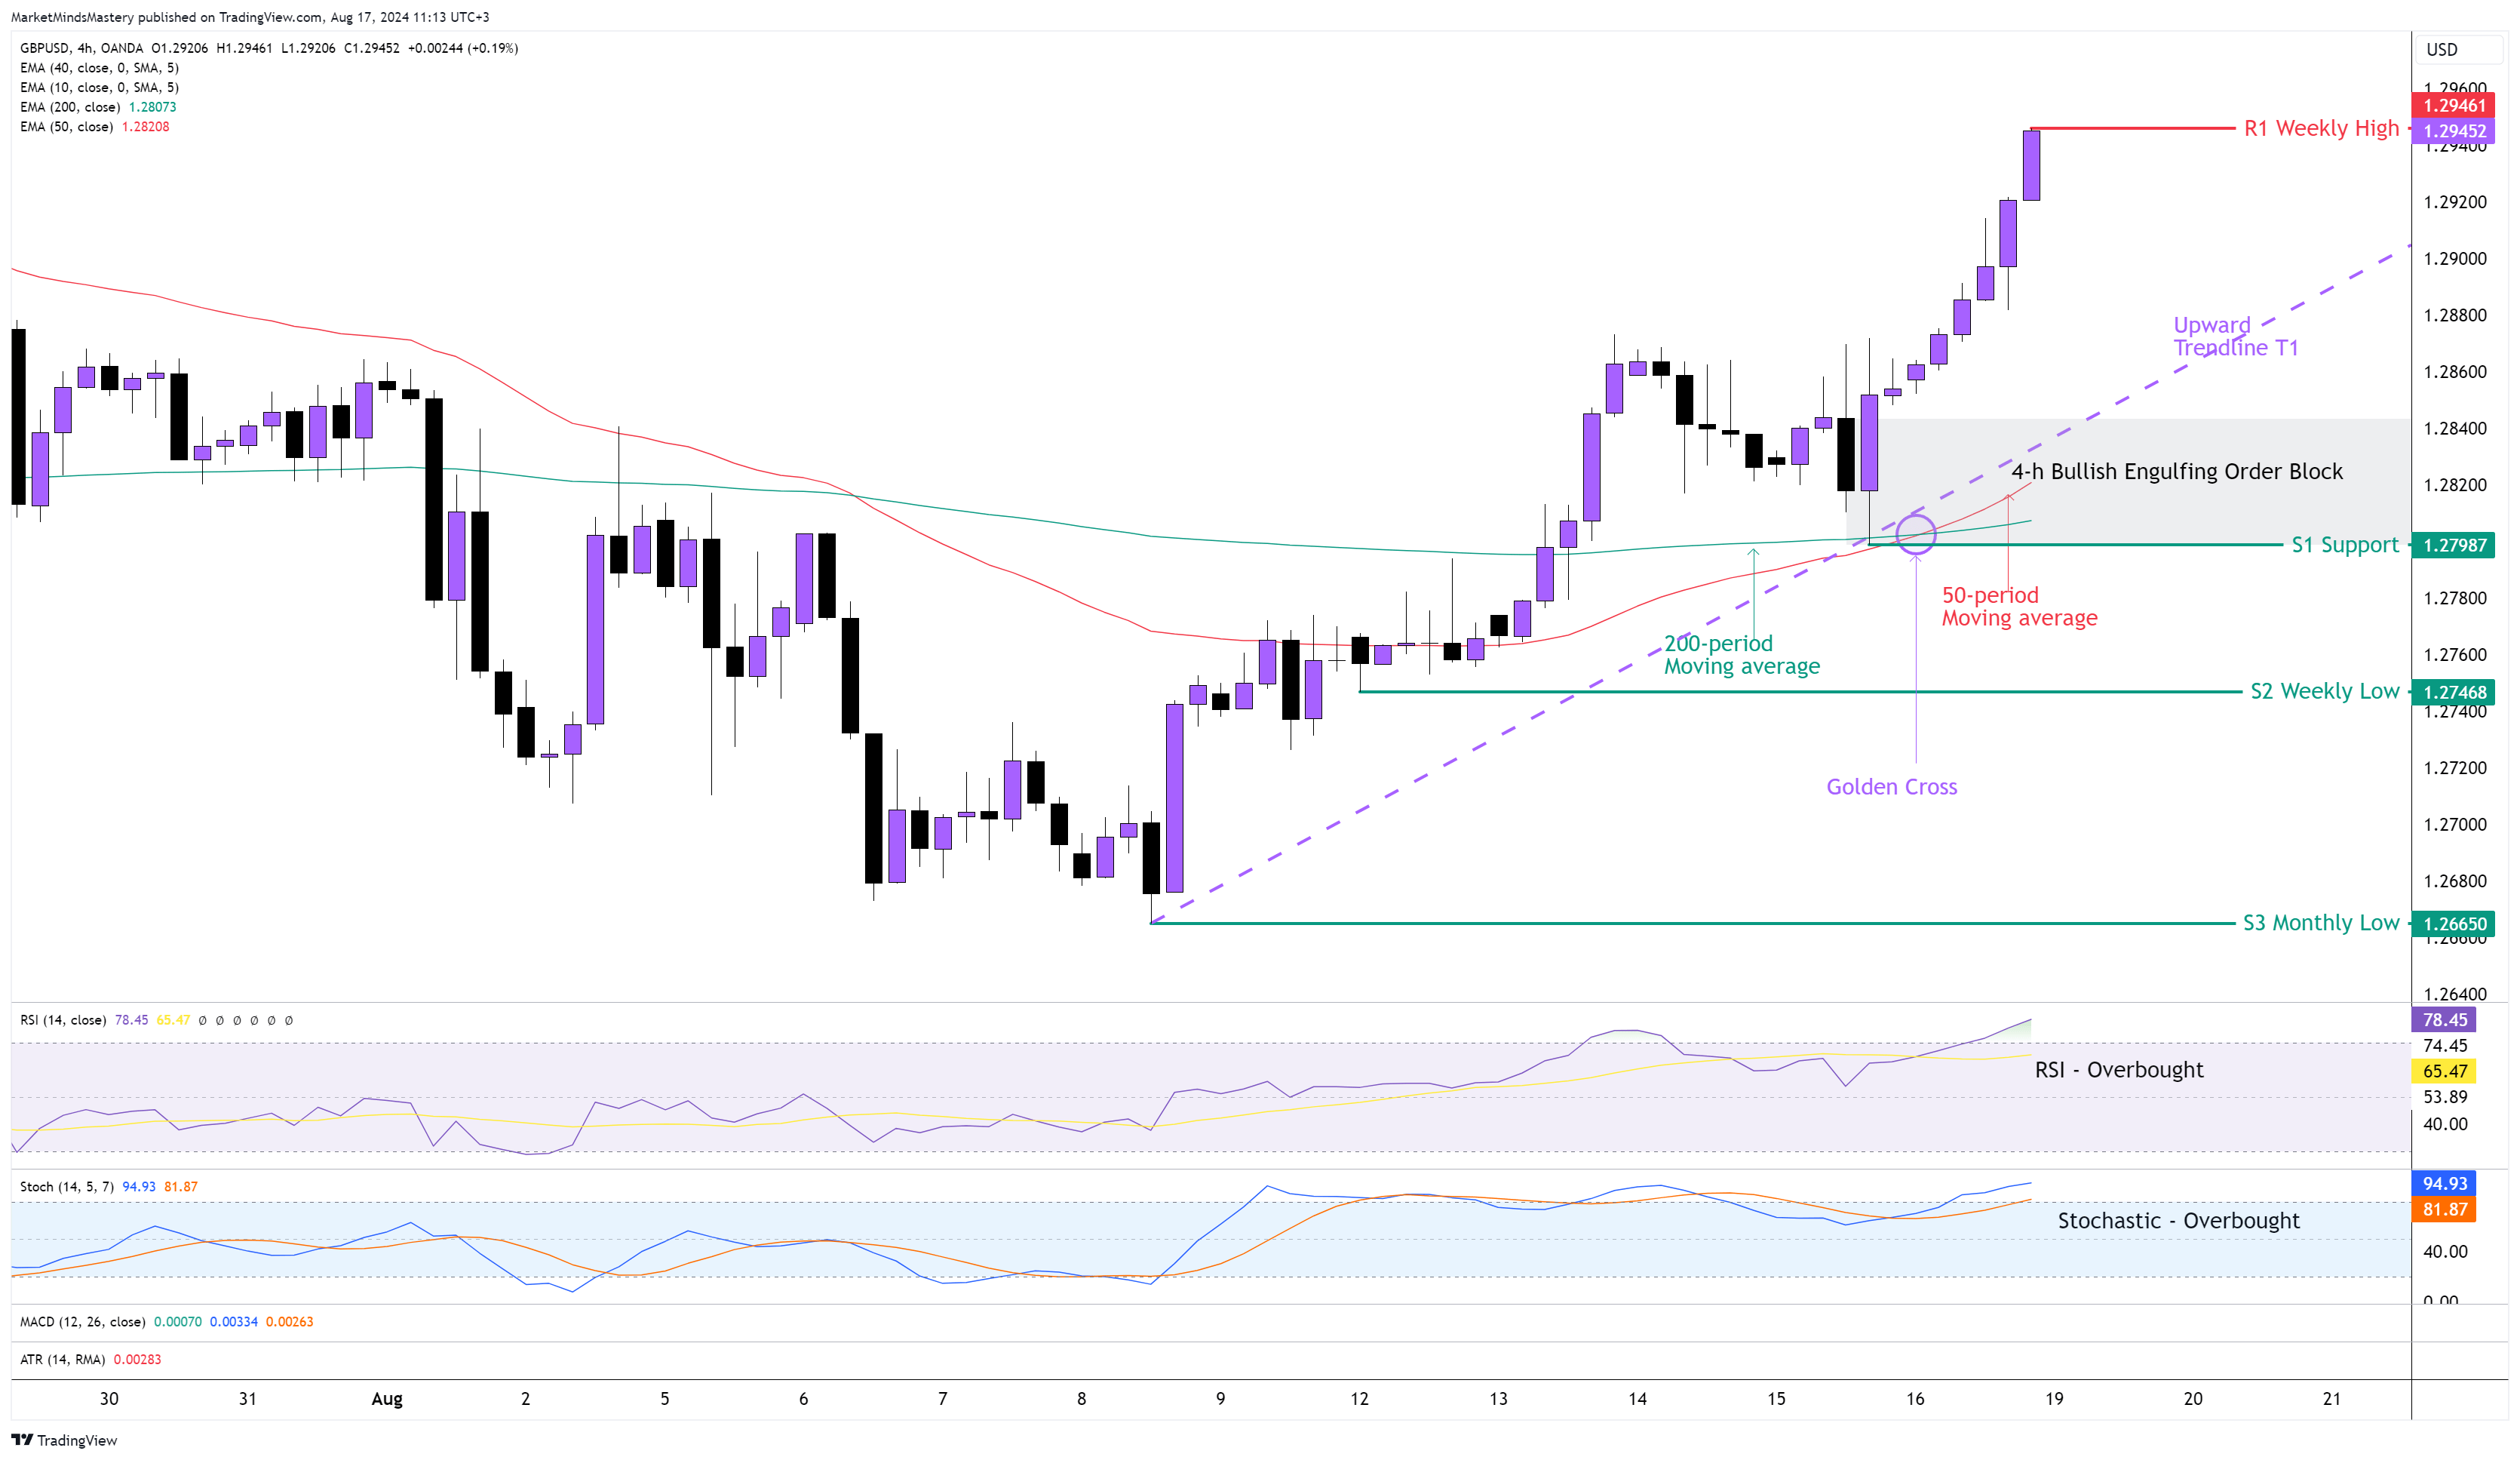
Following Sterling’s strength and the US Dollar’s weakness last week, the price of the GBPUSD ended the downtrend and reached a new high last Tuesday around 1.28700. The weekly chart printed a Bullish Marubozu candle, while the primary trend was an uptrend. Last Friday, the 50-period crossed above the 200-period moving average, known as the “Golden Cross“. Since then, the price has created a higher high and higher low formation. The RSI is in an Overbought condition, and this indicates the market's bullish strength.
Additionally, the Stochastic is above 80, which puts the Oscillator in an Overbought condition. Currently, the price is above the Valid Upward T1 Trendline. Drawing the Fibonacci retracement will be useful, but there is no confirmed swing high. Therefore, it can't be applied.
From Monday onwards, if the price continues to move upwards, the first resistance area, R1, will be the previous week’s high, around 1.29461. Suppose the price surpasses the R1 level and keeps increasing. In that case, the next resistance, R2, will be 1.3000, a round number that is considered important, and market participants usually look to place orders at that level.
Furthermore, if the price penetrates the R2 resistance and moves upwards, the next resistance area, R3, will be 1.30448. This is a high price level in the monthly chart created some time ago.
On the contrary, if the price is rejected and moves downwards, the first support area, S1, will be 1.27987. This price level consists of the static support, the Trendline T1, the Bullish Engulfing Order Block, the 50-period and the 200-period moving average. If the price penetrates the S1 and keeps lowering, the next support area, S2, will be the previous week’s low, around 1.27468. A further downward move finds the next support area, S3, at approximately 1.26650, which is the previous month’s low.
AUD USD 4H
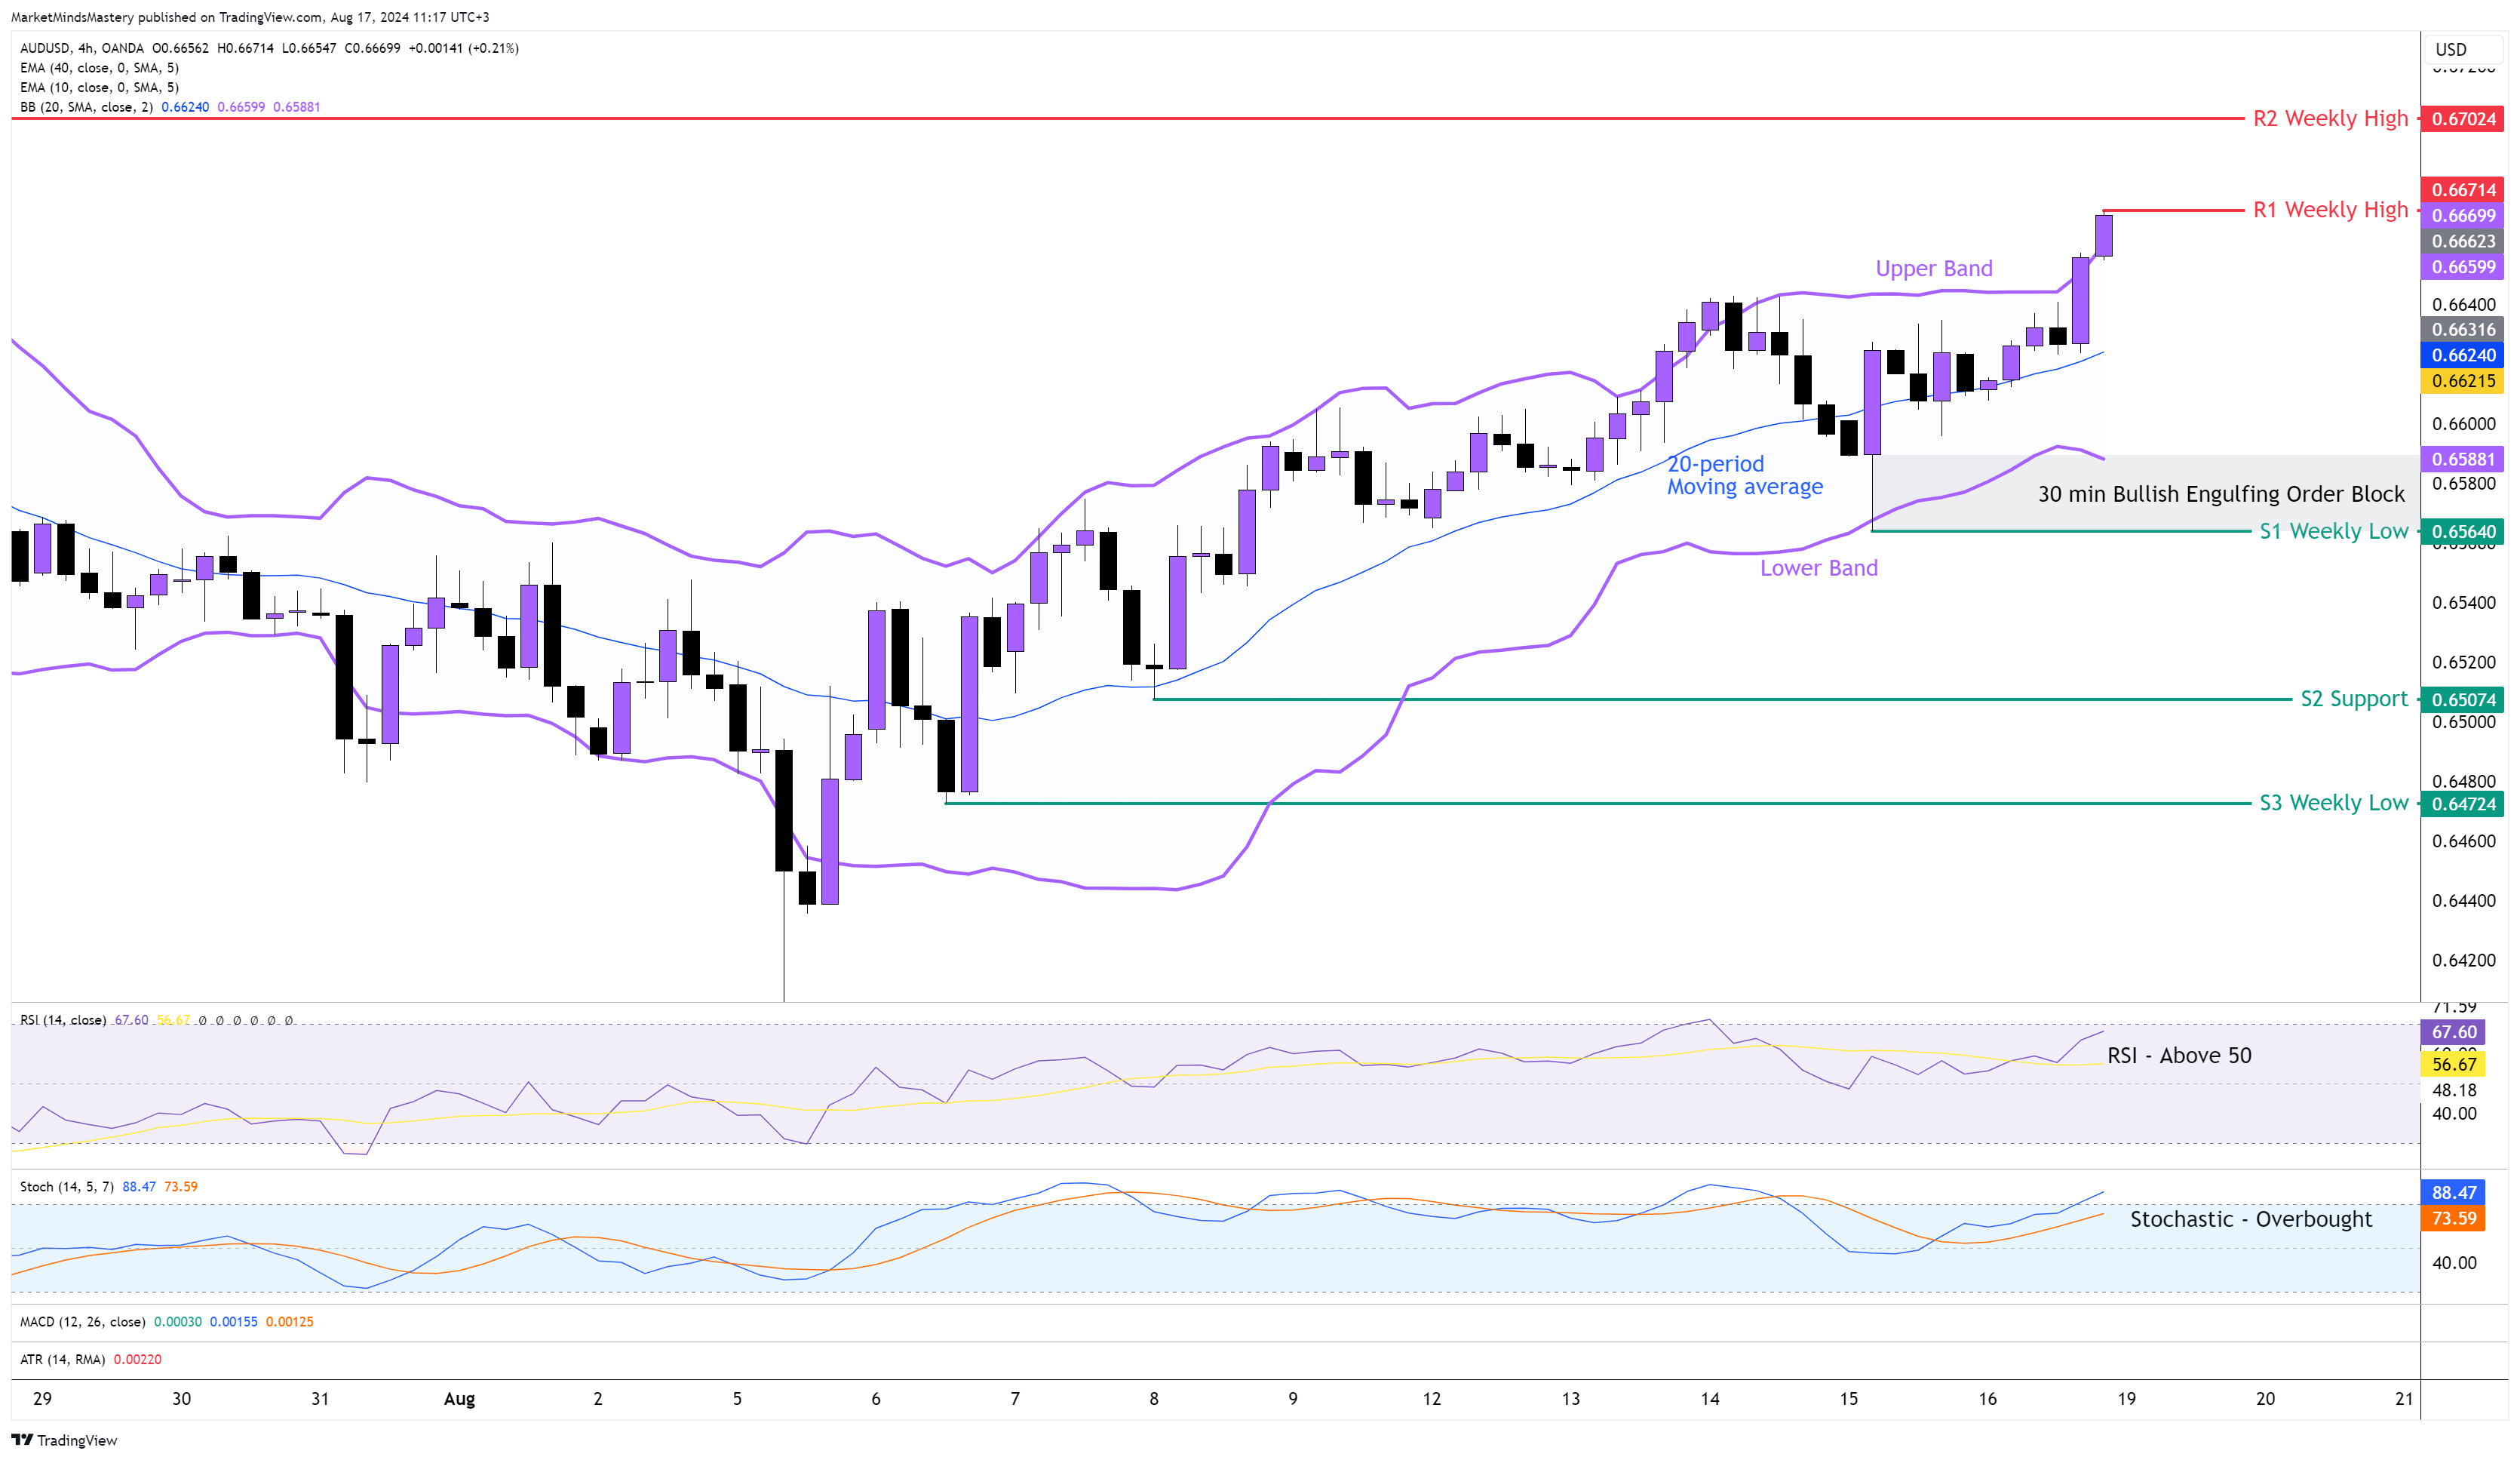
Based on the technical analysis and price action information, the AUDUSD was one of the most predictable currency pairs for the last week. The Weekly Bullish Engulfing combo price action with a Long Lower Wick rejecting a significant support level made it an ideal directional bias for primarily long entries on the lower time frames. Because of that, the 4-hour chart moved upwards in a cyclical formation, which means it created higher highs and higher lows. Using the Bollinger Band indicator, the price broke above the Upper Band, and simultaneously, the Lower Band turned down, and the Upper Band pointed up. This is a sign of a real breakout, eliminating the chances of this being a false breakout. The middle line of the Bollinger Band indicator is the 20-period moving average. The RSI is above its middle line of 50, and it is bullish. The Stochastic is above its upper boundary of 80, indicating an Overbought market condition. Starting Monday, if the price continues moving upwards, the first resistance area, R1, will be the previous week’s high, around 0.66714. If the price breaks above the R1 and keeps moving upwards, the next resistance area, R2, will be an older weekly high at 0.67024.
On the other hand, if the price is rejected and moves downwards, the first support area, S1, will be the previous week’s low, around 0.65640. Last Thursday, the market created a Bullish Engulfing Order Block on the 30-minute chart, which can be an additional supporting factor for the price. If the price penetrates S1 and declines further, the next support area, S2, will be 0.65074.
USD JPY 4H
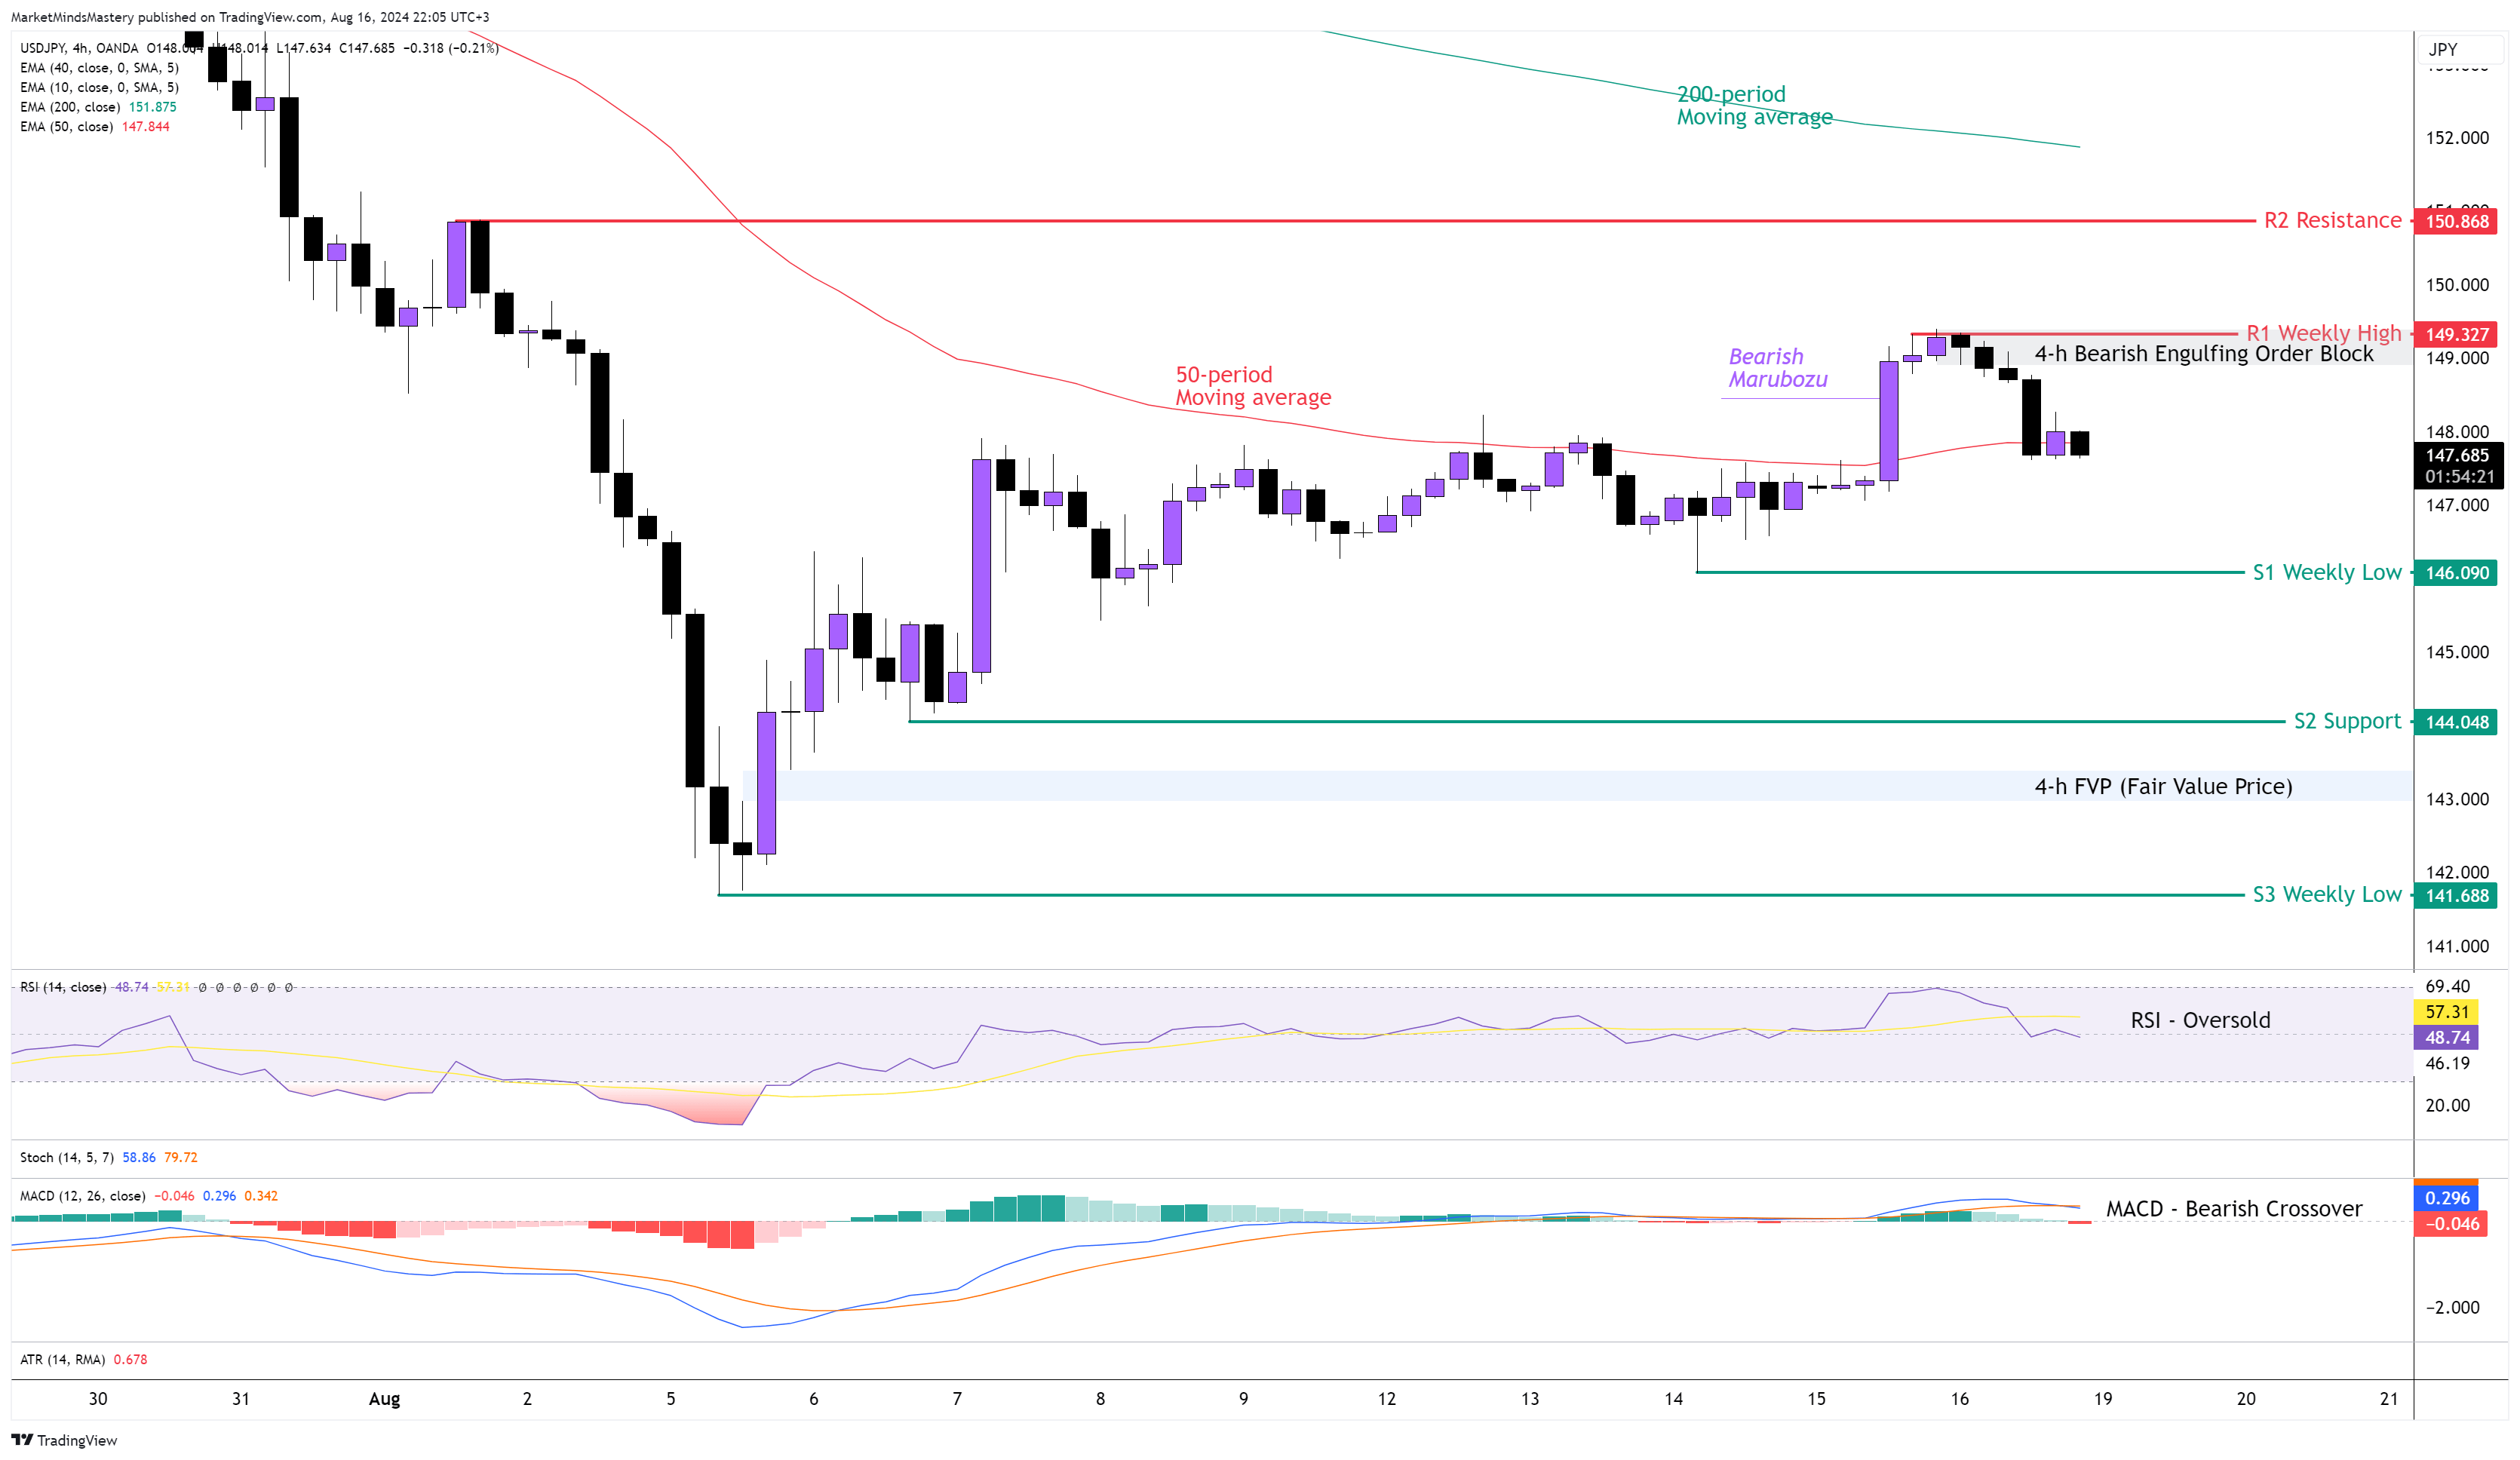
Following the Bullish Pin Bar (which looks similar to the Dragon Fly candlestick) on the weekly chart, the price was expected to move upwards under a significant amount of volume, but it didn't. Instead, the price advanced only approximately 100 pips. This shows a market weakness pushing the price upwards, and maybe the buy orders are not enough to support higher prices. On the 4-hour chart, the 50-period is below the 20-period, and this is bearish. The RSI is around its middle line of 50. The MACD created a Bearish Crossover while it's above the zero line, and this usually has bearish implications. The MACD’s Histogram moved below the zero line, and it shows that the prices started to decline. From Monday onwards, if the price declines further, the first support area, S1, will be the previous week’s low, around 146.090. If the price penetrates the S1 and goes through it, the next support area, S2, is around 144 and the S3 around 141.688, which is an old weekly low. Around 143.000, there is an “unmitigated” FVP (Fair Value Price). Oppositely, if the price bounces off and moves upwards, the first resistance area, R1, will be the previous week’s high, around 149.327. Around this level, last week, the market formed a Bearish Engulfing Order Block, which can provide additional resistance in the price. If the price penetrates R1 and keeps increasing, the next resistance area R2 will be 150.868.
USD CHF 4H
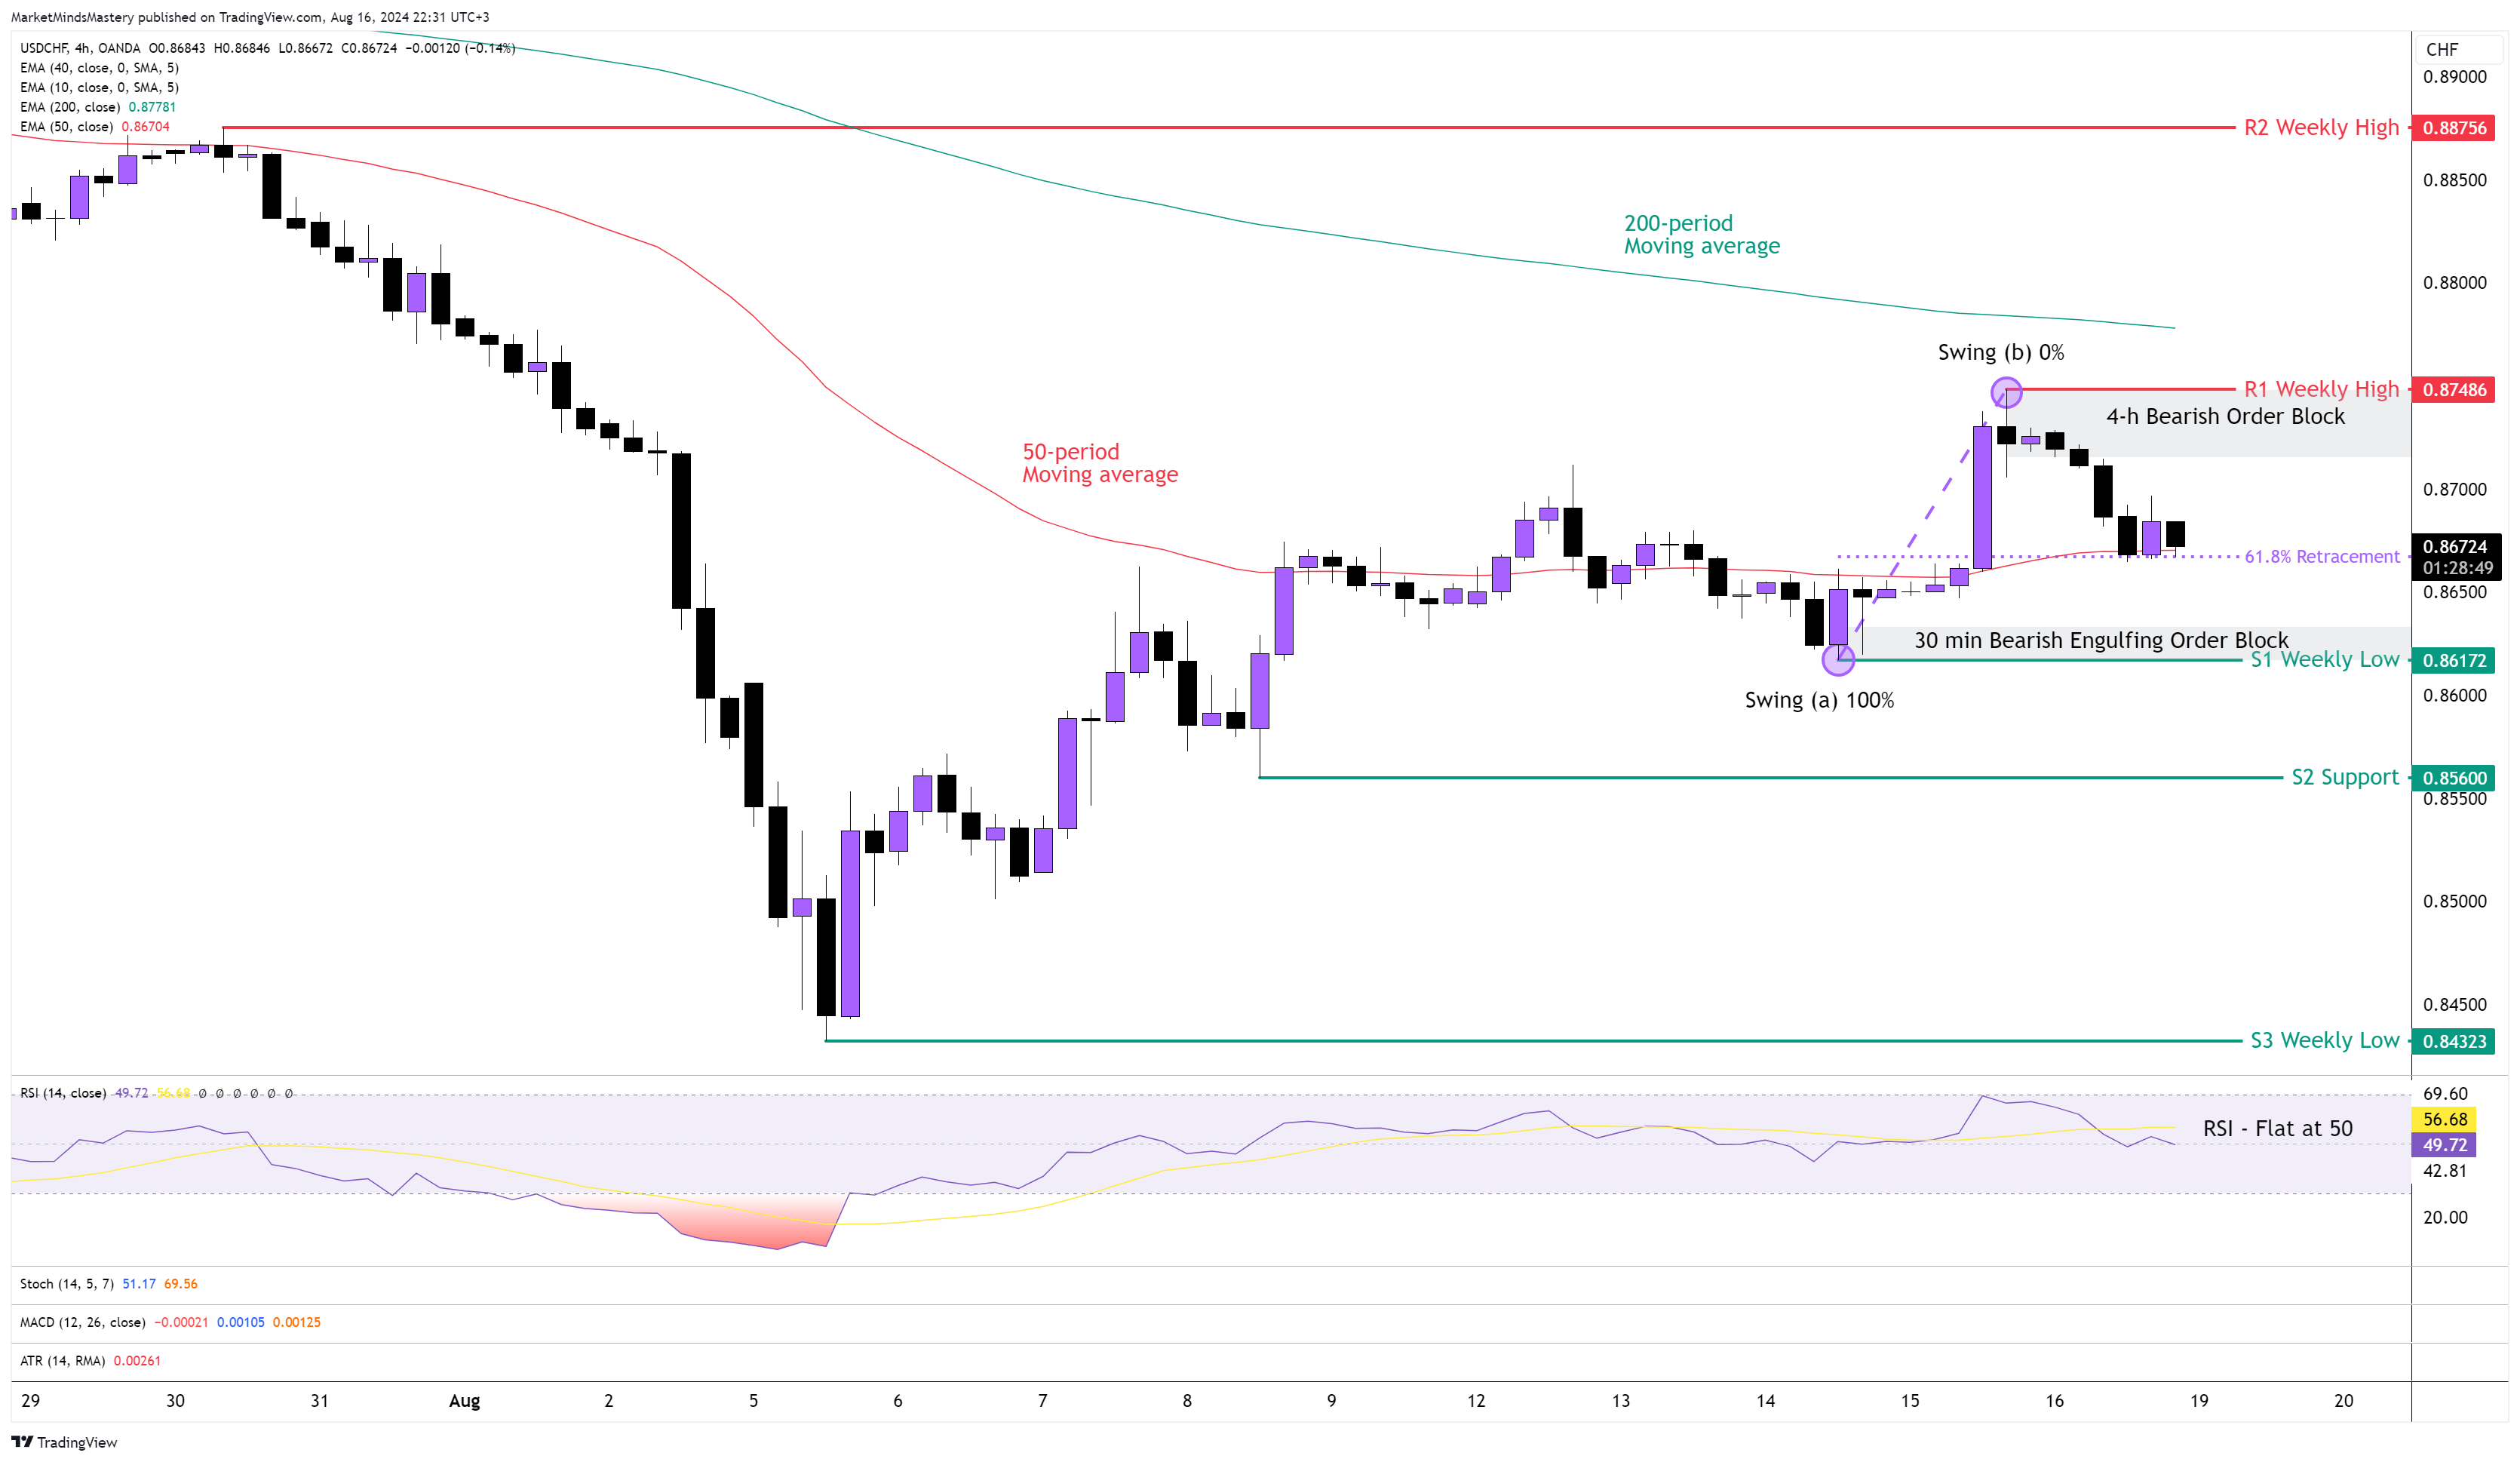
The US dollar’s weakness last week was obvious on the USDCHF currency pair. Following the previous week’s Market Outlook, the price didn't move upward as expected under significant volume. The weekly chart’s moving averages indicate a downtrend, and the fact that the price didn't move upwards under significant volume may be a sign of more downward moves to come.
Last Wednesday, on the 4-hour chart, the price ended in the FVP (Fair Value Price) we marked on the chart. It then bounced off, and it created a higher high and higher low formation. Therefore, there is a disagreement between the weekly and the 4-hour chart trends. This happens often and is inevitable, as the lower time frame is always a part of the correction that happens in the higher time frame. The 50-period moving average is below the 200-period, and this has bearish implications. The RSI Oscillator is around its middle line of 50, and it shows a price behaviour that is more indecisive rather than in a strong trend. Last Wednesday, a Bullish Engulfing Order Block formed on the 30-minute chart around 0.86250 and a Bearish engulfing Order Block on the 4-hour chart around 0.87300. Currently, the price is above the 50-period moving average and at the 61.8% Fibonacci retracement level, known as the “Golden Ratio”. Starting Monday, if the price moves downwards, the first support area, S1, will be the previous week’s low, around 0.86172. If the price will be rejected at this level and moves lower, it will first break the current uptrend, and it will set the 4-hour chart in a downtrend, the same as the weekly chart. In this case, the next support area, S2, will be the 0.85600. A further downward move will find the S3 support around 0.84323. Oppositely, if the price continues the 4-hour uptrend, the first resistance area, R1, will be the previous week’s high of around 0.87486. If the price penetrates the R1 and keeps increasing, the next support area, R2, will be 0.88756, which is another weekly high.
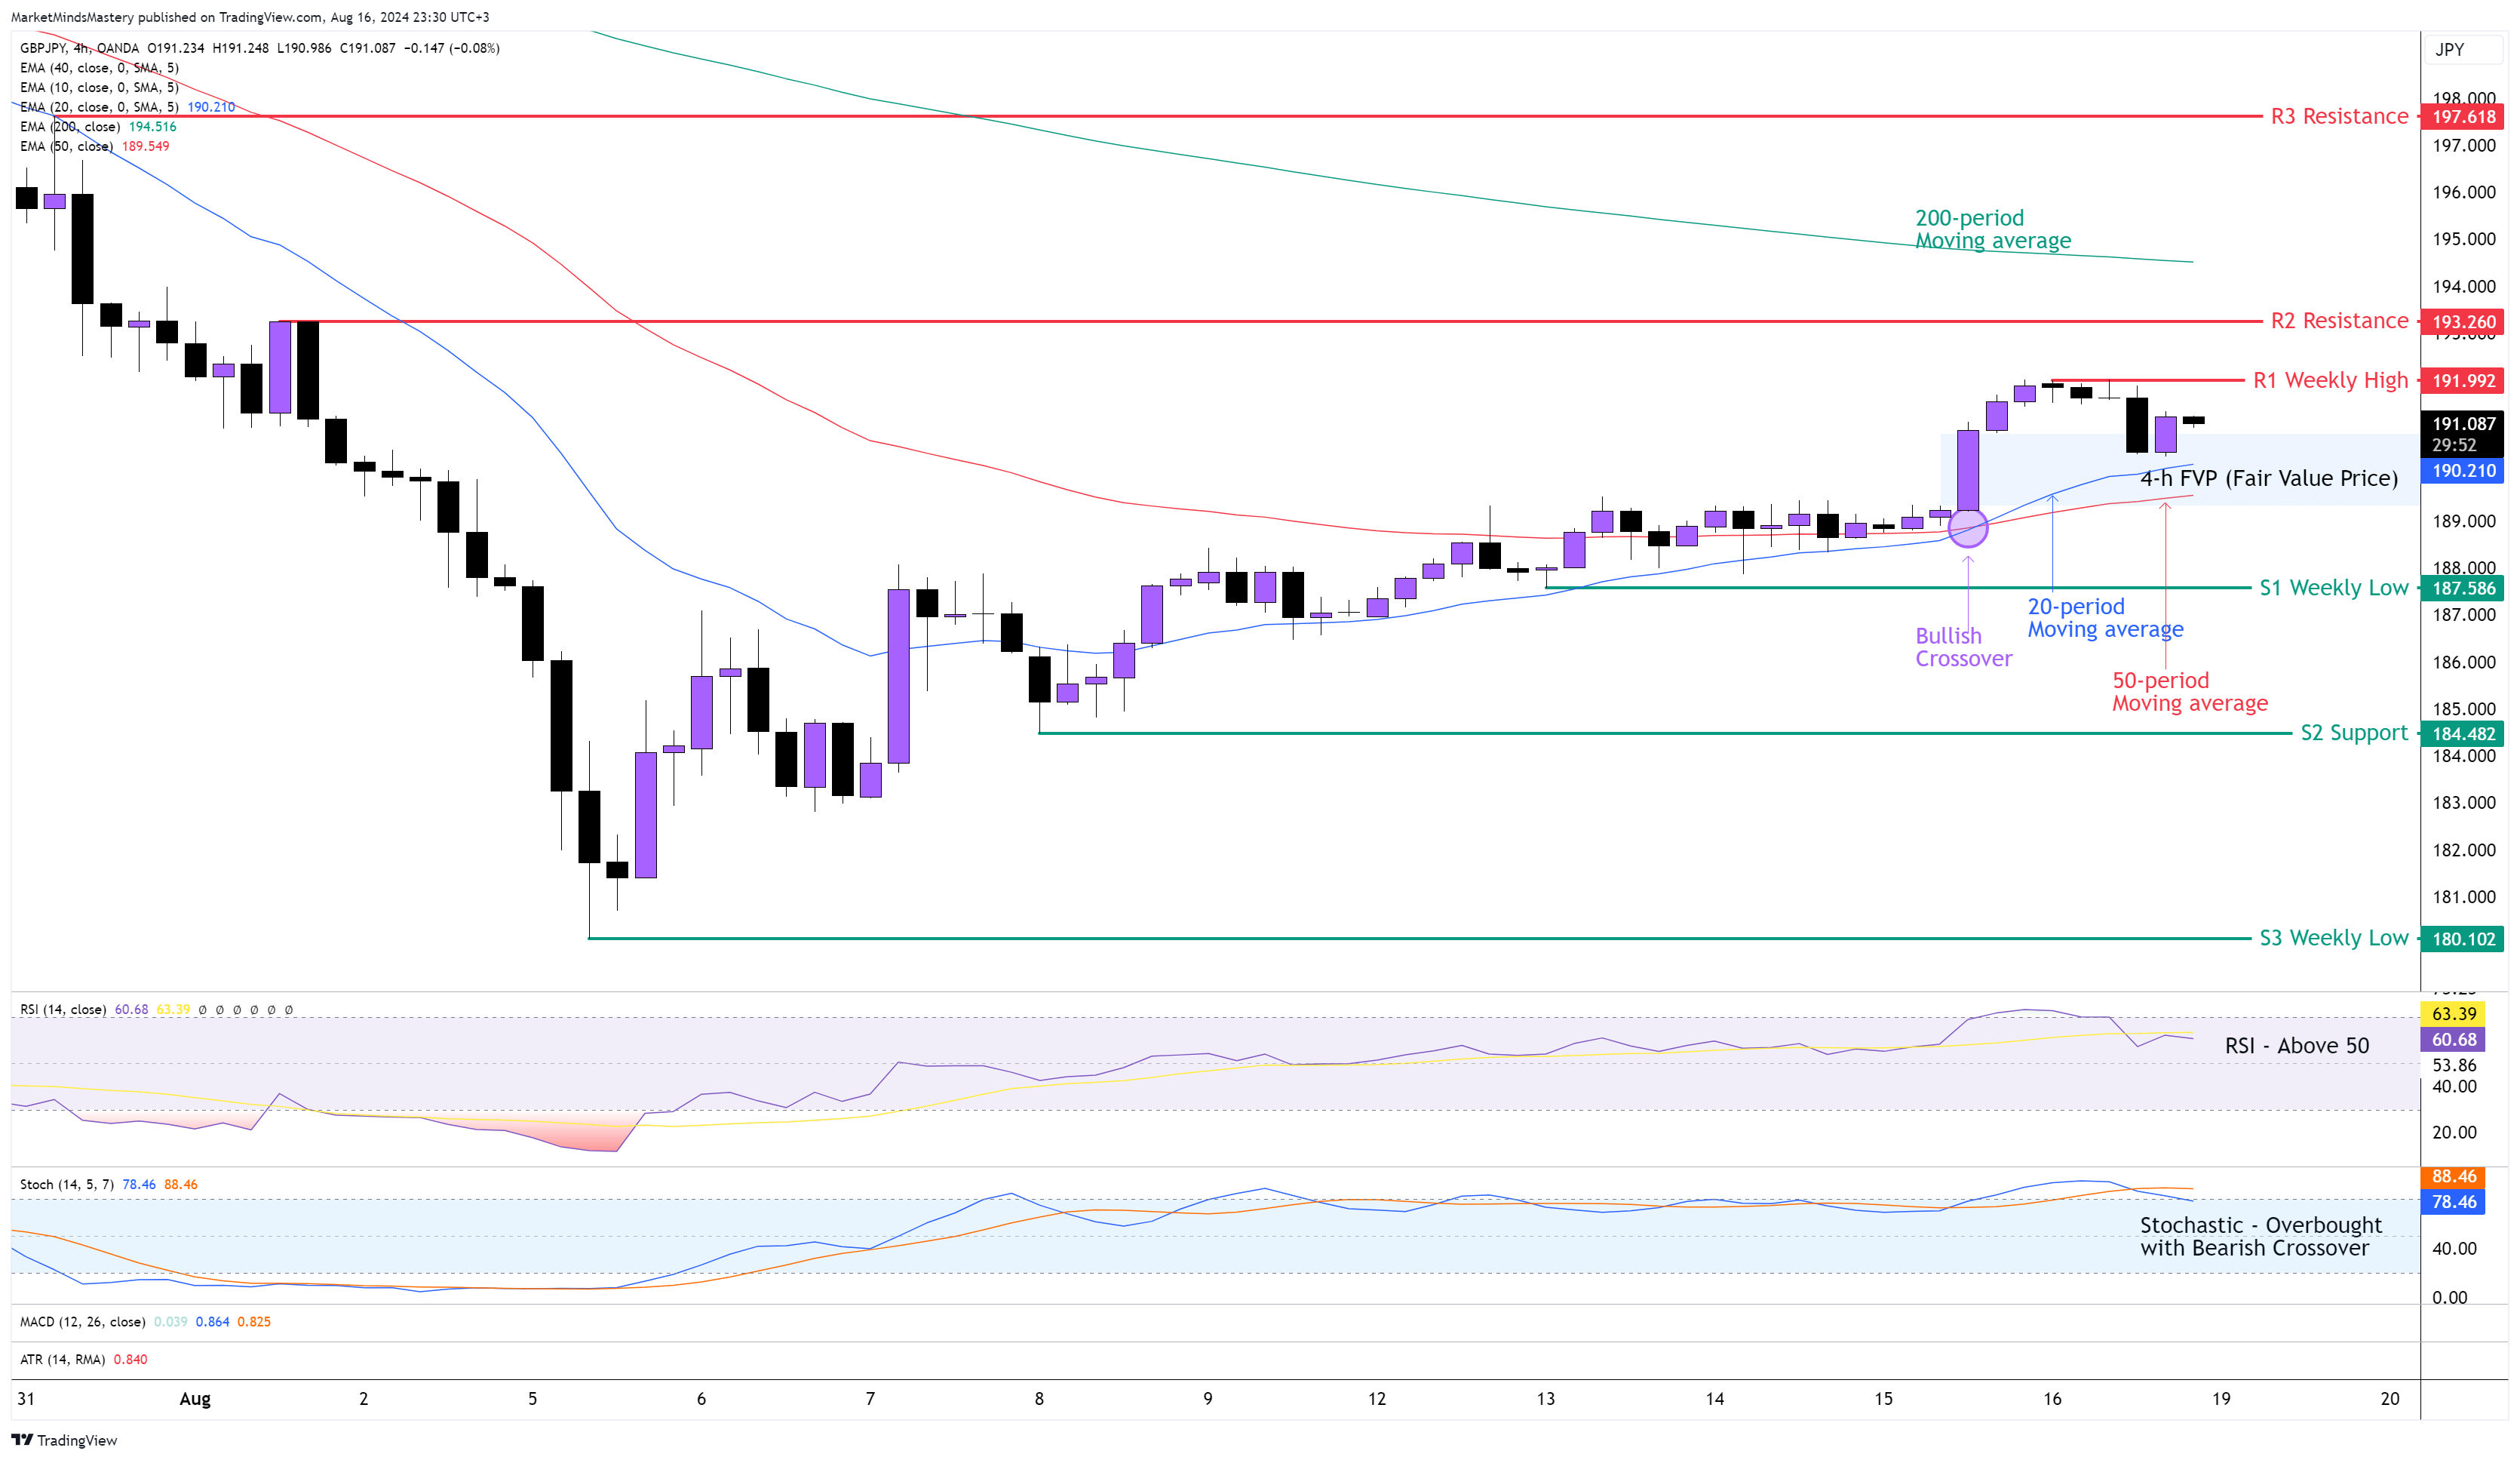
GBP JPY 4H
Following the previous week’s Market Outlook, the price of the GBPJPY currency pair moved upwards as expected because of the weekly candle with a Long Lower Wick, which has bullish implications. On the 4-hour chart, the price created a series of higher highs and higher lows. Therefore, the 20-period crossed above the 50-period moving average, as shown with the Bullish Crossover mark on the chart above. The RSI is above the middle line of 50, and it indicates a bullish market. The Stochastic Oscillator, on the other hand, created a Bearish Crossover while it was in an overbought condition. This usually means that the price might start a corrective phase. Currently, the price is entered into the FVP (Fair Value Price) and used as support as it bounced off. Starting Monday, if the price continues moving upwards, the first resistance area R1 will be the previous week’s high, around 191.992. If the price penetrates the R1 and keeps increasing, the next resistance area, R2, will be 193.26. A further upward move will find the next resistance area, R3, around 197.618.
Conversely, if the price declines and moves downwards, the first support area, S1, will be the previous week’s low, around 187.586. If the price penetrates the S1 and declines further, the next support area, S2, will be 184.48. A further decline will find the S3 support, an old weekly low level, around 180.102.
GOLD 4H
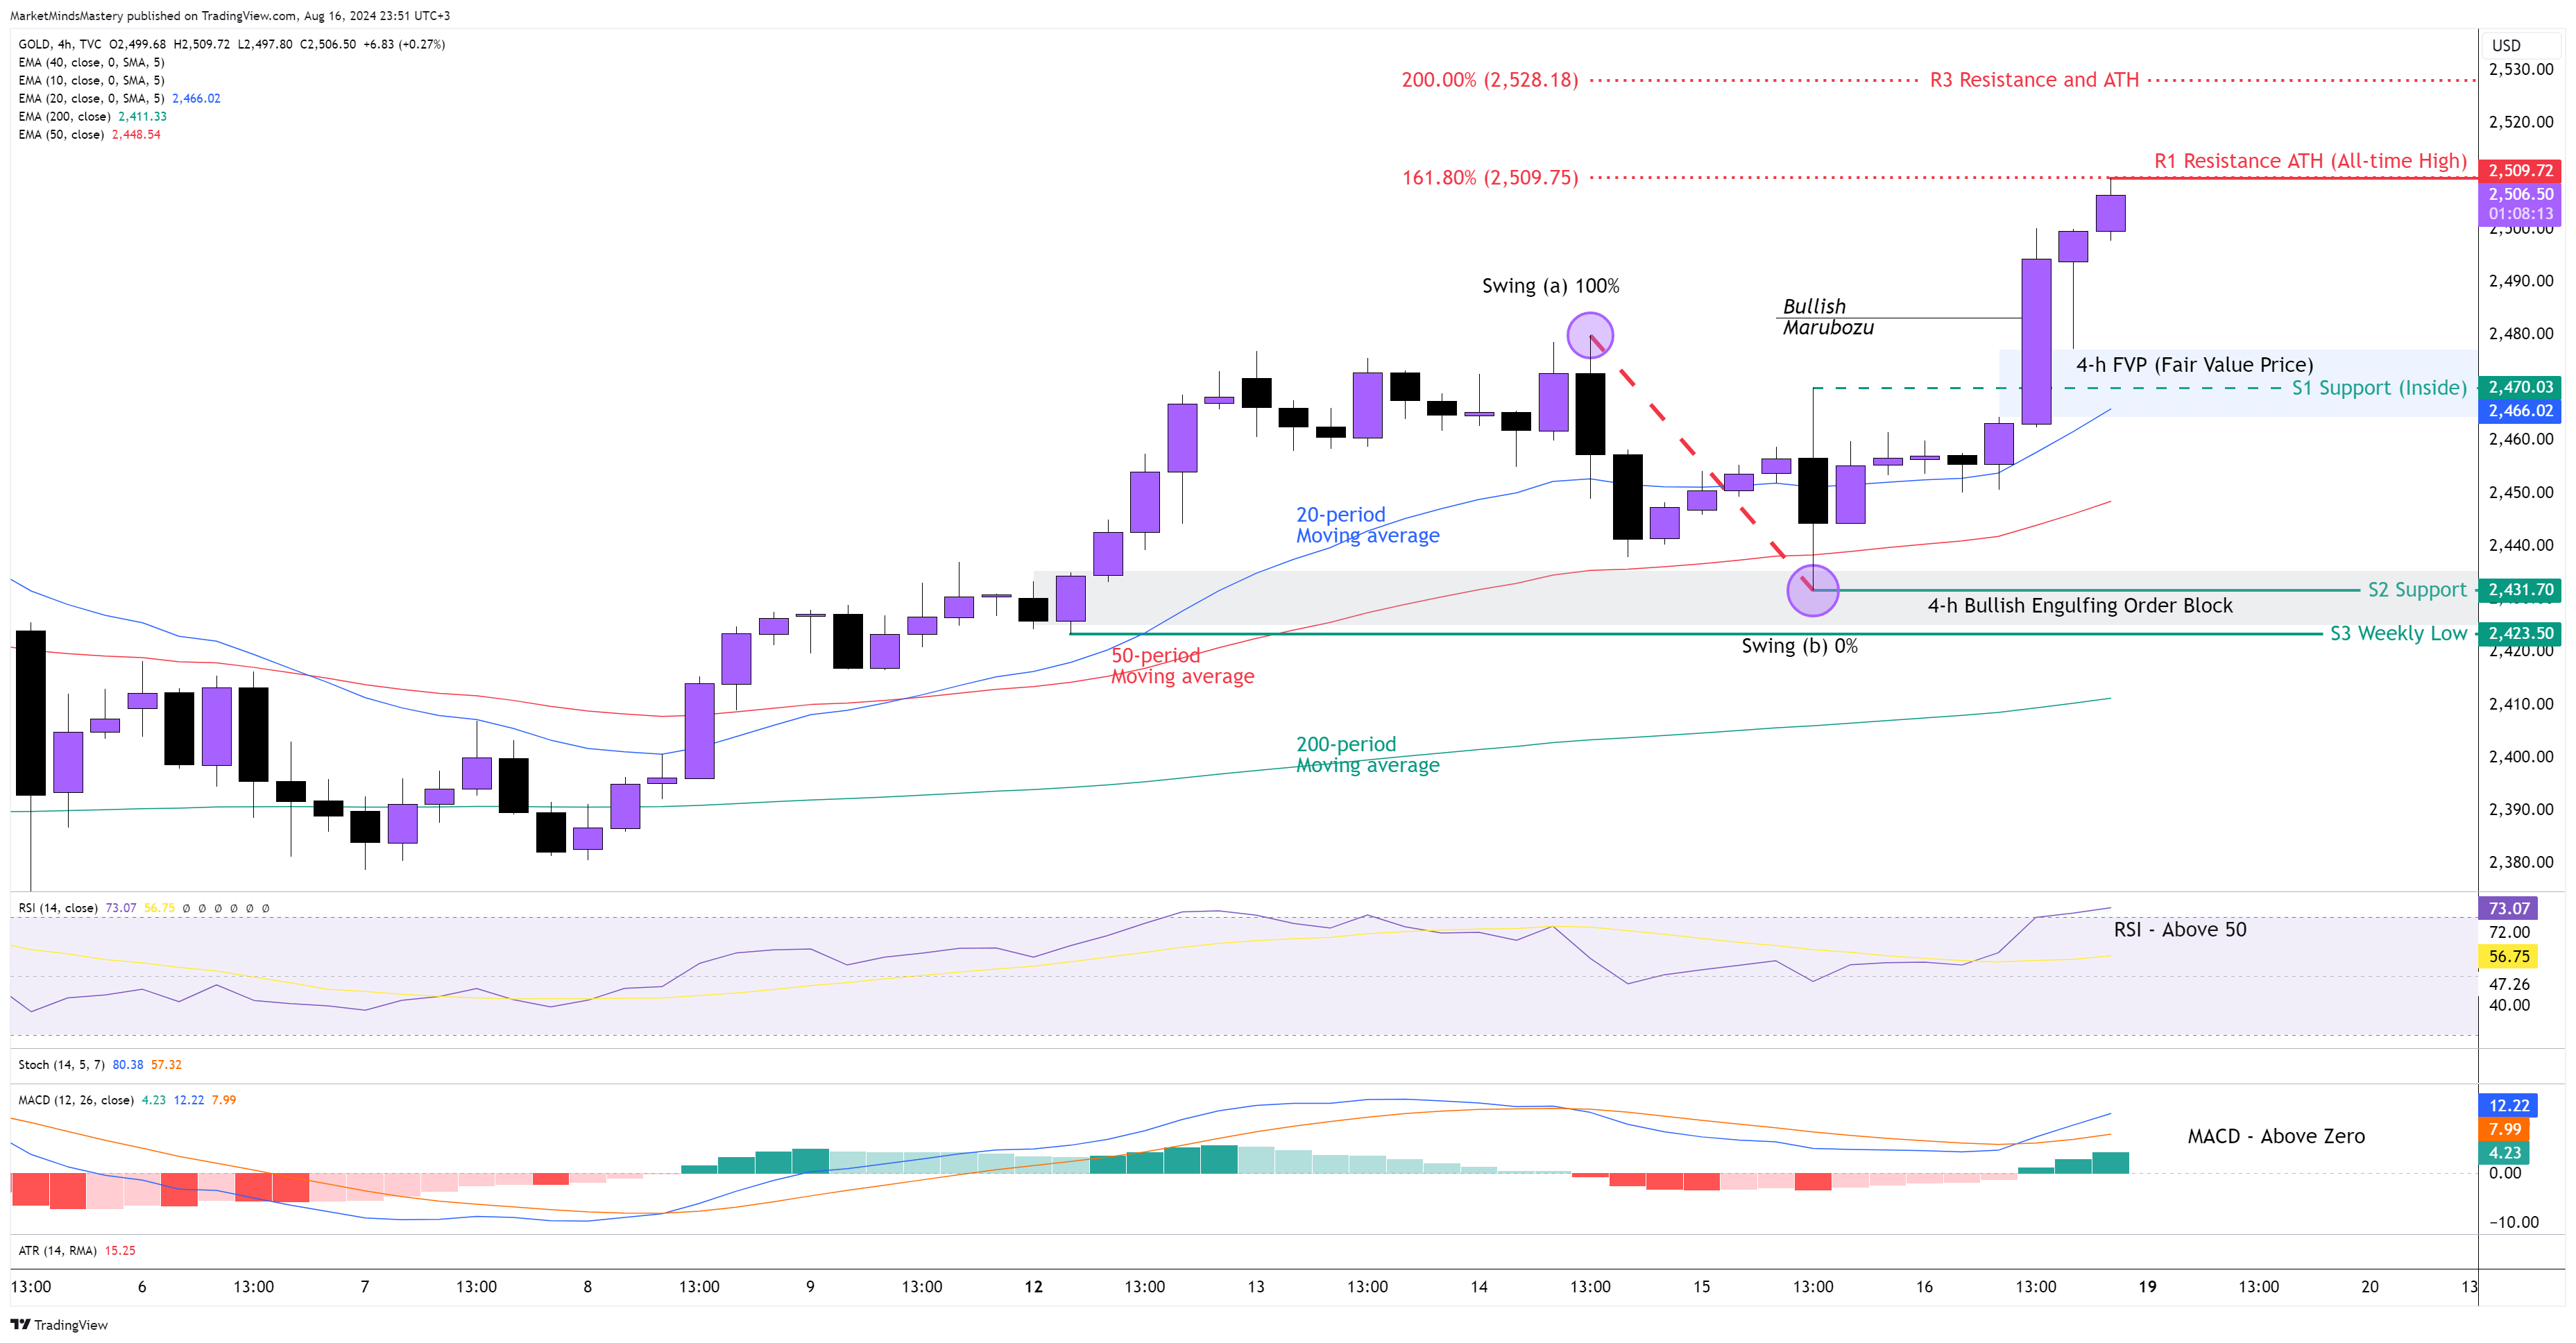
Following the previous week’s Market Outlook, the bearish reversal price action we marked on the weekly chart, which formed at a key level of resistance, didn't follow through. This means that the price, instead of moving downwards, moved upwards and penetrated the $2483 level with a Bullish Marubozu. This caused the Gold market to register a new ATH ( All-Time High) at around $2509. The price created an FVP (Fair Value Price) of around $2460 and a Bullish Engulfing Order Block of around $2430.The 20-period is above the 50-period moving average, and also, the 50-period is above the 200-period moving average. The RSI is above 70, which means it entered into an Overbought condition, indicating the accumulative of buy orders last Friday. The MACD is above its zero line, with the MACD Line (Blue) crossed above the Signal Line (Orange). The MACD’s Histogram is also above the zero line, indicating the market’s bullishness.
Starting Monday, if the price continues moving upwards, the first resistance area, R1, will be the previous week’s high and ATH around $2509. This level coexists exactly with the 161.8% of the Fibonacci Extension, a level that was supposed to be the first price target after the upward breakout. If the price keeps increasing and moves through the R1 level, the next resistance area, R2, will be around $2528. This is the 200% Fibonacci Extension, as shown in the chart above.
On the other hand, if the price declines and moves downward, the first support area, S1, will be approximately $2470. This S1 support is an inside support. If the price penetrates the S1 and declines further, the next support, S2, is around $2431 and the S3, around $2423. A Bullish Engulfing Order Block formed at around $2430.
USOIL 4H
Although the weekly chart does not have a clearly defined trend, and the 10-period is below the 40-period weekly moving averages (we don’t show in the above chart), it is considered a bearish indication. The price on the weekly chart ended as a Bearish reversal candle with a Long Upper Wick and a small real body. On the 4-hour chart, the price creates a series of lower highs and lower lows, and it is considered a bearish indication. The 50-period moving average is below the 200-period moving average, and it's bearish. Another bearish implication is the RSI being below its middle line of 50 and the MACD being below its zero line. In addition to that, the MACD’s Histogram has been below zero since last Wednesday. Last week, the price created a Bearish Engulfing Order Block of around $79 and an FVP (fair Value Price) of around $77.50. The last few candlesticks' closing prices are below the 50-period moving average. Therefore, if the price keeps dropping, the first support area will be around $75.48, which is the previous week’s low. If the price breaks below the S1 and keeps lowering, the next support area, S2, will be $74.58. In case the price penetrates the S2 and keeps moving downwards, the next support area, S3, will be around $72.20. On the contrary, if the price bounces off and moves upwards, the first resistance area, R1, will be around $78.57. Penetration of the R1 level will find the next resistance area, R2, around $79.088 and the next resistance area, R3, at $80.148, which is the previous week’s high.
BTC USD 4H
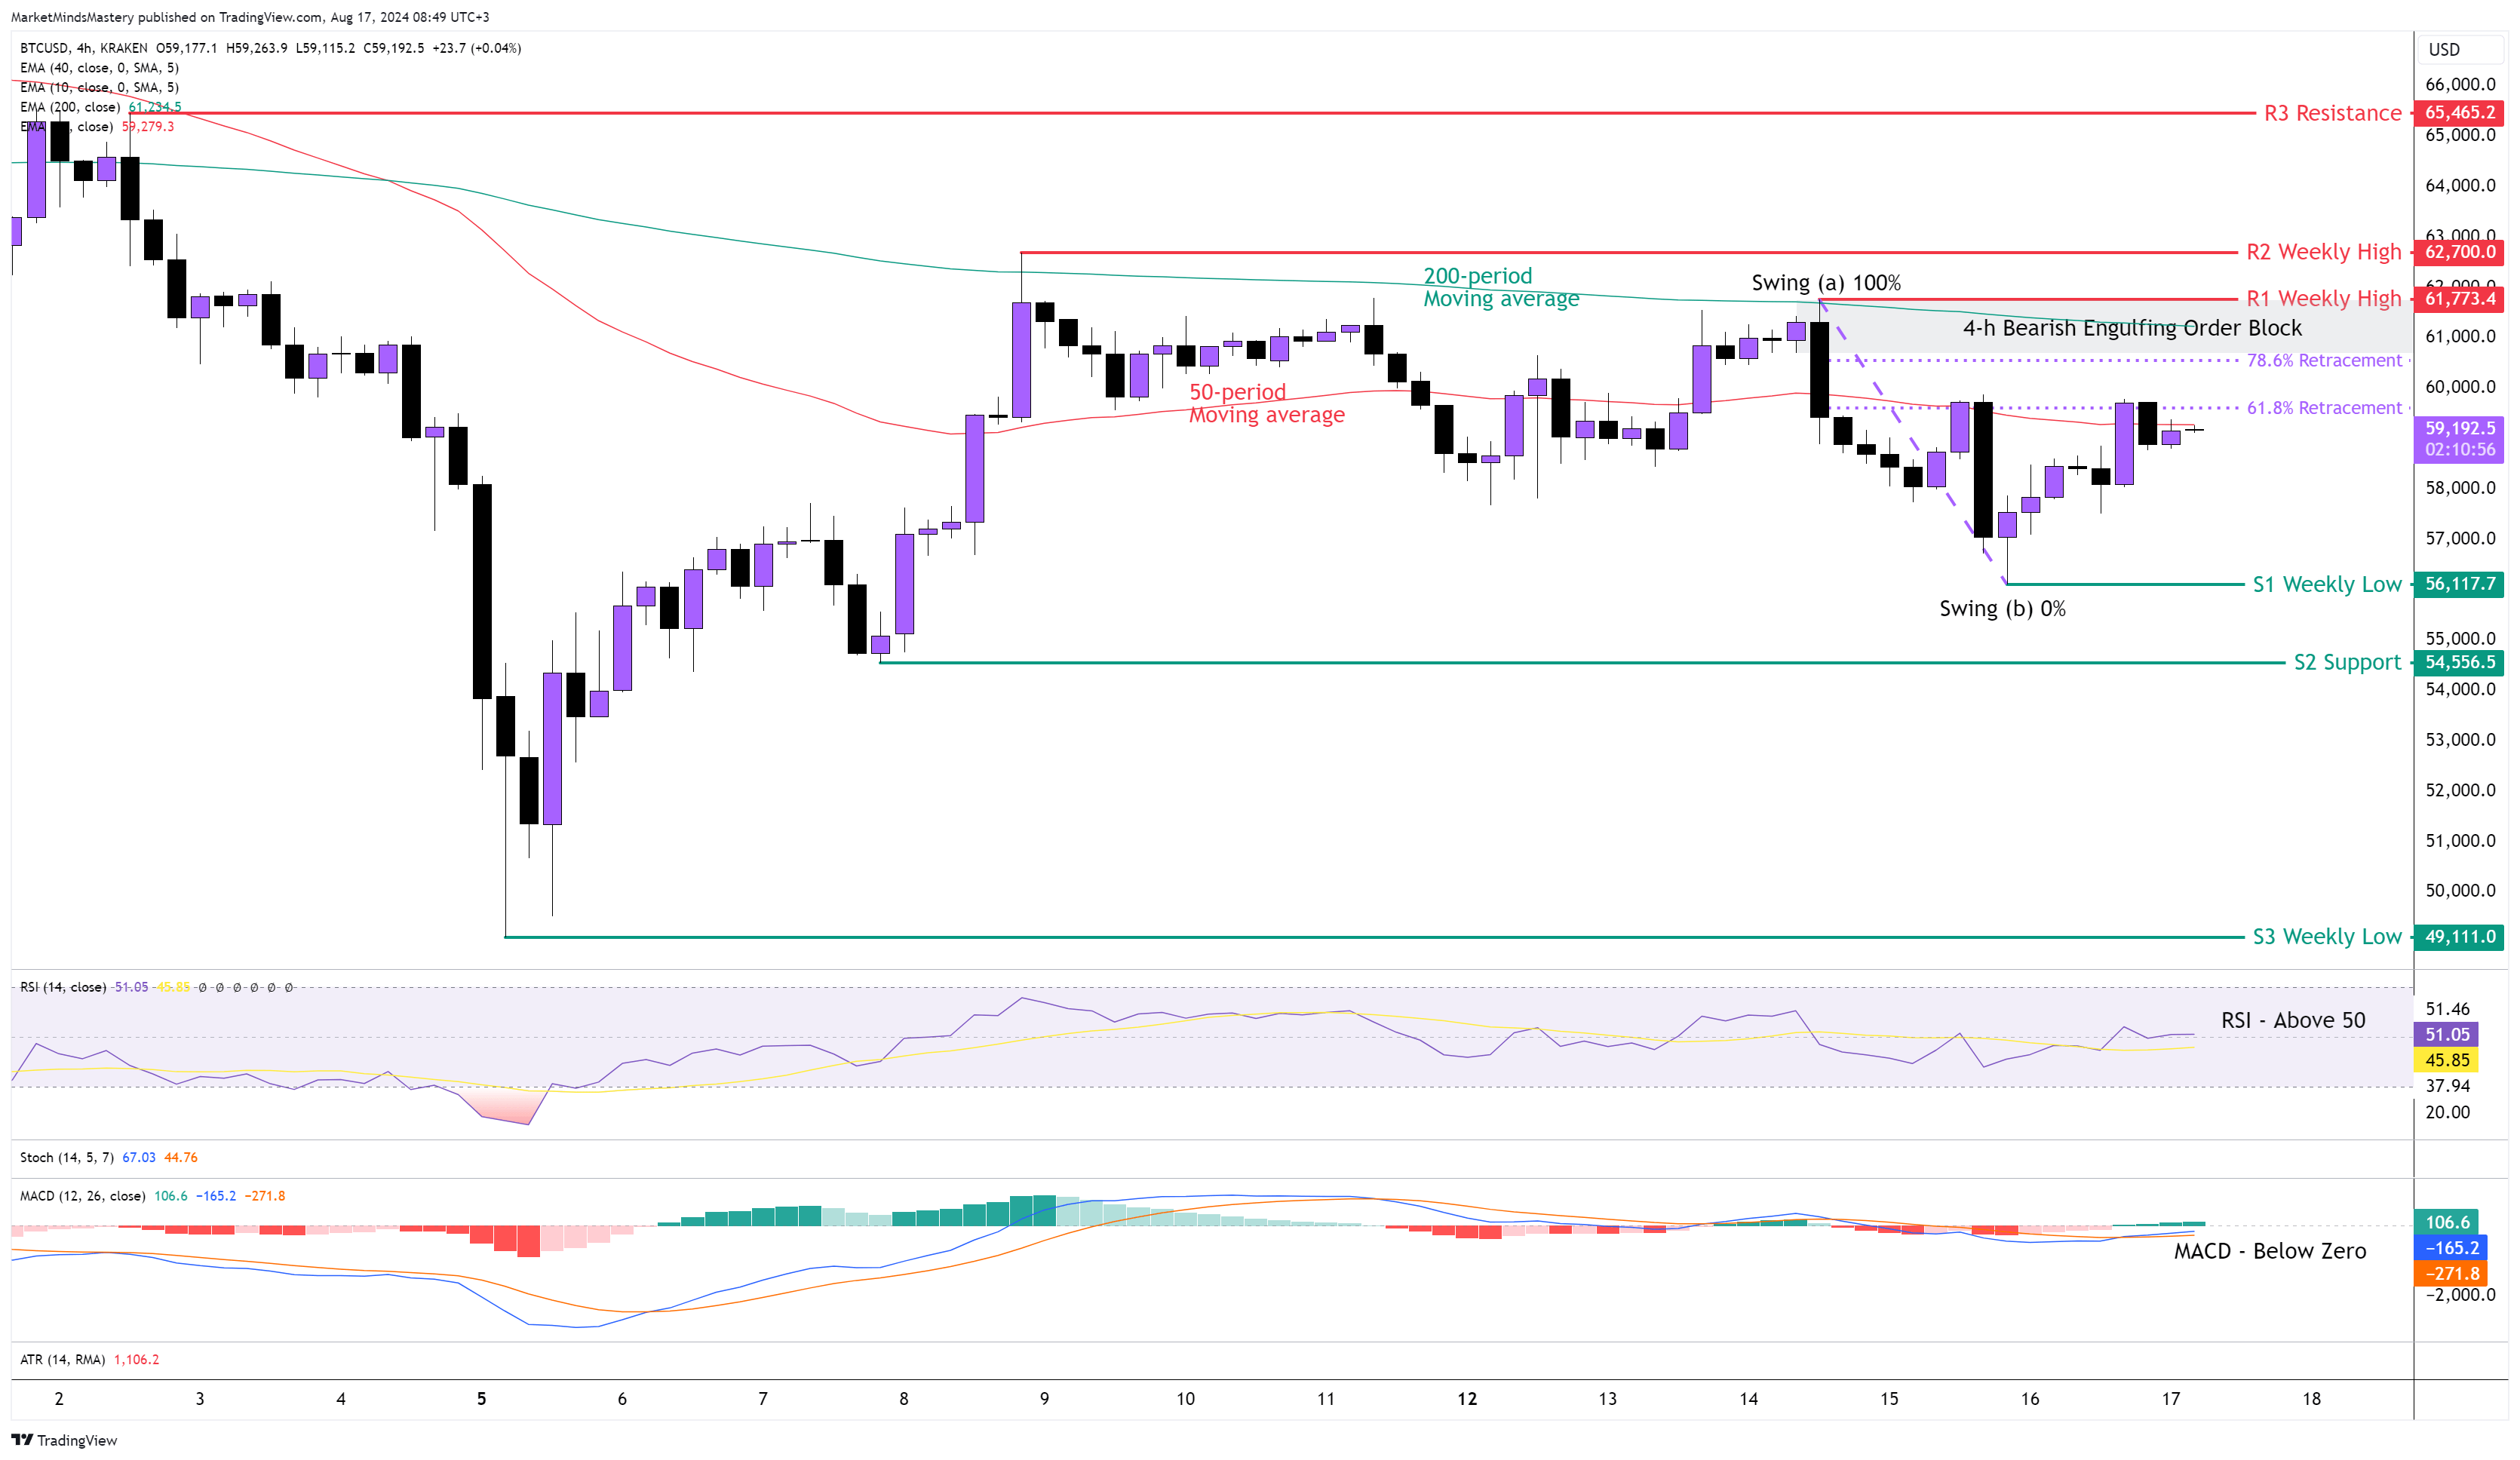
Last week, the weekly chart printed an Inside Doji candle. This means the market was indecisive and did not move in a clear direction. Usually, after an inside candle, a breakout occurs, either to the upside or to the downside, and a significant amount of volume follows it. On the 4-hour chart, the price was rejected by the 200-period moving average, which acted as a dynamic resistance last Wednesday. A drop forced the market to create a lower-low structure around $56117. The RSI Oscillator is above 50, and this is a bullish indication.
On the other hand, the MACD is below its zero line, meaning that the imbalance between the sell and buy order weighs more on the sell side. Last Friday, the price retraced 61.8% of its move from the swing high at (a) to the swing low at (b). The 61.8% Fibonacci or the “Golden Ratio” coexist with the 50-period moving average slightly below the $60000.
Therefore, if the price is rejected and moves downwards, the first support area, S1, will be around $56117, which is also the previous week’s low. If the price penetrates the S1 and keeps lowering, the next support area, S2, will be $54556. If the price can’t sustain above the S2 level and surpass it, it will continue the downtrend, and the next support area, S3, will be below $50000, approximately $49111.
On the other hand, if the imbalance of buy and sell orders favours the buy side, the price will move upwards, and the first resistance area, R1, will be around $61773. This level coexists with the 200-period moving average. A Bearish Engulfing Order Block was formed last Wednesday at around $61000, which can be another form of resistance for the price.
SP 500 4H
Following the previous week’s Market Outlook, the price of the SP500 moved upwards as expected. The weekly chart candle, with a Long Lower Wick, caused the price to move upwards, creating a Bullish Marubozu. On the 4-hour chart, based on the swing analysis, the market created a market structure of higher highs and higher lows. When the two-time frames agree on the direction, it's when the markets usually offer high-probability trading opportunities. Last Tuesday, the 20-period crossed above the 50-period moving average, known as a Bullish Crossover. Since then, the price has moved upwards in a straight line in this time frame without retracing any part of the uptrend. Hence, the RSI OScillator entered into an Overbought condition as it moved above its Upper boundary line of 70. The MACD moved above its zero line, and it has bullish implications. Additionally, MACD’s Histogram is above the zero line. Last Tuesday, a Bullish Engulfing Order Block formed around $5350 and last Thursday, a Bullish Engulfing Order Block was around $5460.
Starting Monday, if the price continues moving upwards, the first resistance area, R1, will be the previous week’s high, around $5563. It is almost exactly at the same precise level as the candle’s close. If the price penetrates the R1, the next resistance area, R2, will be another weekly high level, approximately $5593. A further upward move finds the following resistance area, R3, being the ATH (All-Time High) at $5674.
Conversely, if the price declines and penetrates all the Order Blocks and the FVP (Fair Value Price), the first static support, S1, will be around $5325, which is the previous week’s low. If the price surpasses the S1 support area and keeps lowering, the next support area, S2, will be $5159, and the following support, S3, will be $5094.
US 30, 4H
The US30 was among the good-performing indices last week, and it offered trading opportunities for Day Traders. Leading by the weekly market structure and the Bullish Reversal Price Action, the market was moving primarily by the accumulation of buy orders. The Weekly candle closed as a Bullish candle, and this shows the market’s bullish strength. On the 4-hour chart, the price created a series of higher highs and higher lows. Based on the swing analysis, the shallow retracements reveal the market’s strength. Last Friday, the 50-period crossed above the 200-period moving average, which is called the “Golden Cross”. The RSI moved above 70, and it became Overbought. The Stochastic Oscillator is also in an Overbought condition, which indicates bullishness. As there is no confirmed swing high on the price chart, we cannot use the Fibonacci retracement tool to forecast the percentage retracements. Therefore, starting Monday, if the price continues moving upwards, the first resistance area, R1, will be the previous week’s high, around $40735. If the price penetrates the R1 and keeps increasing, the next resistance area, R2, will be the ATH (All-Time High) at $41424.
On the contrary, if the price is rejected and moves downward, the first support area will be $39687. This price level consists of the static support S1, the 200-period moving average, the 4-h Bullish Order Block and the Valid Upwards Trendline T1. In case the price isn’t sustained above the S1 and penetrates it, the next support area, S2, will be the previous week’s low, around $39241.
GER 30, 4H
The price of the GER30 moved upwards last week, and the weekly candle ended as a Bullish Marubozu. On the 4-hour chart, the price kept increasing, creating higher highs and higher lows without any retracements. The majority of the candles were bullish, and only a few candles were bearish. This is a sign of a strong uptrend. On Wednesday, a Bullish Crossover occurred, which means that the 20-period moving average crossed above the 50 period. Since then, the RSI and the Stochastic Oscillators both entered into their Overbought conditions. As the swing high has not been confirmed, we can not use the Fibonacci Retracement tool to plot the retracement levels of the last impulsive upward move.
Therefore, if the price keeps increasing, the first resistance area, R1, will be the previous week’s high, around 18356. As we said earlier, the weekly candle closed as a Bullish Marubozu, which means the high and close prices are almost at the same level. If the price penetrates the R1 and moves upwards, the next resistance area, R2, will be 18586, which is another weekly high level.
On the other hand, if the price enters a corrective or retracement phase and starts moving downwards, the first support area, S1, will be the previous week’s low, around 17654. Prior to this, there was a Bullish Order Block and an FVP (Fair Value Price) around 18000 and 17800 respectively. In case the price declines further and moves downwards, the next support area, S2 will be around 17370. If the price penetrates the S2 and keeps moving downwards, the next support area, S3, will be around 17016, and it is an old weekly low price level.