The Trading Pit Week Ahead Market Outlook (May 13 – May 19)
The markets were relatively “calm” last week, with volatility not to be at its highest levels. The market participants primarily focused on the Interest Rates of the Reserve Bank of Australia and the Bank of England. Both kept their interest rates at 4.35% and 5.25%, respectively. Few markets moved within narrow trading ranges. Usually, after this, we are used to seeing directional moves.
On Monday, one significant event is expected to be released. This will be the inflation expectation in New Zealand for the second quarter. The Reserve Bank of New Zealand aims for economic contraction, and Inflation is one of the leading indicators. Currently, the number is at 2.5%. A higher than 2.5% will boost the Kiwi, whereas a lower reading number will likely cause the NZDUSD to drop.
The volatility is expected to increase from Tuesday onwards, one hour before the London Trading session starts. The UK will report the Claimant Count Change for April. While this is an early indication that people are claiming government benefits due to a lack of jobs, the consensus shows a 13.9K compared to the 10.9K previously. The market’s reaction will show how traders perceive this early indication as it can cause the Sterling to drop, not only due to this event but also because the Unemployment Rate is expected to increase to 4.3% compared with the 4.2% reported the last time.
Last, the PPI (Producers Price Index) in the US is expected to increase from 2.2% to 2.1% as per the forecast. This is one of the indications of inflation in the country because it measures the changes in the prices of goods sold directly by the producers in the United States. A rising number will cause some strength in the US Dollar.
The market will become very volatile on Wednesday, and directional moves might occur. During the day, the Bank of England will report the Monetary Policy Hearings. Moving into the London trading session, the Eurozone's GDP (Gross Domestic Product) is expected to remain at the same rate of 0.4%. Results like this usually cause weakness in the Euro. Currently, the primary market’s direction is a downtrend. Therefore, this event can add more to the fall of the Euro. Next is the Greenback’s turn, and the CPI (Consumer Price Index) is considered the US dollar's most significant news announcement of the week. The barometer will be the Yearly CPI number. Compared to the same period one year ago, the CPI was 3.5% and is expected to drop to 3.4%. While this drop can be considered suitable for the consumers, it will harm the Greenback because it will perceived as a weak currency. Around this event, the volatility will massively increase, and traders trading in short time frames must remember this. Price can go both ways before it takes its direction and causes the orders for stop loss to be shaken. At the same time, the Retail Sales are expected to drop from 0.7% to 0.4%. As these two events will be reported simultaneously, the directional moves can be seen if both outcomes converge.
It's been a while since the last time the Bank of Japan reported an important news event. On Thursday, during the Asian trading session, the BoJ will report the GDP number (Gross Domestic Product). In the previous quarter, the GDP in Japan was 0.1%. Now, the forecast shows a significant decrease to -0.4%. If this occurs, and the Japanese YTen follows through, there is a high probability of seeing an uptrend on the USDJPY, GBPJPY and the rest.
At this point, we must clarify that if both the USD and the Yen weaken due to adverse news events, and if the USDJPY rallies, it will be primarily due to the significant weakness of the YEN. The last two important events for the day will be the Employment Change and the Unemployment Rate in Australia. Despite the expected employment change increase by approximately 32 thousand, the Unemployment Rate is expected to increase from 3.8% to 3.9%. One of the reasons for this is that employment change is affected by part-time and casual employment. However, unemployment can be paid even if someone is a casual worker.
Friday is expected to be a low volatility day as the only significant events will be the Industrial production in China, which is expected to increase from 4.5% to 4.6%, and the Retail sales, which are expected to also increase from 3.1% to 3.8%.
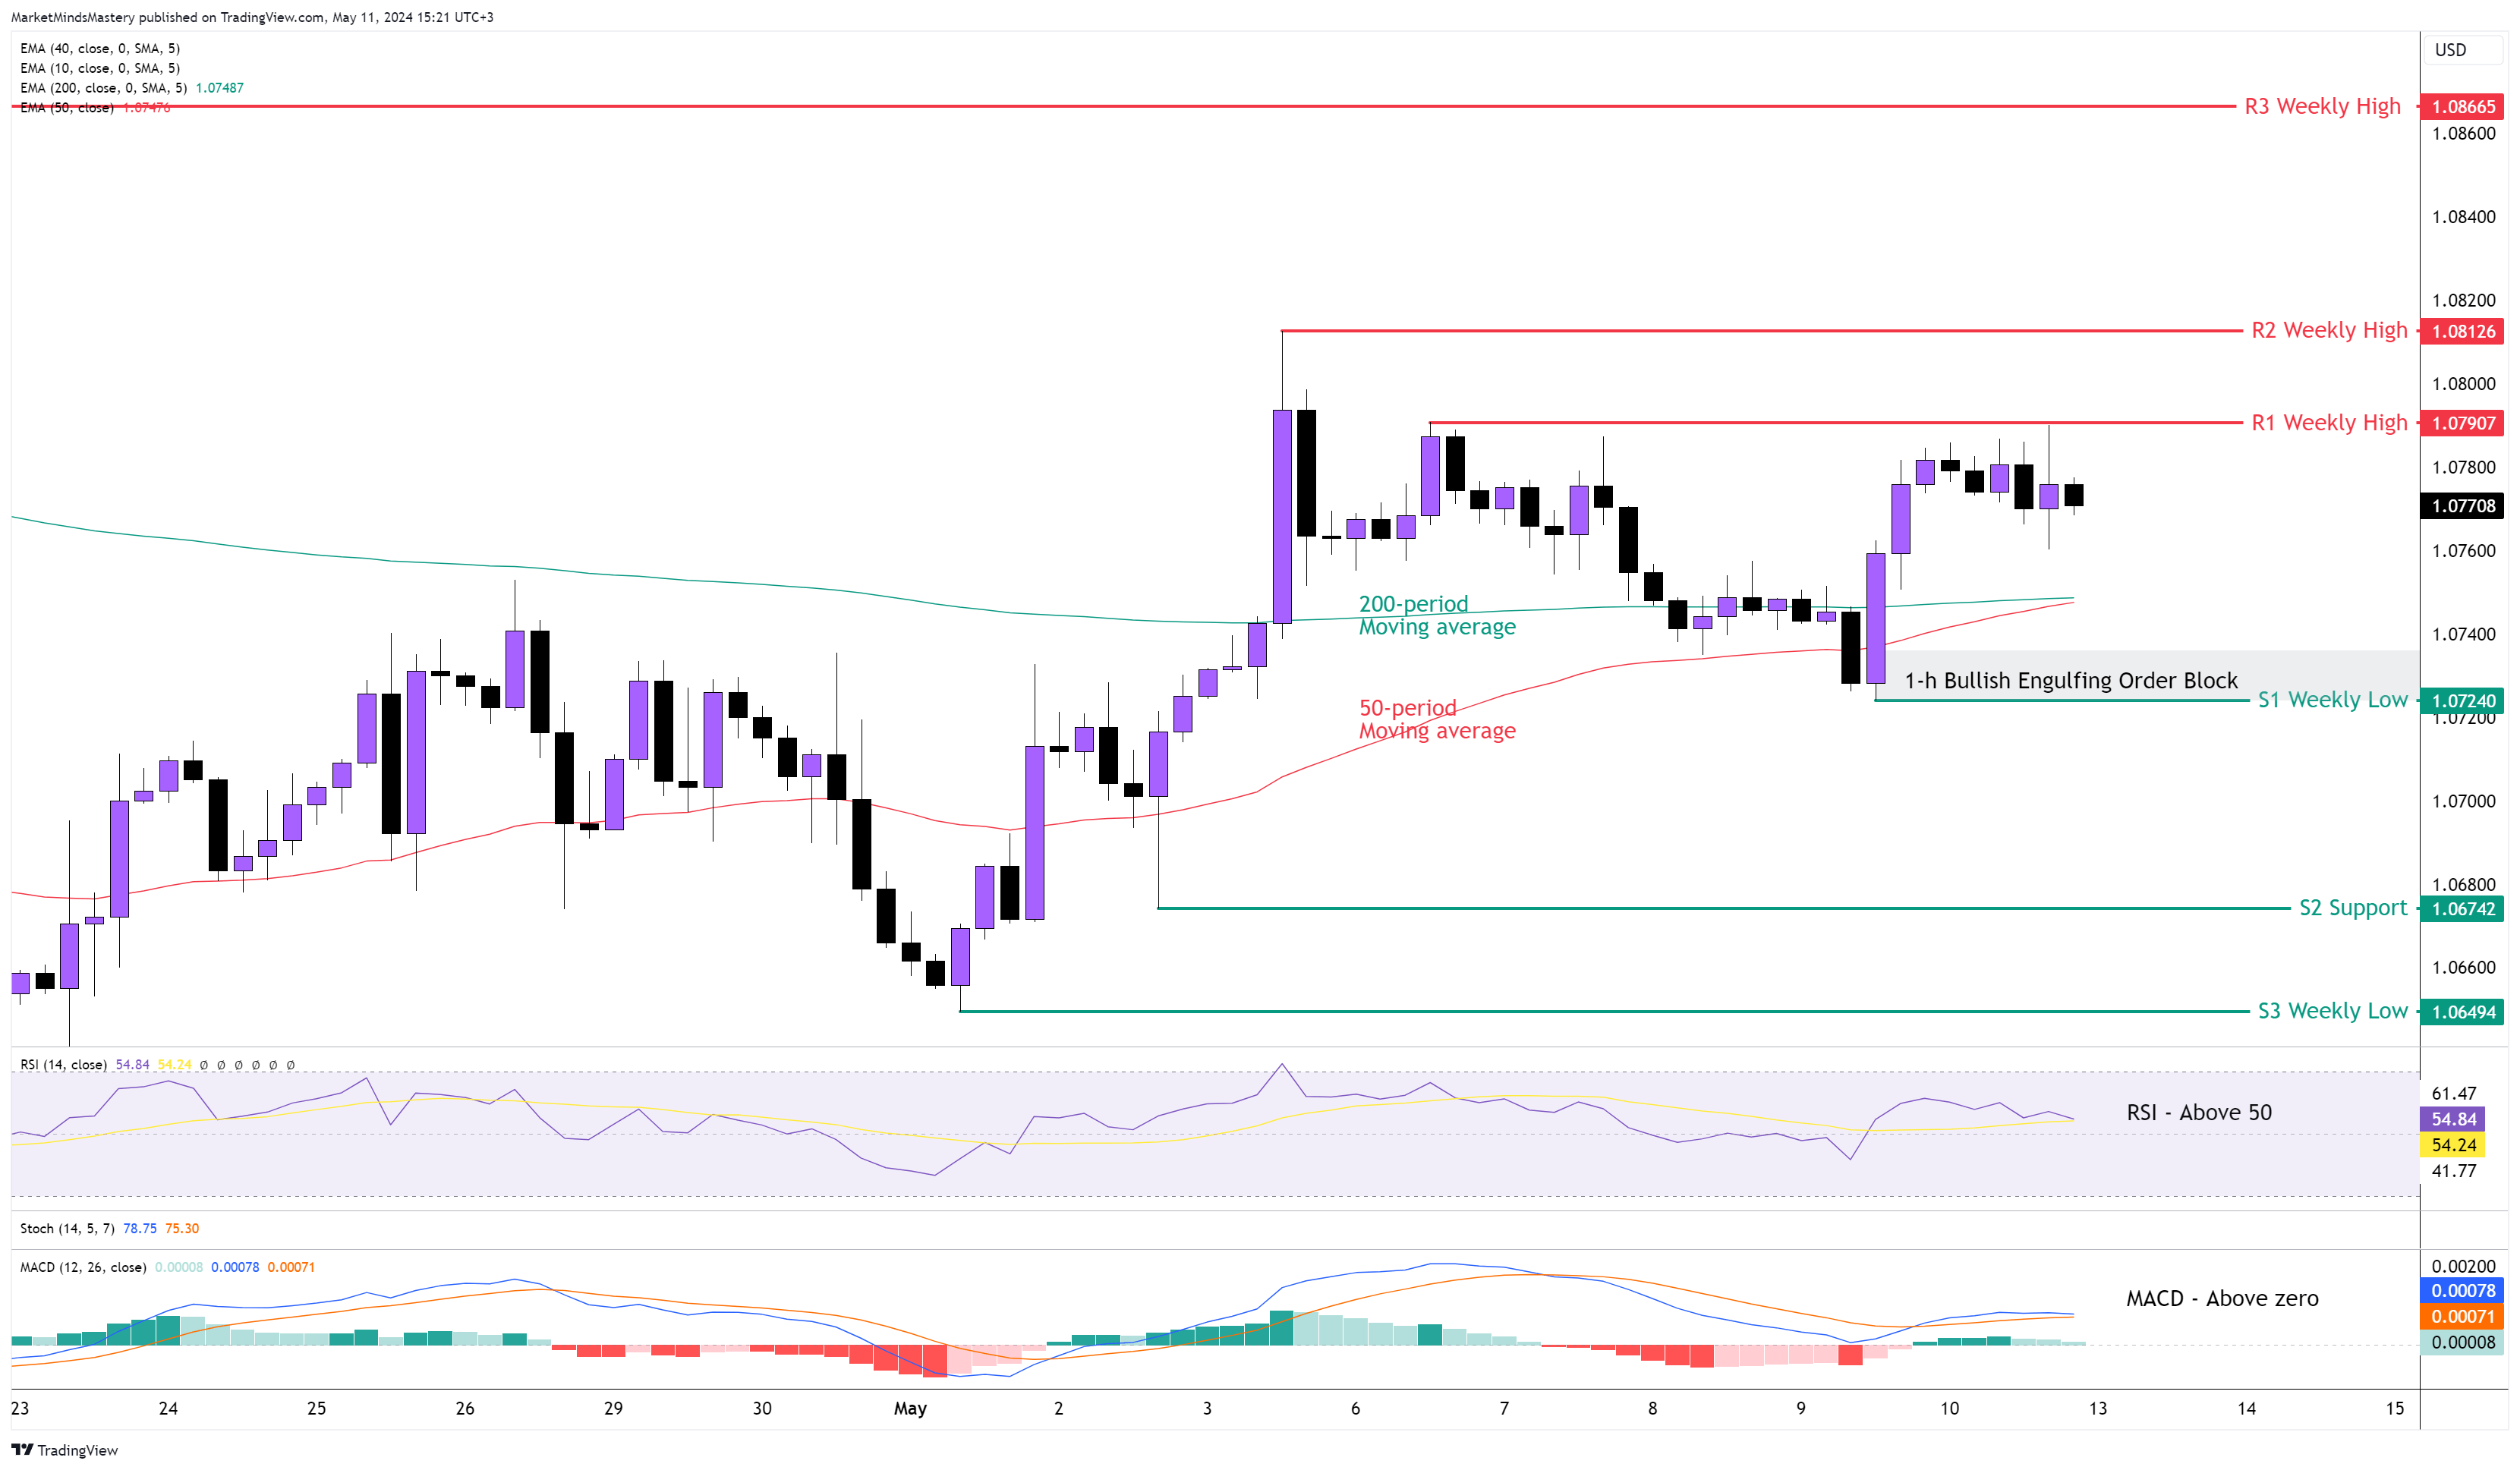
EUR USD 4H

The low volatility accompanied by the previous week’s trading was evidenced, and the EURUSD moved only approximately 60 pips. This week looks prominent primarily due to the CPI event in the US. We expect to see small moves until the news is released. The 50-period is below the 200-period moving average, supporting the major downtrend. The RSI line is above 50, and the MACD is above zero, revealing the short-term bullish moment built in the last 14 trading sessions (on the 4-hour chart). If the downtrend resumes, it means the price will move downwards. In this case, the first obstacle will be the Bullish Engulfing Order Block, which created the bias of the previous week’s support and is named S1 on the chart. If the price penetrates it and moves downward, the next support area, S2, is around 1.06742.
On the other hand, if the price moves upwards, the previous week’s high will be the first resistance area, R1, around 1.07907. As the weekly candle was an inside candle, the next resistance, R2, is very close to the R1, only 20 pips away, around 1.08126. If the price penetrates R2 and keeps moving upward, the R3 resistance will be around 1.08665.
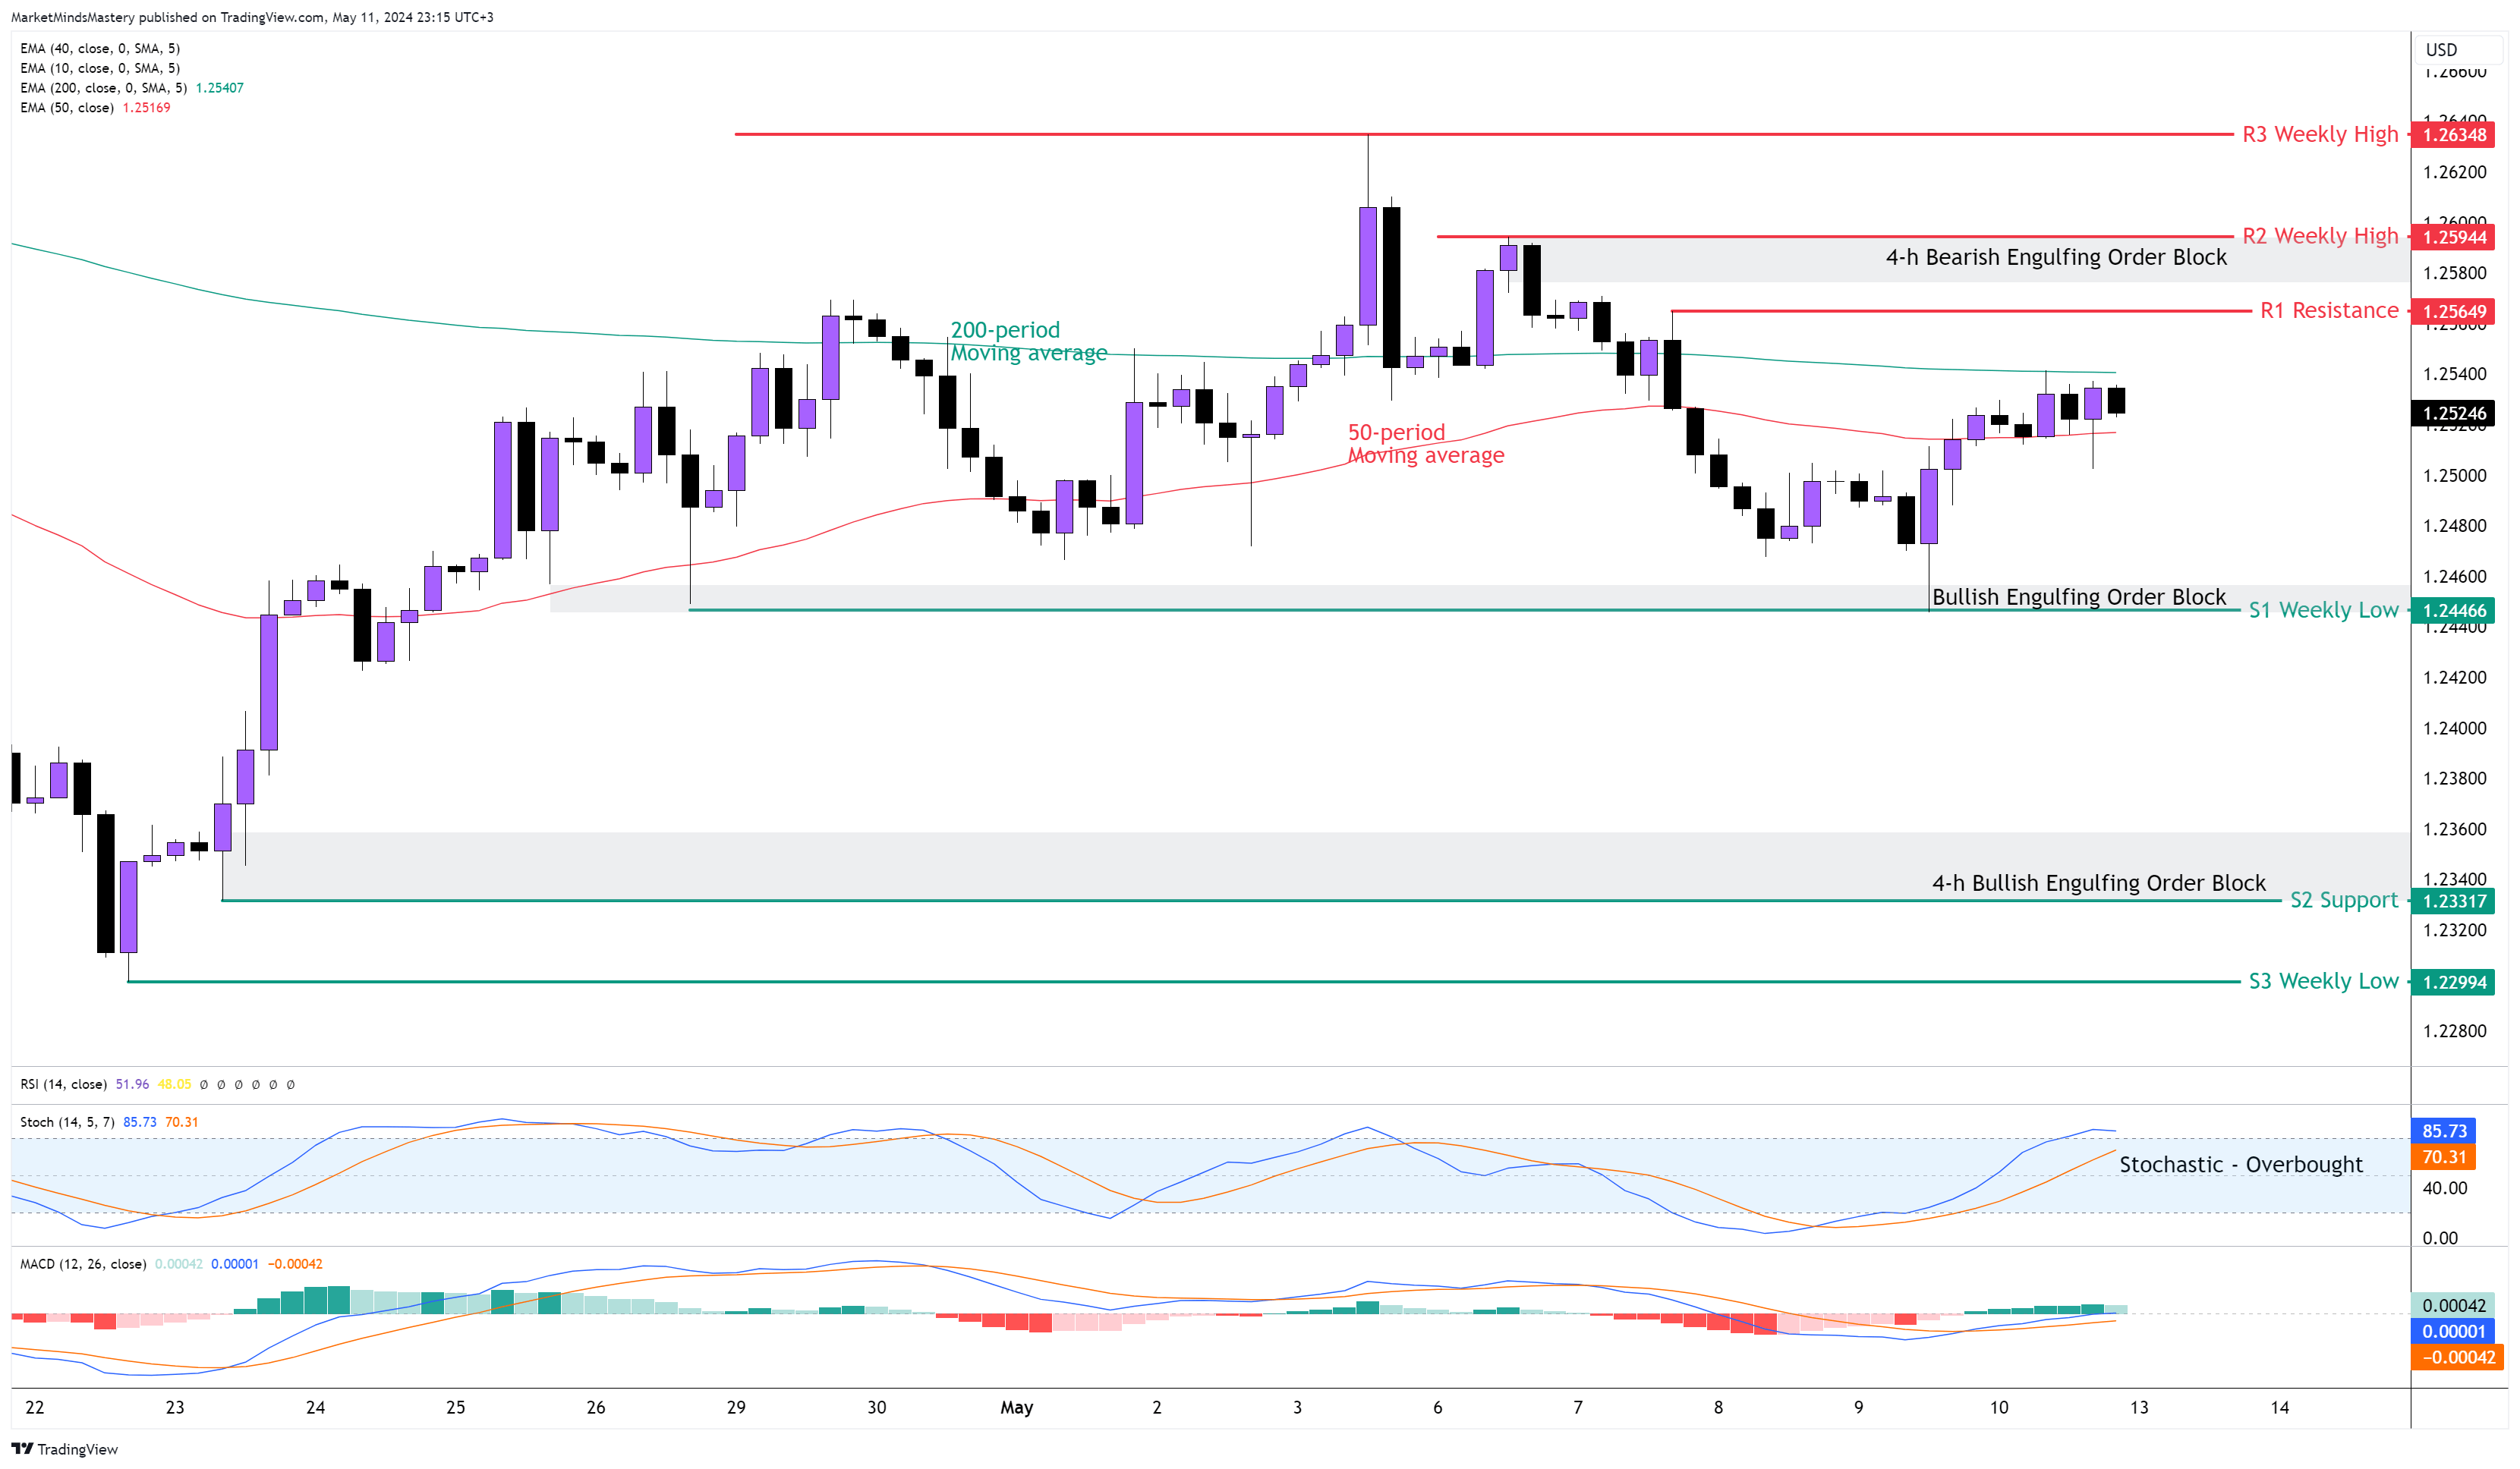
GBP USD 4H
Although more Monetary Policy Committee members voted for interest rates to drop in the UK last week, the sterling didn’t create any directional downward move. It traded until the previous week’s low, falsely broke it, bounced off and moved upwards. As the volatility was low, like in the AUDUSD and the EURUSD, the same in the GBPUSD, the price didn't create any higher high. The weekly chart still makes lower highs and lower lows. Therefore, the primary trend is a downtrend. The 50-period is under the 200-period moving average, and this is a bearish bias. The MACD is under the zero line, which is considered bearish. As a faster indicator, the Stochastic is in an overbought condition.
If the price follows the primary downtrend, it is expected to move downwards, with the first support S1 being the 1.24466 level. This is the lowest price the market traded last week. The wicks of the candles created this S1 support, left behind the Order Block, which can cause price reactions. If the price breaks below the S1 and moves lower, the following S2 support is around 1.23317. A Bullish Engulfing Order Block formed on the 4-hour chart hasn’t been tested yet. If the market conditions change and the price moves upwards, the first resistance area, R1, is approximately 1.25649. A few pips above, it is a Bearish Engulfing Order Block, and the R2 resistance is around 1.25944. Further higher is the R3 resistance, a weekly high of around 1.26348.
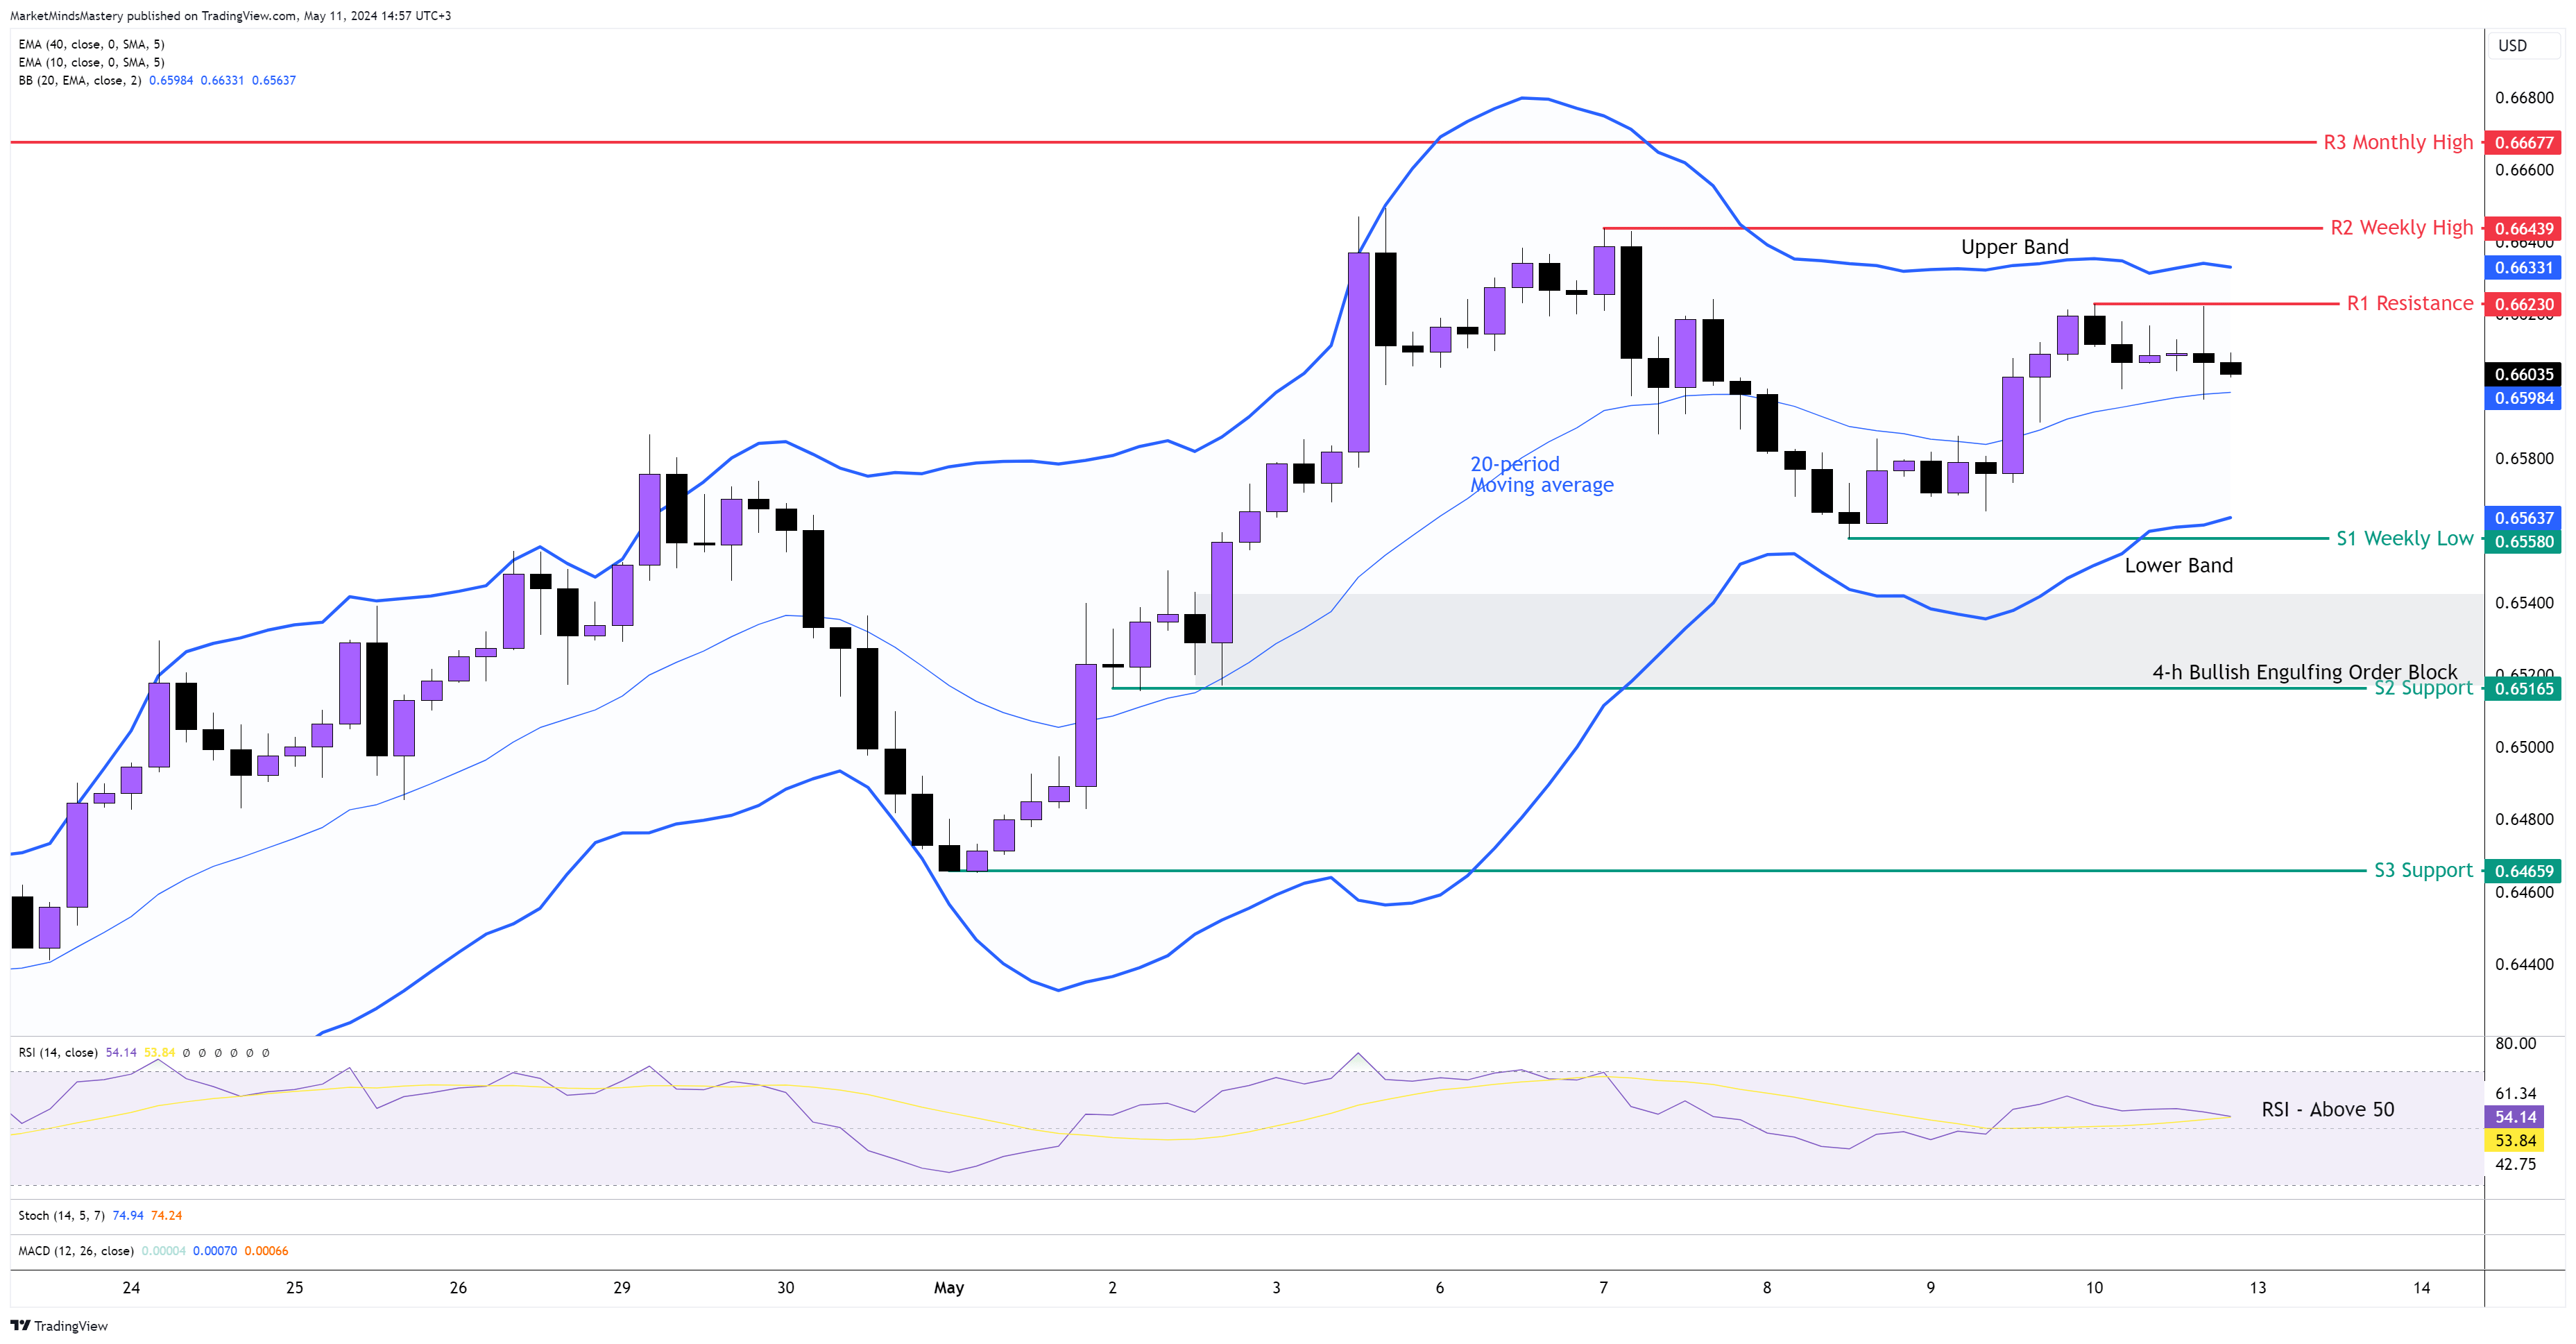
AUD USD 4H
The weekly chart ended with an inside candle and a formation of long-legged doji. This candlestick pattern often serves as a reversal when it is formed at resistance. The pair moved approximately 80 pips in one week, which is considered a very small move, lucking volatility based on the weekly ATR indicator.
Based on the 4-hour chart, the price didn't create any significant market structure. Using the Bollinger Band indicator, the upper band is flat, and the lower band is inclining. This is an indication of market weakness. The RSI is above 50, which has a bullish sentiment. This week, significant events will impact both the AUD and the USD.
The pair should move lower if the macroeconomic events converge with the primary chart’s downtrend. If this happens, the first area that will be used for support will be the previous week’s low, which shows as the S1 on the chart, which is approximately 0.65580. If the price drops lower, the next support area is the S2, around 0.65165. A few weeks ago, a Bullish Engulfing Order Block that formed at this level could cause additional support in the price. On the other hand, if the price rallies, the first resistance area will be the R1, around 0.66230. If the price penetrates it and moves higher, the next resistance will be the previous week's high, around 0.66439.
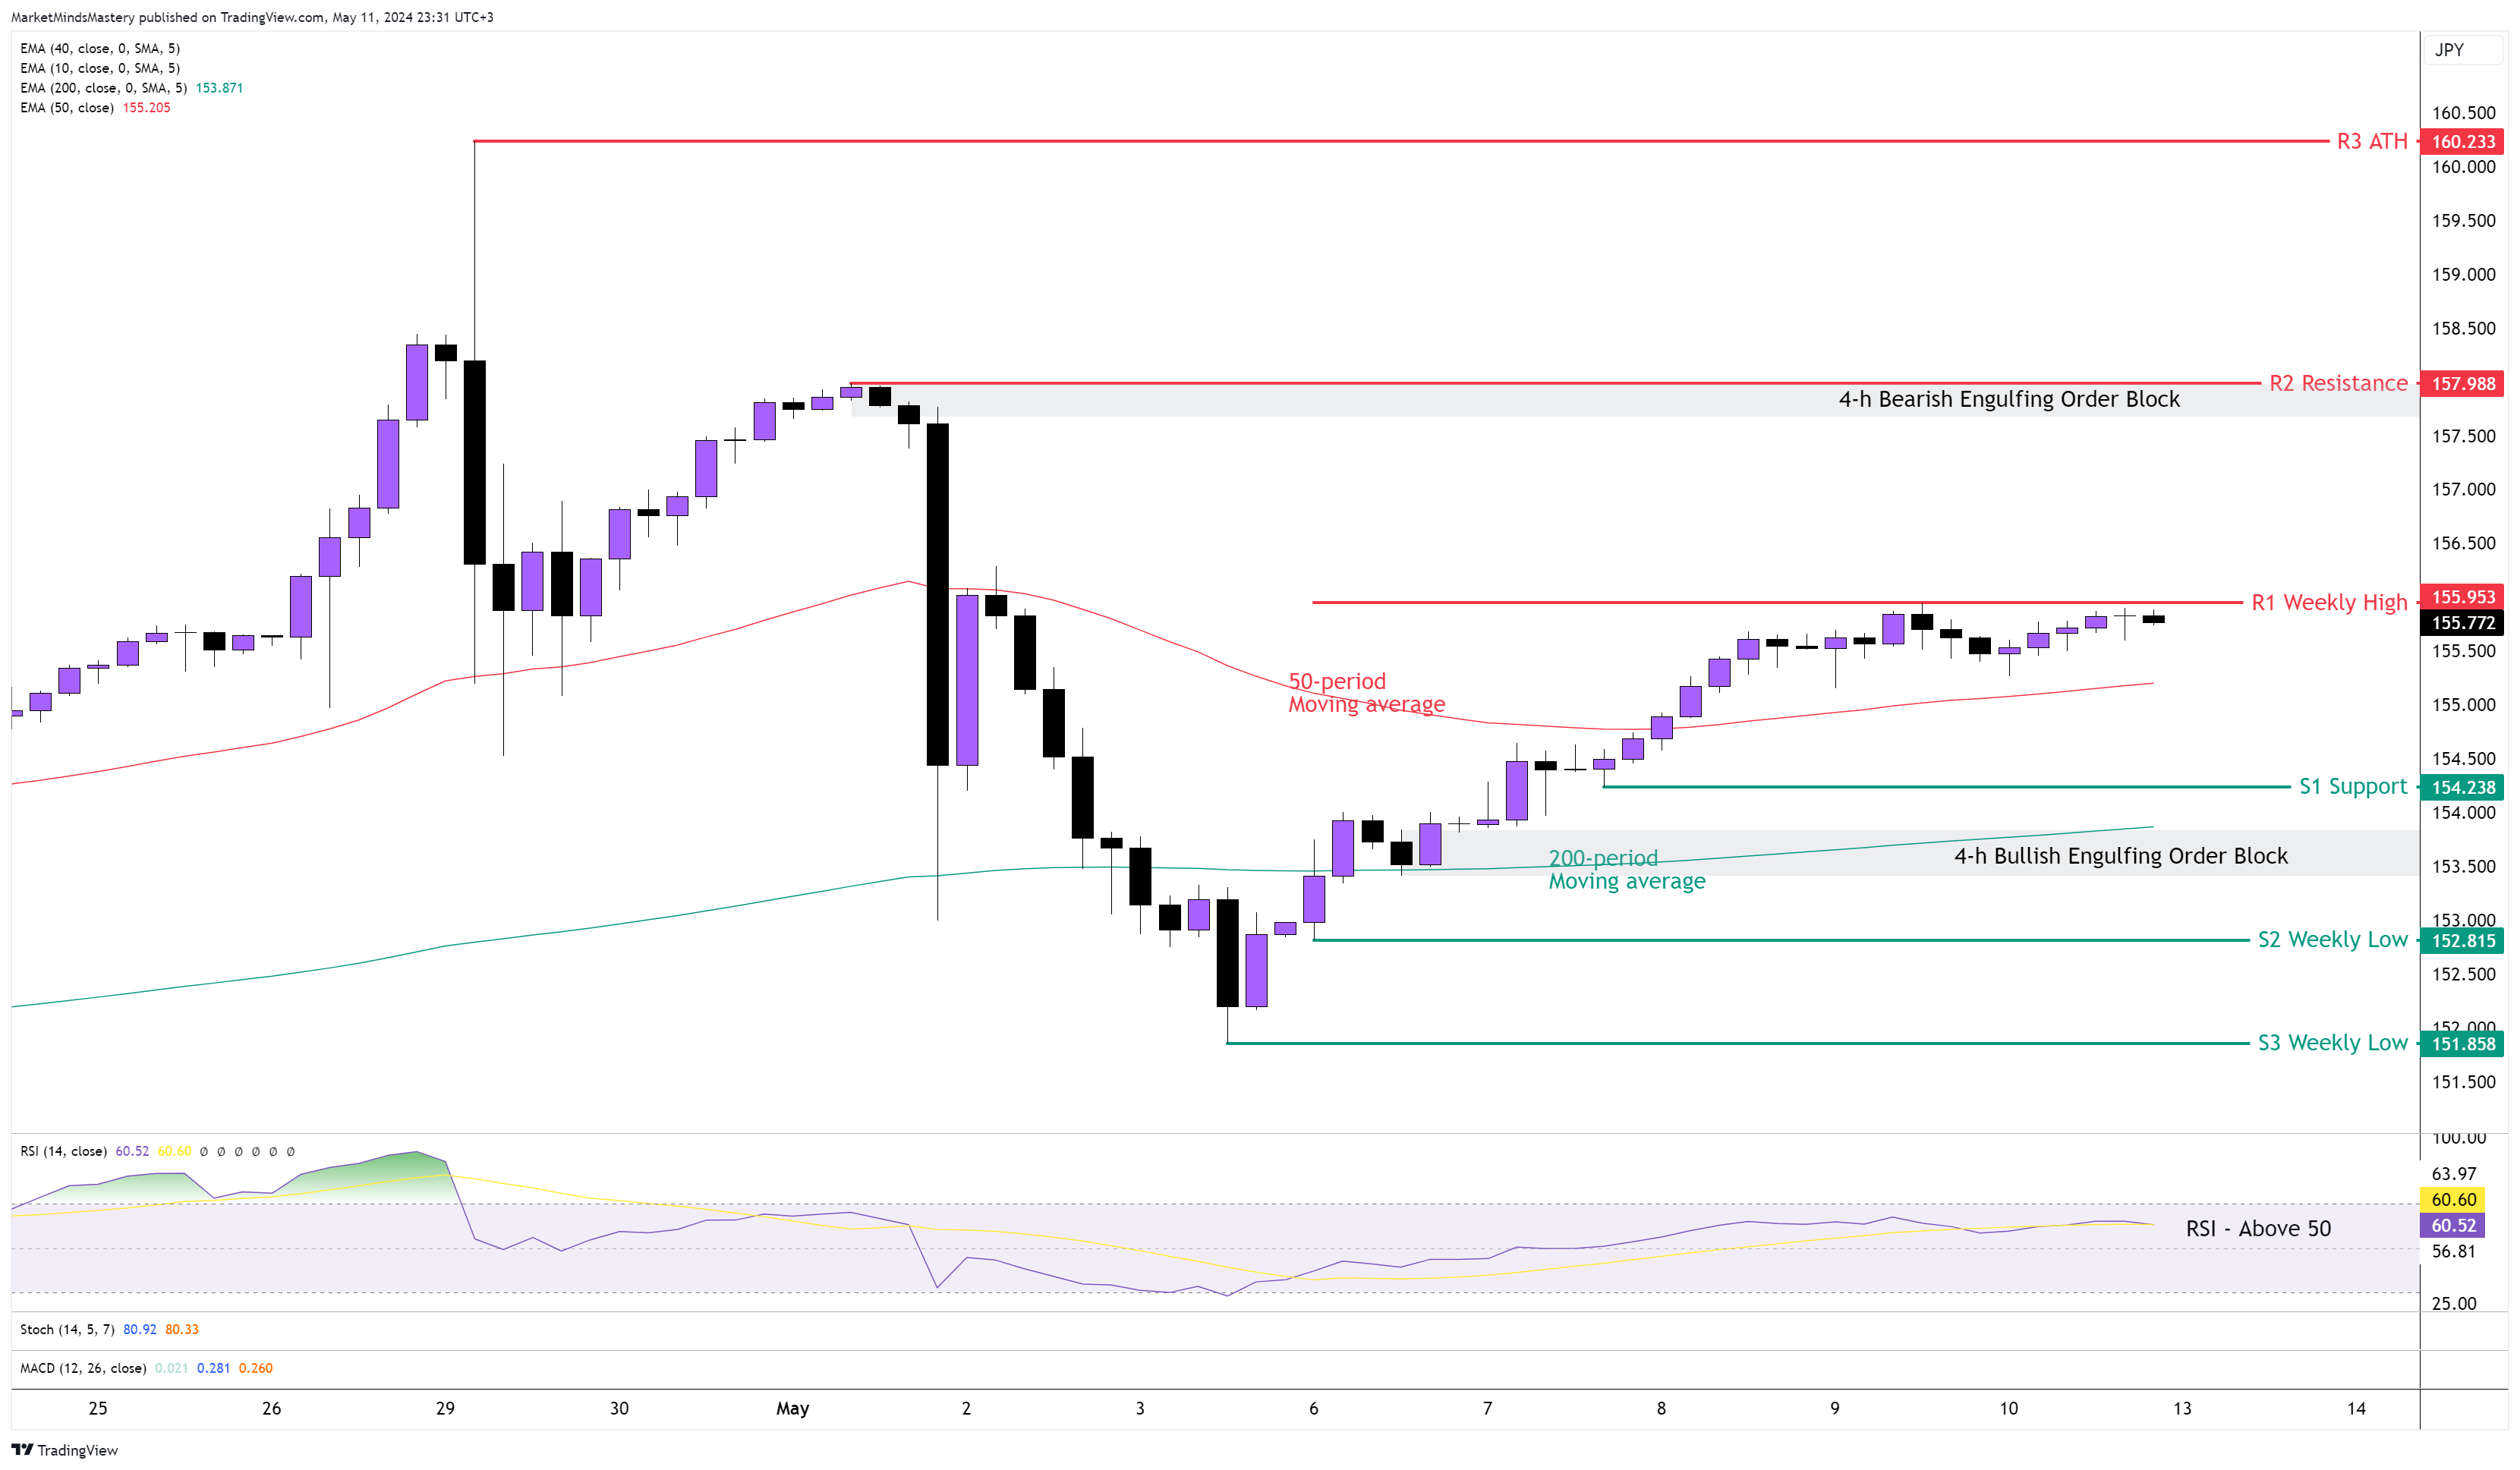
USD JPY 4H
Since the beginning of the previous week’s trading, the price has increased with a series of higher highs and higher lows- a trend we call a minor trend. That was in alignment with the primary trend on the weekly chart. The price retracement, shown with the black candles, occurs in a narrow trading range, indicating that there are more buying orders than selling orders in the market (imbalance between buy and sell orders). The 50-period is above the 200-period moving average, which has a bullish bias. Additionally, the 14-period RSI is above 50, which has bullish implications.
Starting Monday, if the price continues its upward move, it needs to penetrate the previous week's high decisively, as shown in the R1 on the chart, which is around 156. As last week’s candle was a Bullish Marubozu - which means the close of the candle was very close to its candle high, it indicates that the price is likely to break above it, considering the bullish minor and primary trend will continue. If the price closes above the R1, the next resistance area, R2, is around 158. The level becomes significant because of the Bearish Engulfing Order Block created beginning in May. On the contrary, if the price declines and moves lower, the first support area, S1, is around 154.238. A move under the S1 funds the next support area, S2, approximately 152.815, and the S3 support around 151.858.
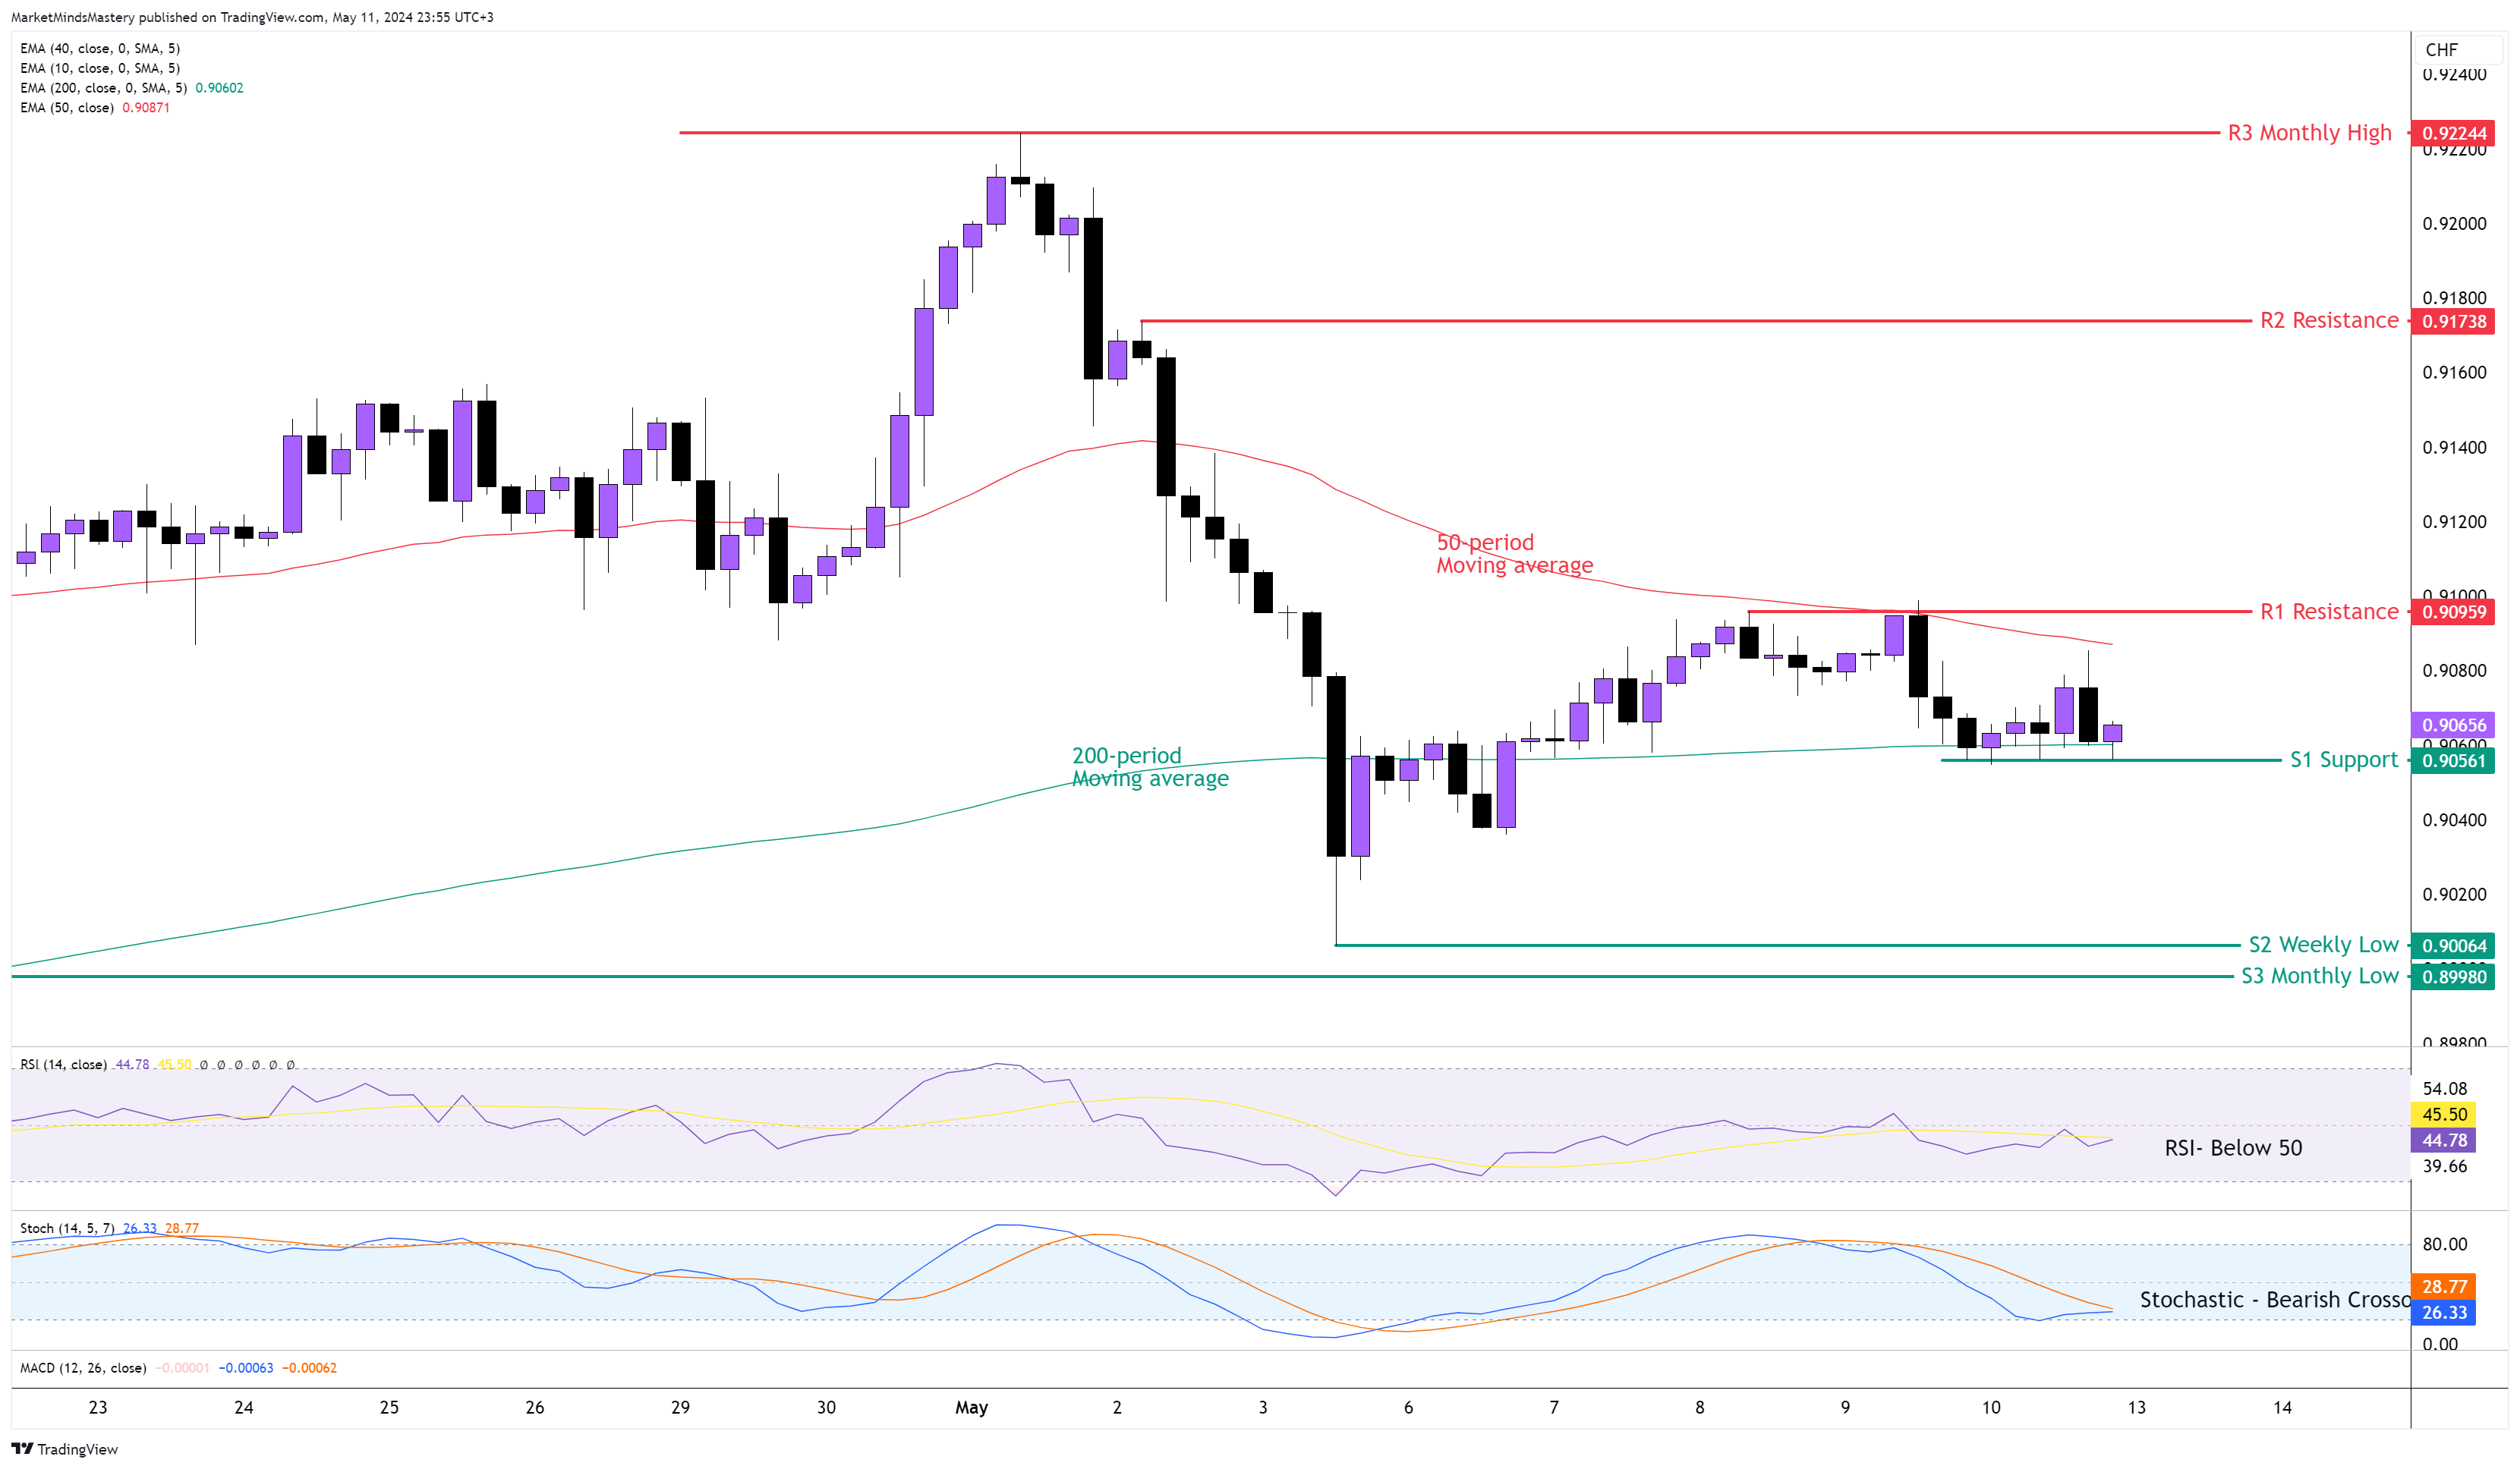
USD CHF 4H
As we explained in the previous week’s analysis, the Bearish Engulfing candle formed on the weekly chart around a significant resistance level could fuel the selling pressure in the market. However, the price ended as an inside candle without evidence of the sellers taking over.
We can interpret this as a sign of weakness, even temporarily.
Having the price congesting within the 50-period and the 200-period moving average indicates a trendless market even though the fast-moving average (50) is above the slow-moving average (200).
Both oscillators, the RSI and the Stochastic, show numbers under the middle lines, which we explain as market weakness.
If the price decides to increase, the first resistance area, R1, will be the 0.90959 level. If the R1 level penetrates, the price will create a higher high and higher low formation and is expected to rally until the next resistance area, R2, around 0.91738. On the other hand, if the price declines and moves lower, the first support area, S1, is the 0.90561 level. A price area which is close to the 200-period moving average. If the price breaks below the S1 and moves downwards, the next support area, S2, is approximately 0.9000, a weekly low and a round number. Round numbers usually host significant amounts of limit and stop orders.
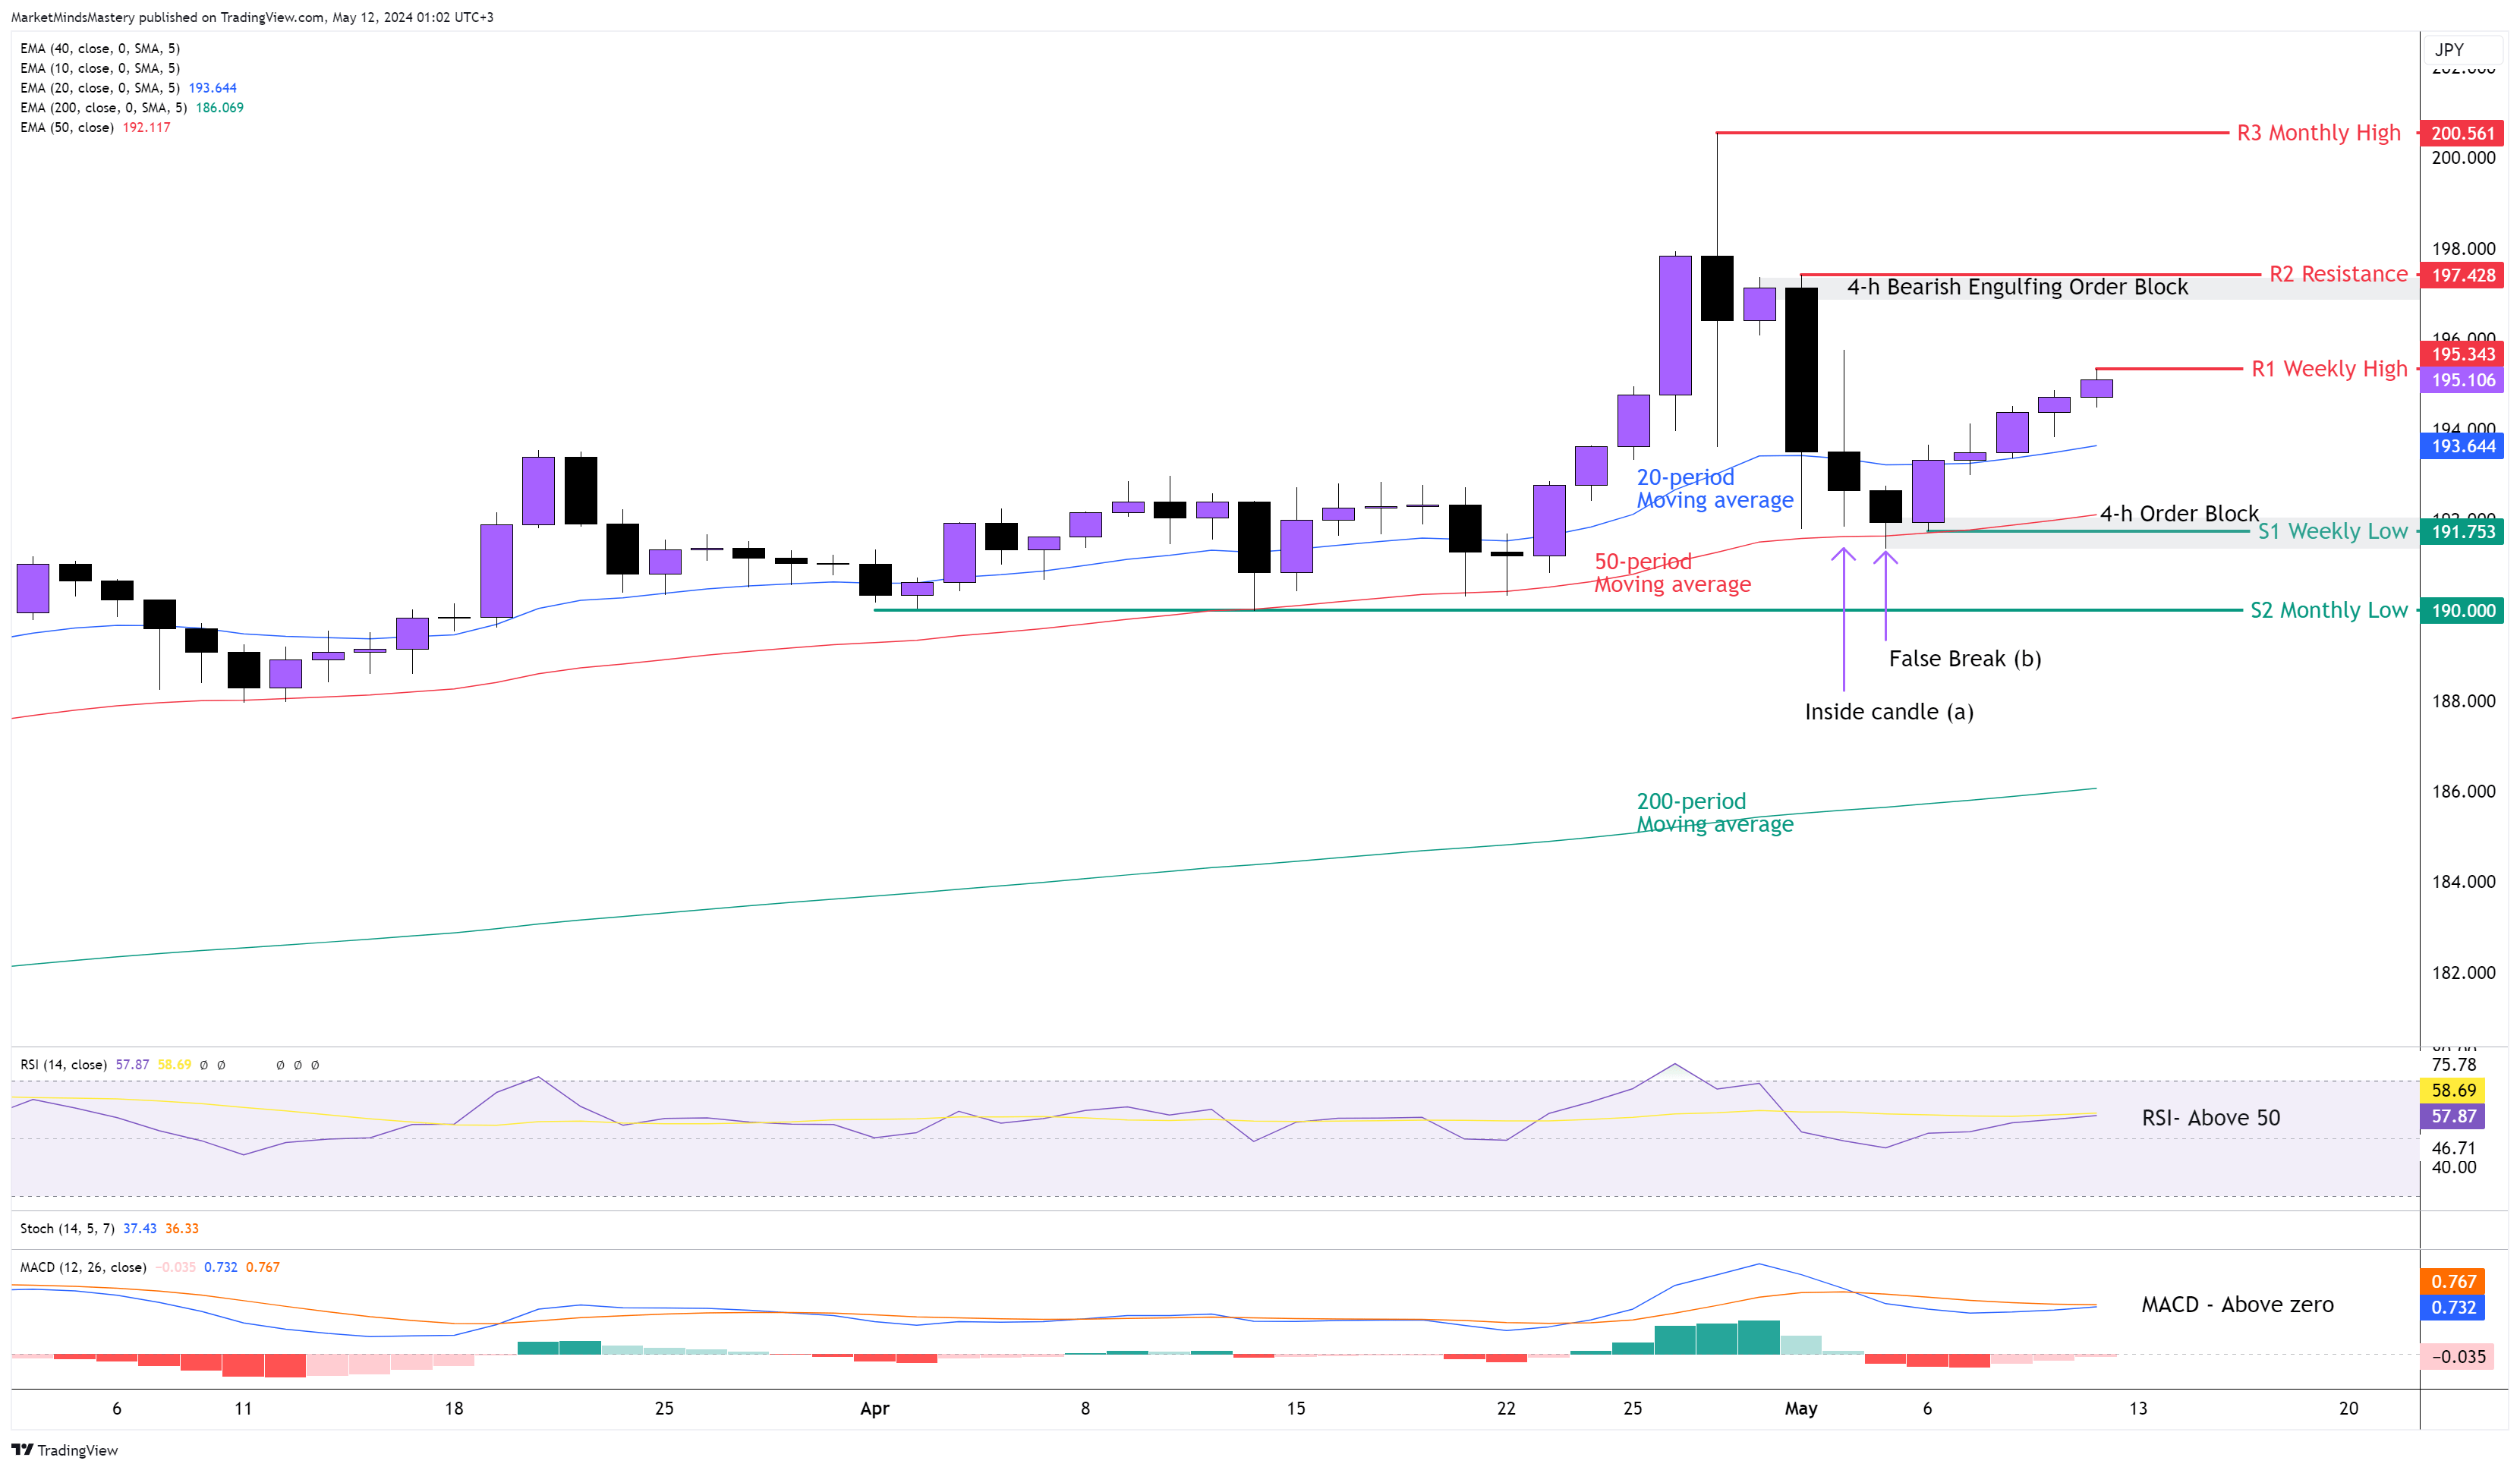
GBP JPY DAILY
The Japanese Yen was the weakest currency last week. Looking at the last five candles (all the previous week’s activity), the price was increasing every day (as this is the daily chart). Considering that the 20-period is above the 50-period and both above the 200-period moving average, this market has bullish implications. Additionally, the RSI is above 50, and the MACD is above the zero line. Also, the histogram of the MACD shows a gradual bullishness ( the red boxes become shorter). The previous week’s candle was an inside candle, and the weekly trend is upwards.
The bounce off the 50-period moving average with a false break (b) out of the inside candle (a) and the creation of the swing low at point (b) adds to the market’s bullishness. Starting Monday, if the price keeps moving upward, the previous week’s high will be the first resistance area, R1, around 195.343. If the price penetrates it and moves higher, the following resistance area, R2, is approximately 197.42. On the 4-hour chart, there is a well-defined Order Block, which can cause the price to stop at least temporarily. On the other hand, if the price declines and moves downwards, the first support area, S1, is around 191.75. At this level is also the 50-period dynamic moving average, which can add weight to the support level.
Additionally, an Order Block was established from the previous week’s trading activity. If the price penetrates the S1 and declines, the next support area, S2, is a monthly low, and it is around 190.00. A round number that potentially can cause a market reaction.
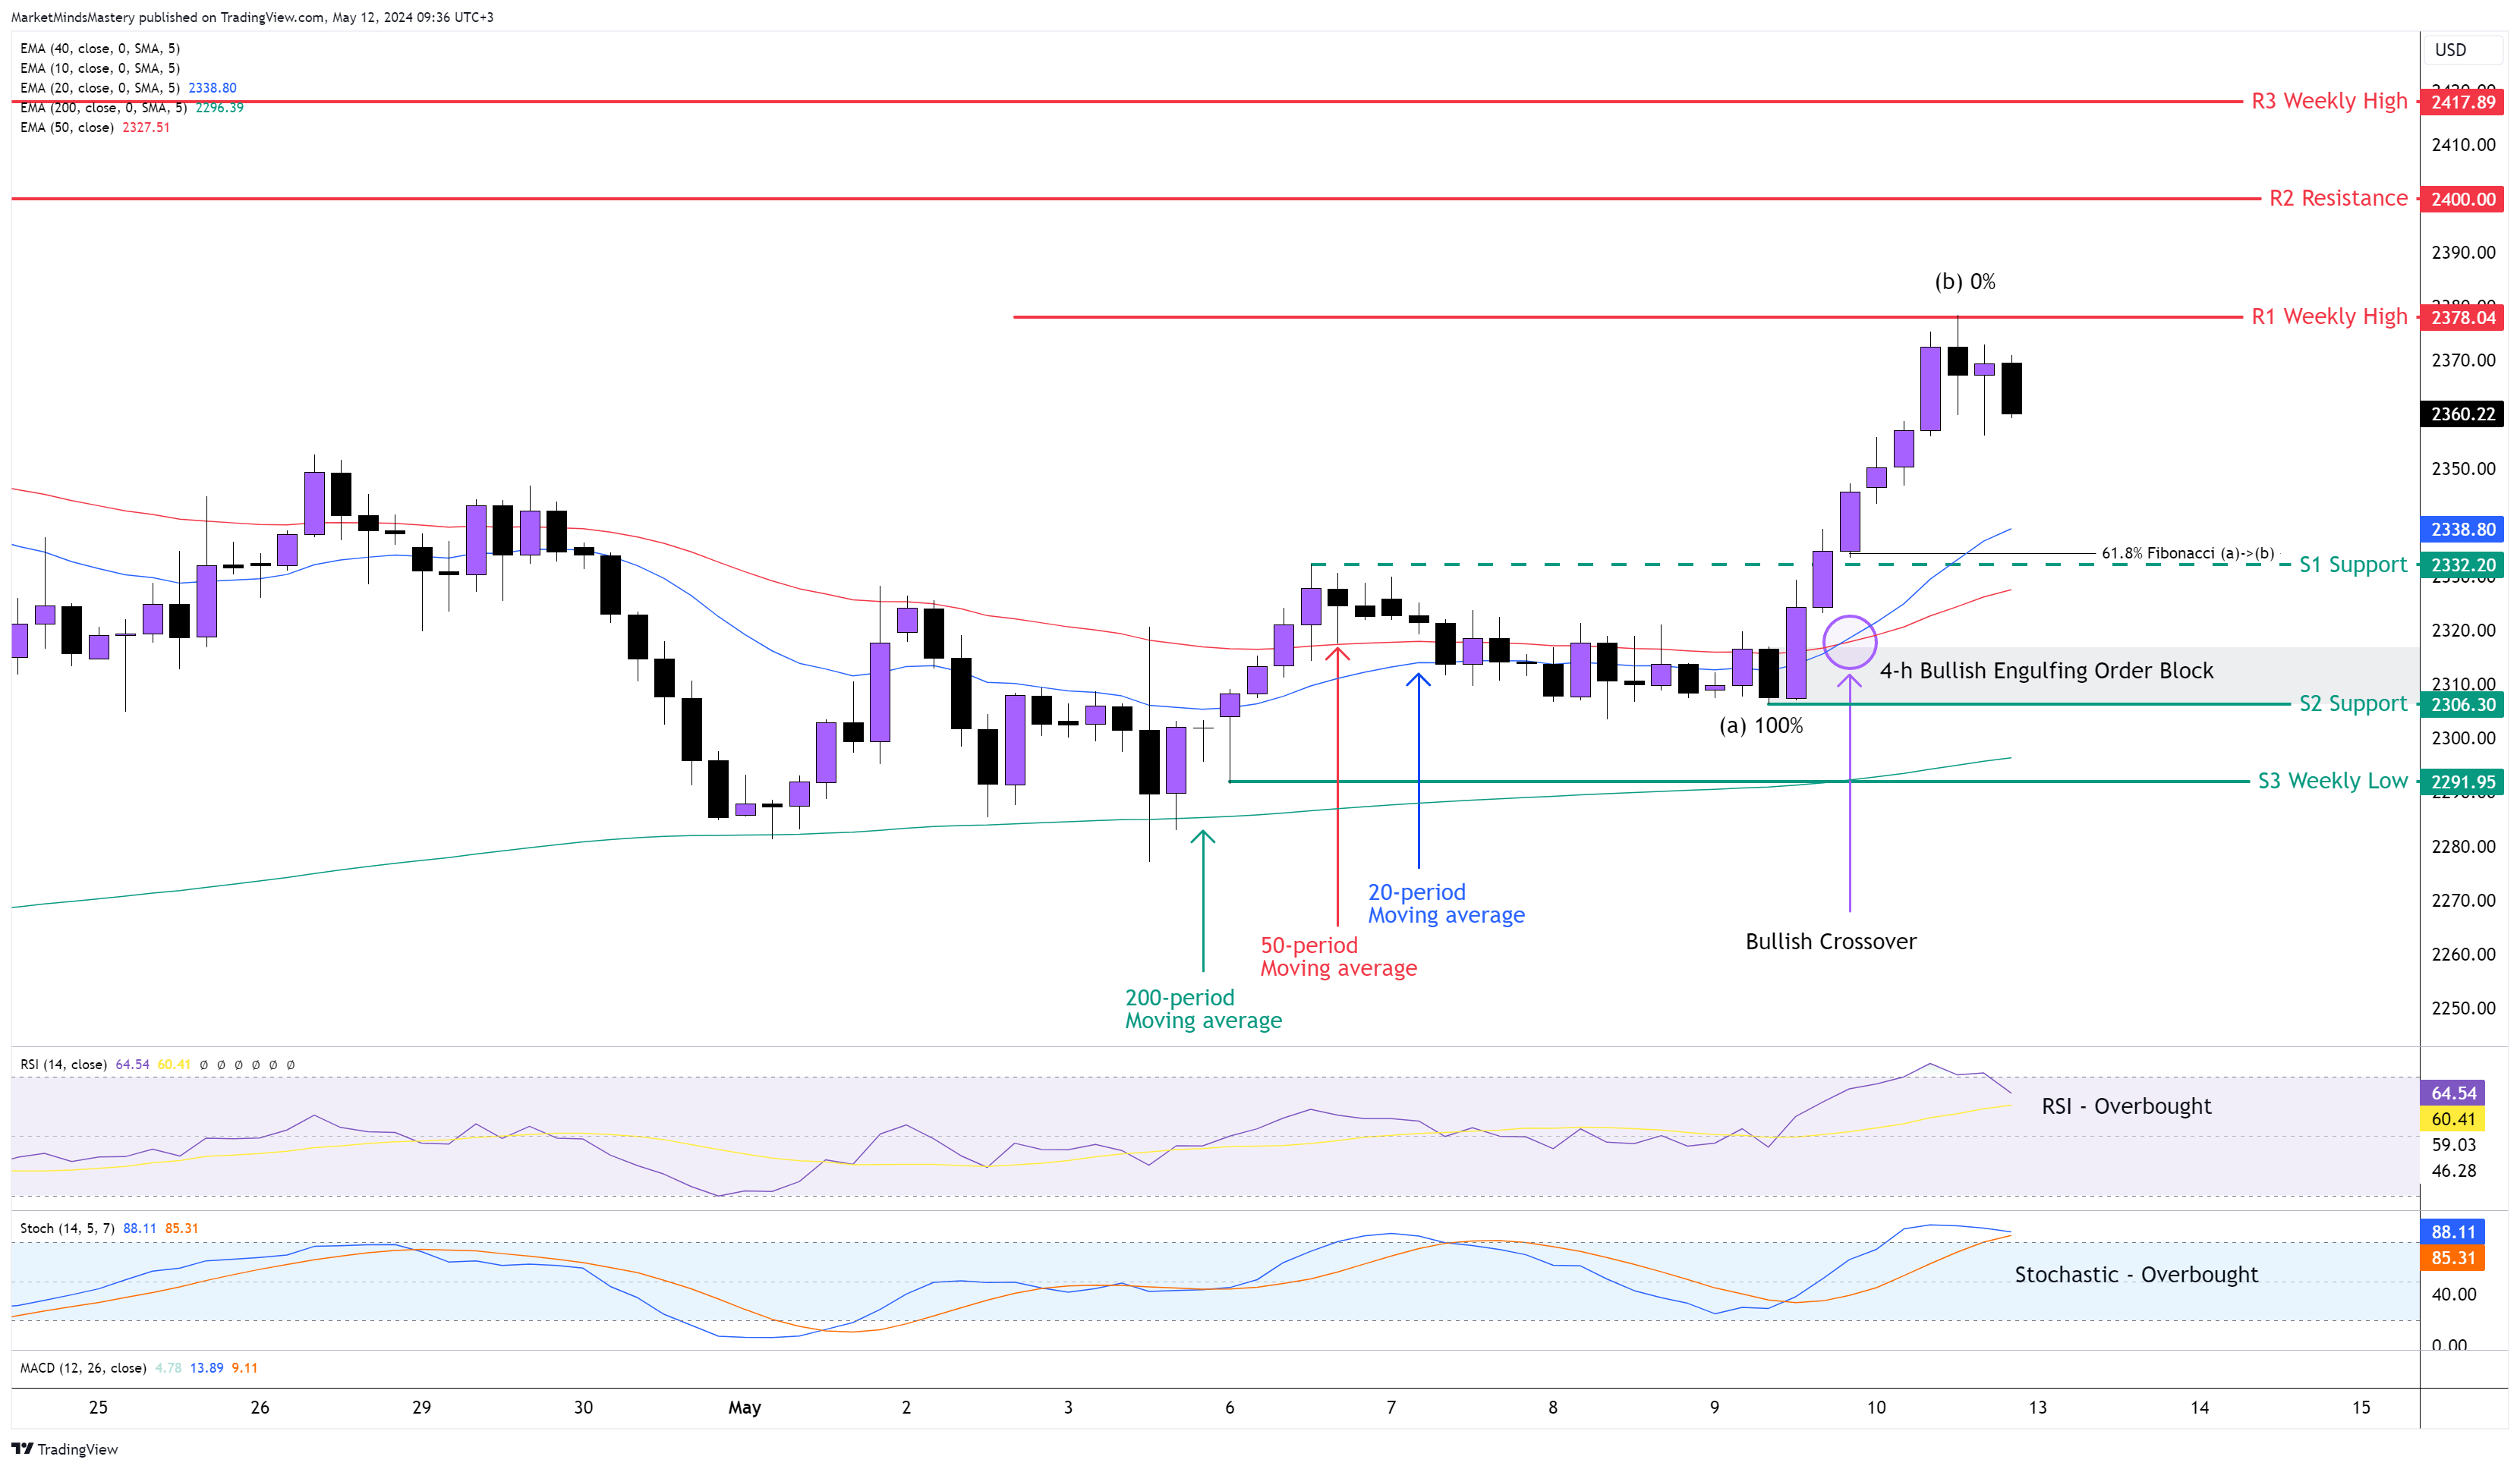
GOLD 4H
Last week, the price of Gold rallied from the Doji candle and declined once it entered into the Bearish Engulfing Order Block we expected, as we explained in the previous week’s analysis. The weekly candle ended as an inside candle within the context of an uptrend. On the 4-hour chart, the 20-period recently crossed above the 50-period, and this is called a Bullish crossover. Both averages are above the 200-period moving average, which is bullish. Both the RSI and the Stochastic oscillators are in an overbought condition, indicating a bullish market. The price created a swing high at point (b), and using the Fibonacci retracement tool, we market the 61.8%, which is the Golder Ratio. If the price declines, the first support area is the S1, around $2332. This price level is a cluster of the S1 support, the 61.8% retracement and the dynamic moving averages.
If the price declines further and closes under the S1, the next support level is around $2306, which is shown as the S2 on the chart. This level is significant because a 4-hour Bullish Engulfing Order Block was formed. Conversely, if the price moves upwards, the first resistance area, R1, is the previous week’s high round of $2378. A break above the R1 finds the next resistance, R2, around $2400.
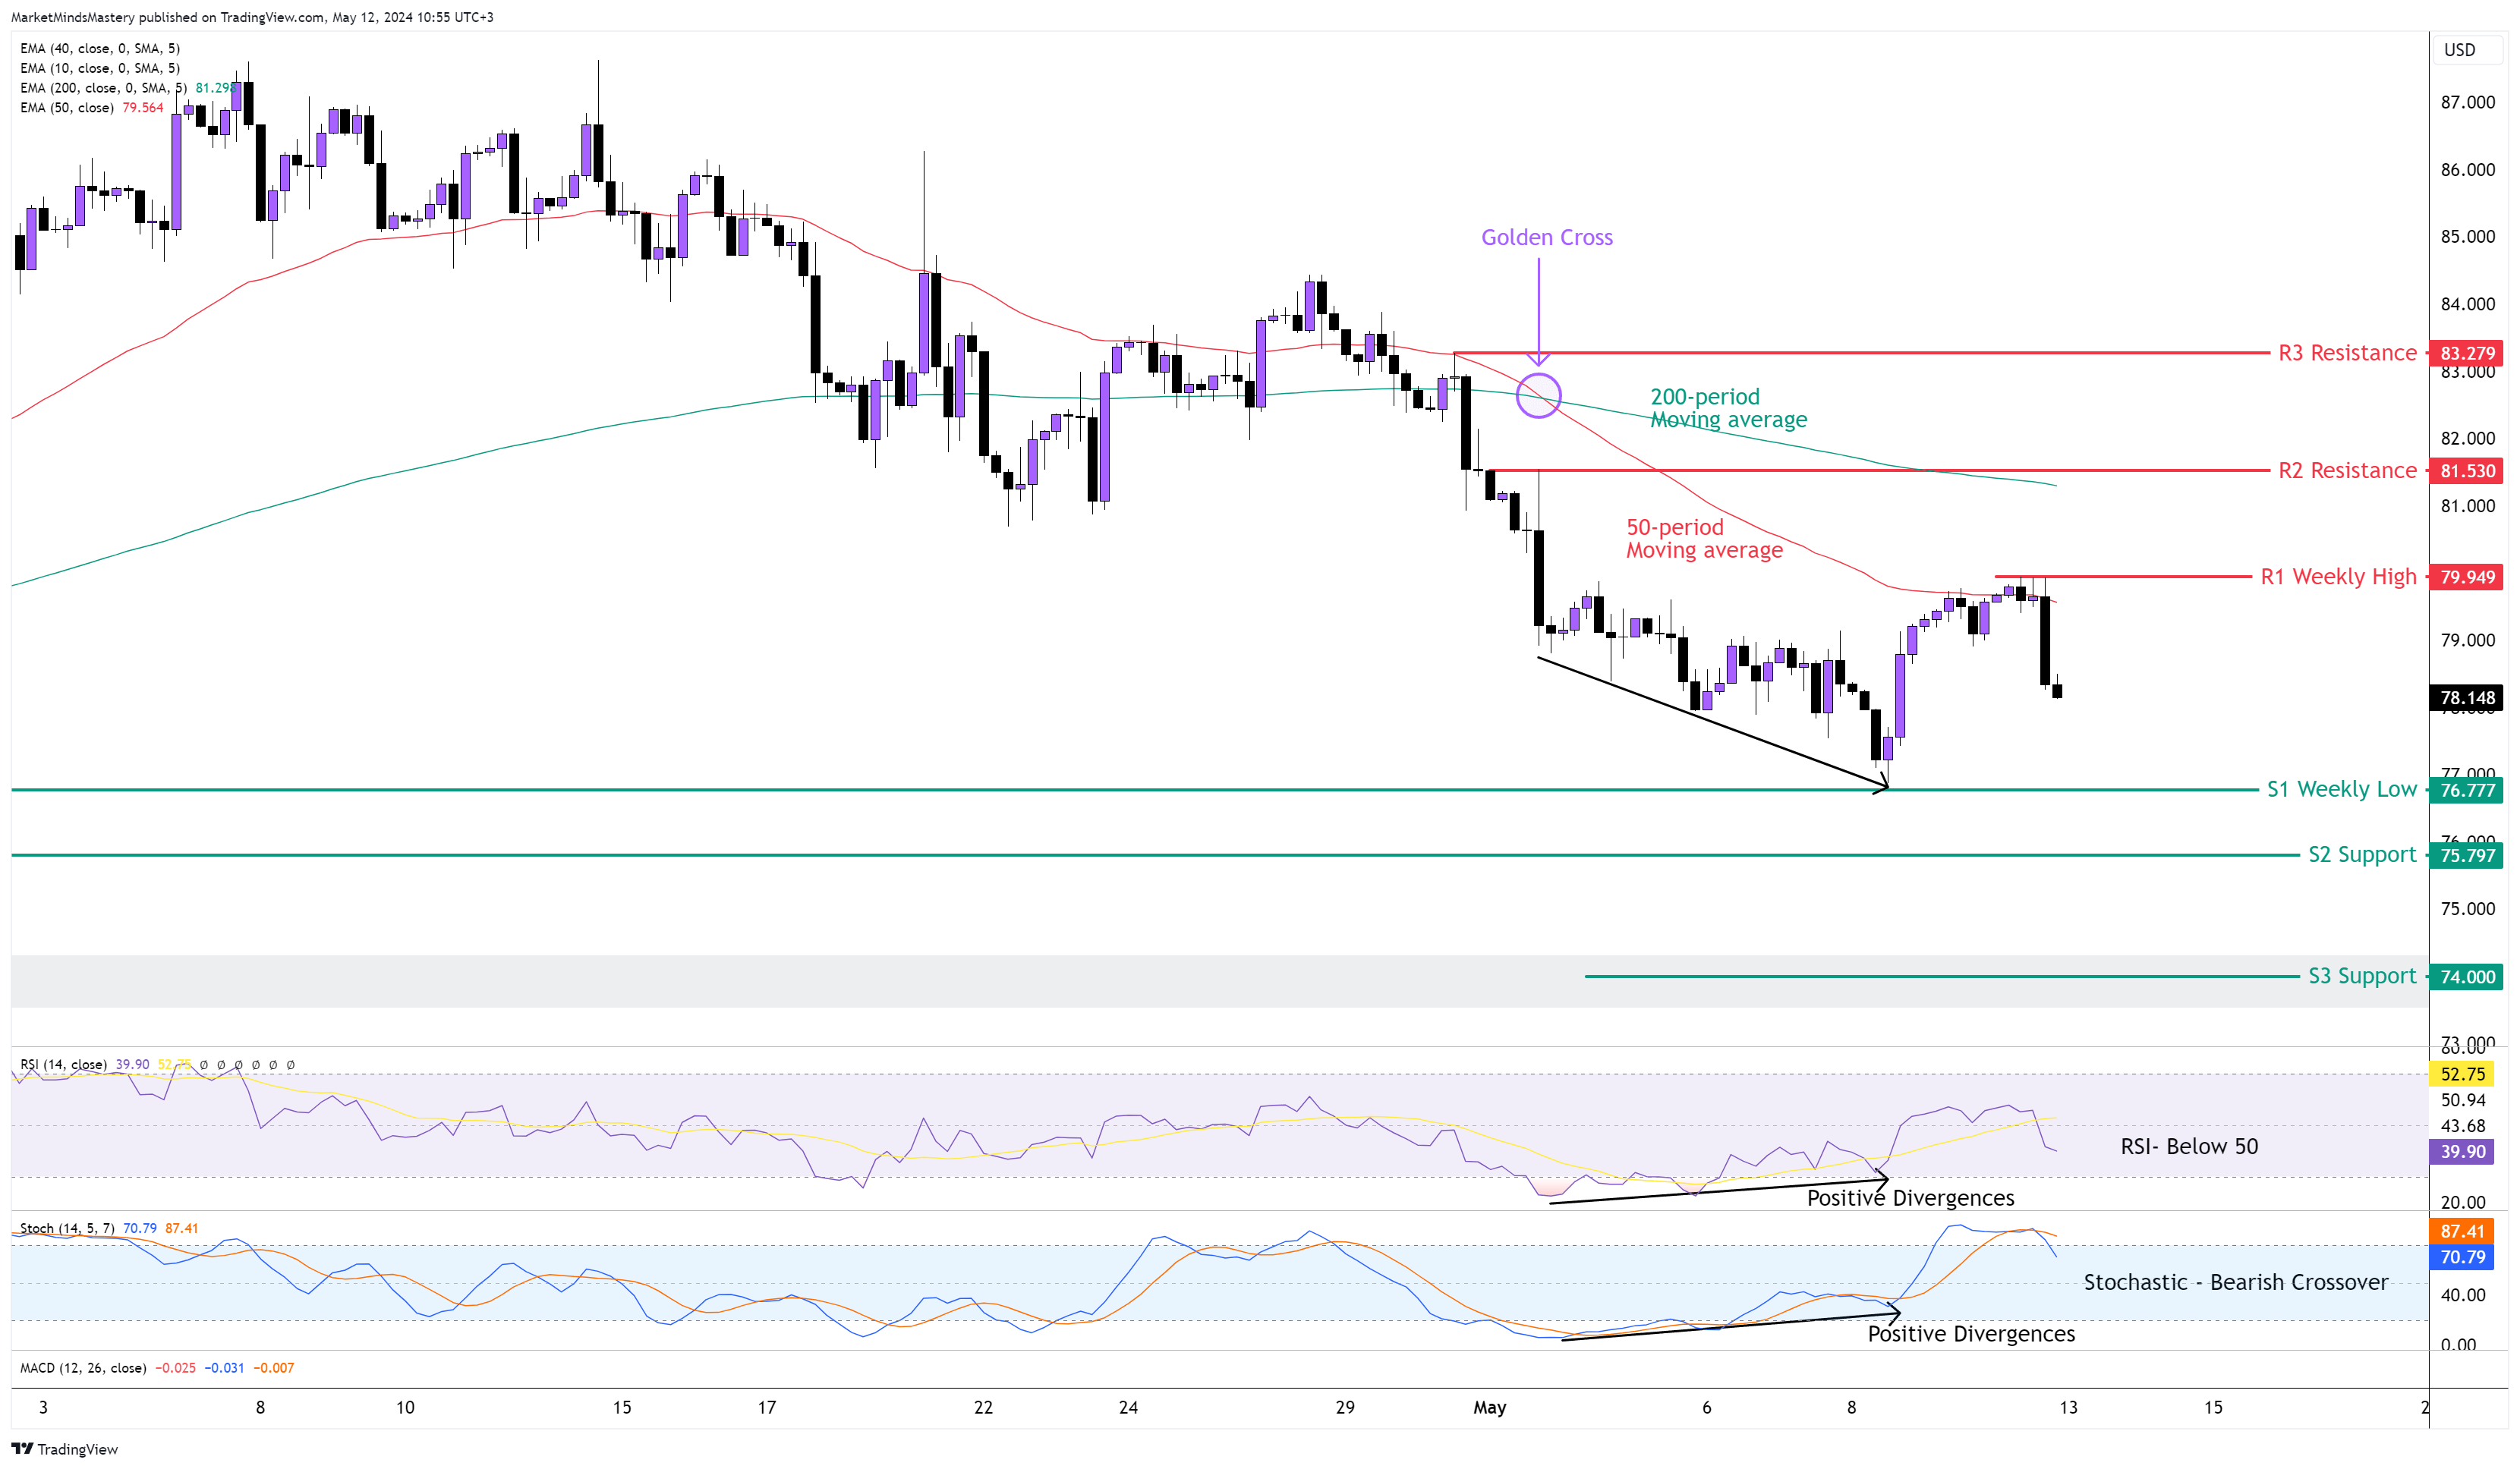
US OIL 4H
Following the Head and Shoulders reversal pattern front the previous week, the price retraced a portion of its downward move during the last week, and on Friday, it closed as a Bearish Engulfing reversal. The longer the H&S it takes to build, the stronger the pattern becomes. Therefore, the pattern is still valid as it meets the criteria we explained the previous week (refer to the last week's analysis).
The 50-period is under the 200-period moving average after the Golder Cross and has bearish implications. The RSI and the Stochastic printed Positive (Bullish) Divergences, forcing the price to return to the 50-period. Currently, the RSI is below 50, which indicates bearishness and the Stochastic’s %K (blue) crossed below the %D(orange) at the overbought area, which has bearish implications.
If the price continues moving downwards, the first support area is $76.77, which shows S1 on the chart and is also the first expected target based on the H&S pattern. The second area of support is around the $75.79 level and the S2 line on the chart. If the price continues to decline further, the S3 support around $74 becomes the next area the price is expected to reach. On the other hand, if the price changes direction and moves upward, the previous week's high, around $79.94, becomes the first resistance area R1. A move above the R1 finds the next resistance, R2, approximately at $81.53.
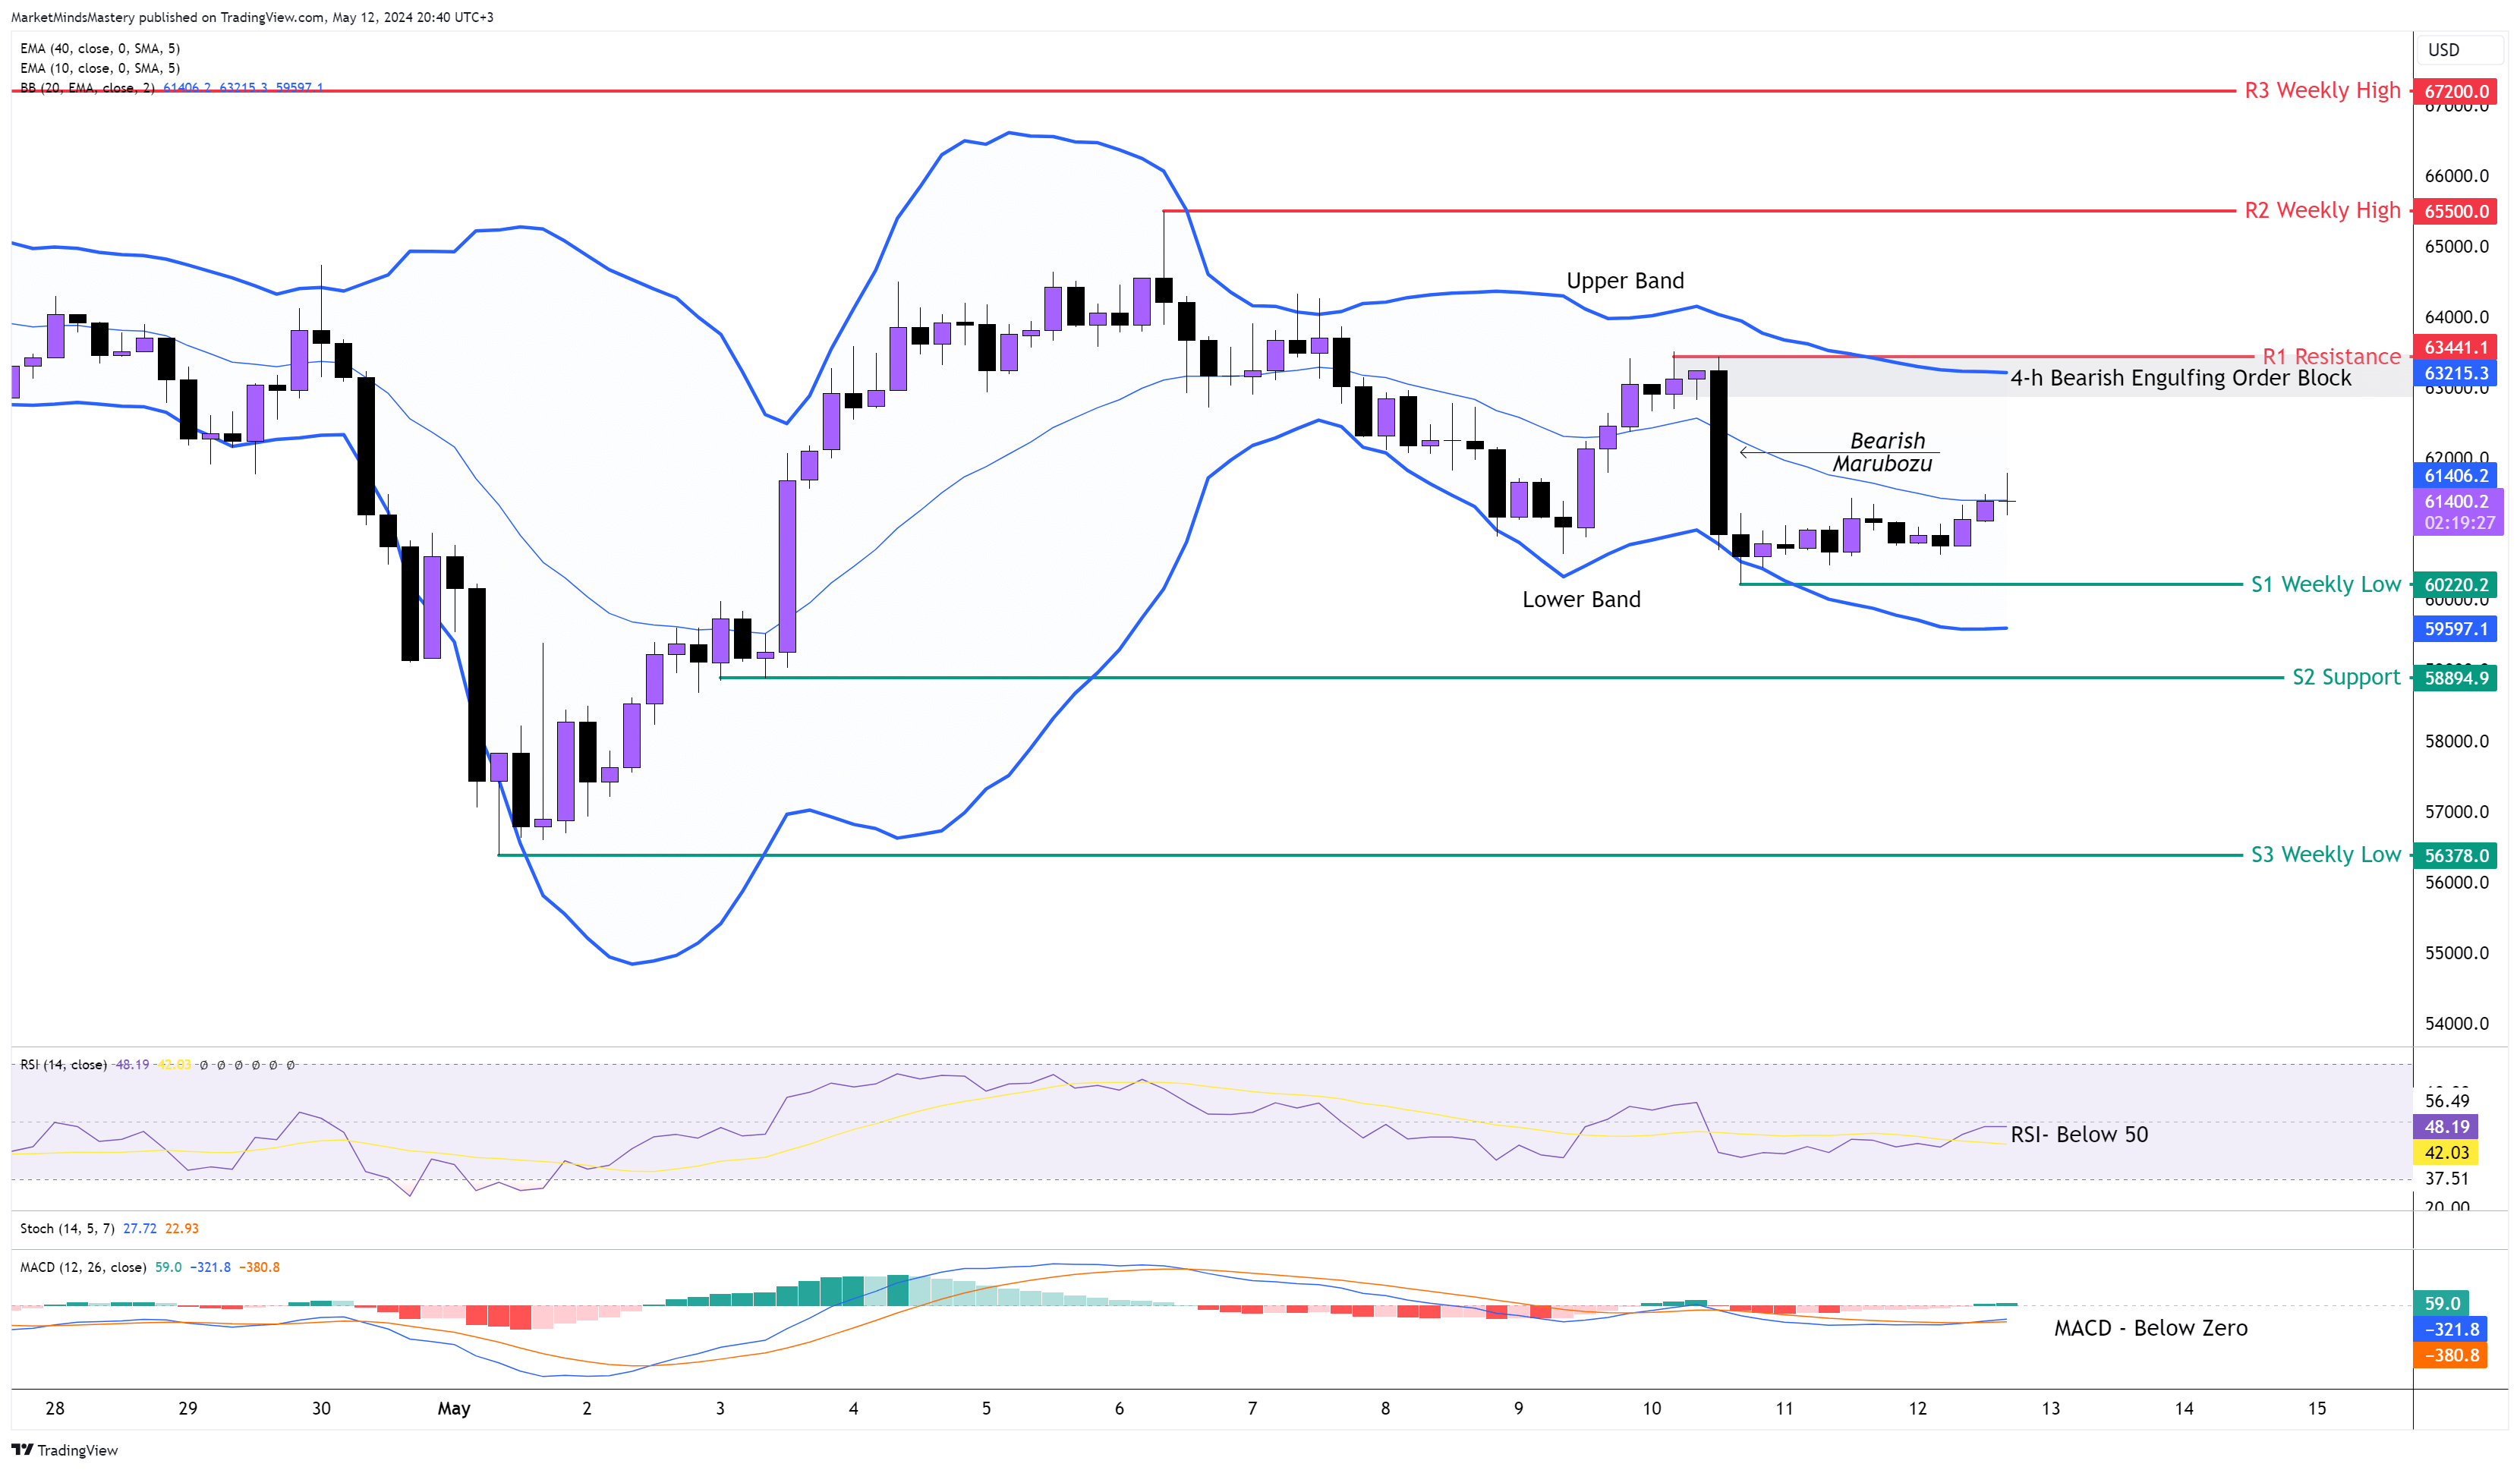
BTC USD 4H
The Bullish hammer on the weekly chart didn’t help the price to push upwards and ended as an inside candle. On the 4-hour chart, the Bearish Marubozu candle created last Friday still hosts a price within its range. Although the price made a lower low on the 4-hour, it didn’t move away from the broken support. The RSI is below 50, and this has bearish implications. The MACD is below the zero line, which is also a bearish indication. The price is currently trading around the middle of the Bollinger Band, the 20-period moving average. The upper and lower bands are flat. Starting Monday, if the price moves downwards, the $60220 will be the first level of support, shown as S1 on the chart. It is also the lowest of the previous week. If the price breaks below the S1 and declines more, the next support level, S2, is around $58900.
On the other hand, if the price finds support and moves upwards, the first resistance area, R1, will be around $63440. This area hosts a Bearish Engulfing Order Block, which can add more weight to the level. If the price breaks above the R1 and rally, the next resistance area, R2, is the $65500.
SP 500 4H
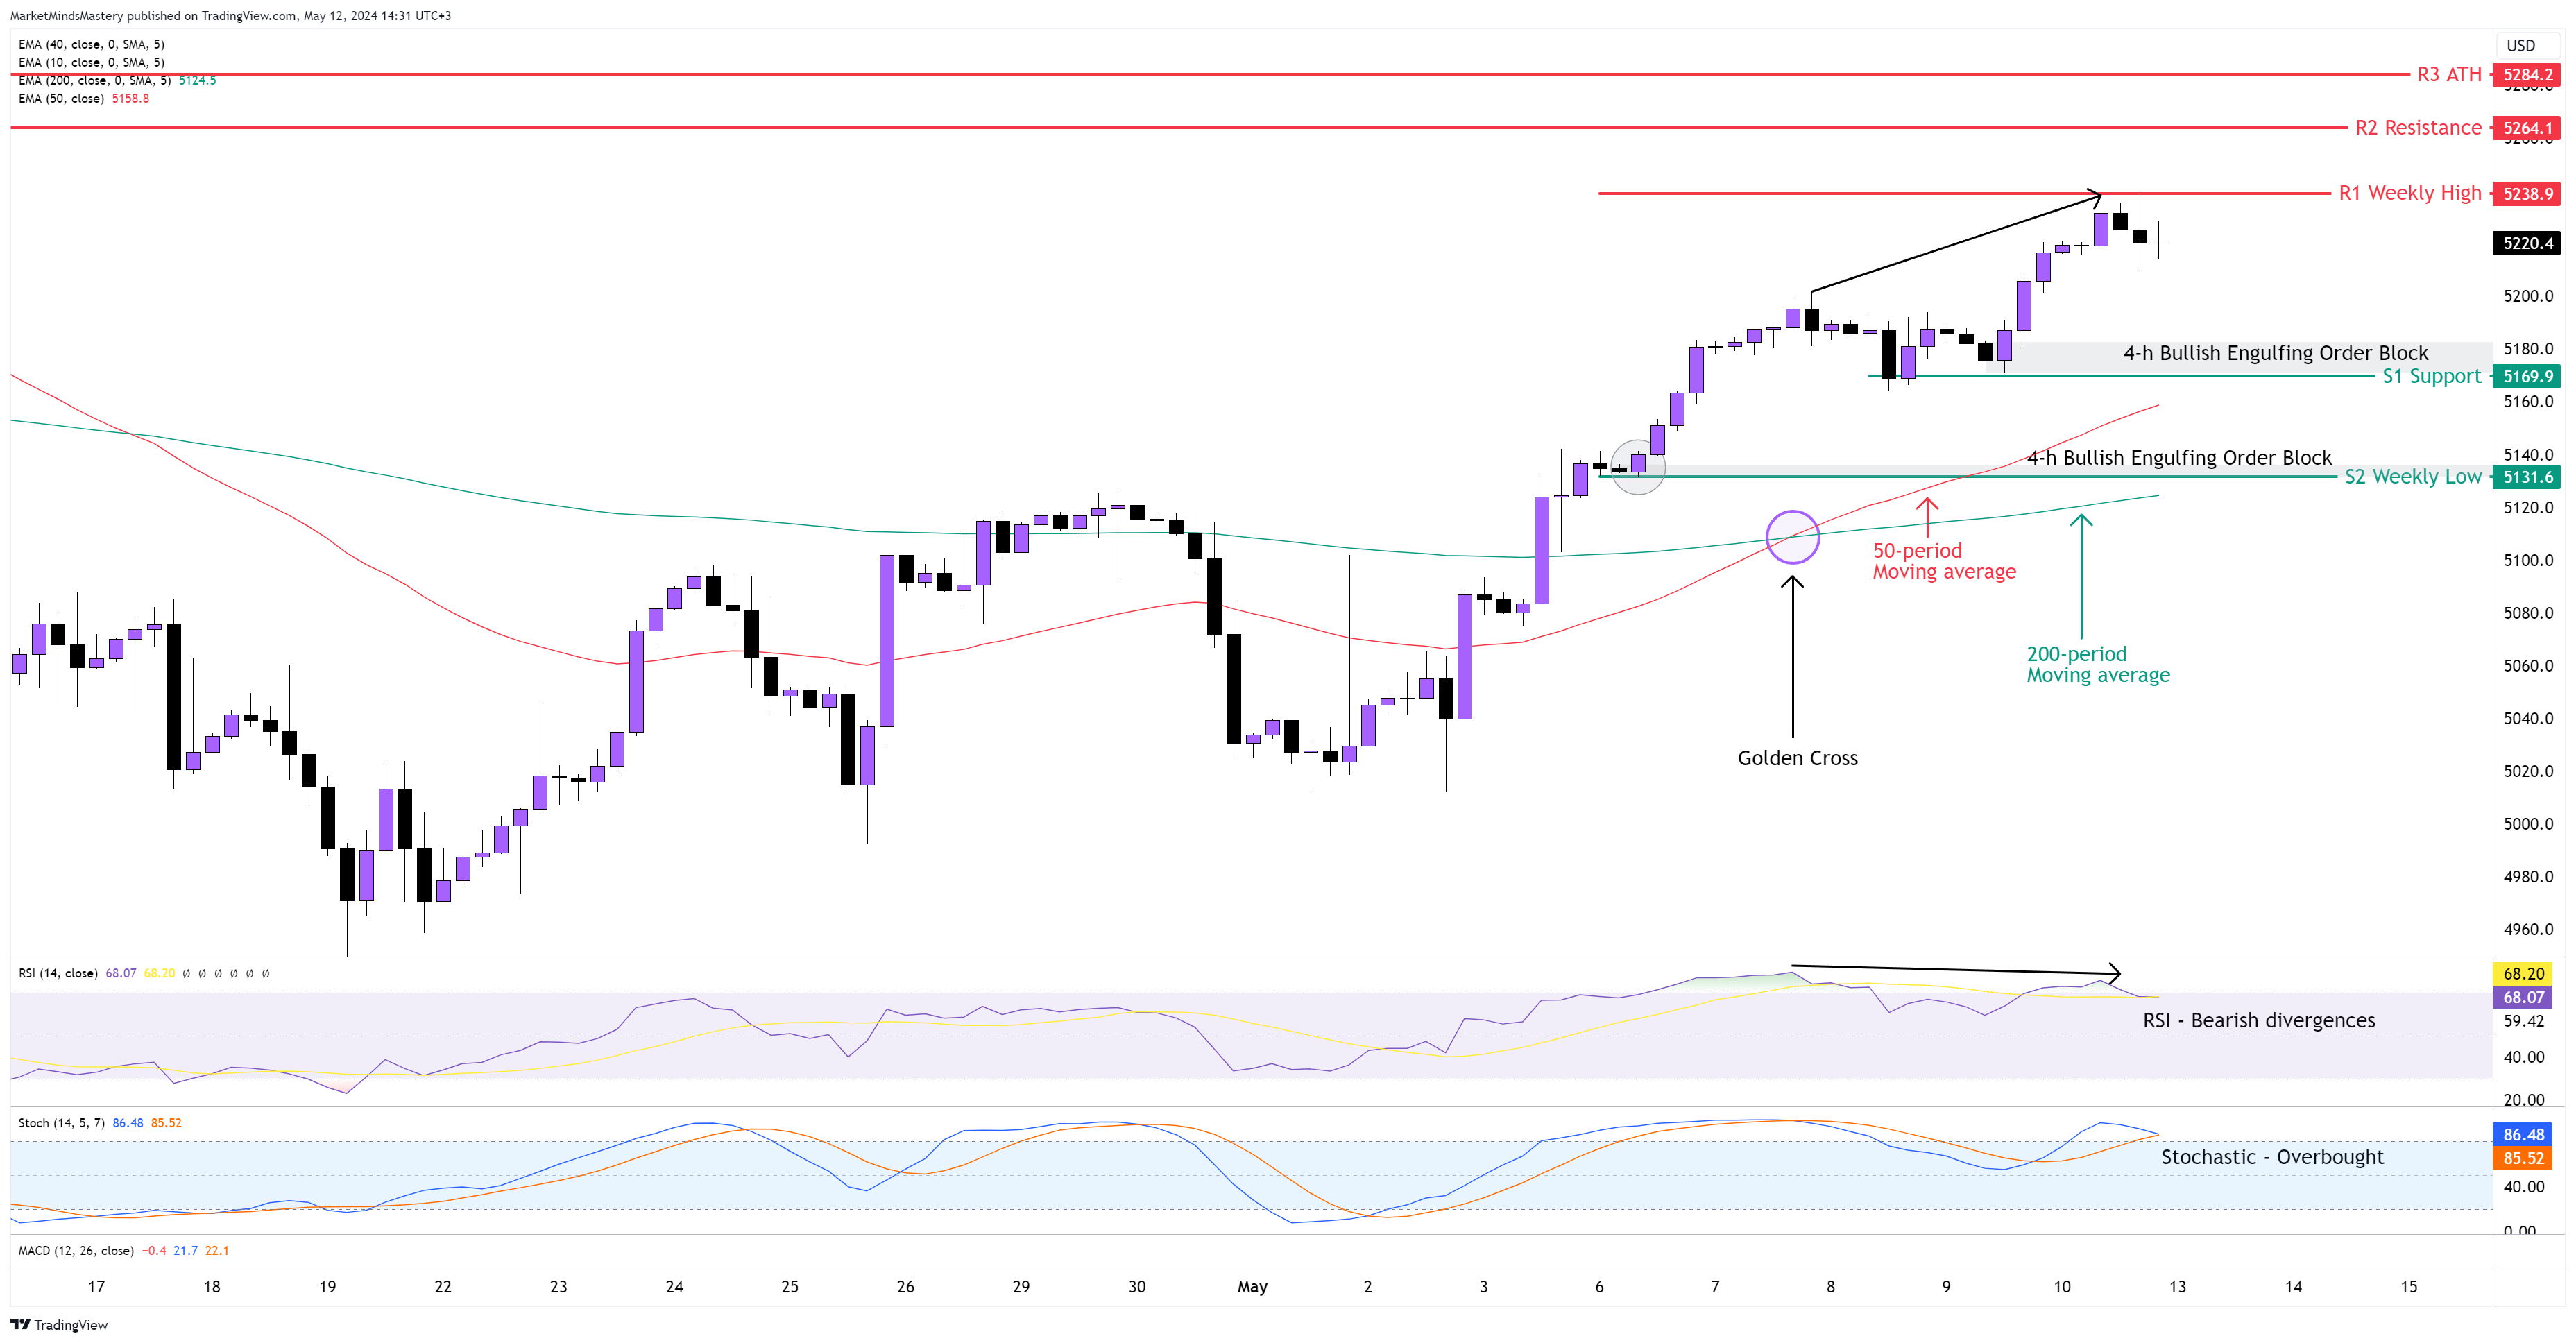
Following the weekly uptrend that resumed two weeks ago, the price continued the upward move, creating new higher highs and higher lows on the 4-hour chart. The Order Blocks marked on the previous week's analysis acted as areas of support from the price bounced off and rallied. While the Stochastic oscillator on the 4-hour chart is in an overbought condition, showing bullish strength, the RSI failed to register a new high, and it shows Bearish (Negative) Divergences A’ Class. ( A’ Class bearish divergences is when the price makes higher high and the oscillator lower high). Usually, after Divergences, price correction is expected to be seen on the chart. However, it always depends on how strong the trend is. The 50-period is above the 200-period, which shows the Golden Cross moving average crossover and is considered bullish. The price makes higher highs and higher lows successful, which is also a bullish sign.
Starting Monday, the first support area, S1, is around $5169 if the price declines and moves downwards. The chart's 4-hour Bullish Engulfing Order Block can help identify if the S1 level will hold. If the price breaks and closes under the S1 support and moves further downwards, the next support area, S2, is around $5131, the previous week’s low and where the price formed a Bullish Engulfing Order Block. On the other hand, if the price continues to move upwards, the first resistance area, R1, will be the previous week’s high, around $5238. If the price breaks and closes above the R1 and moves further upwards, the next resistance R2 will be the $5264.
US 30 4H
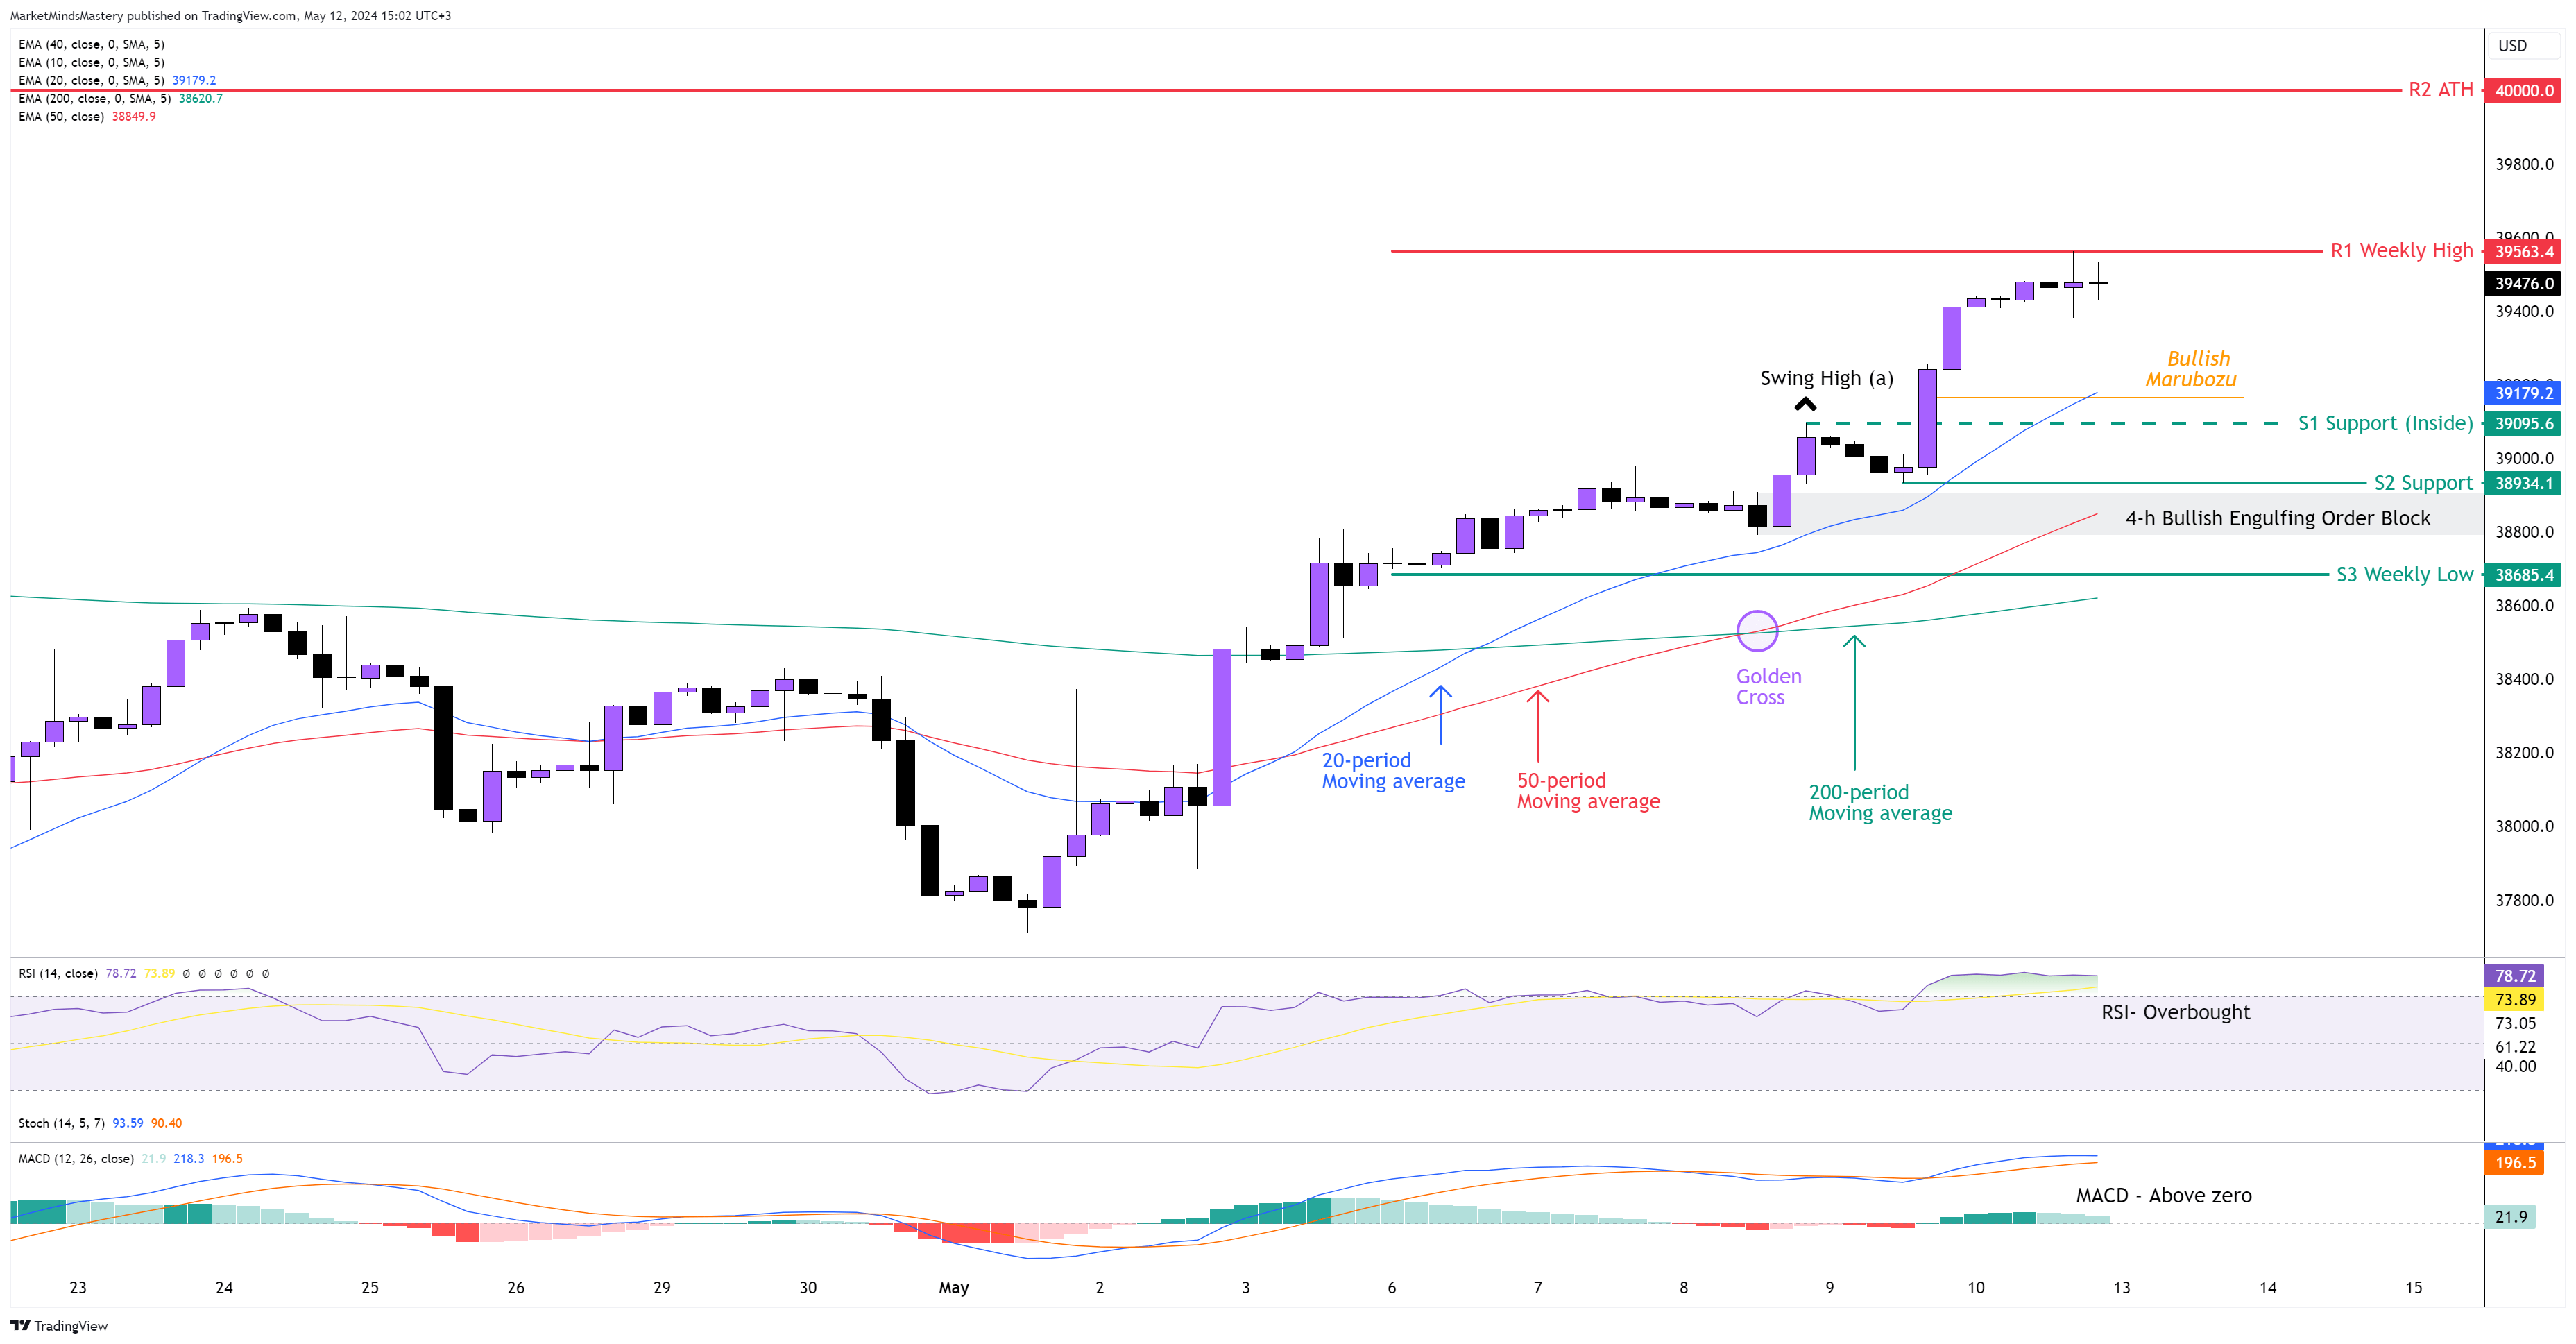
The price continued its upward move per the weekly chart's primary upward trend. The retracements on the 4-hour chart were shallow. No retracement occurred in more than 50% of the impulsive move. These are signs of a strong Bullish market. As the RSI oscillator is overbought, and the MACD is above zero, with the MACD line (blue) crossed above the signal line (orange), they have bullish implications.
Additionally, the 20-period is above the 50-period, and they are both above the 200-period moving average. The rising picks and troughs on the price are evidence, and the market is in a strong uptrend. However, it approaches its All-Time High, which is around $40000.
If the price declines and moves downwards, the first support area, S1, is an inside support of around $29095. This level is the recent swing high and can support price pullback. This swing high is penetrated by a Bullish Marubozu candle, a sign of the strength of the impulsive move. Below the S1 support is the S2 support, which is around $38934. Below the S2 is a well-defined Bullish Engulfing Order Block, which hasn't been tested yet.
On the other hand, if the price continues to move upwards, the first resistance area, R1, will be the previous week’s high, around $39563. For the uptrend to continue, the level should successfully penetrate, and the price should move away from it. If the price keeps rallying, the next resistance area, R2, will be the All-time High price of around $40000.
GER 30, 4H
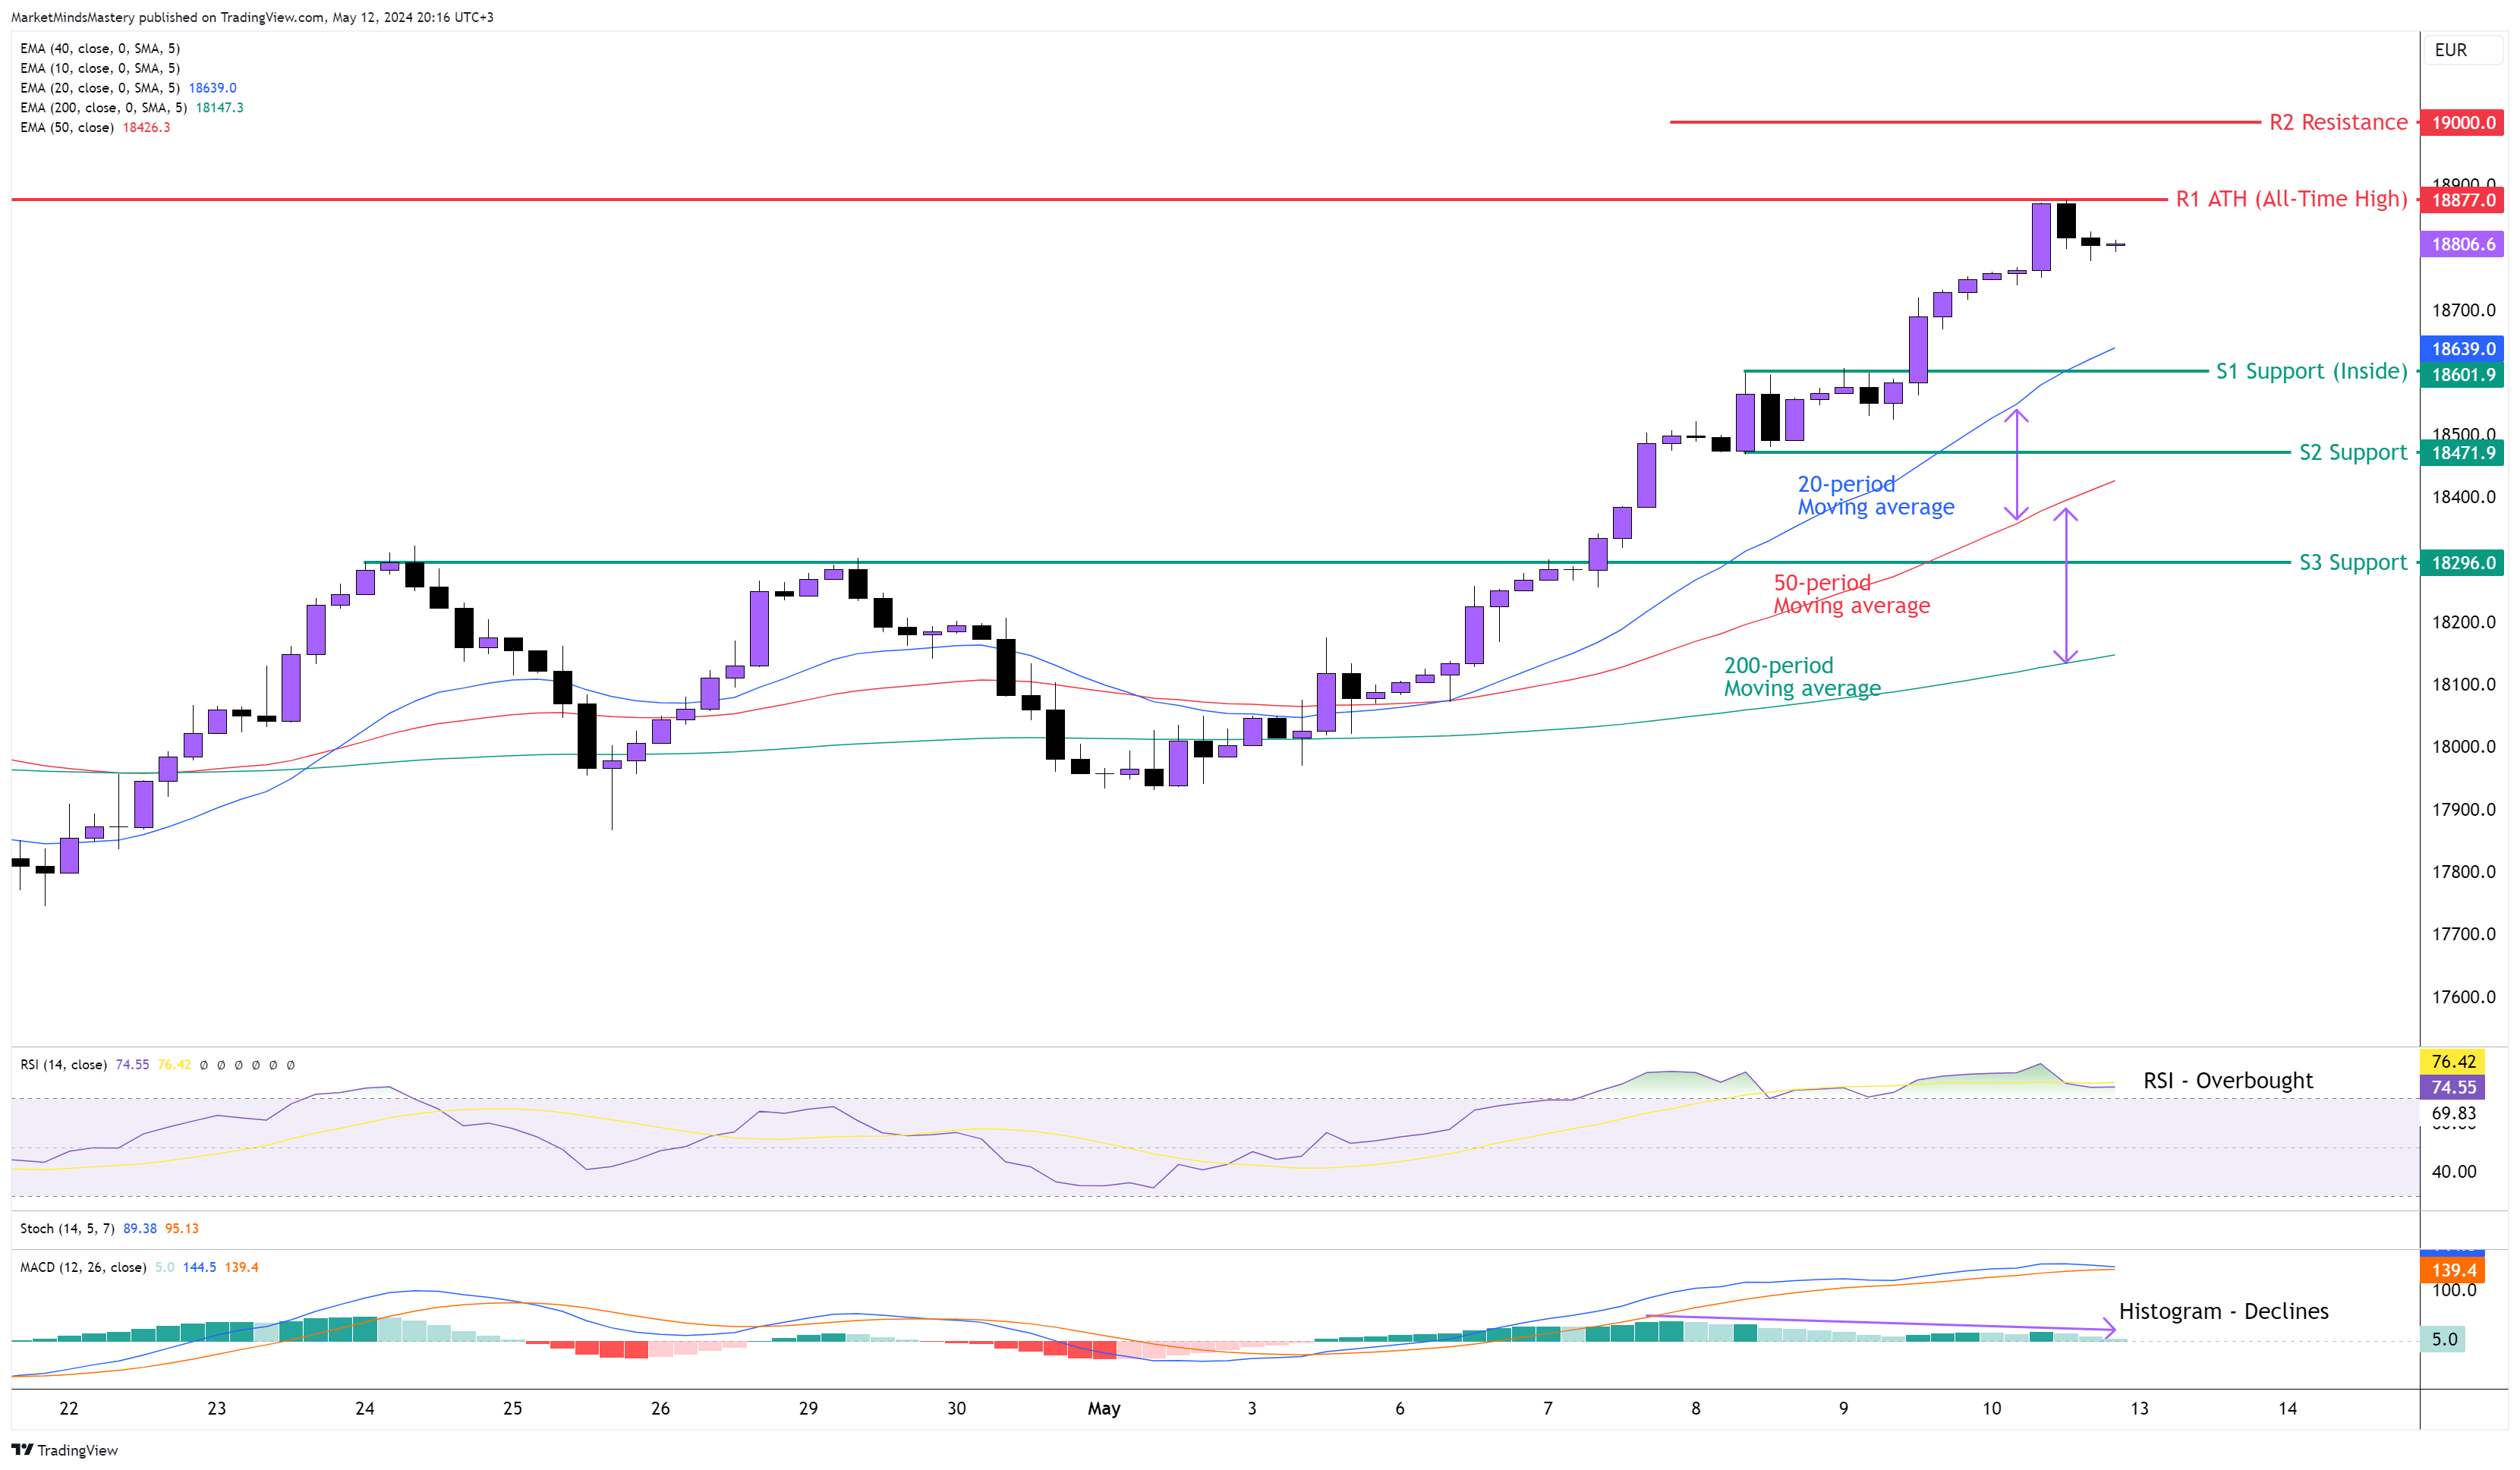
Only five of the 30 candles on the 4-hour chart (Monday-Friday) were black (bearish). This shows how much strength the market has gotten from the imbalances in buy and sell orders. The fact that the price doesn’t interact with the 20-period moving average reveals the market’s bullish strength. The distance between the 20-period, the 50-period and the 200-period moving average is widened, showing the bullish momentum. The RSI has been in an overbought condition since the beginning of the previous week. The histogram shows weakness, which is more evident in the Daily chart when the MACD shows negative divergences. As seen on the chart, the price made a new All-Time High.
Starting Monday, if the price keeps increasing, the ATH price around 18877 will be the first resistance R1. If the price penetrates the R1, closes above it and moves higher, the next resistance will be a new ATH. The price reached and surpassed the 200% Fibonacci extension. Therefore, we will use the round number of 19000 for the R2 resistance.
On the other hand, if the price declines and moves downwards, the first support area, S1, is an inside support area around 18600. If the price penetrates the S1 and moves downwards, the next support level, S2, will be the 18471.
👉 Click here to check our Challenges
👉 Don’t miss our Free Live Webinars
👉Join us on Discord
Risk Disclosure:
The Trading Pit offers only demo accounts to all users within the Challenges and Signal Provider Agreements (Scaling Plan). All assets and trading activities are purely virtual. Please note that we do not offer CFD (Contract for Difference) challenges to residents of Canada and the United States. All content and information on this website is for informational purposes only and should not be interpreted as financial advice. Also, remember that results achieved in the past are no guarantee of future results. It is essential to understand the risks associated with trading. If you are unsure, always consult an independent financial advisor.