Last week, the US Dollar surprised all market participants. Based on all the forecasts, the NFP (Non-Farm Payrolls) was expected to drop to 140K, but instead, the number increased much more than expected, 254K, and the USD became the dominant currency during the New York trading session last Friday. The drop in the CPI (Consumer Price Index) number in the Eurozone and Switzerland caused both currencies, the Euro and the Swiss Frank, to be among the weakest currencies last week.
This week, the markets are expected to experience a significant increase in volatility as important news events are announced. These events often cause directional price moves and the creation of market trends.
Mondays are usually short days for news events, and the markets usually “digest” last Friday’s events. Starting Monday, the European Central Bank Chief Economist Lane will give a speech in the Eurozone. Throughout his speech, we will try to understand what the European Central Bank is planning to do with the Interest Rates in the Eurozone this month. The next event will be the Euro Zone Sentix Investor Confidence Index for October. The forecast shows an increase from -15.4 to -15. The next significant event will affect the Euro directly again, and it will be the Retail Sales in the Eurozone. The consensus estimates a significant increase in the number this time, and from -0.1% to 1%. If the actual report confirms the forecast, it might help the Euro with some upward move.
On Tuesday, volatility is expected to pick up from the early morning as Japan will report the Trade Balance. Japan relies heavily on imports and exports; therefore, these events tend to impact the Japanese Yen highly and also cause noticeable price moves in the Japanese Yen currency pairs. The forecast shows a negative reporting number as the currency -482.7B is expected to drop to -532.4 B. If the actual number confirms the forecasted number and the market follows through, we expect to see weakness in the Japanese Yen. Hence, currency pairs like the USDJPY and the GBPJPY can possibly lift the exchange rate, favouring the Dollar and the Sterling. Less than an hour after this report, the RBA (Reserve Bank of Australia) will report its Monetary Policy Meeting Minutes in Australia. Moving into the New York trading session, they will report their Trade Balance in the US. As per the forecast, the current -78.8B is expected to improve to -71.3 B. This can be a positive sign for Greenback, and it can possibly help to maintain some strength in the markets.
Wednesday will be a significant day for all traders around the world. Early in the morning, in New Zealand, the RBNZ (Reserve Bank of New Zealand) will announce the new Interest Rates in their country. Inevitably, at some point, we have already mentioned that all major banks will proceed with rate cuts sooner or later. Now, as per the consensus, the RBNZ is expected to cut its current rates, which are 5.25% to 4.75%. If this happens and at the same time if the market follows through, the Kiwi is expected to experience a significant weakness. That can allow the USD to gain value against the NZ Dollar. The volatility around this event is expected to be intense, and Day Traders need to be aware of it. The last event for the day will be the FOMC Meetings Minutes. This particular event directly affects the US Dollar. The volatility during the events is noticeable, and the price fluctuation is usually enormous. It will be reported towards the end of the New York trading session. As traders, we try to understand how the Fed sees the future of the US economy and whether the US dollar will gain strength or not. Sometimes, directional moves occur after the FOMC Meeting Minutes and new trends begin. Although volatility is what traders need in the markets, trading around these events can be challenging because tide-stop loss placements can be wiped out before the market decides its predominant direction.
The Japanese Yen will be the focus during the Asian trading session on Thursday.
The PPI (Producer Price Index) will be reported in Japan in early mourning. The forecast shows a decrease in the number this time. Currently, the PPI is -0.2% and is expected to drop to -0.3%. If the actual report confirms the forecast and, at the same time, the Japanese Yen loses value, it can cause more price drops in the Japanese Yen. If, after the FOMC, the US Dollar becomes a strong currency, then we might see bullish opportunities in the USDJPY currency pair. Volatility is expected to be normal during the London trading session, as there will be no significant news events. The focus for the rest of the day will be during the New York trading session, as in the US, they will report the CPI (Consumer Price Index). Things can turn south for the Greenback as the consensus estimates a drop from 2.5% to 2.3%. All Central Banks around the world and all major economies insist on reducing inflation in their countries, but when it comes to the value of the currencies, a drop in the CPI number, most of the time, causes weakness of the country’s currency. Similarly, if the reported number is less than the forecast, the US Dollar is likely to lose value, and the price of currency pairs like the EURUSD, AUDUSD, and GBPUSD can move upwards. Towards the end of the London trading session, the BoE (Bank of England) will report their Monetary Policy Hearings.
On Friday, volatility is expected to be as usual during the Asian trading session, as there will be no important news events. The focus will shift to Sterling during the London reading session. The UK 3-month GDP Estimate is expected to report 0.2% lower than the current number, which means that the current 0.5% is expected to drop to 0.3%. Additionally, the UK Industrial Output is expected to increase from -0.8% to 0.2%. The overall GDP (Gross Domestic Product) in the UK is expected to increase from 0.0%, which is the current number, to 0.2%. This can positively impact Sterling. Moving into New York’s trading session, in Canada, they will report their Unemployment Rate. The consensus shows an increase in the unemployment rate in the country, from 6.6%, which is currently rising to 6.7%. However, the Employment Change can increase from 22.1K to 34.5K as per the forecast. The trading day and the trading week will end with the PPI (Producer Price Index) report in the US. The forecast estimates a drop from 0.2% to 0.1%. If this happens, and simultaneously, if the market follows through, it can affect the US Dollar’s value across the board. Perhaps the Indicies, the commodity of GOLD and major currency pairs, can take advantage and gain some value against a weak US dollar.
EUR USD 4H

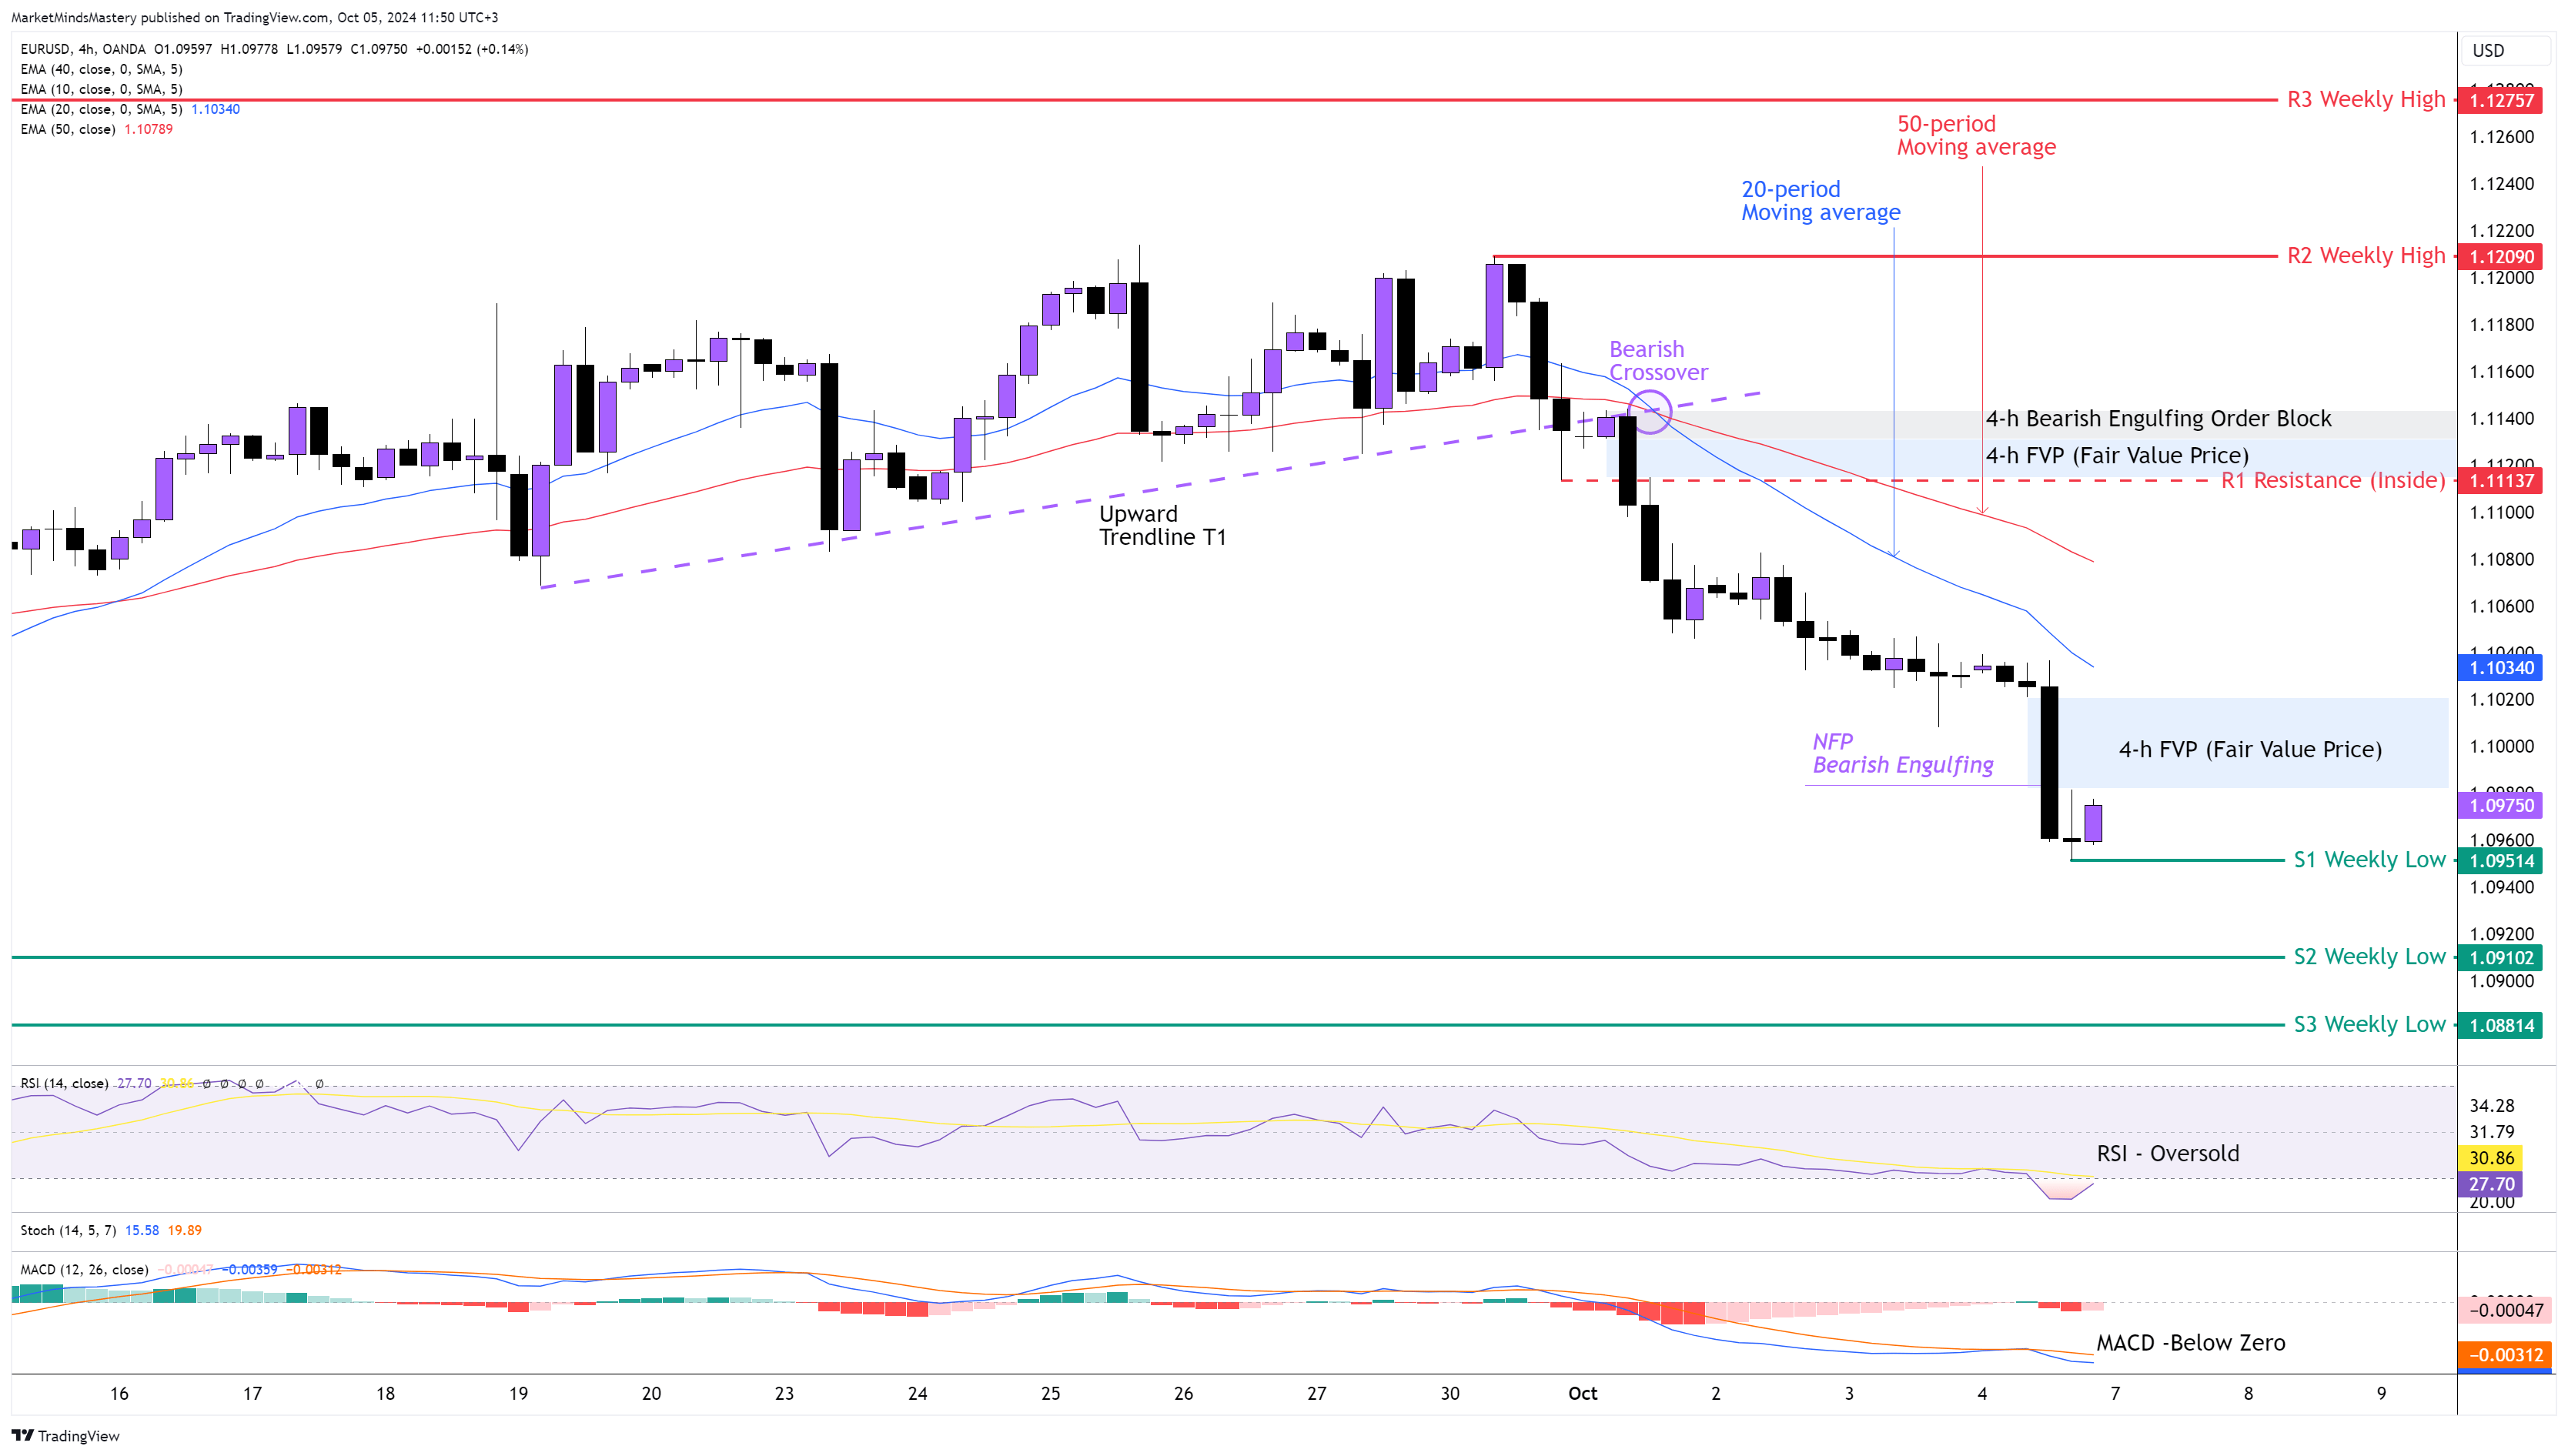
The price of the EURUSD last week declined by approximately 2600 points (260 pips). This was due to weak CPI in the Eurozone and positive NFP (Non-Farm Payroll) numbers in the US. The NFP not only strengthened the US Dollar but also added more pressure to the Euro prices. Hence, the weekly chart ended as a bearish candle. In the 4-hour chart, the price created a new market structure of lower lows and lower highs soon after the price broker the Upward Trendline T1 and, at the same time, created a Bearish Crossover, as shown on the chart. The 20-period crossed below the 50-period moving average, and this is bearish. The RSI Oscillator is in an Oversold condition, which is also bearish. The MACD not only crossed below its middle line but also the MACD line (Blue) crossed below the Signal Line (Orange), which has bearish implications. Last Tuesday, the price created a Bearish Engulfing Order Block around 1.11400 and an FVP (Fair Value Price) approximately at 1.11200.
Additionally, during the NFP last Friday, the price created another FVP of around 1.1000. Therefore, if the price keeps moving downwards, the first support area, S1, will be around 1.09514., which is the previous week’s low. If the price penetrates the S1 and keeps moving lower, the next support area, S2, will be at 1.09102, which is an older weekly low level. If the price penetrates the S2 support and keeps lowering, the next support area, S3, will be around 1.08814.
Conversely, if the price bounces off and moves upwards, the first resistance area, R1, will be an Inside resistance of around 1.11137. If the price penetrates the R1 and surpasses the Order Block and the FVP, which are right above the R1, then the next resistance area, R2, will be the previous week’s high, around 1.12090. If the price surpasses the R2 and keeps increasing, the next resistance area, R3, will be at 1.12757, which is an older weekly high level.
GBP USD 4H
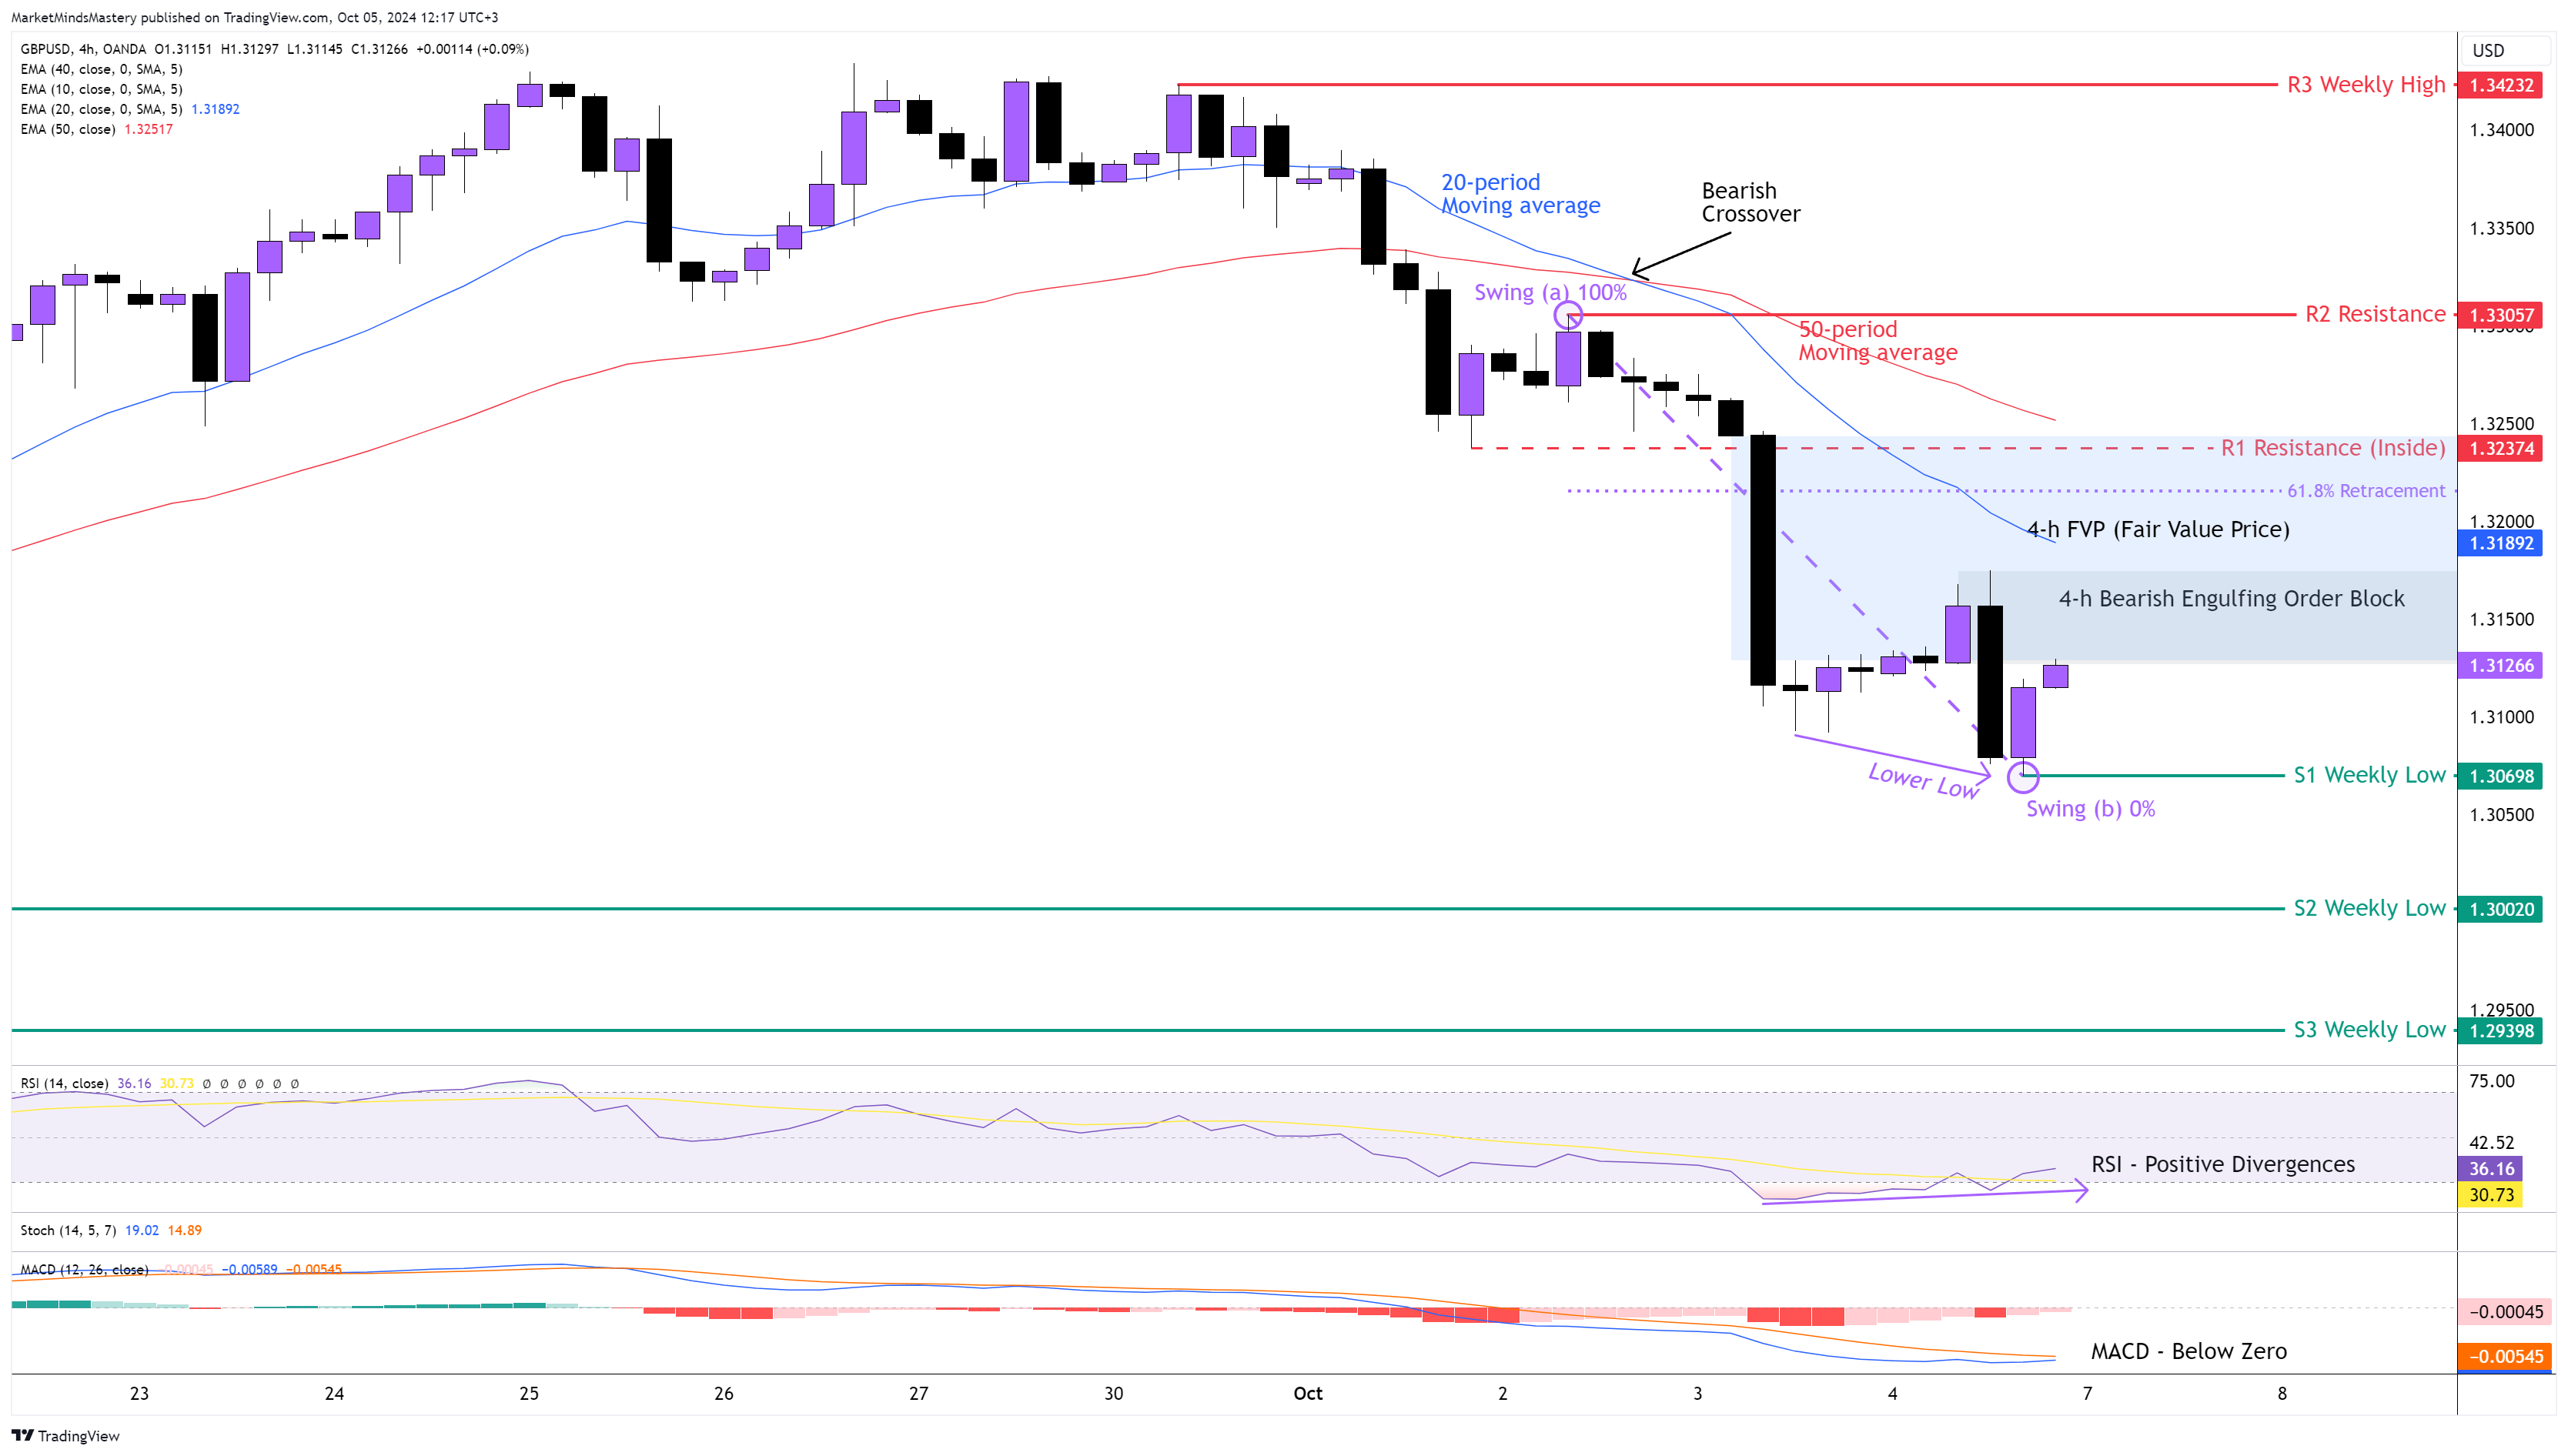
Following the previous week’s Market Outlook, the Ascending Triangle chart pattern ended as a Reversal Pattern for the GBPUSD currency pair instead of the Continuation pattern. Hence, the price declined and moved downwards, creating a series of lower lows and lower highs, which they define as a downtrend on the 4-hour chart. The price of the GBPUSD was driven primarily byu the positive news events in the US rather than negative fundamentals in the UK. The 20-period is below the 50-period moving average, and this is bearish. The RSI is around its oversold condition, and last Friday, it created a Positive Divergence as it could not follow the price lower low move. It is worth mentioning that Divergences will first create a price retracement, and only if there is a break in the current market structure will they cause a trend reversal. The MACD is below its zero line, and this is bearish. Starting Monday, if the price continues moving downwards, the first support area, S1, will be around 1.30698, which is the previous week’s low. If the price penetrates the S1 and keeps moving downwards, the next support area, S2, will be at 1.30020, which is an older weekly low level. If the price surpasses the S2 and keeps lowering, the next support area, S3, will be 1.29398.
On the other hand, if the price moves upwards, in order for the price to move until the first resistance area, R1, which is an Inside Resistance, it needs first to penetrate the 4-h Bearish Engulfing Order Block and the FVP (Fair Value Price) created last Thursday, as well as the 61.8% Golden Ratio of the Fibonacci. If the price won't get rejected at the R1 resistance around 1.32374 and surpasses it and keeps moving upwards, then the next resistance area, R2, will be around 1.33057, as shown on the chart.
AUD USD 4H
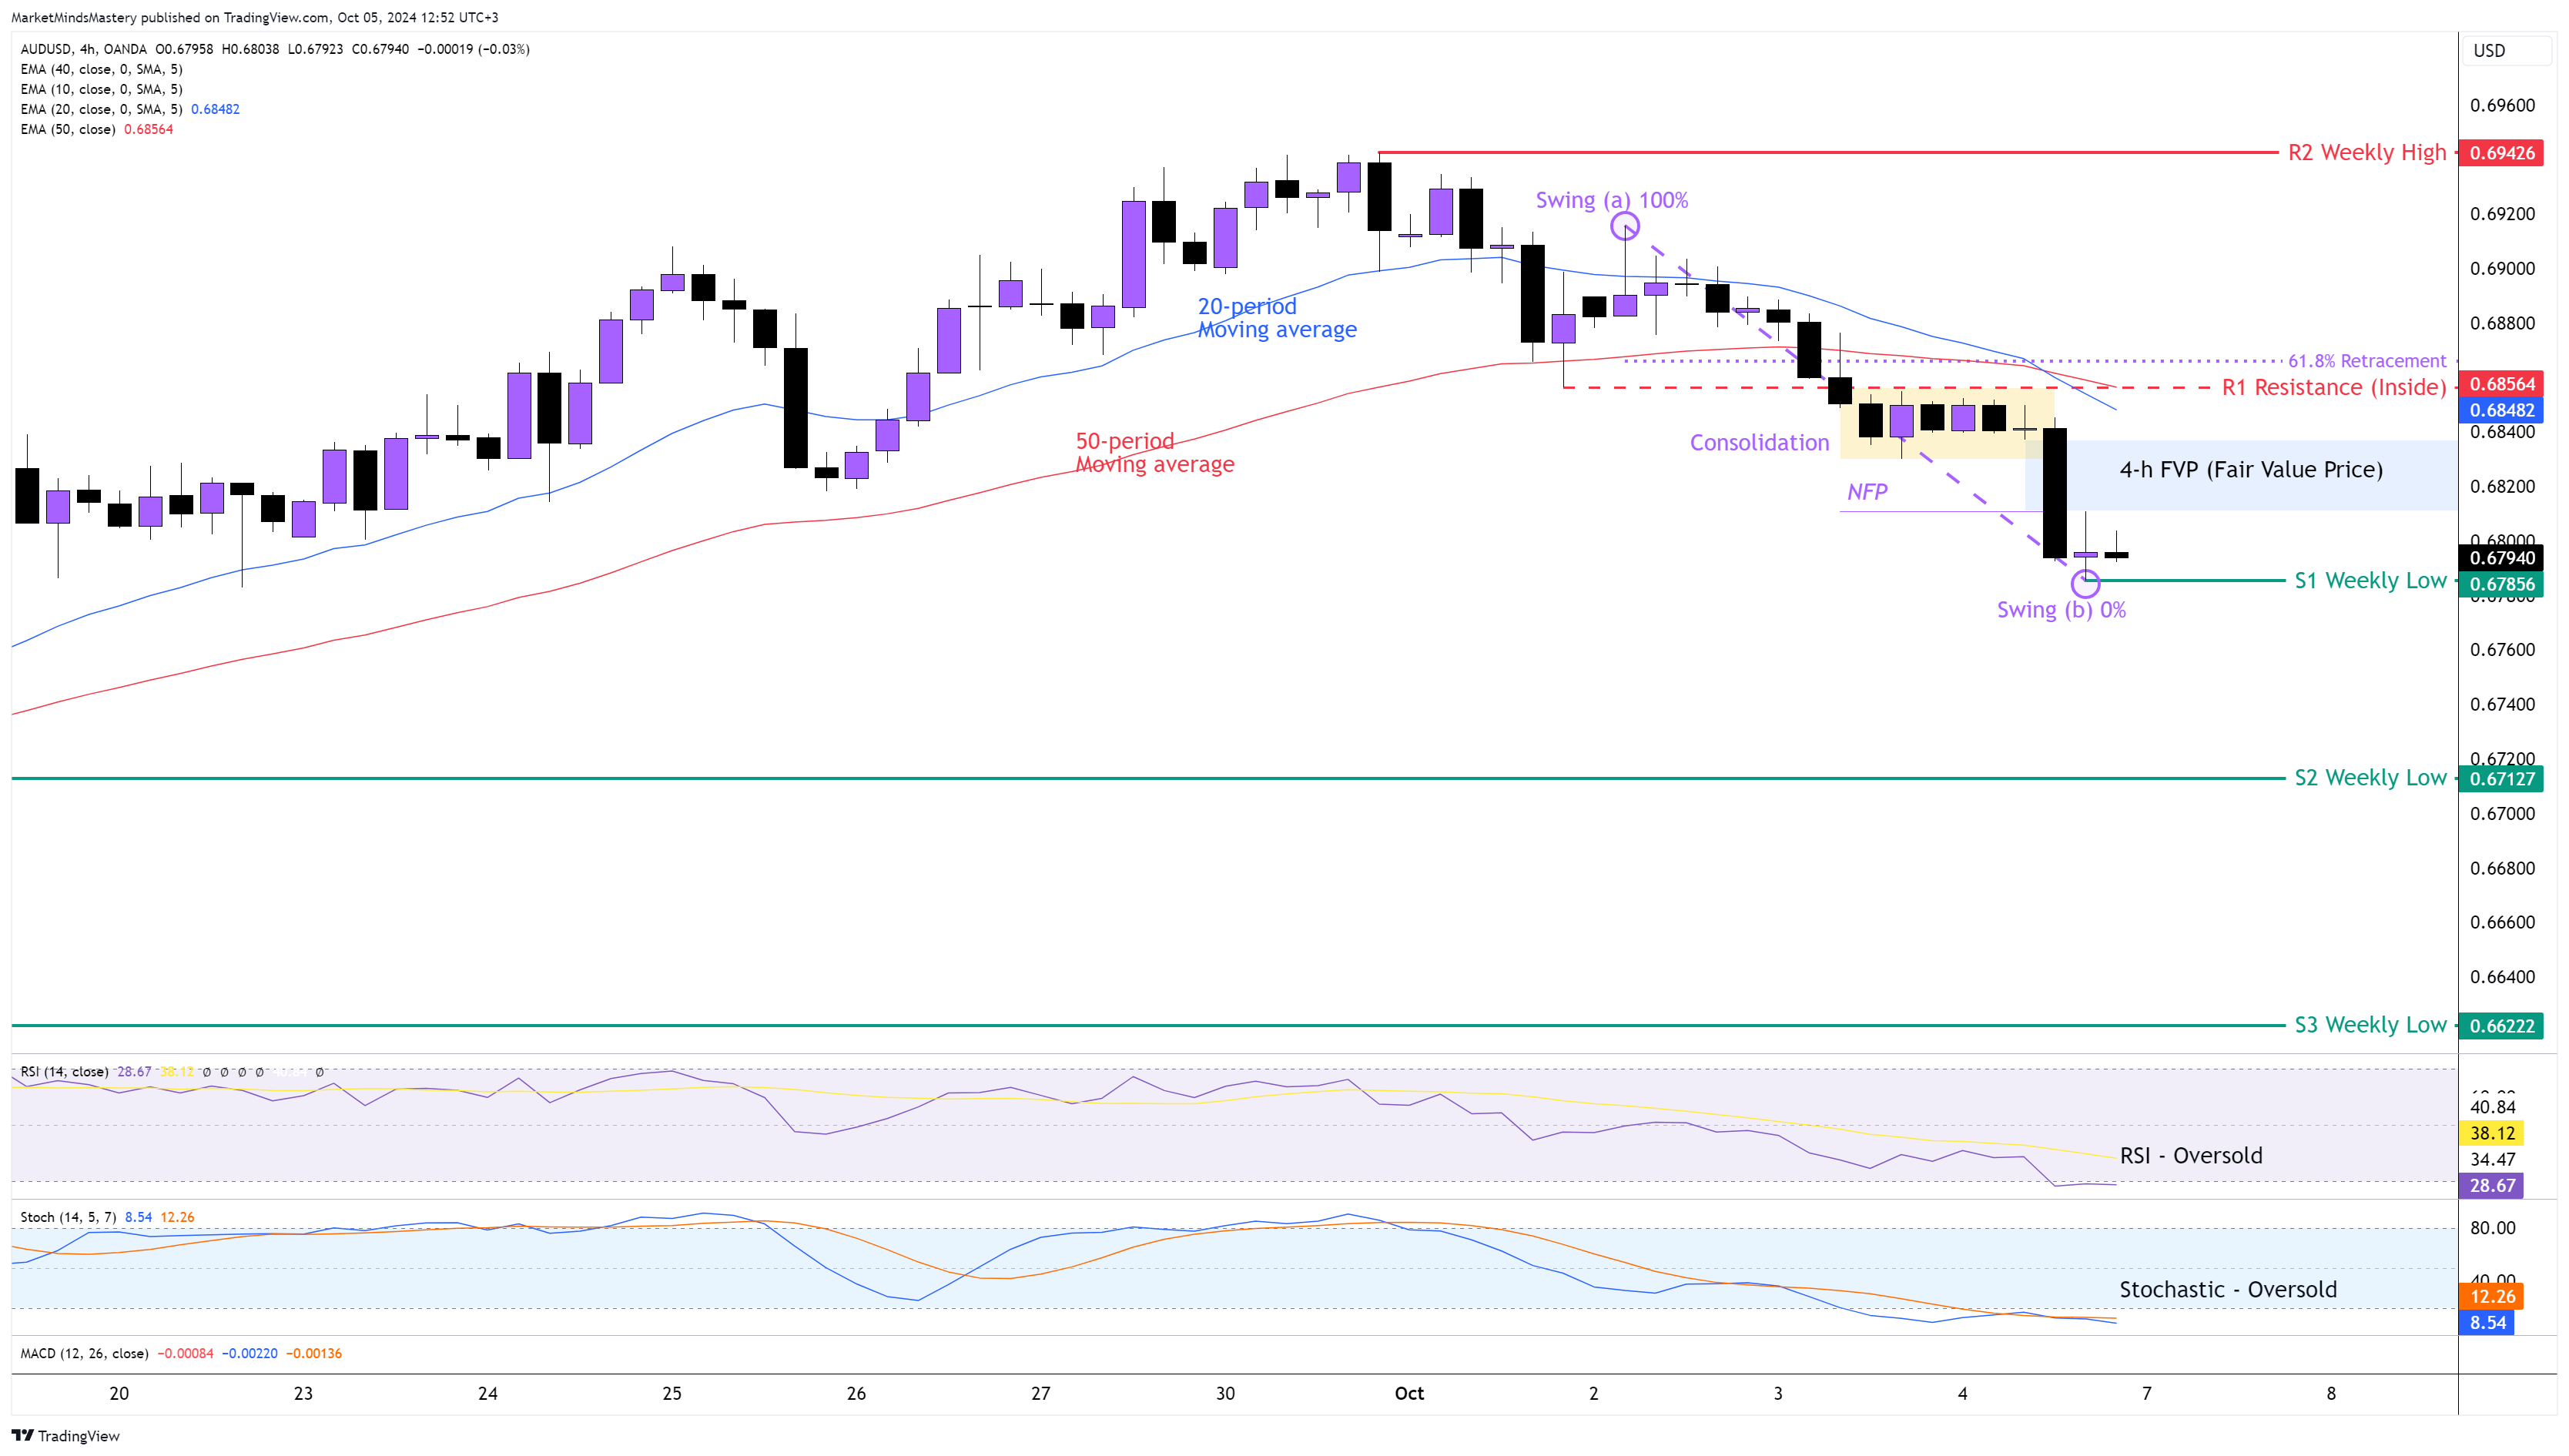
Last week, the price on the Weekly chart ended as a Bearish Engulfing reversal chart pattern. Although the primary trend on the weekly chart is an uptrend, if the price follows through the Bearish Engulfing this week, the AUDUSD can experience more weakness. The price on the 4-hour chart created its first series of lower highs and lower low formation. Last Friday, the NFP in the US created a Bearish Marubozu candlestick pattern, indicating bearishness in the market. Consequently, the 20-period crossed below the 50-period moving average, and this is bearish. Both Oscillators, the RSI and the Stochastic, are in their Oversold conditions, indicating bearishness. During the NFP report, the rapid decline of the price created an FVP (Fair Value Price) of around 0.68200.
Starting Monday, if the price keeps moving downwards, the first support area, S1, will be the previous week’s low, around 0.667856. If the price penetrates the S1 and declines further, the next key support level, S2, will be another weekly level, around 1.27776.
Conversely, if the price moves upwards, the first resistance area, R1, will be an Inside resistance around 0.68564. This is a significant area because it consists of the static R1 resistance, the 50-period moving average, and the 61.8% Fibonacci Golden Ratio level from the swing at point (a) to the swing at point (b), as shown on the chart. If the price penetrates the R1 and keeps moving upwards, the next resistance area, R2, will be approximately 0.69426, which is the previous week’s high.
USD JPY 4H
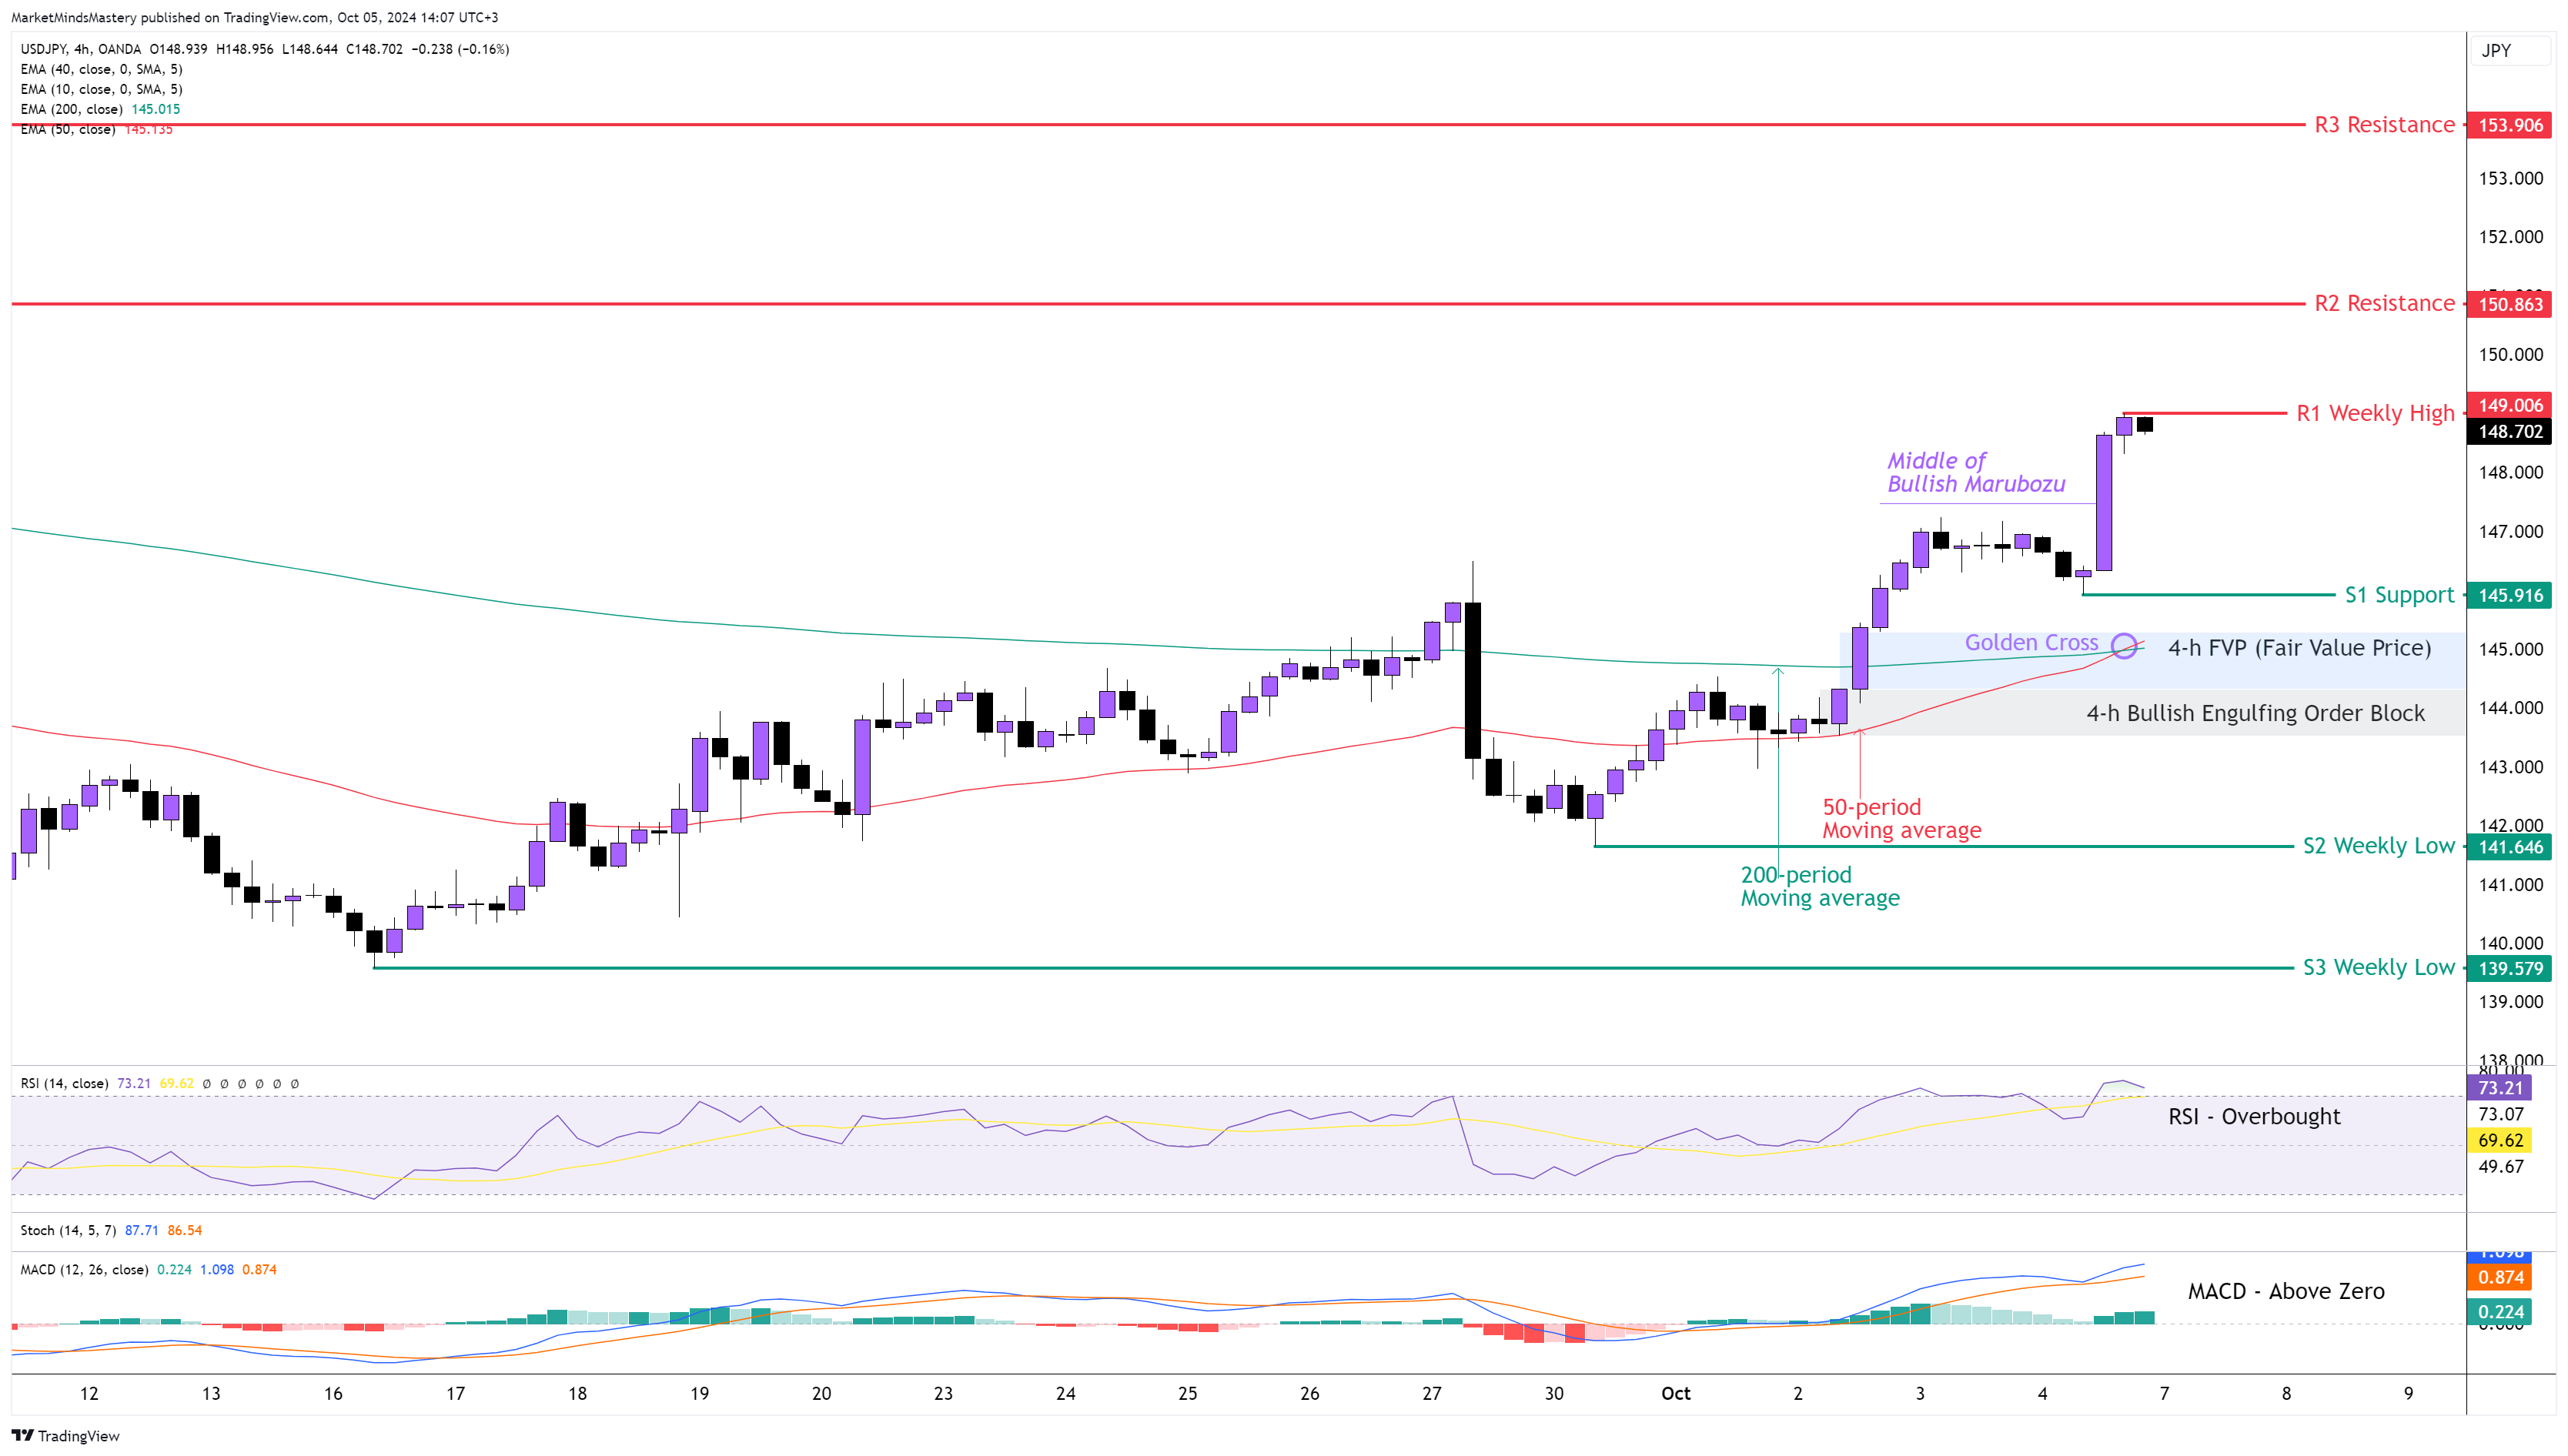
Although the Japanese Yen is in a strong decline on the weekly chart, based on the primary trend, last week, the price of the USDJPY didn't follow through with the reversal price action as we pointed out in the previous week’s Market Outlook, creating a Bullish Engulfing price action candlestick pattern. This caused the price to reverse the previous week’s market structure, and it created a new high of around 149.000. The 50-period crossed above the 200-period moving average known as the Golden Cross. The RSI is in an Overbought condition, indicating bullishness. The MACD is above the middle line of zero, and this is bullish. The MACD’s Histogram is rising, and this has also bullish implications. Starting Monday, if the price continues moving upwards, the first resistance area, R1, will be the previous week’s high, around 149.006. If the price penetrates the R1 and keeps moving upwards, the next resistance area, R2, will be at 150.863. If the price penetrates the R2 and keeps increasing, the next resistance area, R3, will be approximately 153.906.
On the other hand, if the price declines and moves downwards, the first support area, S1, will be around 145.916. If the price surpasses the S1 and moves downwards, it will enter into the FVP (Fair Value Price) and the 4-h Bullish Engulfing Order Block around 144.000. If the price doesn’t bounce off from this price area and decline further, the next support area, S2, will be at 141.646, which is the previous week’s low.
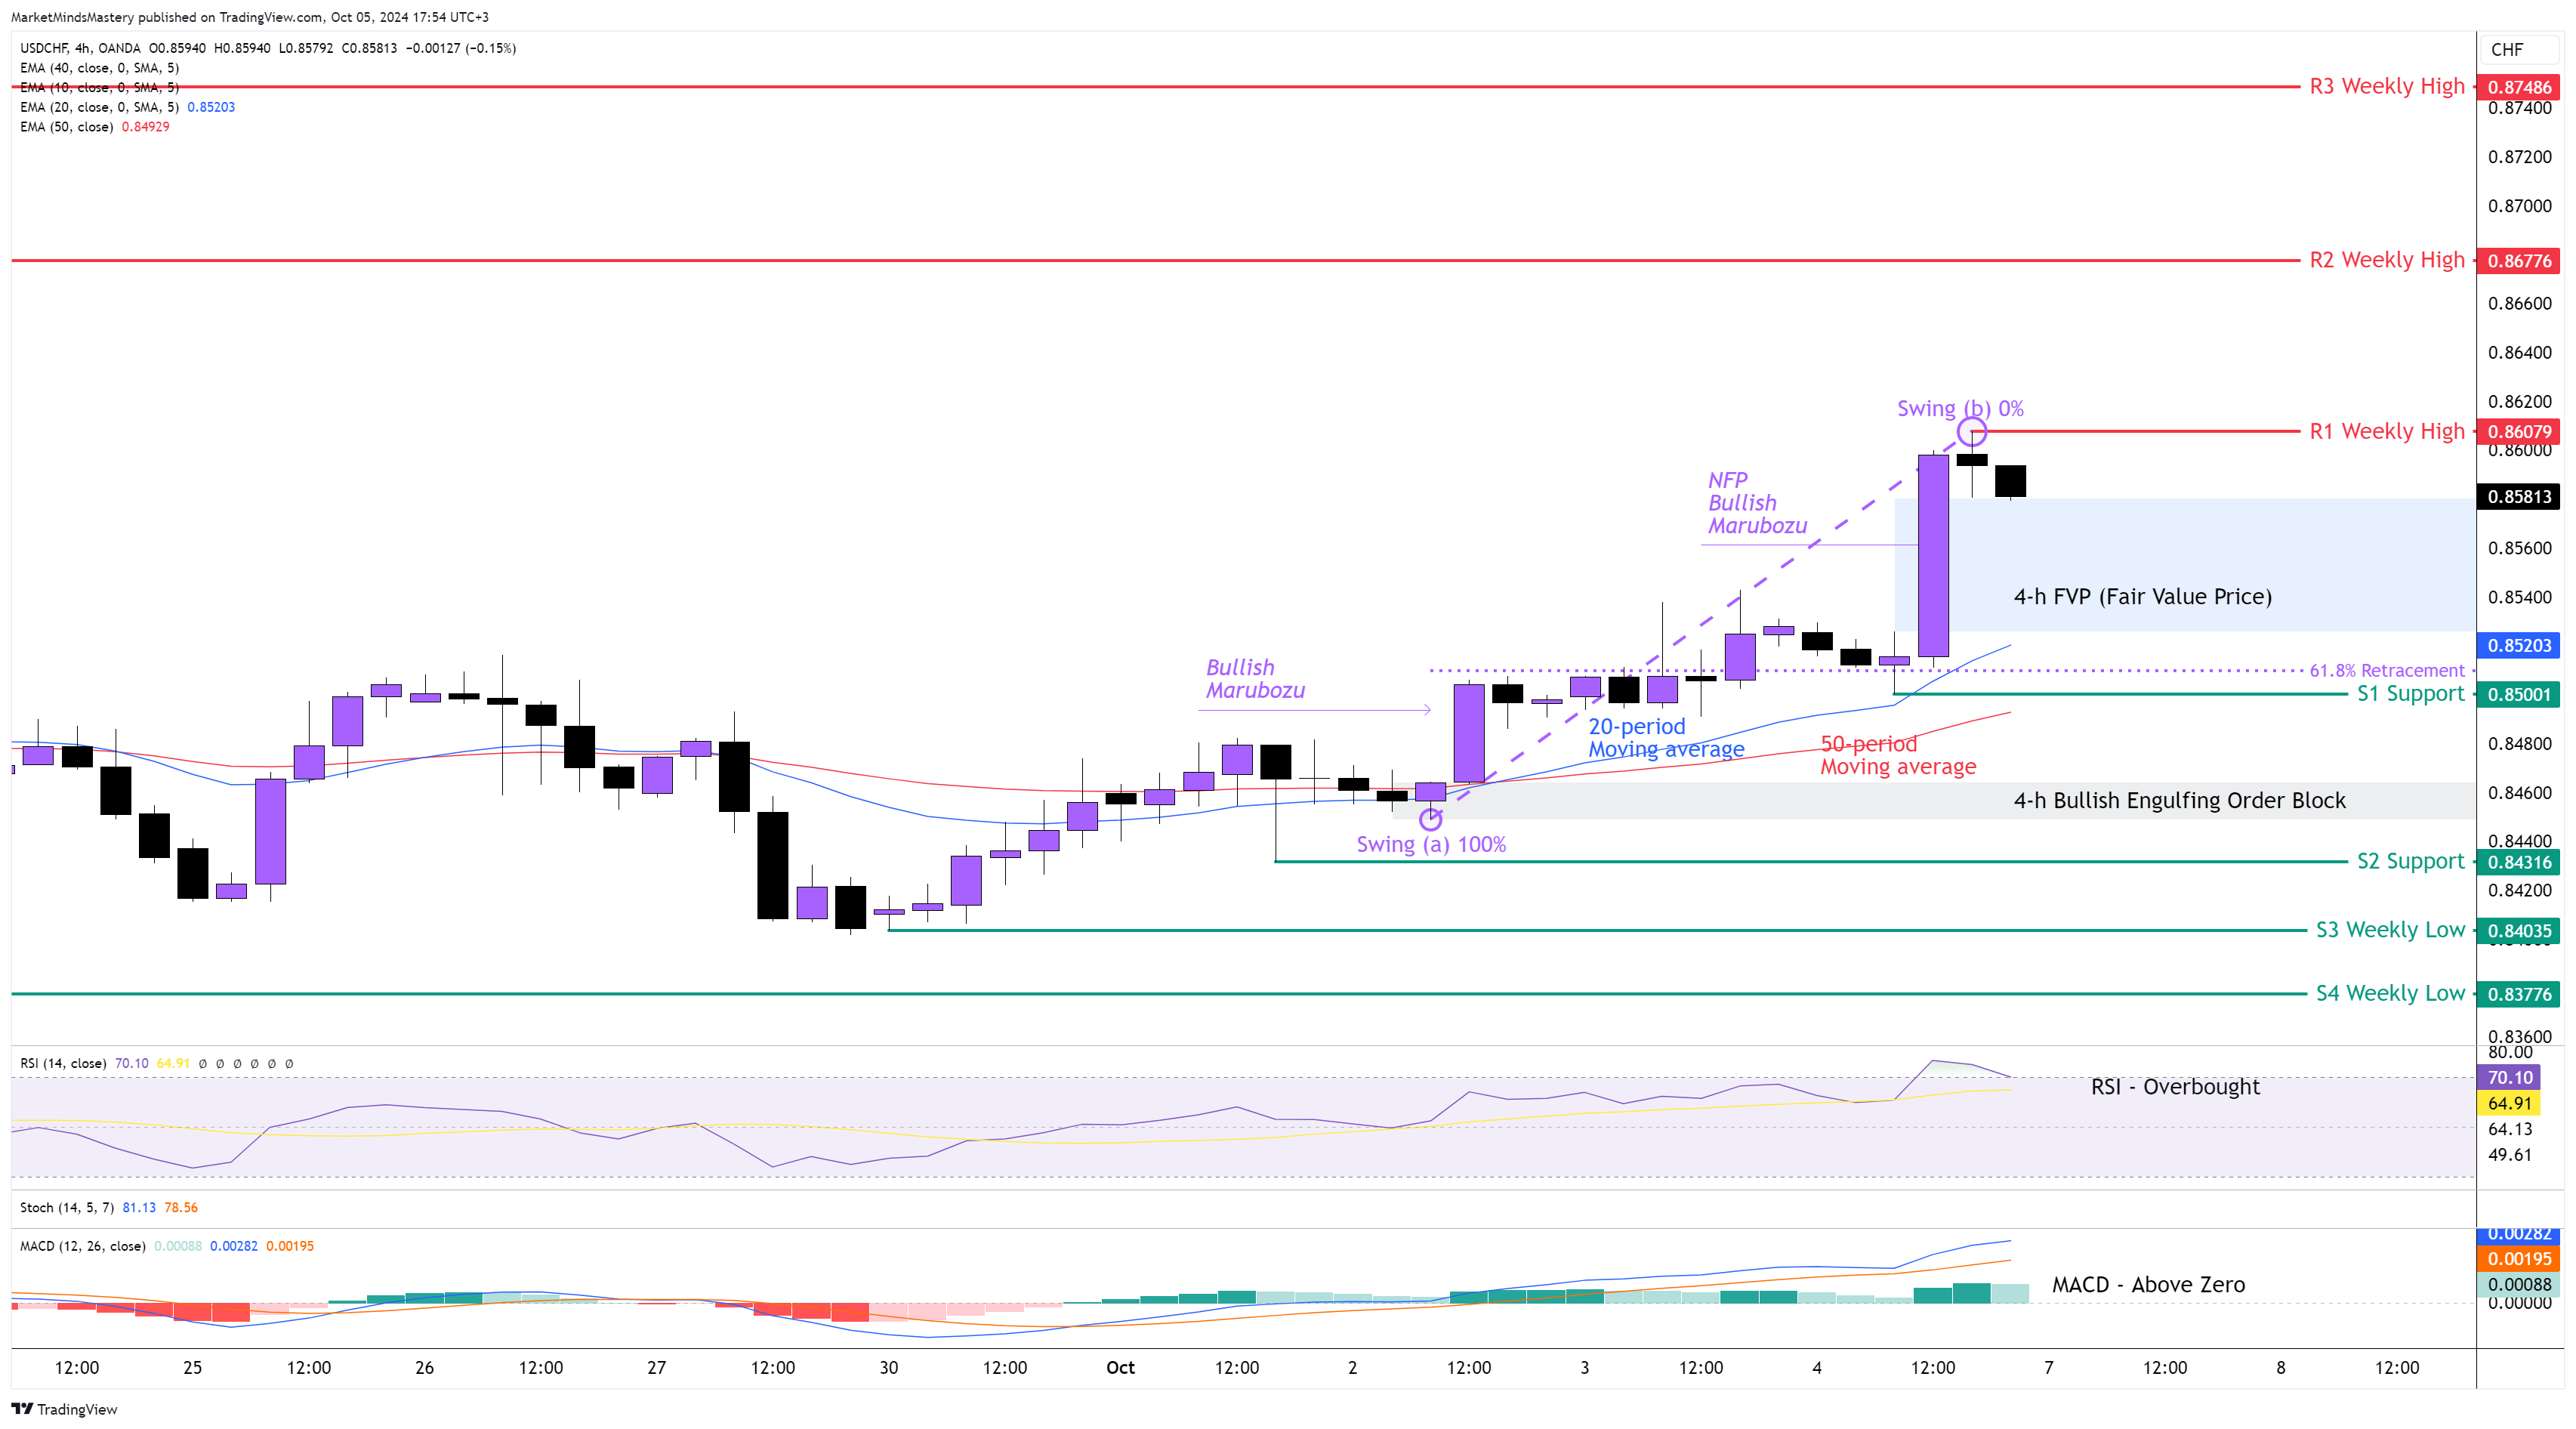
USD CHF 4H
The strength of the US dollar was evident last week, as the positive NFP, combined with the weakness of the Swissy due to the negative CPI report in Switzerland, created a bullish momentum in the market of this currency pair. The Weekly price action ended as a Bullish continuation candlestick pattern. The price on the 4-hour chart created a series of higher highs and higher lows. The 20-period is above the 50-period moving average, which is bullish. The RSI Oscillator is in an Overbought condition as it follows the price strength. The MACD is above its zero line, and this is bullish., The MACD’s Histogram is rising, indicating there is a buying pressure from the buy order in the USDCHF market. Last Friday, the price created a swing high at point (1), as shown on the chart. Therefore, if the price is rejected and moves downwards, the first support area, S1, will be around $0.8500. The same price level coexists with the Golden Ratio of the Fibonacci numbers, which is the 61.8% retracement, measuring from the swing low at point (a) until the swing high at point (b) and the 20-period period moving average. In case the price declines and moves further downwards, the next support area, S2, will be approximately 0.84316. If the price surpasses the S2 and keeps moving downwards, the next support area, S3, will be at 0.84035, which is the previous week’s low. If the price finds support at some point and bounces off and moves upwards, the first resistance area, R1, will be around 0.86079, which is the previous week’s high. If the price penetrates the R1 and keeps moving upwards, the next resistance area, R2, will be around 0.86776, as shown on the chart.
GBP JPY 4H
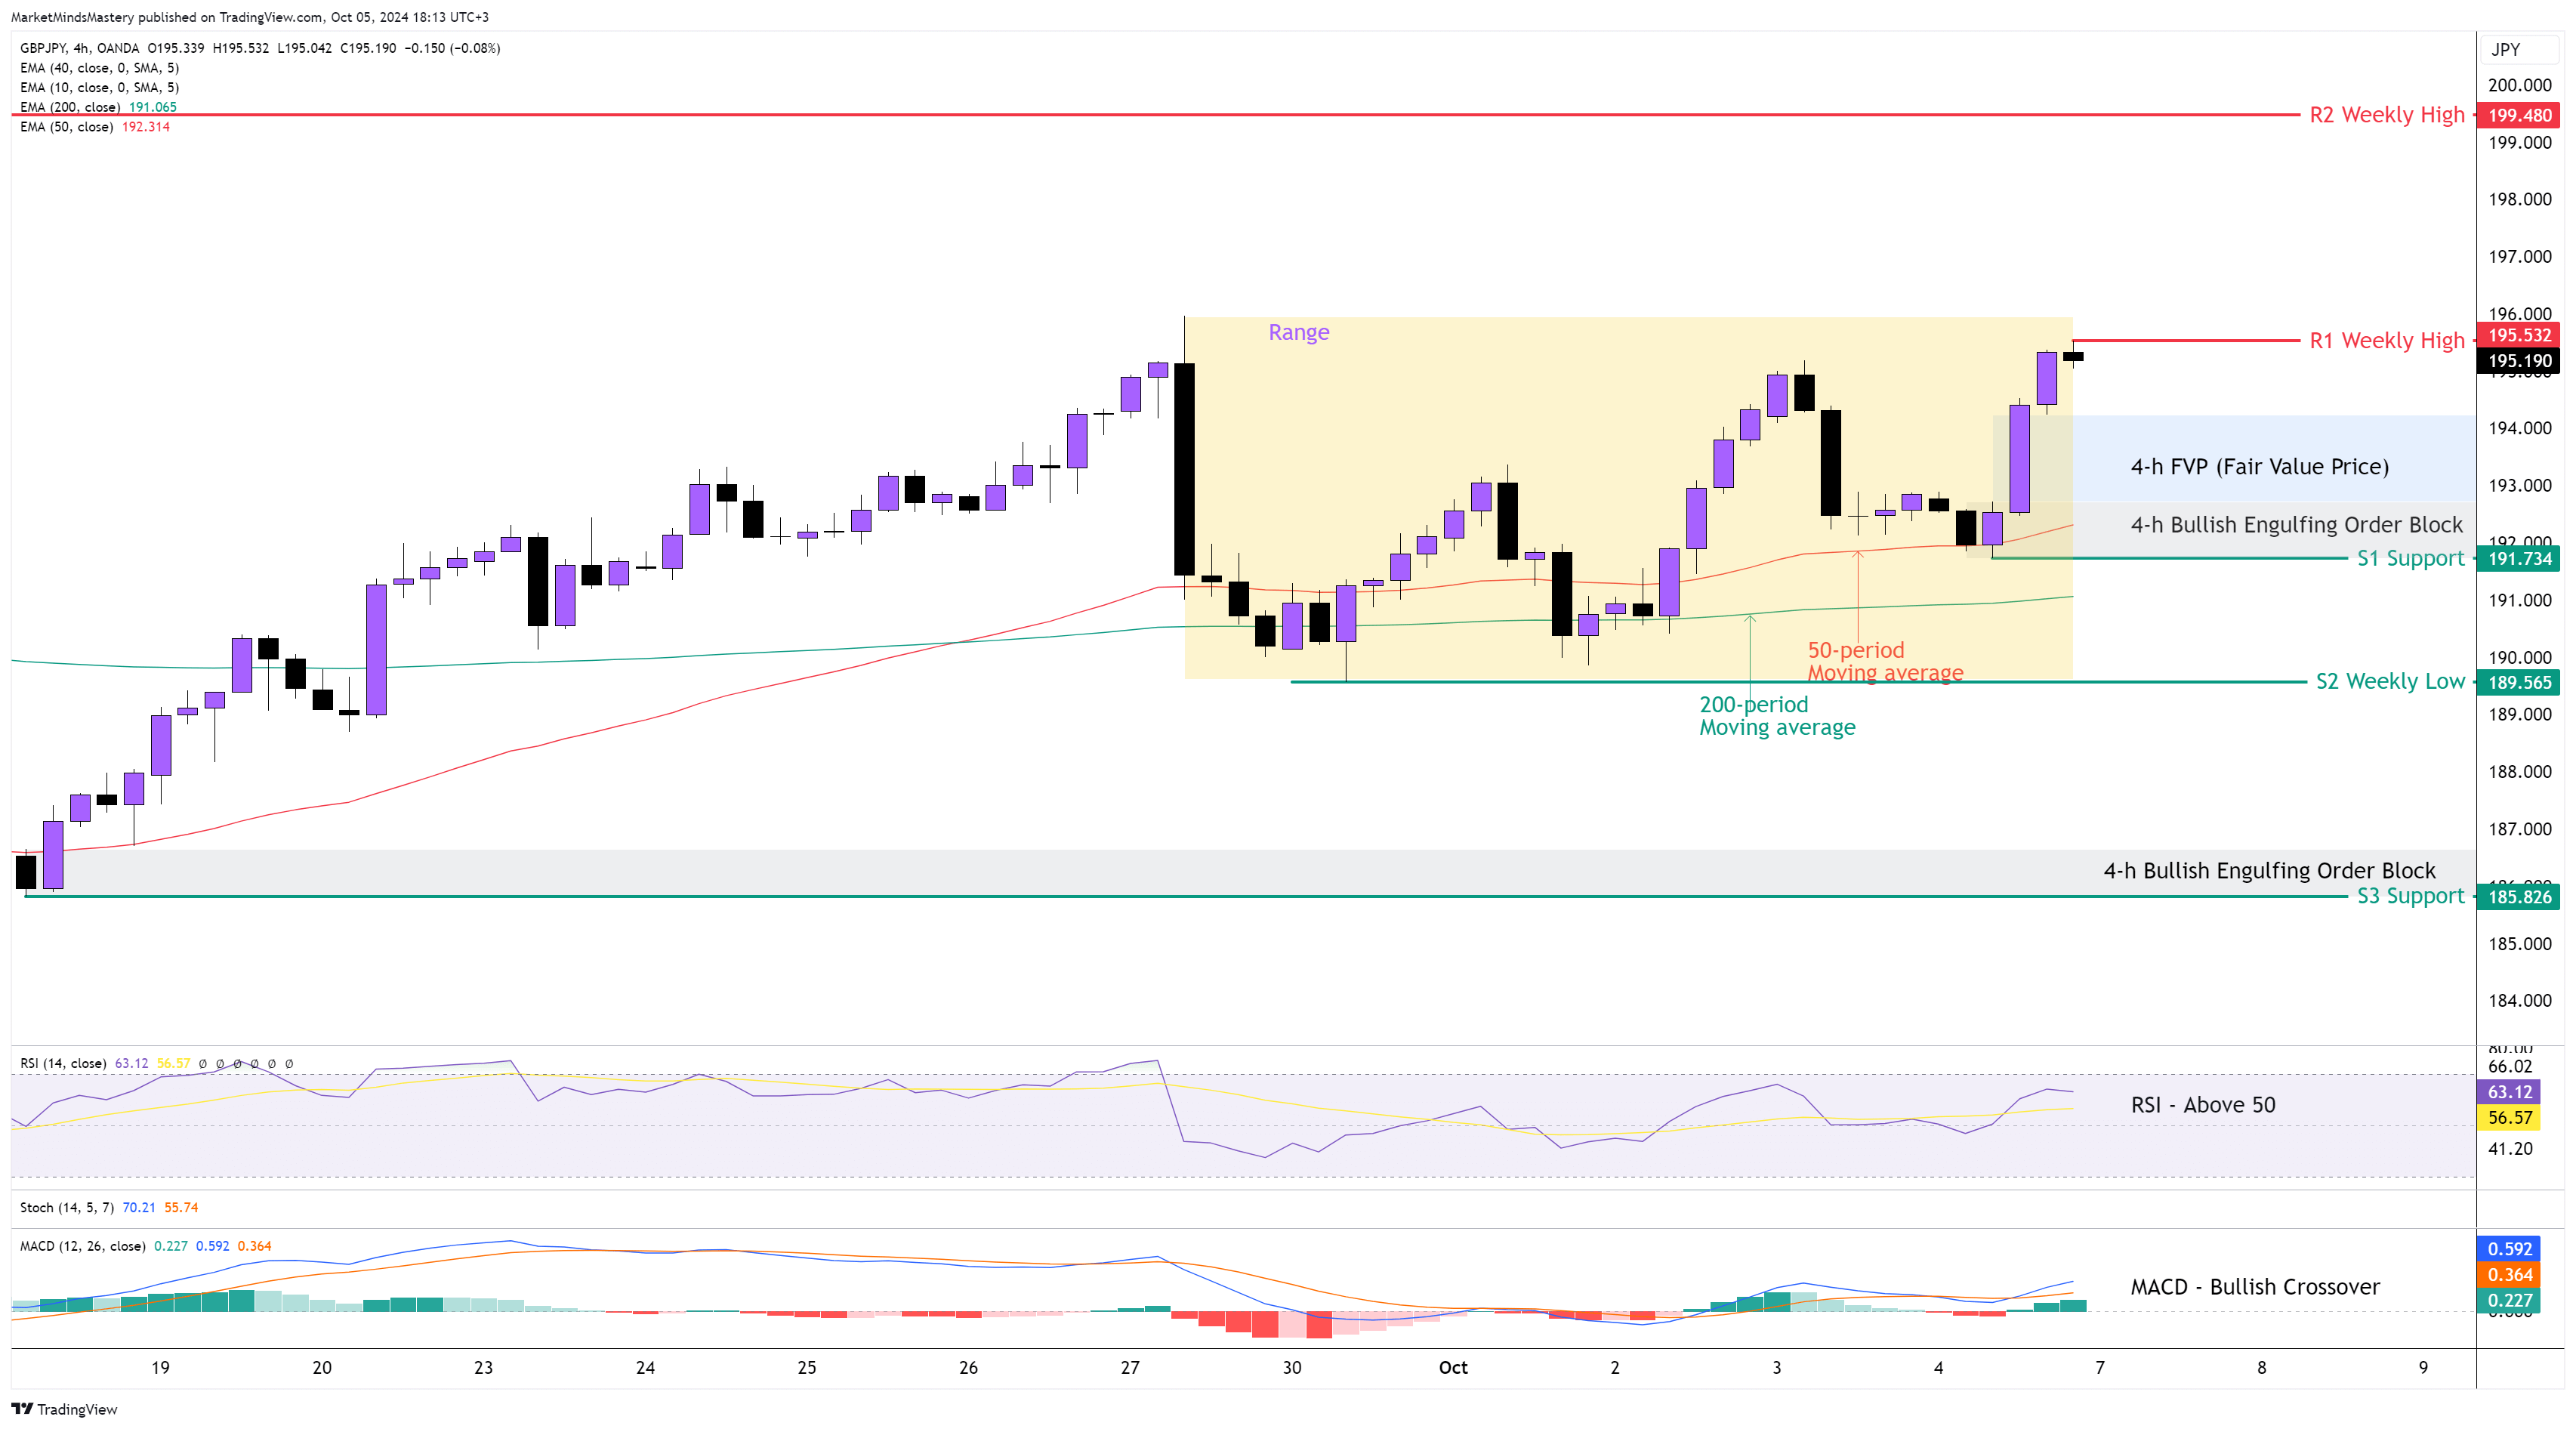
Despite the Sterling being a weak currency itself, the Japanese Yen appeared to be much weaker, and this is the reason the price of the GBPJPY currency pair moved upwards last week. On the Weekly chart, the price ended in a Bullish Continuation candlestick pattern despite the fact that the weekly primary trend is down, as the 10-period moving average is below the 40-period moving average. On the 4-hour chart, the 50-period moving average is above the 200-period moving average, which is bullish. The RSI is above its middle line of 50, and this is also bullish. The MACD is above its zero line and also is showing a bullish crossover, as the MACD Line (Blue) crosses above its Signal Line (Orange). Last week, the price was trading within a range, as shown in the chart above. Although the Order Blocks and the FVP created within the ranging market structure are low probability indications, we added them to the chart so the traders would be aware of them. Both of them were created last Friday, with the Bullish Engulfing Order Block being around 197.000 and the FVP (Fair Value Price) around 193.000. Starting Monday, if the price moves upwards, the first resistance area, R1, will be around 195.532, which is the previous week’s high. If the price penetrates the R1, it will create a Bullish Breakout. If the price continues to increase afterwards, the next resistance area, R2, will be around 199.480, which is an old weekly price level. On the other hand, if the price rejected and moves downwards, the first support area, S1, will be around 191.734, which is also the middle of the range area, as shown on the chart. If the price penetrates the S1 and moves further downwards, the next support area, S2, will be around 189.565, which is the previous week’s low.
GOLD 4H
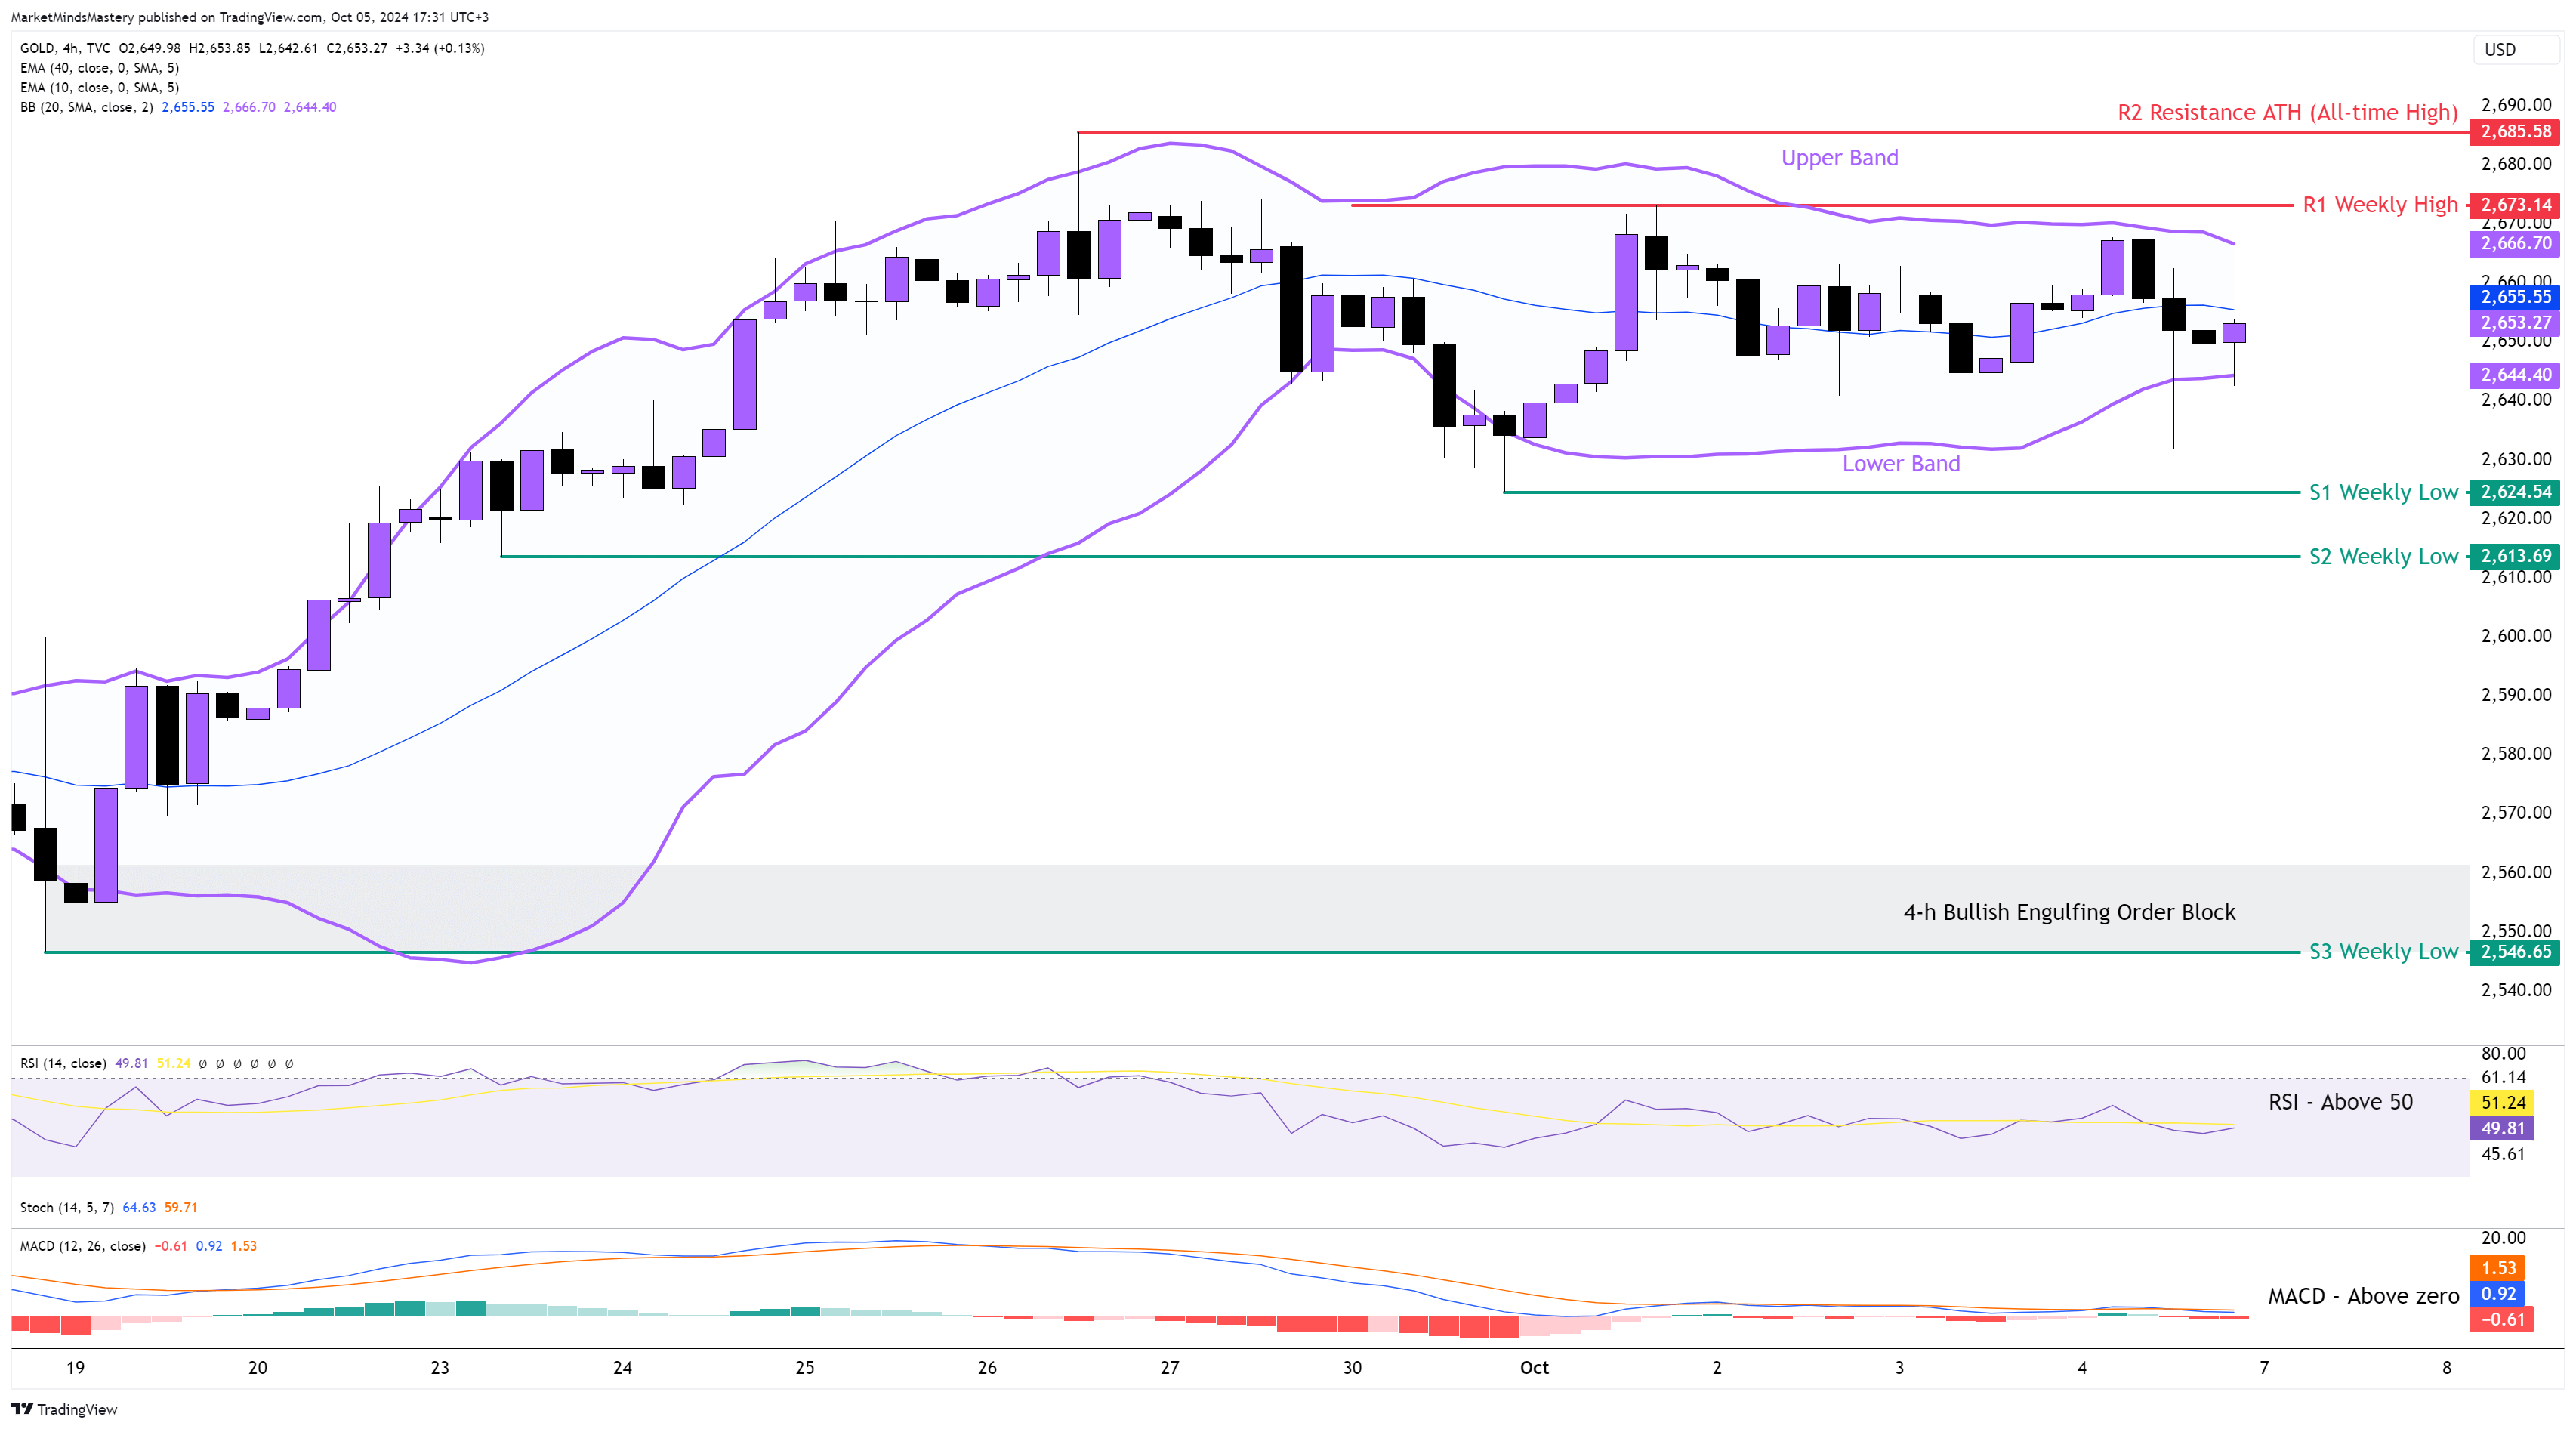
Following the previous week’s Market Outlook, the price of GOLD found support at the 61.8% Fibonacci Golden Ratio, and it has remained above this level of $2640 since then. The weekly price action ended as an Inside Doji Candle, which means that the forces of supply and demand last week were equal. The price on the 4-hour chart is moving sideways. Also, the price range is very narrow. This is the reason we see the Upper and Lower Bands of the Bollinger Band indicator not only parallel to each other but also have a very narrow distance between them. The RSI is above its middle line of 50, and this is bullish. The MACD is above its zero line and this is also a bullish indication.
Starting Monday, if the price moves downwards, the first support area, S1, will be the previous week’s low at around $2624. In case the price penetrates the S1 and keeps lowering, the next support area, S2, will be the area around $2613, which is considered a significant price level because if the price penetrates this level, it will create a new market structure and the price momentum is likely to shift to the downside. A further decline will find the next support area, S3, around $2546.
On the other hand, if the price follows the primary trend direction and moves upwards, the first resistance area, R1, will be the previous week’s high, around $2673. If the price penetrates the R1 and keeps increasing, the next resistance area, R2, will be the ATH (All-Time High) at $2685.
USOIL 4H
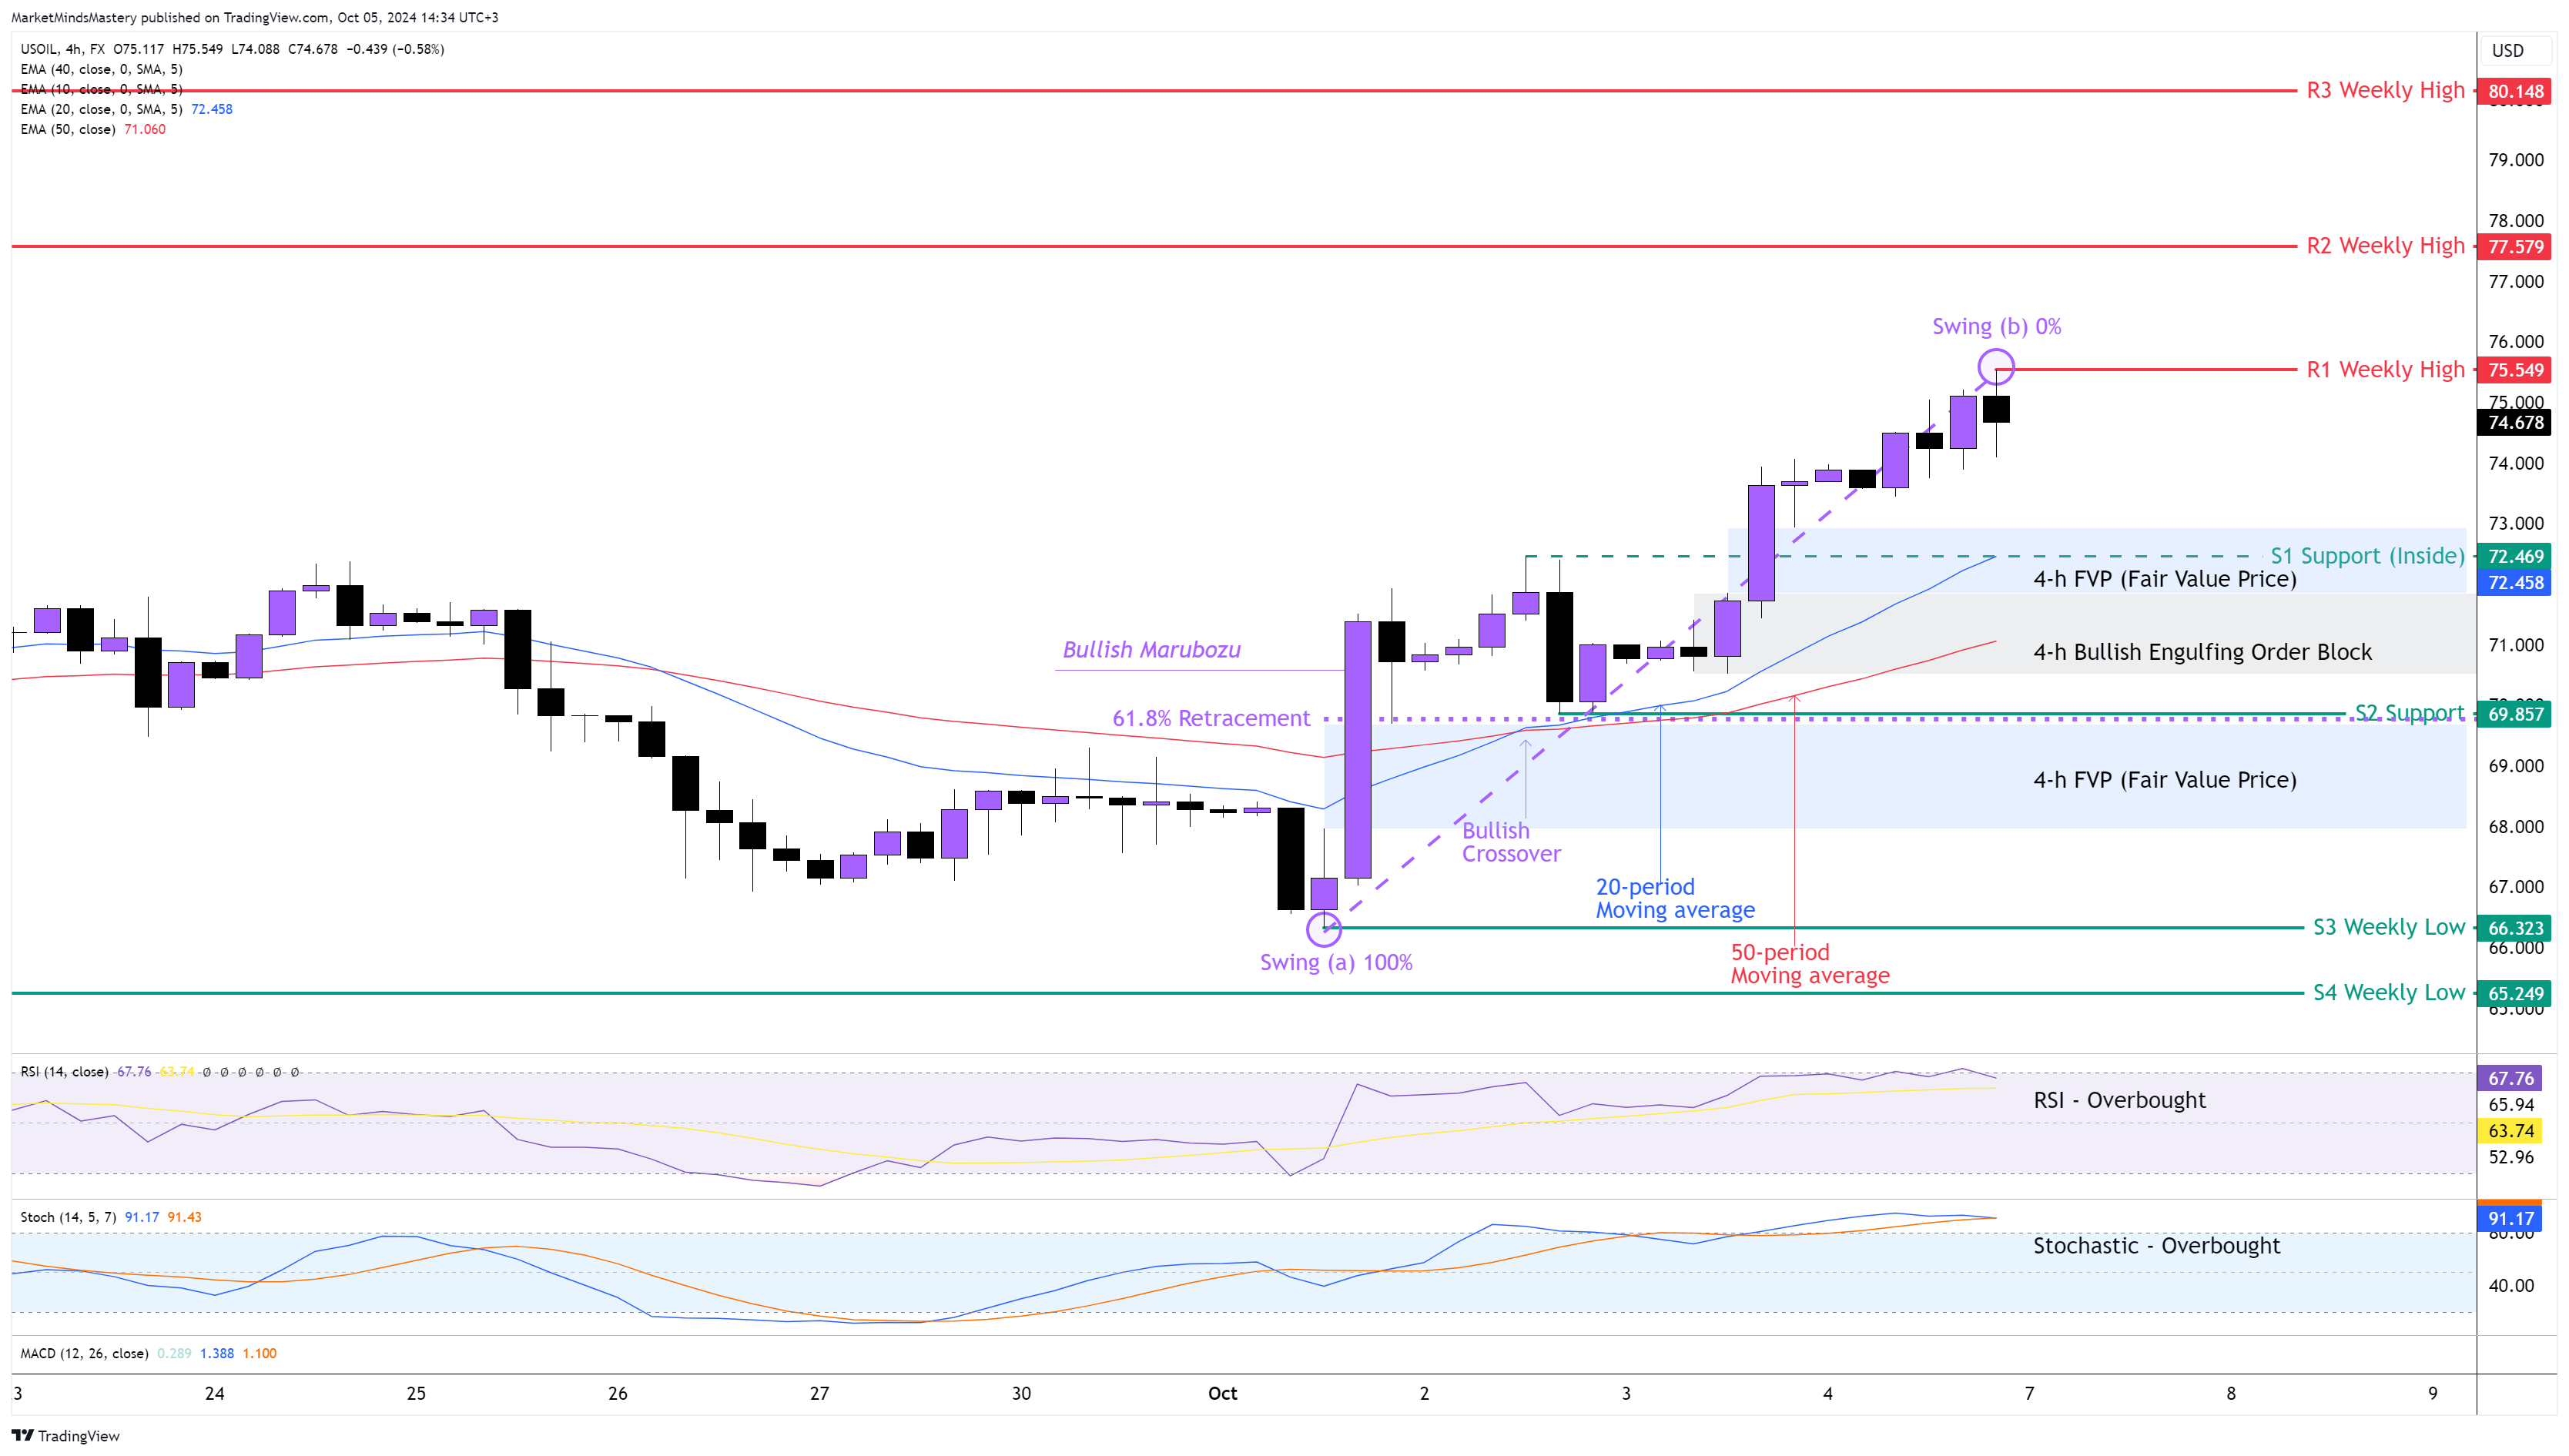
The price of USOIL skyrocketed last week. Observing the price charts, a bounce off the area of $67 was expected, as this price level has acted as a support zone for the price, 12 times since March 2023. The weekly price action ended as a Bullish Engulfing candlestick pattern, and it closed above the 10-period weekly moving average (not shown on the chart above). On the 4-hour chart, the price is in an uptrend. The size of the Bullish candles (Purple colour) is longer than that of the Bearish candles. This is an indication of the Bullish momentum currently in the USOIL market. The 20-period is above the 50-period, and this is bullish. The RSI and the Stochastic Oscillator are both at their Overbought conditions indicating bullishness. Starting Monday, if the price moves upwards, the first resistance area R1 will be around $75.54, which is the previous week’s high. If the price penetrates the R1 and keeps moving upwards, the next resistance area, R2, will be around $77.57, which is an old weekly high level.
On the other hand, if the price rejected and moves downwards, the first support area, S1, will be an Inside support level around $72. This is considered a key level of support for the USOIL market as, at this price level, a Bullish Engulfing Order Block and an FVP (Fair Value Price) were created last Thursday. Also, at this level, the price coexists with the 20-period moving average. A deeper retracement can find a confluence of supports around the 50-period moving average, the 61.8% Fibonacci retracement and the S2 inside support approximately at $69.85. If the price doesn’t bounce off from this price level and keeps declining further, then the next support area, S3, will be around $66.32, which is the previous week’s low.
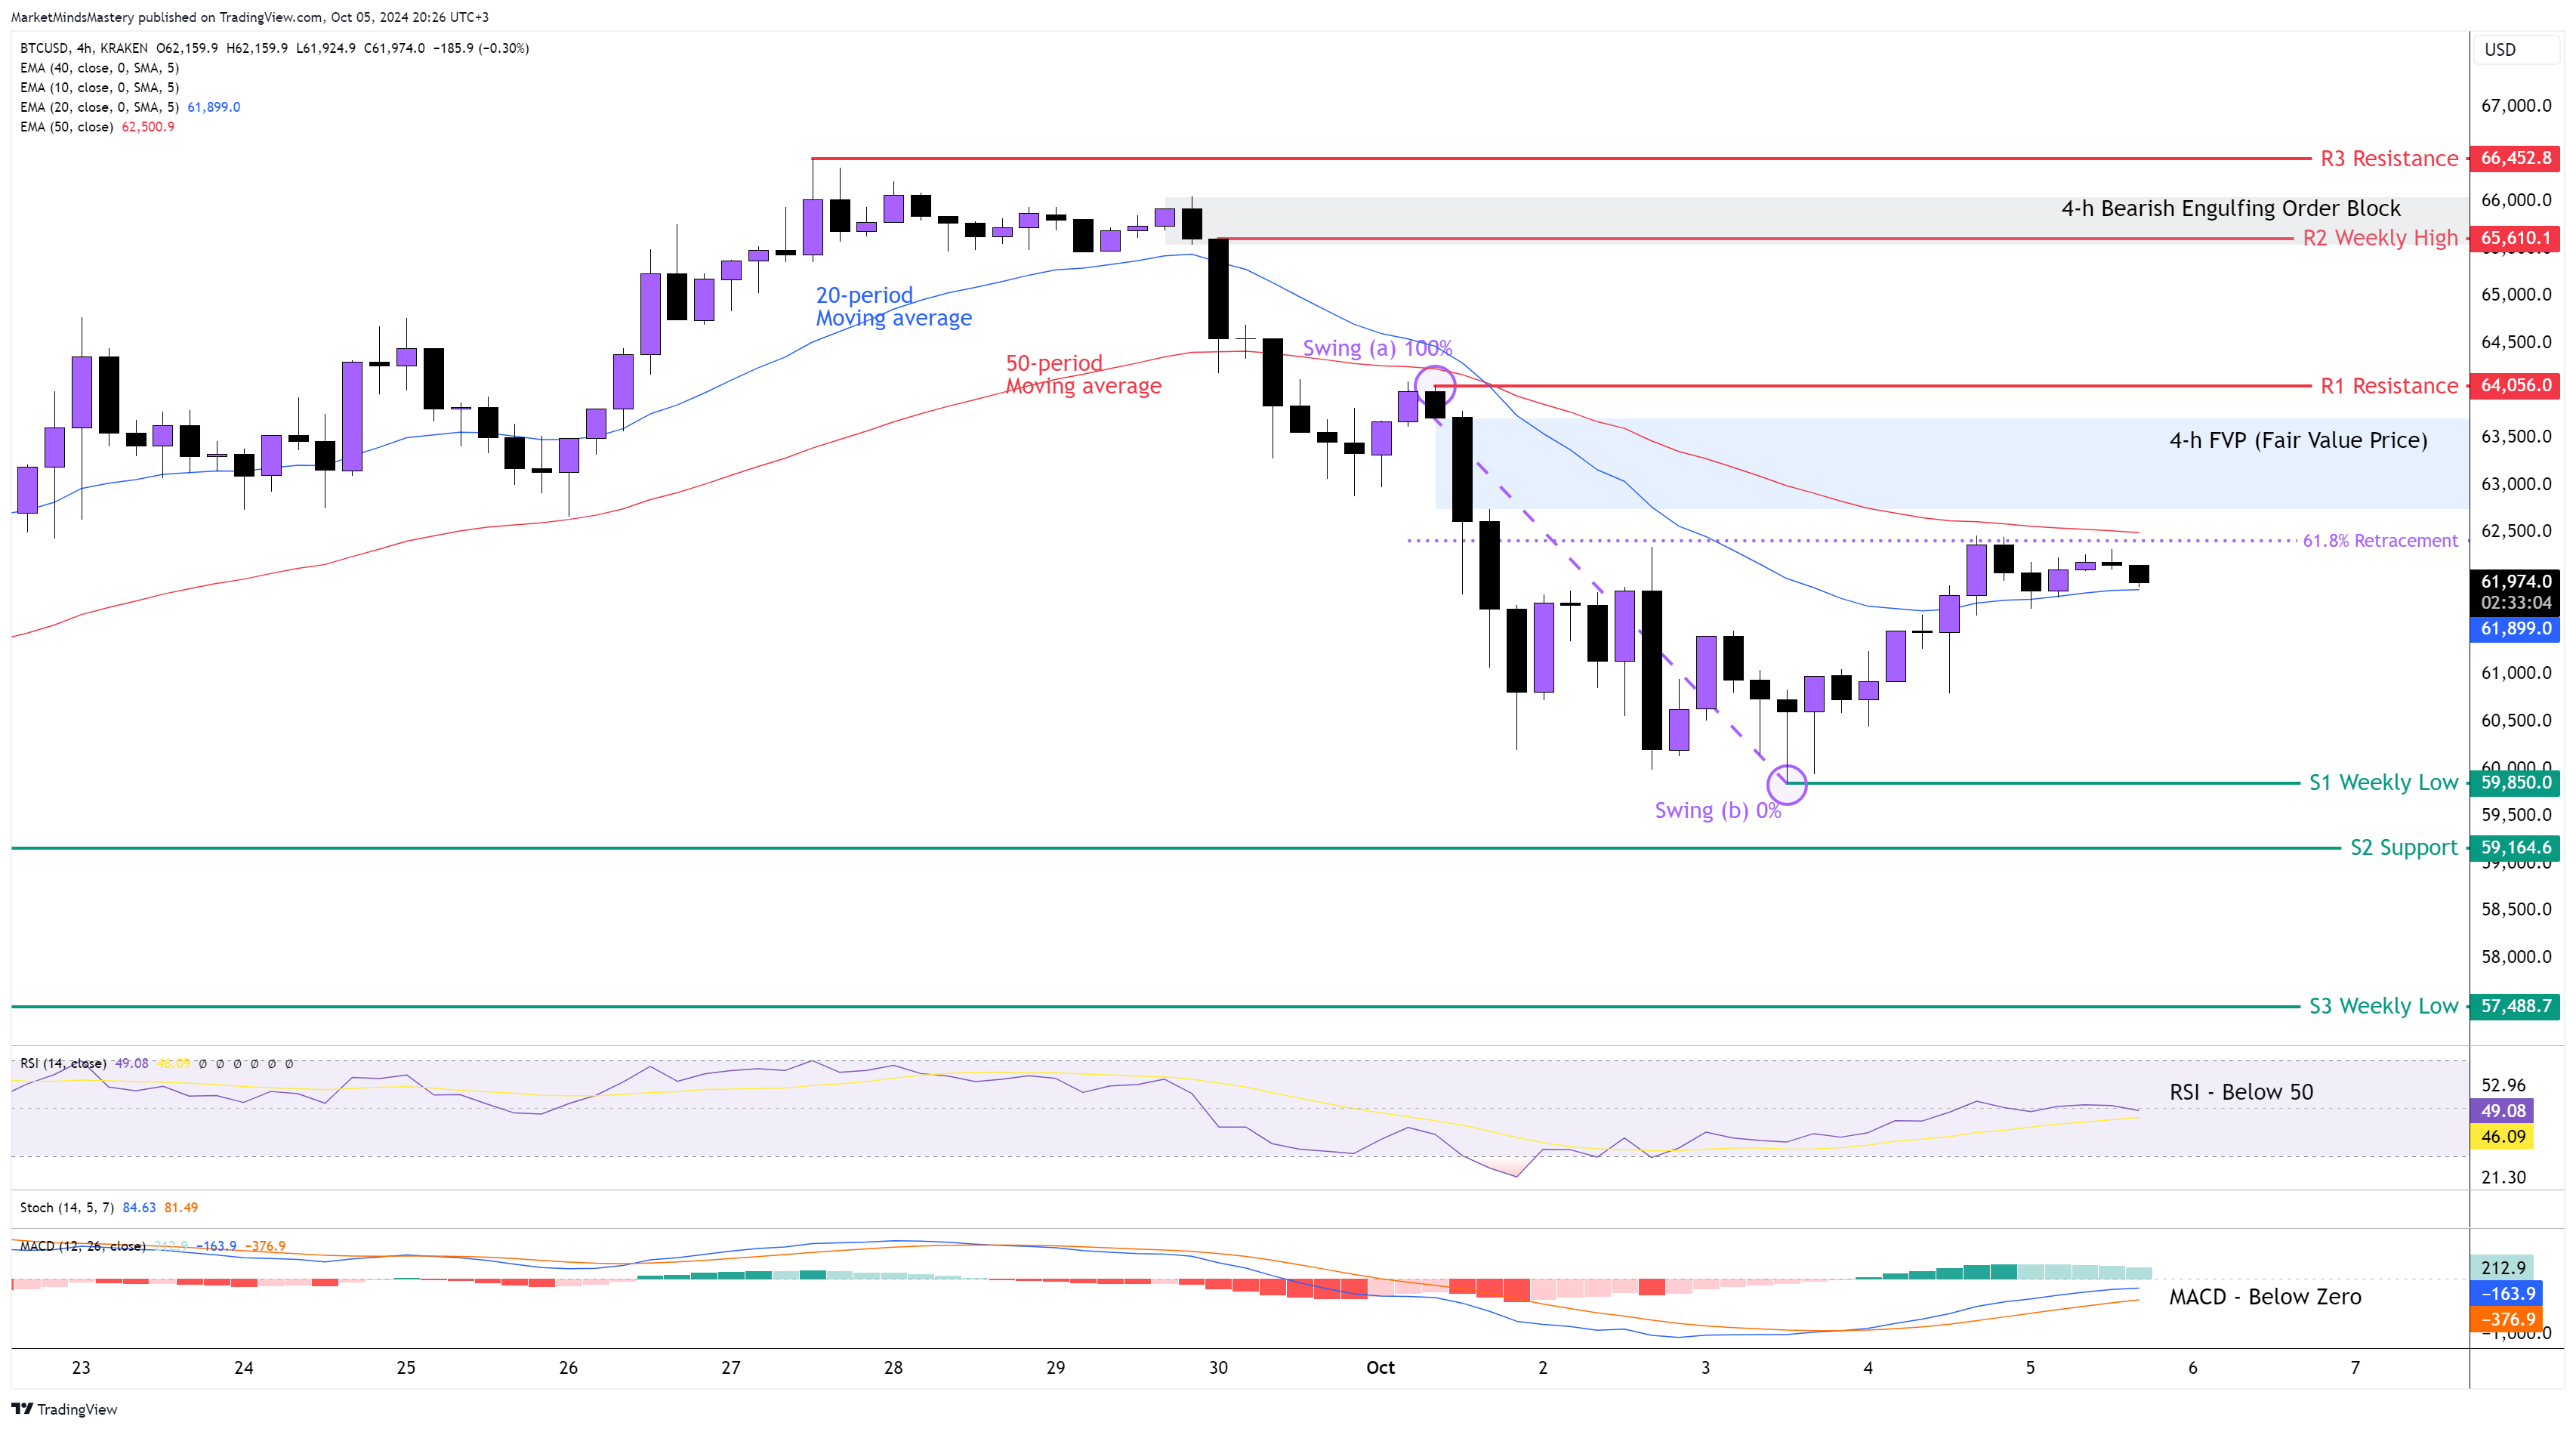
BTC USD 4H
Following the previous week’s Market Outlook, BTCUSD price tested the Bullish Engulfing Oder Block we marked on the chart last week, bounced off and moved upwards. The price reached the Order Block area after the price changed its market structure, and from an uptrend, it turned into a downtrend with a series of lower highs and lower lows. Hence, the 20-period crossed below the 50-period moving average, which has bearish implications. The RSi is below 50, and this has bearish implications. The MACD is below its zero line, and this also has bearish implications. Last Thursday, the price created a swing low formation at point (b), as shown on the chart. It then bounced off and moved upwards as expected. Currently, the price is around $62000, which is it coexists with the 50-period moving average and the 61.8% Fibonacci retracement if we measure the move from the swing at point (a) until the point swing (b) as shown in the chart. If the price continues to move upwards, the first resistance area, R1, will be $64000. Around the same price level, there is an FVP (Fair Value Price) that was created last Tuesday, and it can act as an additional resistance factor for the price. If the price penetrates the R1 and keeps moving upwards, the next resistance area, R2, will be around $65610, which is the previous week’s high. If the price penetrates the R2 and keeps moving higher, the next resistance, R3, will be around $66452. On the other hand, if the price moves downwards, the first support area, S1, will be at $59850, which is the previous week’s low. If the price surpasses the S1 and keeps lowering, the next support area, S2, will be around $59164.
SP 500 4H
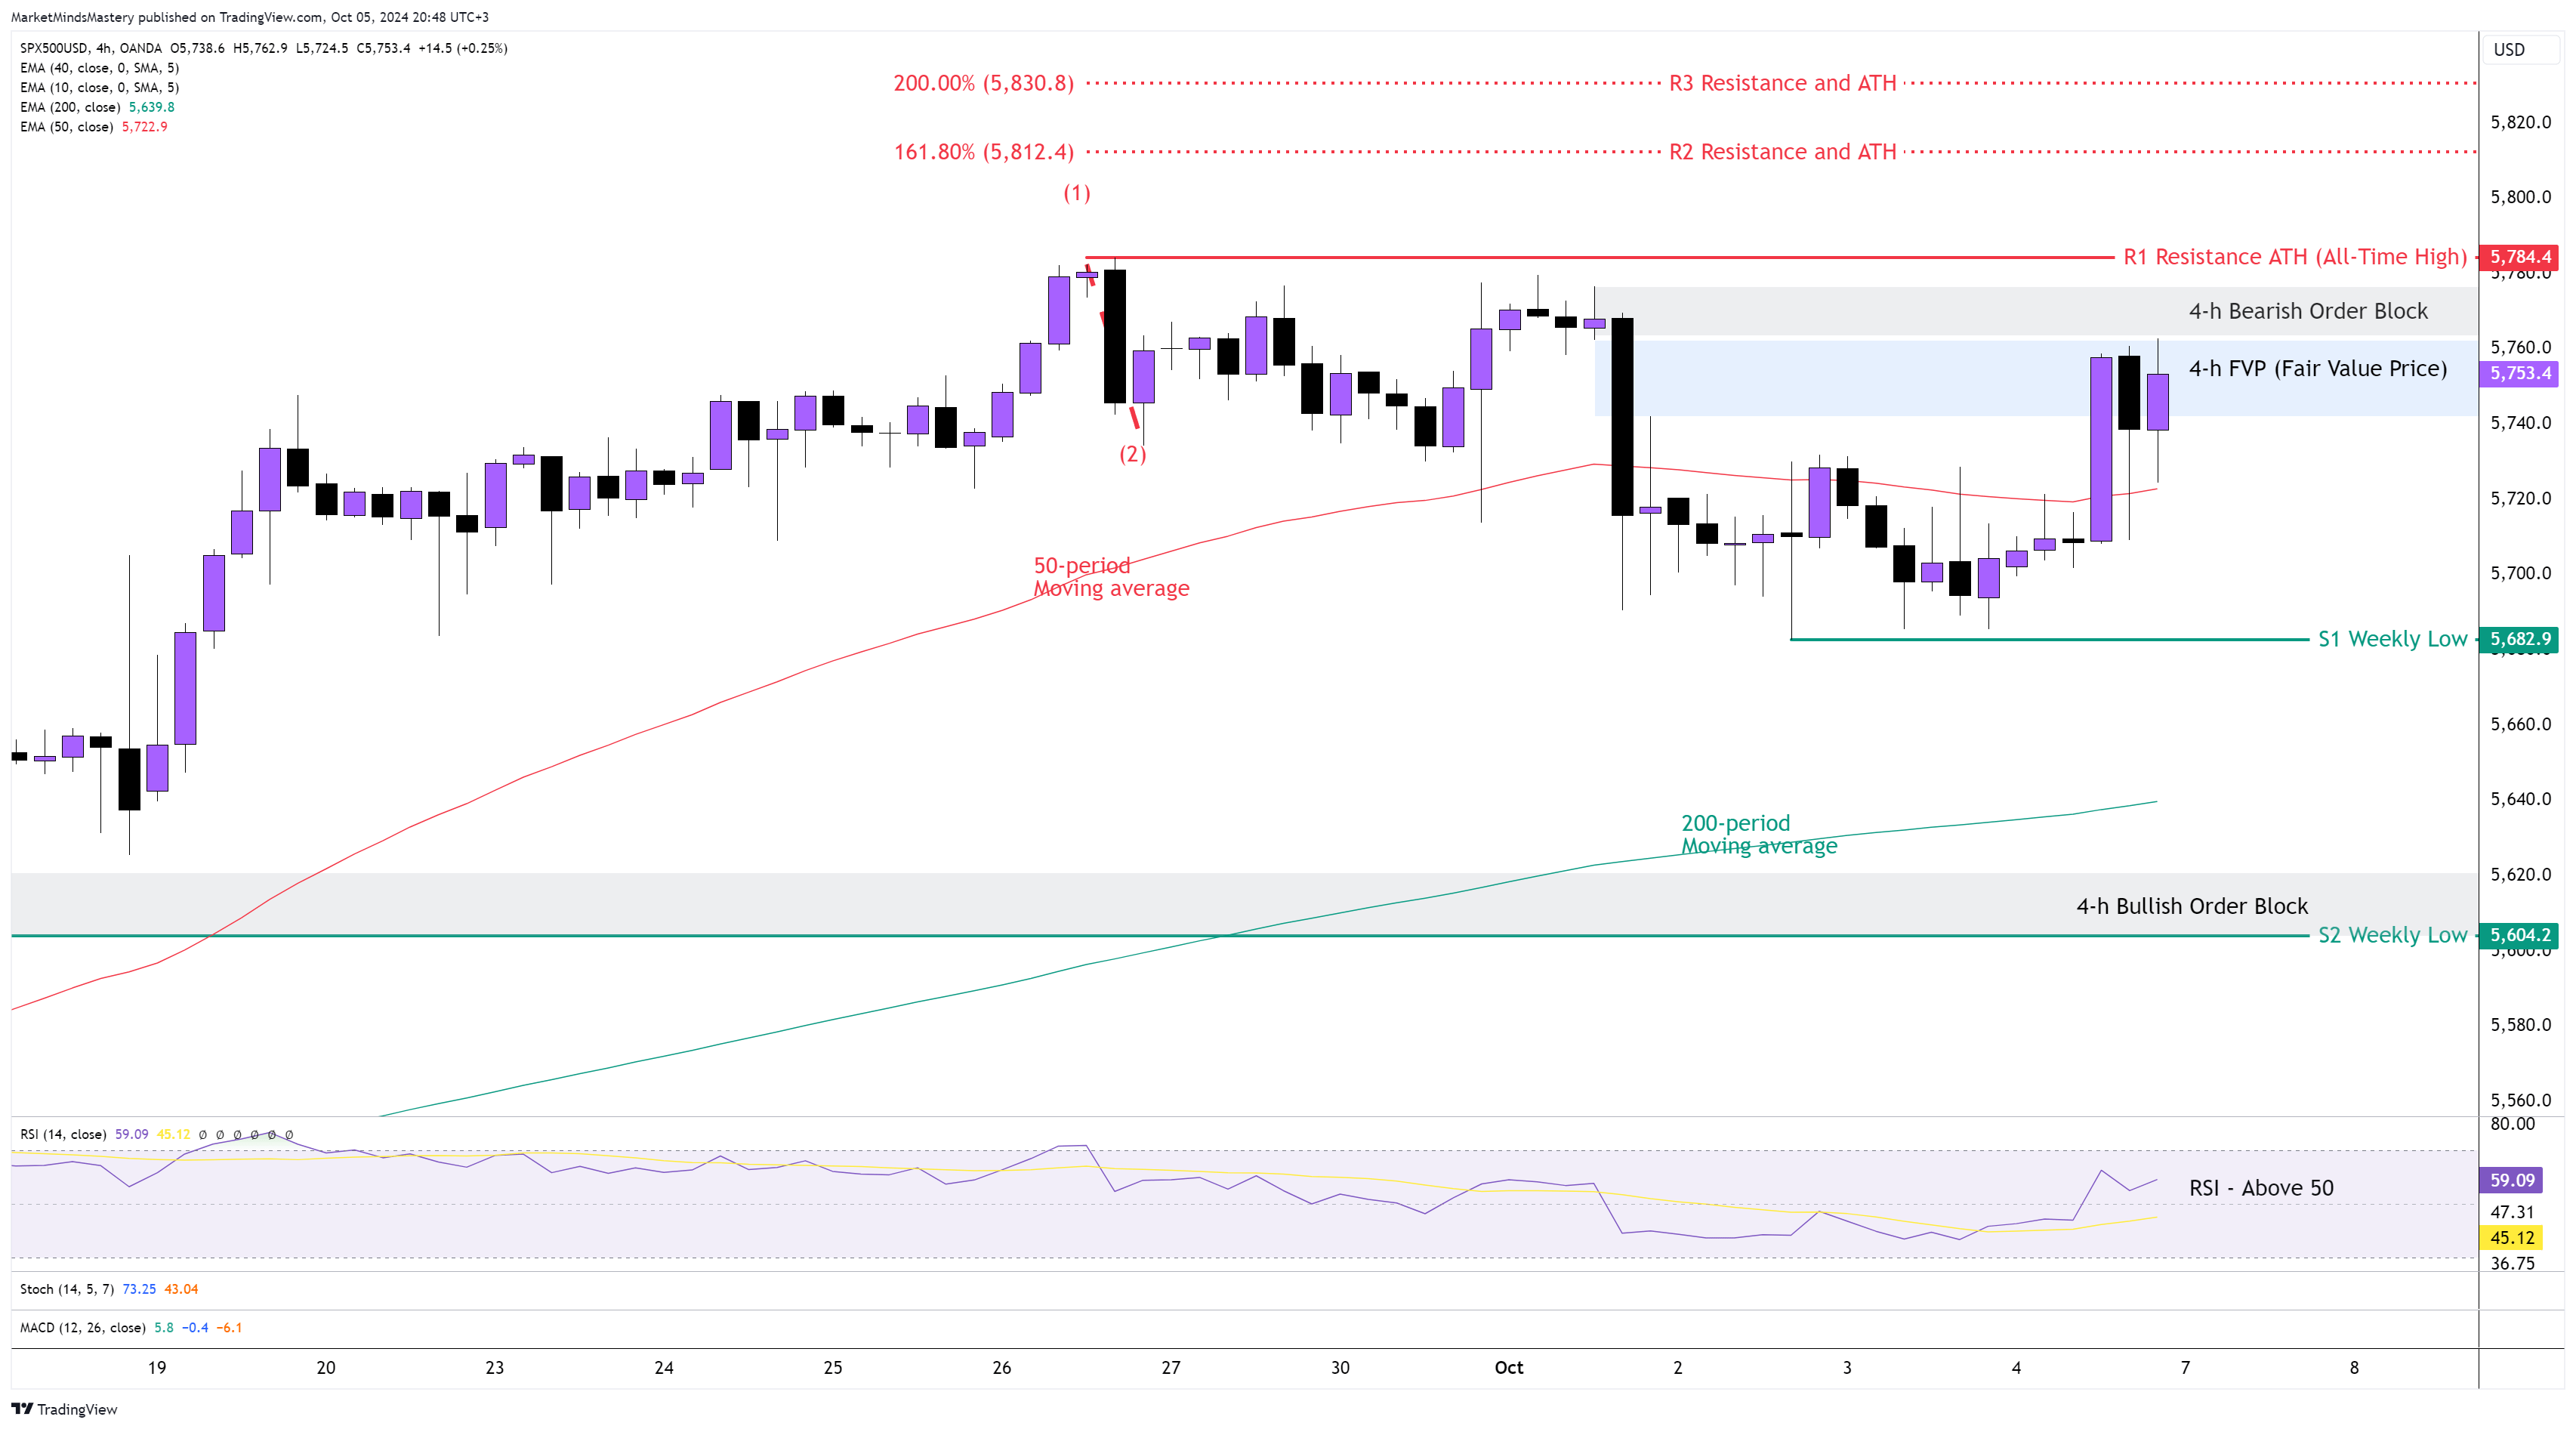
Last week, the SP500's price was within a narrow trading range. This is why the price action on the Weekly chart ended as a Doji candle around its ATH (All-Time High) price level. On the 4-h chart, the price has an overall bullish sentiment, as shown on the chart, as the 50-period moving average is still above the 200-period moving average. The RSI Oscillator is above its middle line of 50, which has bullish implications. Last Friday, after the NFP was announced, the price filled up an FVP (Fair Value Price) that was created last Tuesday at around $5760. Additionally, a Bearish Order Block was created last Tuesday around $5770, which hasn’t been tested yet.
Starting Monday, if the price moves upwards, the first resistance area, R1, will be the ATH (All-time High) around $5784. If the price penetrates R1 and keeps moving upwards, the next resistance area, R2, will be $5812. In the chart above, this is shown as the 161.8% Fibonacci Extension level.
Oppositely, if the price is rejected and moves downwards, the first support area, S1, will be around $5682, which is the previous week’s low. If the price surpasses the S1 and keeps moving lower, the next support area, S2, will be approximately $5604, which is an older weekly level. A Bullish Order Block was created a few weeks ago at this price level, but it hasn’t been tested yet.
US 30, 4H
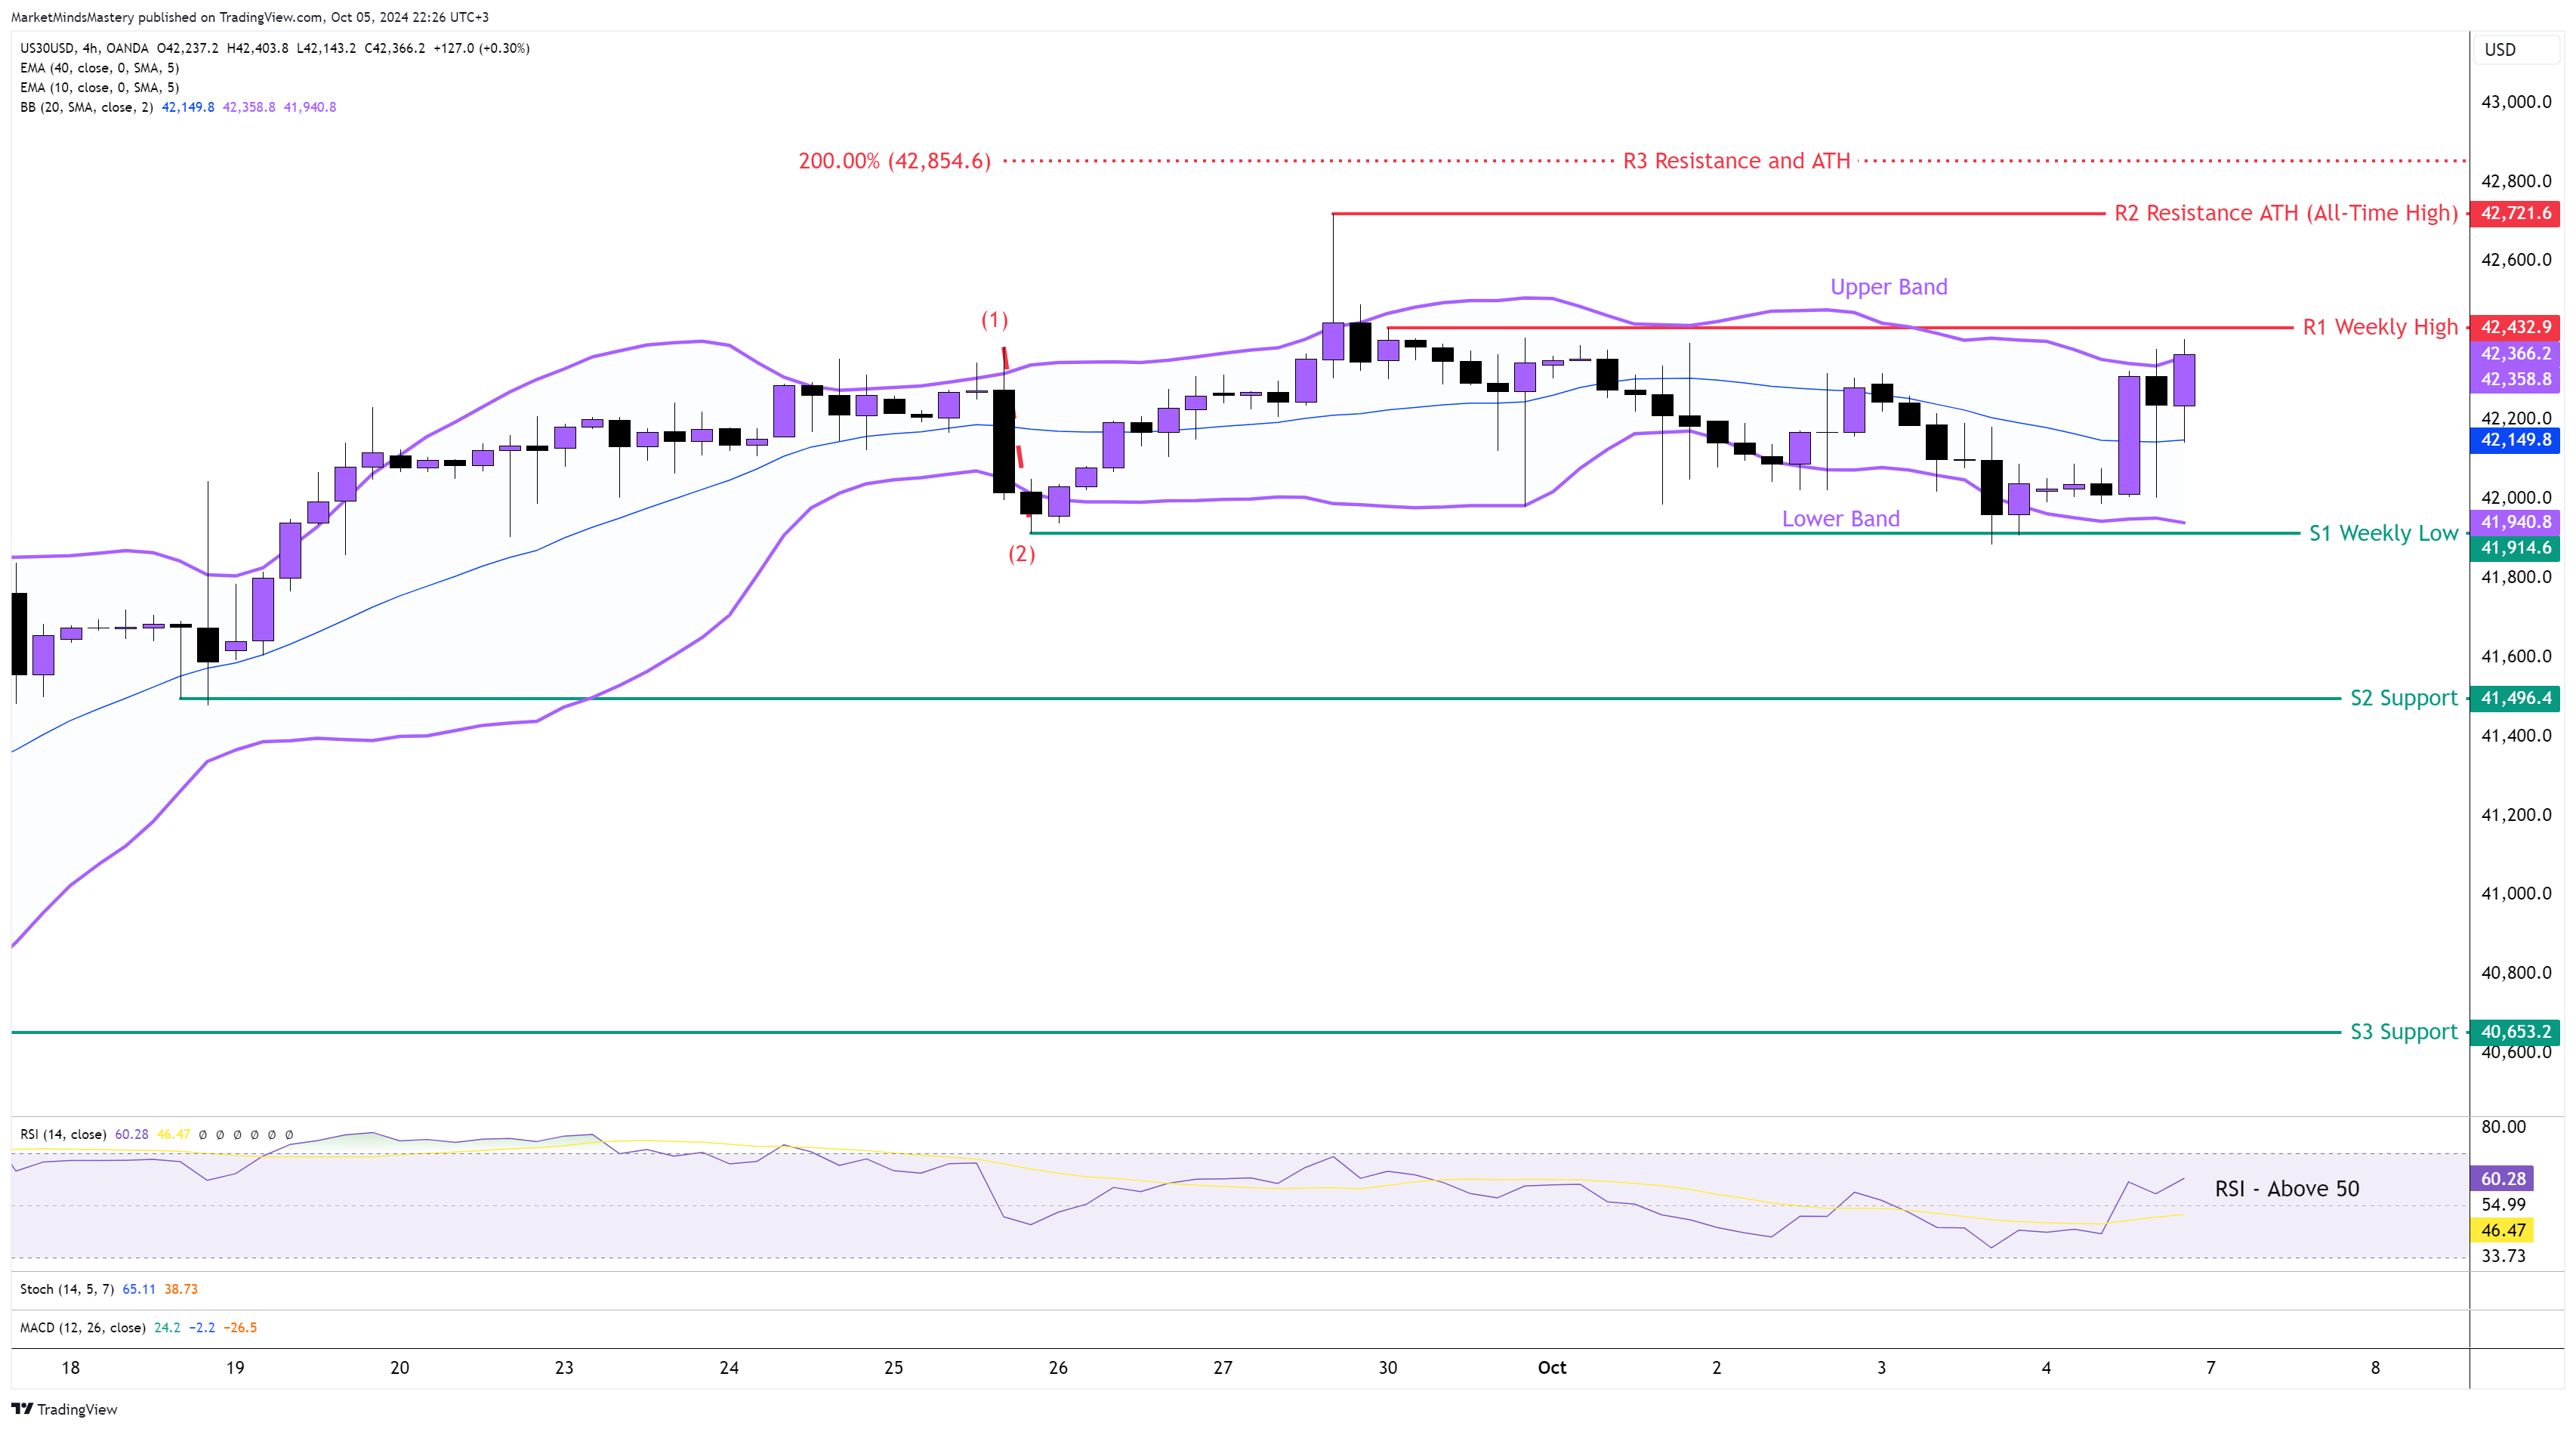
As with all the major US Indices, the US 30 also traded with a sideways move last week. The fact that the price is at its ATH (All-timer High) price level, without any significant price retracement, makes traders anticipate a price correction on the weekly chart, which will be shown as a downtrend in the lower time frames. On the 4-hour chart, the price was trading within the Upper and Lower Band of the Bollinger Band. As both Bands are coming close to each other, it is a sign of a Volatility contraction. The market only stays like this for a while. A Breakout either to the Upside or the Downside is expected to occur under a noticeable amount of volatility. The RSI is above its middle line of 50, which is bullish. The Price reached the upper Band of the Bollinger Band Indicator, and the last candlestick failed to close above it. If the price moves upwards, the first residential area, R1, will be around $42432, which is the previous week’s high. If the price manages to penetrate the R1 resistance and keeps moving upwards, the next resistance area, R2, will be around $42721, which is the ATH. In case the price surpasses the R2 and keeps moving upwards, the next resistance area, R3, will be around $42854. This price level is found using the Fibonacci Extension of 200%, as shown on the chart. Oppositely, if the price declines and moves downwards, the first support area, S1, will be around $41940, which is the previous week’s low. If the price penetrates the S1 and keeps moving lower, the next support area, S2, will be approximately $41496. A further downward move will find the S3 support area, around $40653.
GER 30, 4H
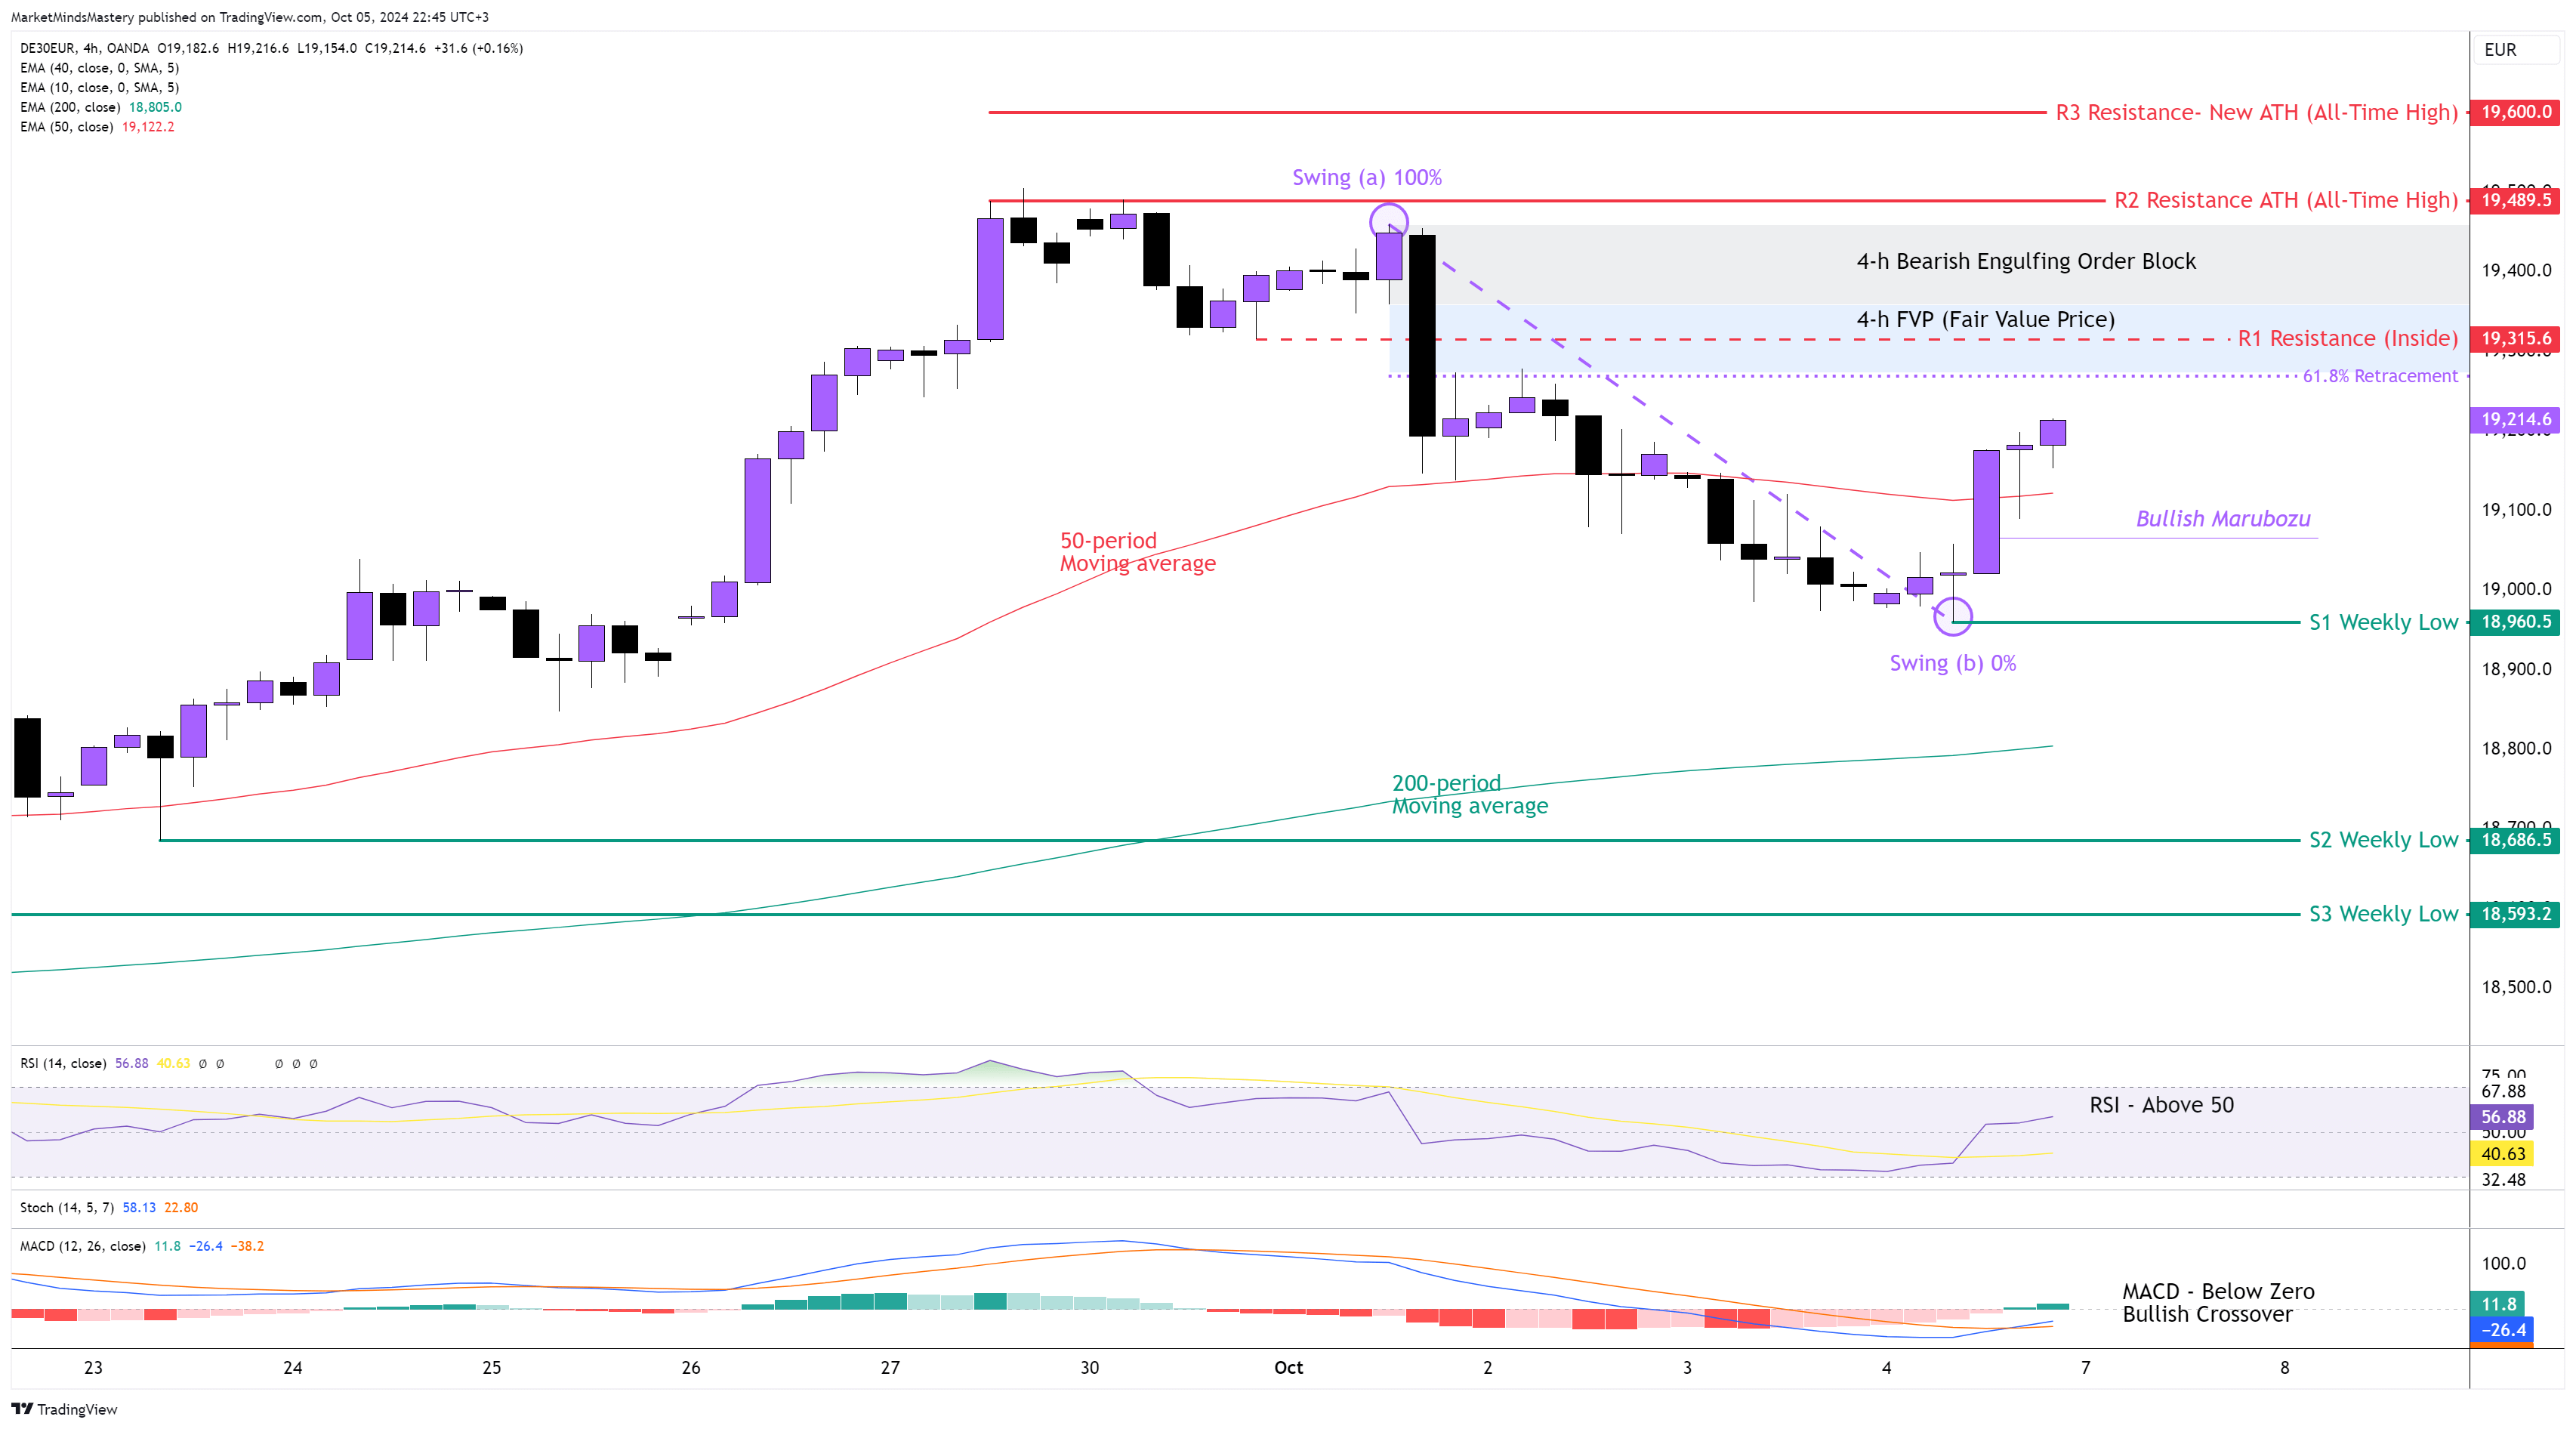
Following the previous week’s market analysis, the price of the GER30 tested the Breakaway Gap we pointed out on the chart last week, and immediately, it bounced off and moved upwards, creating a Bullish Marubozu candlestick pattern. The price then started a retracement phase. The RSI is above the middle line of 50, which is bullish. The MACD, on the other hand, is below zero, but it created a Bullish Crossover as the MACD Line (Blue) crossed above its Signal Line (Orange) while both of them were below the zero line. Therefore, this has bullish implications. The 50-period is above the 200-period moving average, which is also a bullish indication. Last Friday, the last three candlesticks closed above the 50-period moving average. Therefore, starting Monday, if the price keeps moving upwards, the first resistance area, R1, will be an Inside resistance around 19315. This is a key level of resistance in the GER30 market as it coexists with the 61.8% Fibonacci retracement, the FVP (Fair Value Price) that was created last Tuesday and the Order Block, which is right above the resistance. If the price penetrates the R1 and keeps moving upwards, the next resistance area, R2, will be the ATH price at 19489. In case the price surpasses the ATH and keeps moving upwards, then the next resistance area, R3, will be at 19600.
Conversely, if the price is rejected and moves downwards, the first support area, S1, will be around 18960, the previous week’s low. If the price penetrates S1 and keeps moving lower, the next support area, S2, will be at 18686, an older weekly low level.
.png)