Last week, the markets’ volatility was much lower compared with the previous trading weeks. That was expected, as we explained in the previous Market Outlook, because this is what usually happens during the last week of each calendar month. Nevertheless, the Kiwi (short for New Zealand Dollar) was the strongest currency across the board among the other two commodity currencies, the Australian Dollar and the Canadian dollar. The Euro, though, was marked as the weakest currency based on the price moves that occurred on the cross-currency pairs. The drop in the CPI (Consumer Price Index) number in Germany caused that. The Australian dollar was holding strong, especially against the Euro, as the CPI number in Australia beat expectations and was reported at 3.5%.
Moving into this week's significant events, we will see directional moves in many currency pairs, indices, and commodities due to the significance of the news and how it impacts the markets.
Starting Monday, in China, the Caixin Manufacturing PMI is expected to increase from 49.8 to 50. This can cause the Chinese Yuan to increase. Due to liquidity purposes and high speeds, it is not a currency we usually trade, especially on a day trading basis. The market will anticipate the London opening for the currency pairs to become more active. In Switzerland, the Retail Sales will be reported, and the consensus estimates an increase from -2.2% to -0.2%. This can result in an appreciation of the Swiss Frank. The last important event for Monday will be the final manufacturing PMI in the UK, which is expected to remain around 52.5 based on the forecast numbers. Generally, Mondays are usually short days for significant news. The banks will be closed in the US and Canada all day in observance of Labor Day. The liquidity and the volatility during the New York trading session are likely to be very low, and the spreads may increase. Hence, traders who do day trading need to be aware of the market’s conditions.
The markets are expected to be trading under normal volatility during the Asian trading session on Tuesday because there won’t be any significant news events. During the European Trading session and 30 minutes before London opens, in Switzerland, they will report the CPI (Consumer Price Index). The yearly CPI, which is considered to be the most significant compared to the monthly CPI, is expected to remain at 1.3%. Although the monthly CPI is expected to increase from -.0.2% to 0.1%, and this can be considered a bullish sign for the Swiss Frank, Less than an hour later, the GDP (Gross Domestic Products) in Switzerland will be reported, and the consensus estimates an increase from 0.65 to 1.5%. Currency pairs like the GBPCHF and the EURCHF, whose major trend is a downtrend, can be considered a high probability for selling short trading set-ups if the Swissy gain more strength after the reports and, at the same time, if the market follows through. With the New York trading session starting, the volatility is expected to rise, as in the US, they will report the ISM Manufacturing PMI. The forecast estimates the number to be below the benchmark of 50, around 47.8.
Next, Wednesday is expected to be a highly volatile day as some of the news events that will be reported throughout the day are significant enough to change market trends and market structure. In the early morning, during the Asian Trading Session, Australia will report its GDP (Gross Domestic Product). The forecast estimates an increase from 0.1% to 0.2%. If the reported number confirms the forecast and if the market follows through at the same time, it's possible to see strength in the Aussie and a potential weakness in minor pairs like the EURAUD and the GBPAUD. The next important event will be the Services PMI and the Composite PMI, both in the UK. As per the forecast, both PMIs are expected to remain above the benchmark 50, which can be considered bullish for Sterling. The following significant event will be the PPI (Producer Price Index) in the Eurozone. The consensus shows a drop from 0.5% to 0.3%. This can be considered a bearish sign for the Euro and can cause more weakness to the Euro currency. Moving into the New York trading session, they will report the Trade Balance in the US. The consensus estimates a decrease from -73.1B to -74B. It can be a bearish sign for the US Dollar. All the attention will be on the Bank of Canada as they will report Canada’s Interest Rates. The forecast shows a drop from 4.5% to 4.25%. This is expected, as we mention pretty much in each market’s outlook when there is an Interest Rate vote by a major Central Bank. We expected all major banks to drop interest rates in the next few months. Some of them already did, and some are yet to do it. If the reported outcome confirms the forecast and the Canadian dollar follows through, we expect weakness in the Canadian dollar. Considering the promising strength of the Aussie and the Swissy and if the Kiwi remain a strong currency by then, trading opportunities like AUDCAD long, NZDCAD long and CADCHF short can be optimal. Traders must always keep in mind that the highest probability scenario is when the macroeconomic outcome and the technical analysis on the price charts confirm each other. All trades must be taken with proper risk management, as any outcome is possible.
On Thursday, the volatility is expected to rise during the Asian trading session as the first significant event will be the Trade Balance report in Australia. The consensus estimates a drop from 5.59B to 4.61 B. After this, there will be a speech by the Reserve Bank of Australia’s Governor Bullock. As Australia didn’t drop its interest rates last month, it will be interesting to know how the RBA sees the future of Australia’s economy and how it will proceed with the next interest Rate decision. Usually, during his speech, he is a conservative, but we can extract some information about whether the RBA has the interest rates drop under their scope. Moving into the European and London trading sessions, the Unemployment Rate in Switzerland is expected to be reported, and the consensus estimates an unchanged rate of 2.5%. The next important event will be the Construction PMI in the UK.
The forecast estimates a drop from 55.3 to 54./6. This can be considered a bearish sign for Sterling, but it is not an event that usually causes markets to change major trends. The volatility is expected to rise during the New York trading session as the ADP Employment Change will be reported. This event gives traders and market participants a heads-up about what the NFP report might be like on the upcoming Friday. As per the forecast, the ADP is estimated to increase from 122K to 136K. Based on this estimation, they’ve employed more people in the US, and this can be considered a positive outcome for the US dollar. Despite the volatility increasing during this report, the market direction will be determined after the NFP report the next day. The last significant event for the day will be the ISM Services in the US, with the forecast estimated to be a remaining number above 50, which can be considered a positive outcome for Greenback.
This Friday is considered the most significant trading day of the month as traders and market participants around the world expect the NFP report during the New York Trading Session. Traders need to be aware of the low volatility expected during the first two major trading sessions, the Asian and the London. During the Asian trading session, there won't be any significant news, which they expect will increase the volatility in the markets. Moving into London’s trading session, the GDP (Gross Domestic Product) in the Eurozone will be reported, and the forecast shows an unchanged number of 0.3%. This usually is not considered something that can improve the currency’s performance. Therefore, we won’t expect an unchanged number in the GDP to be the major factor in the euro’s appreciation. Moving into New York’s trading session, the Unemployment Rate in Canada will be reported, and the consensus estimates an increase in the Unemployment Rate from 6.4% to 6.5% if the actual reported number confirms the forecast and at the same time If the market follows through, there is a high chance for a weak Canadian dollar. If the Loonie (short for the Canadian Dollar) weakens due to Interest rates dropping in Canada ) then the Canadian Dollar can be in the scope for potential sell opportunities, but only if the technical analysis and price charts form with signals as per each trader’s trading plans. At the same time, the markets will be anticipating more of the NFP in the US as the consensus estimates an increase from 114K to 164K. This can be considered a significant bullish sign for the US dollar because this forecast reveals that more people got employed in the US (excluding Farming jobs) compared to the month before. At the same time, the Unemployment Rate in the US is expected to improve from 4.3% to drop to 4.2%, and the Average Weekly Earnings to increase from 0.2% to 0.3%. These three events will be reported at the same time, and if they are reported positively and if, at the same time, the market follows through, the US Dollar is expected to become a strong currency across the board. Traders can maybe seize some good trading opportunities, as we have already explained.
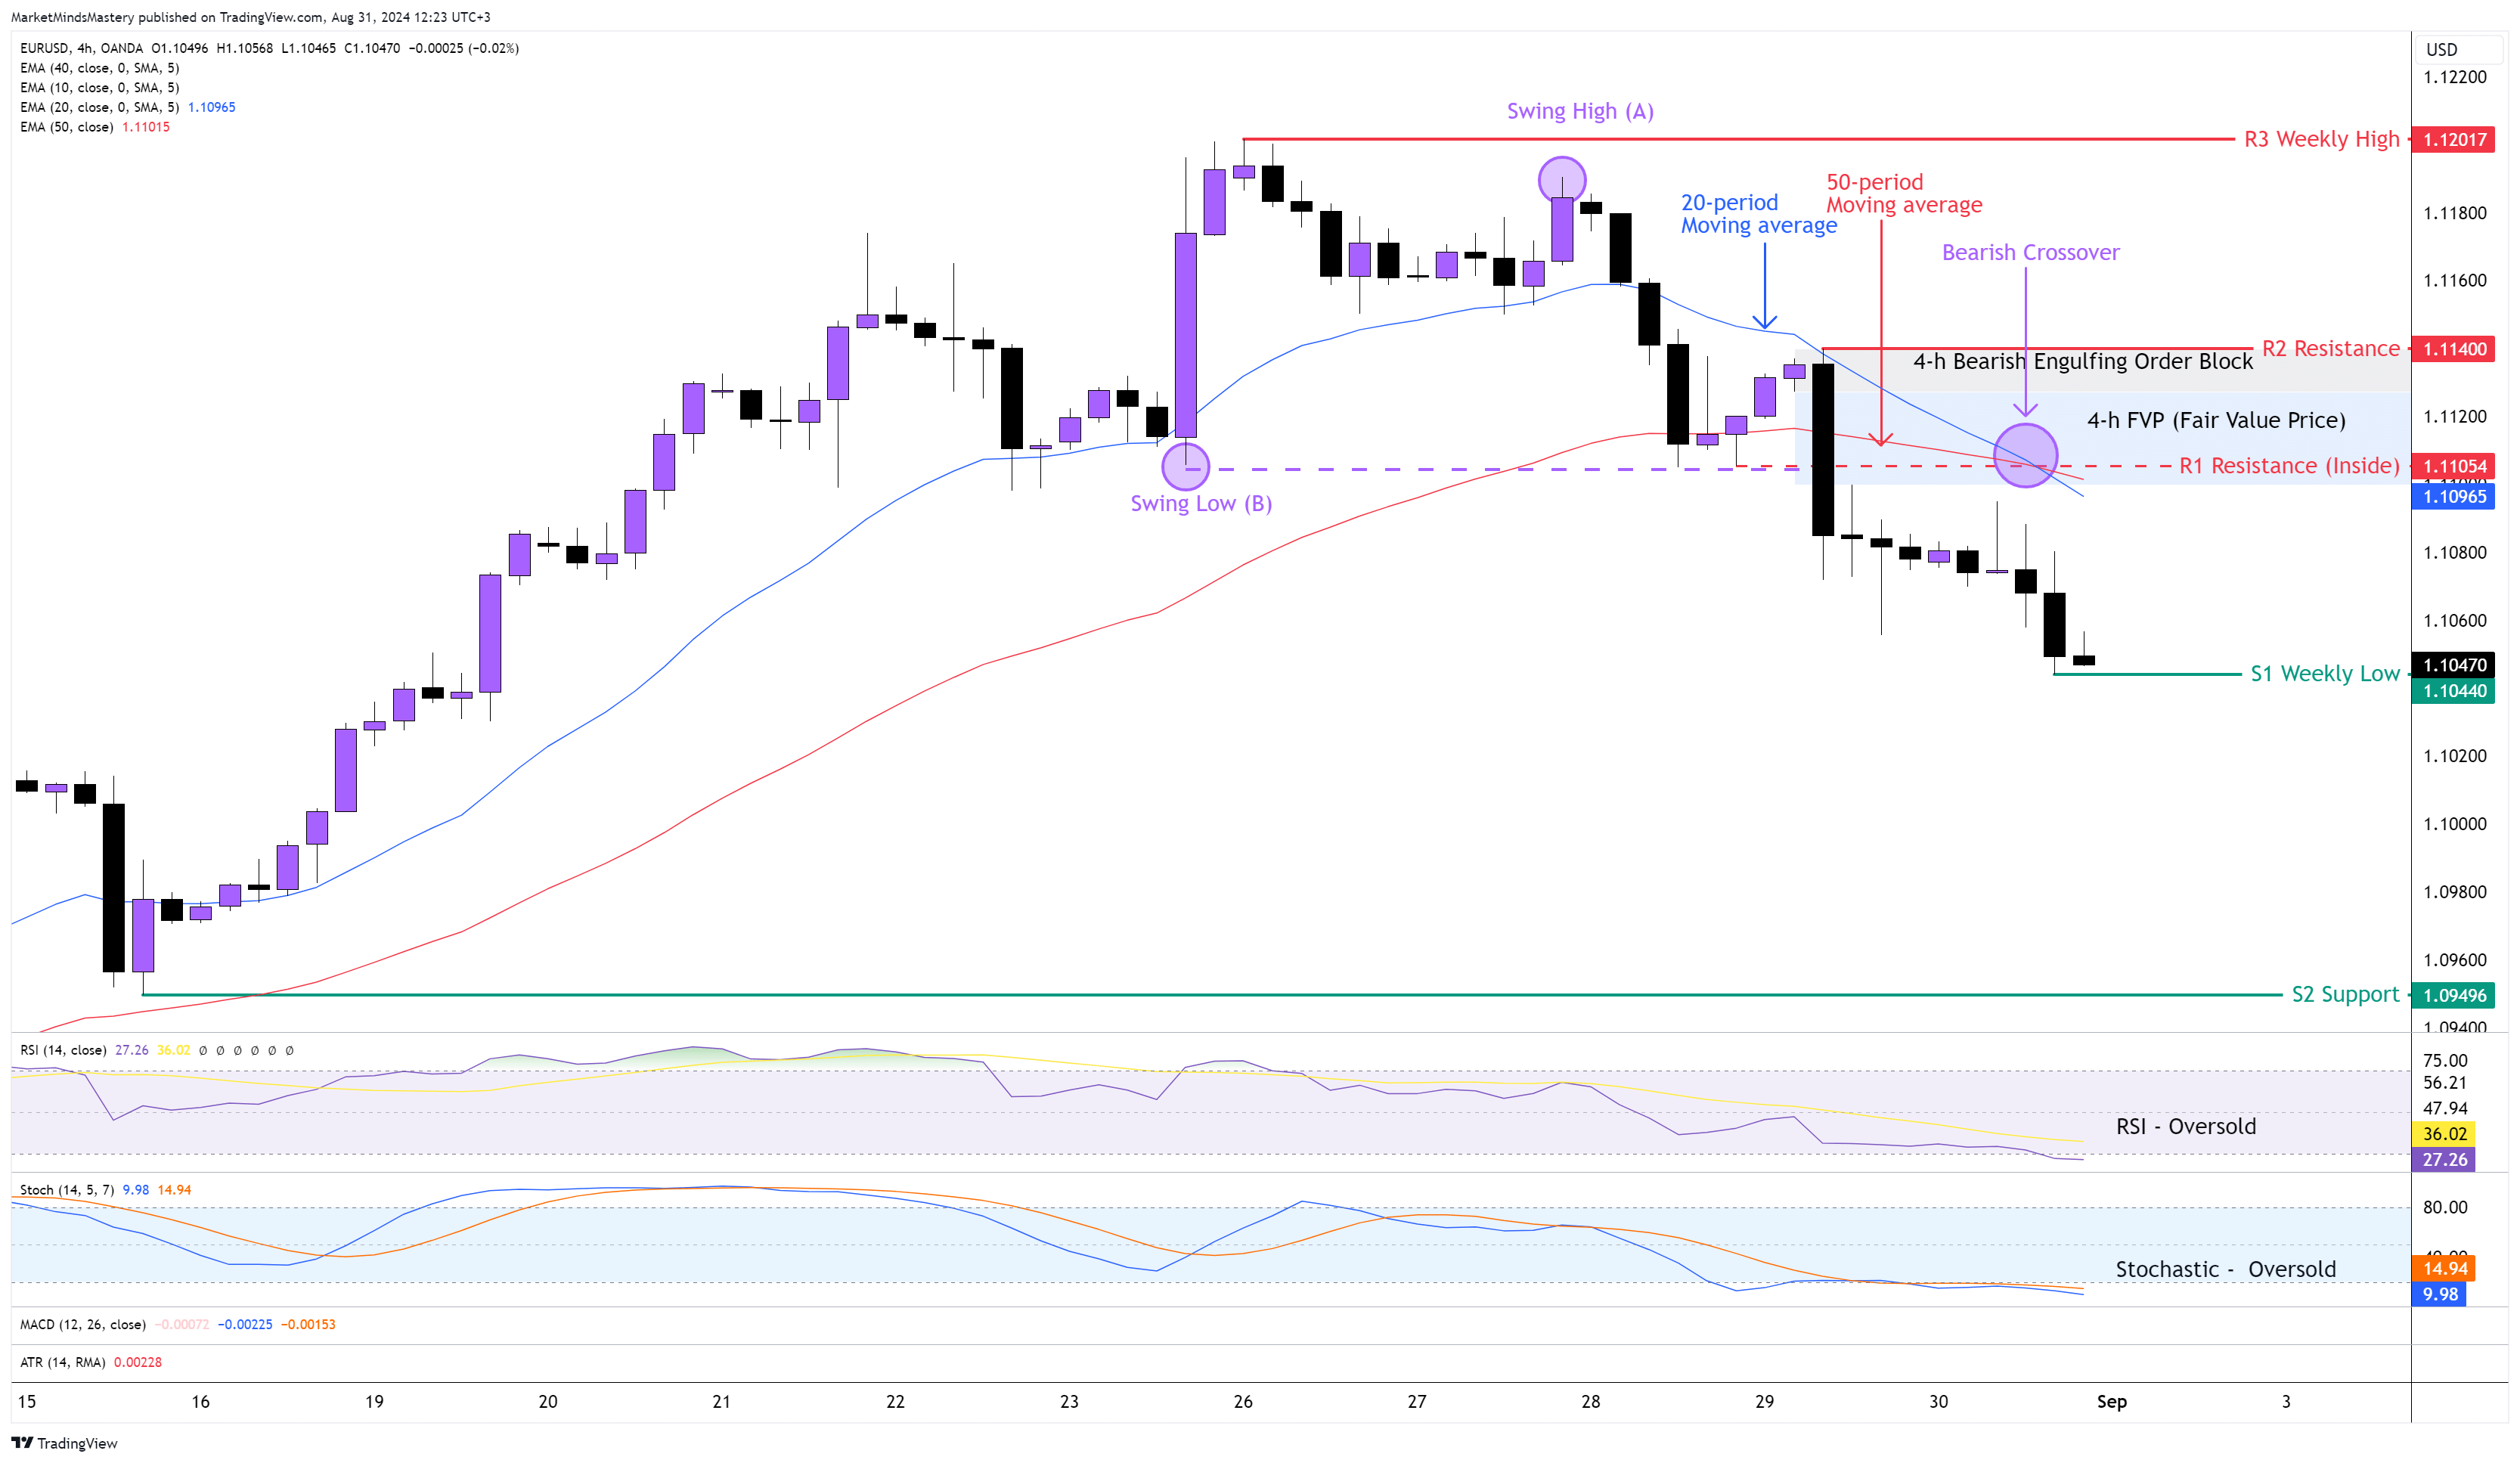
EUR USD 4H

The Euro was generally one of the weakest currencies across the board last week. The weekly chart’s candlestick ended as a Bearish candle. On the 4-hour chart, following the previous week’s Negative Divergence A’ Class between RSI and price, the price entered into a corrective phase. After it created a Failure Swing High at point A, the price moved downwards, and it penetrated the swing low at point B (which caused the upward move last week), and then a downtrend started. Last Friday, the 20-period moving average crossed below the 50-period, which is known as a Bearish Crossover. The RSI is in an Oversold condition, indicating a downtrend. The Stochastic Oscillator is below its lower line of 20, and this has bearish implications. Starting Monday, if the price keeps moving downwards, the first support area, S1, will be the previous week’s low, around 1.10470. If the price penetrates the S1 and keeps lowering, the next support area, S2, will be around 1.090496. If the price penetrates the S2 support and declines further, the next support area, S3, will be around 1.08814, which is an older weekly low.
Conversely, if the price bounces off and moves upward, the first resistance area, R1, will be the Inside Resistance around 1.11054. This price level consists of the static resistance R1, the FVP (Fair Value Price) and the 50-period moving average. In case the price penetrates the R1 and keeps moving upwards, the next resistance area, R2, will be around 1.11400. If the price surpasses the R2 and keeps moving upwards, the next resistance area, R3, will be the previous week’s high, around 1.12017.
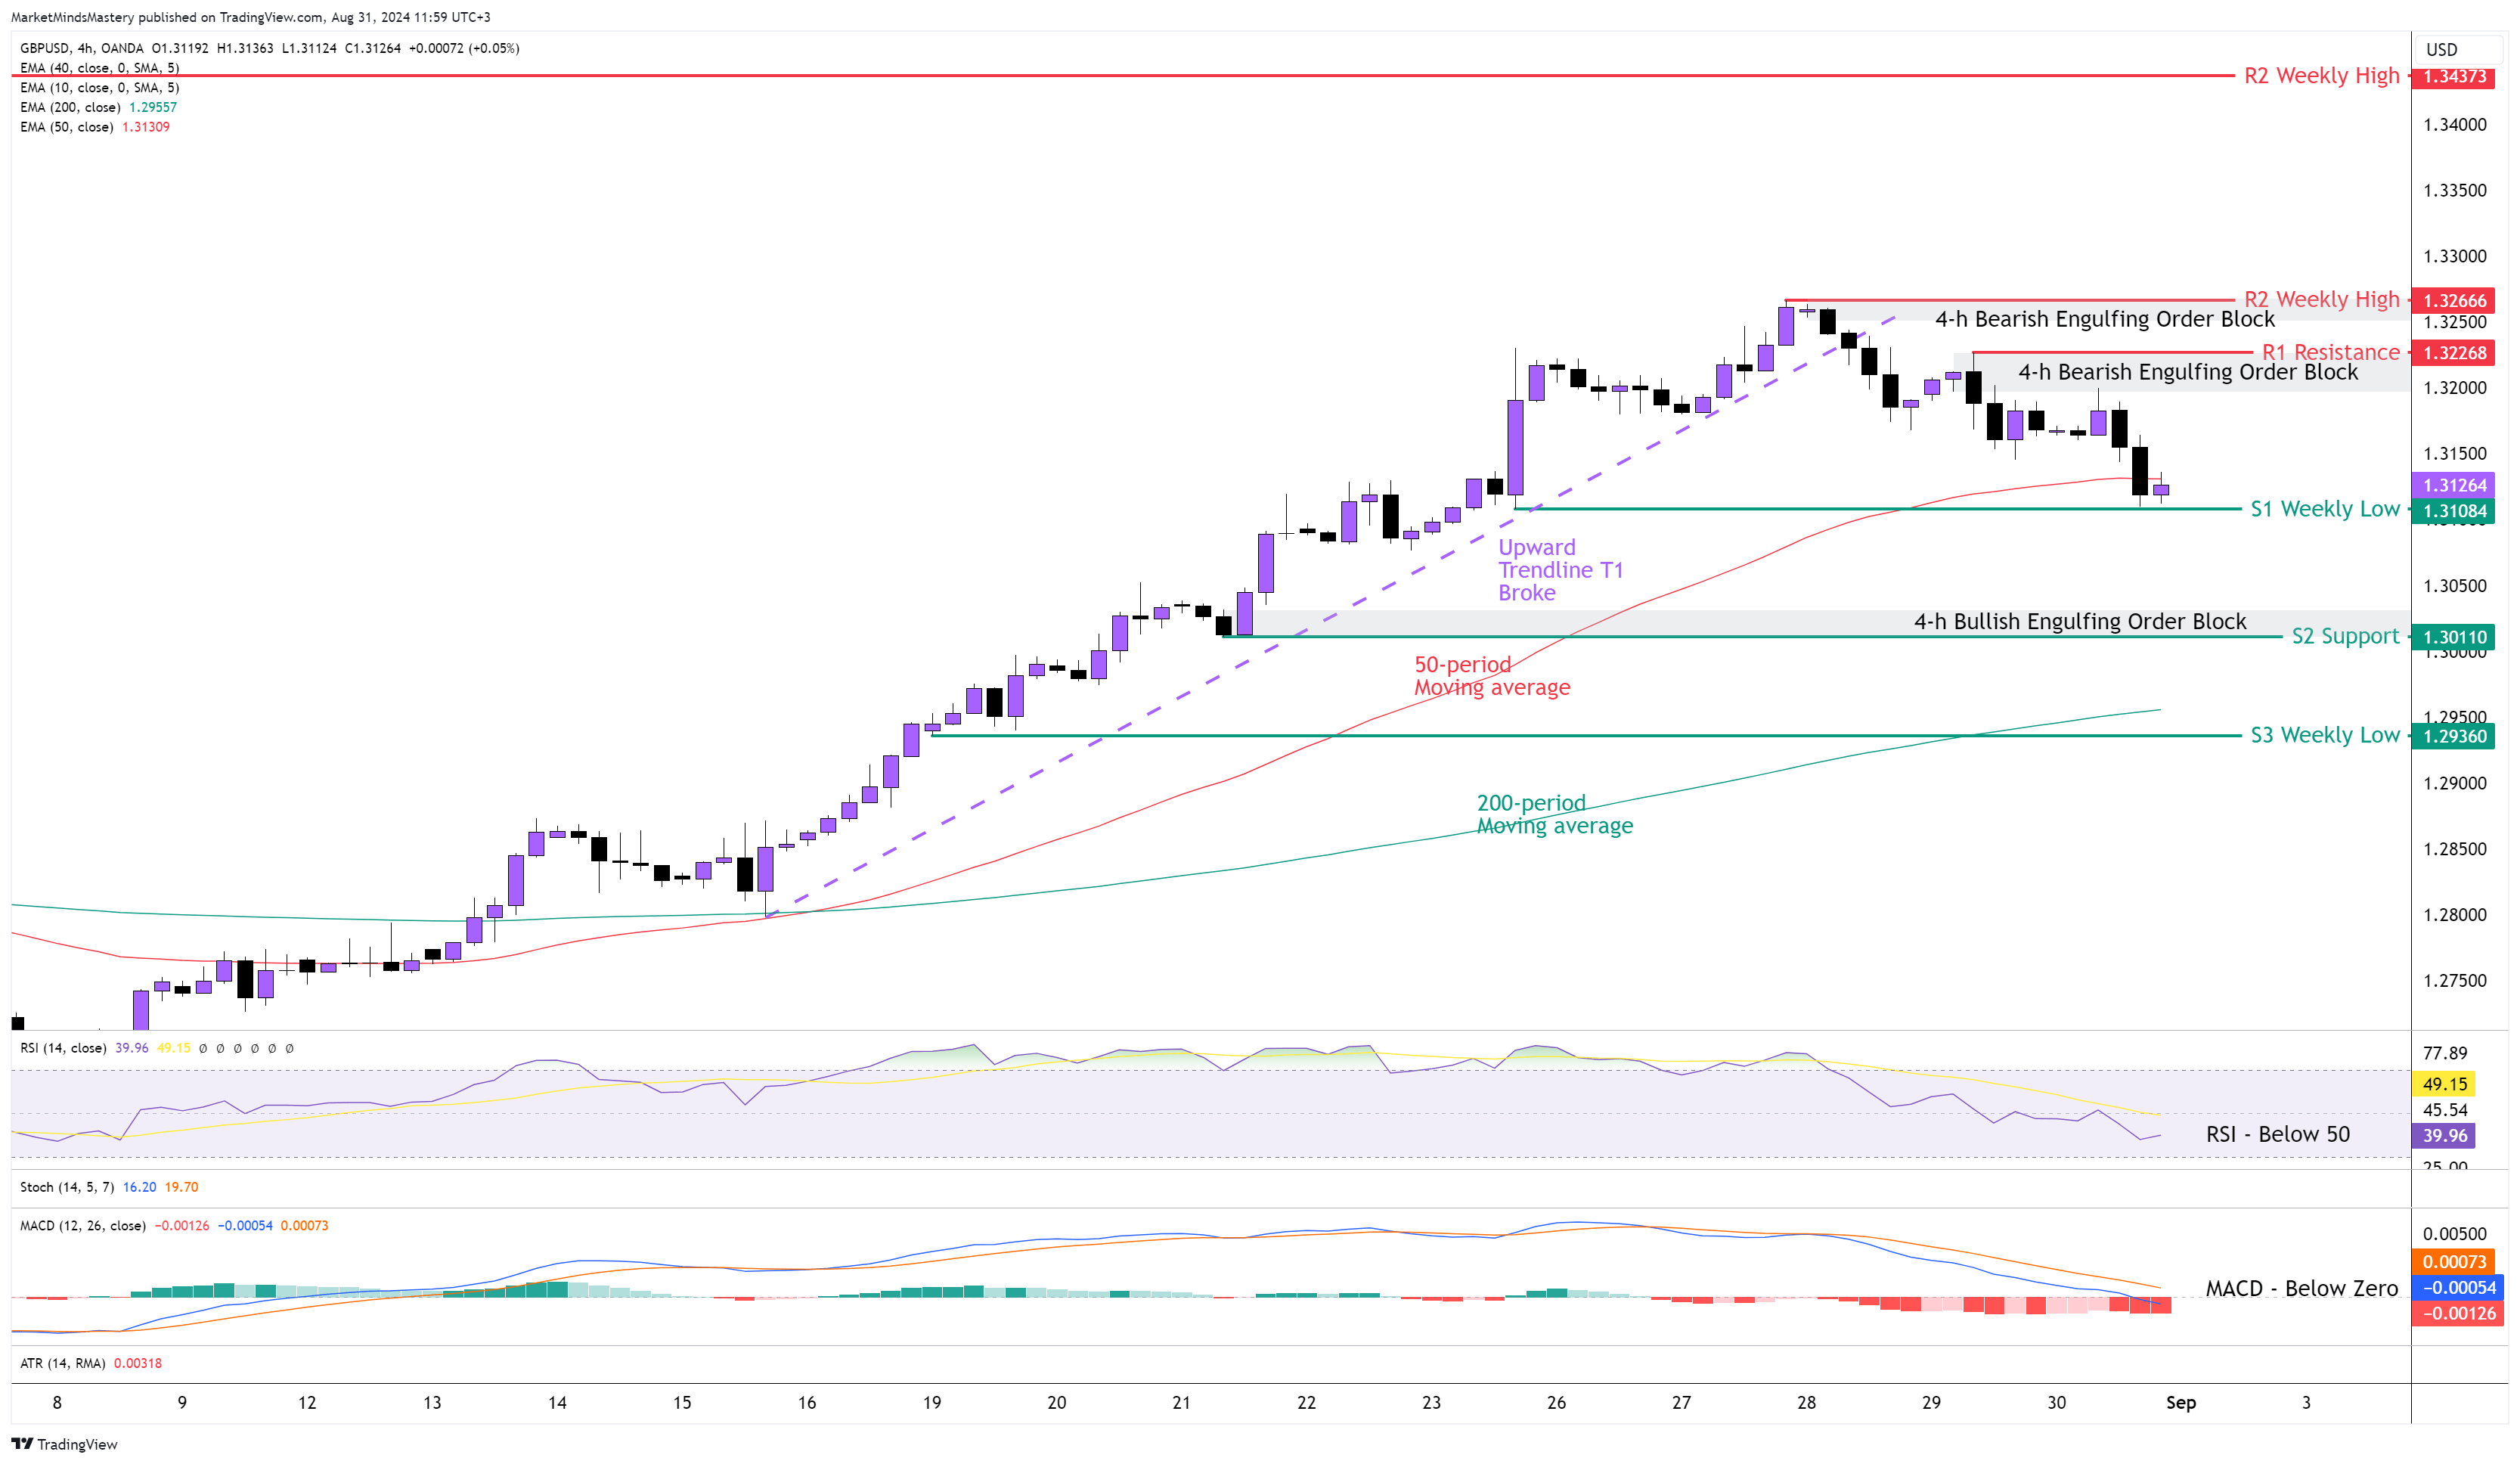
GBP USD 4H
Following the previous week’s Market Outlook, the price of the GBPUSD made a new high on Tuesday, signalling the highest price level of the week. The weekly chart’s candlestick ended as a Bearish candle with a small body size compared to the Bullish Marubozu candle preceding it. This usually leads to a bearish move rather than a bullish one. On the 4-hout chart, based on the swing analysis and the market structure analysis, the price penetrated the upward trendline T1 and signalled the end of that uptrend. Since last Wednesday, the price has gradually started making lower highs and lower lows under low volatility, as we can see on the chart above if we look at the candlesticks sizes. The 50-period moving average is above the 200-period and this is bullish. Last Wednesday, the price created a Bearish Engulfing Order Block around 1.32500 and the next day, on Thursday, a Bearish Engulfing Order Block around 1.32000. Currently, Friday’s Candlestick’s closing price is below the 50-period moving average. Starting Monday, if the price moves downwards, the first support area, S1, will be 1.31084, which is the lowest price of the previous week. If the price penetrates the S1 and keeps lowering, the next support area, S2, will be around 1.30110. On the other hand, if the price bounces off and moves upwards, the first resistance area, R1, will be around 1.32268. If the price penetrates the R1 and keeps increasing, the next resistance area, R2, will be approximately 1.32666, which is the previous week’s high.
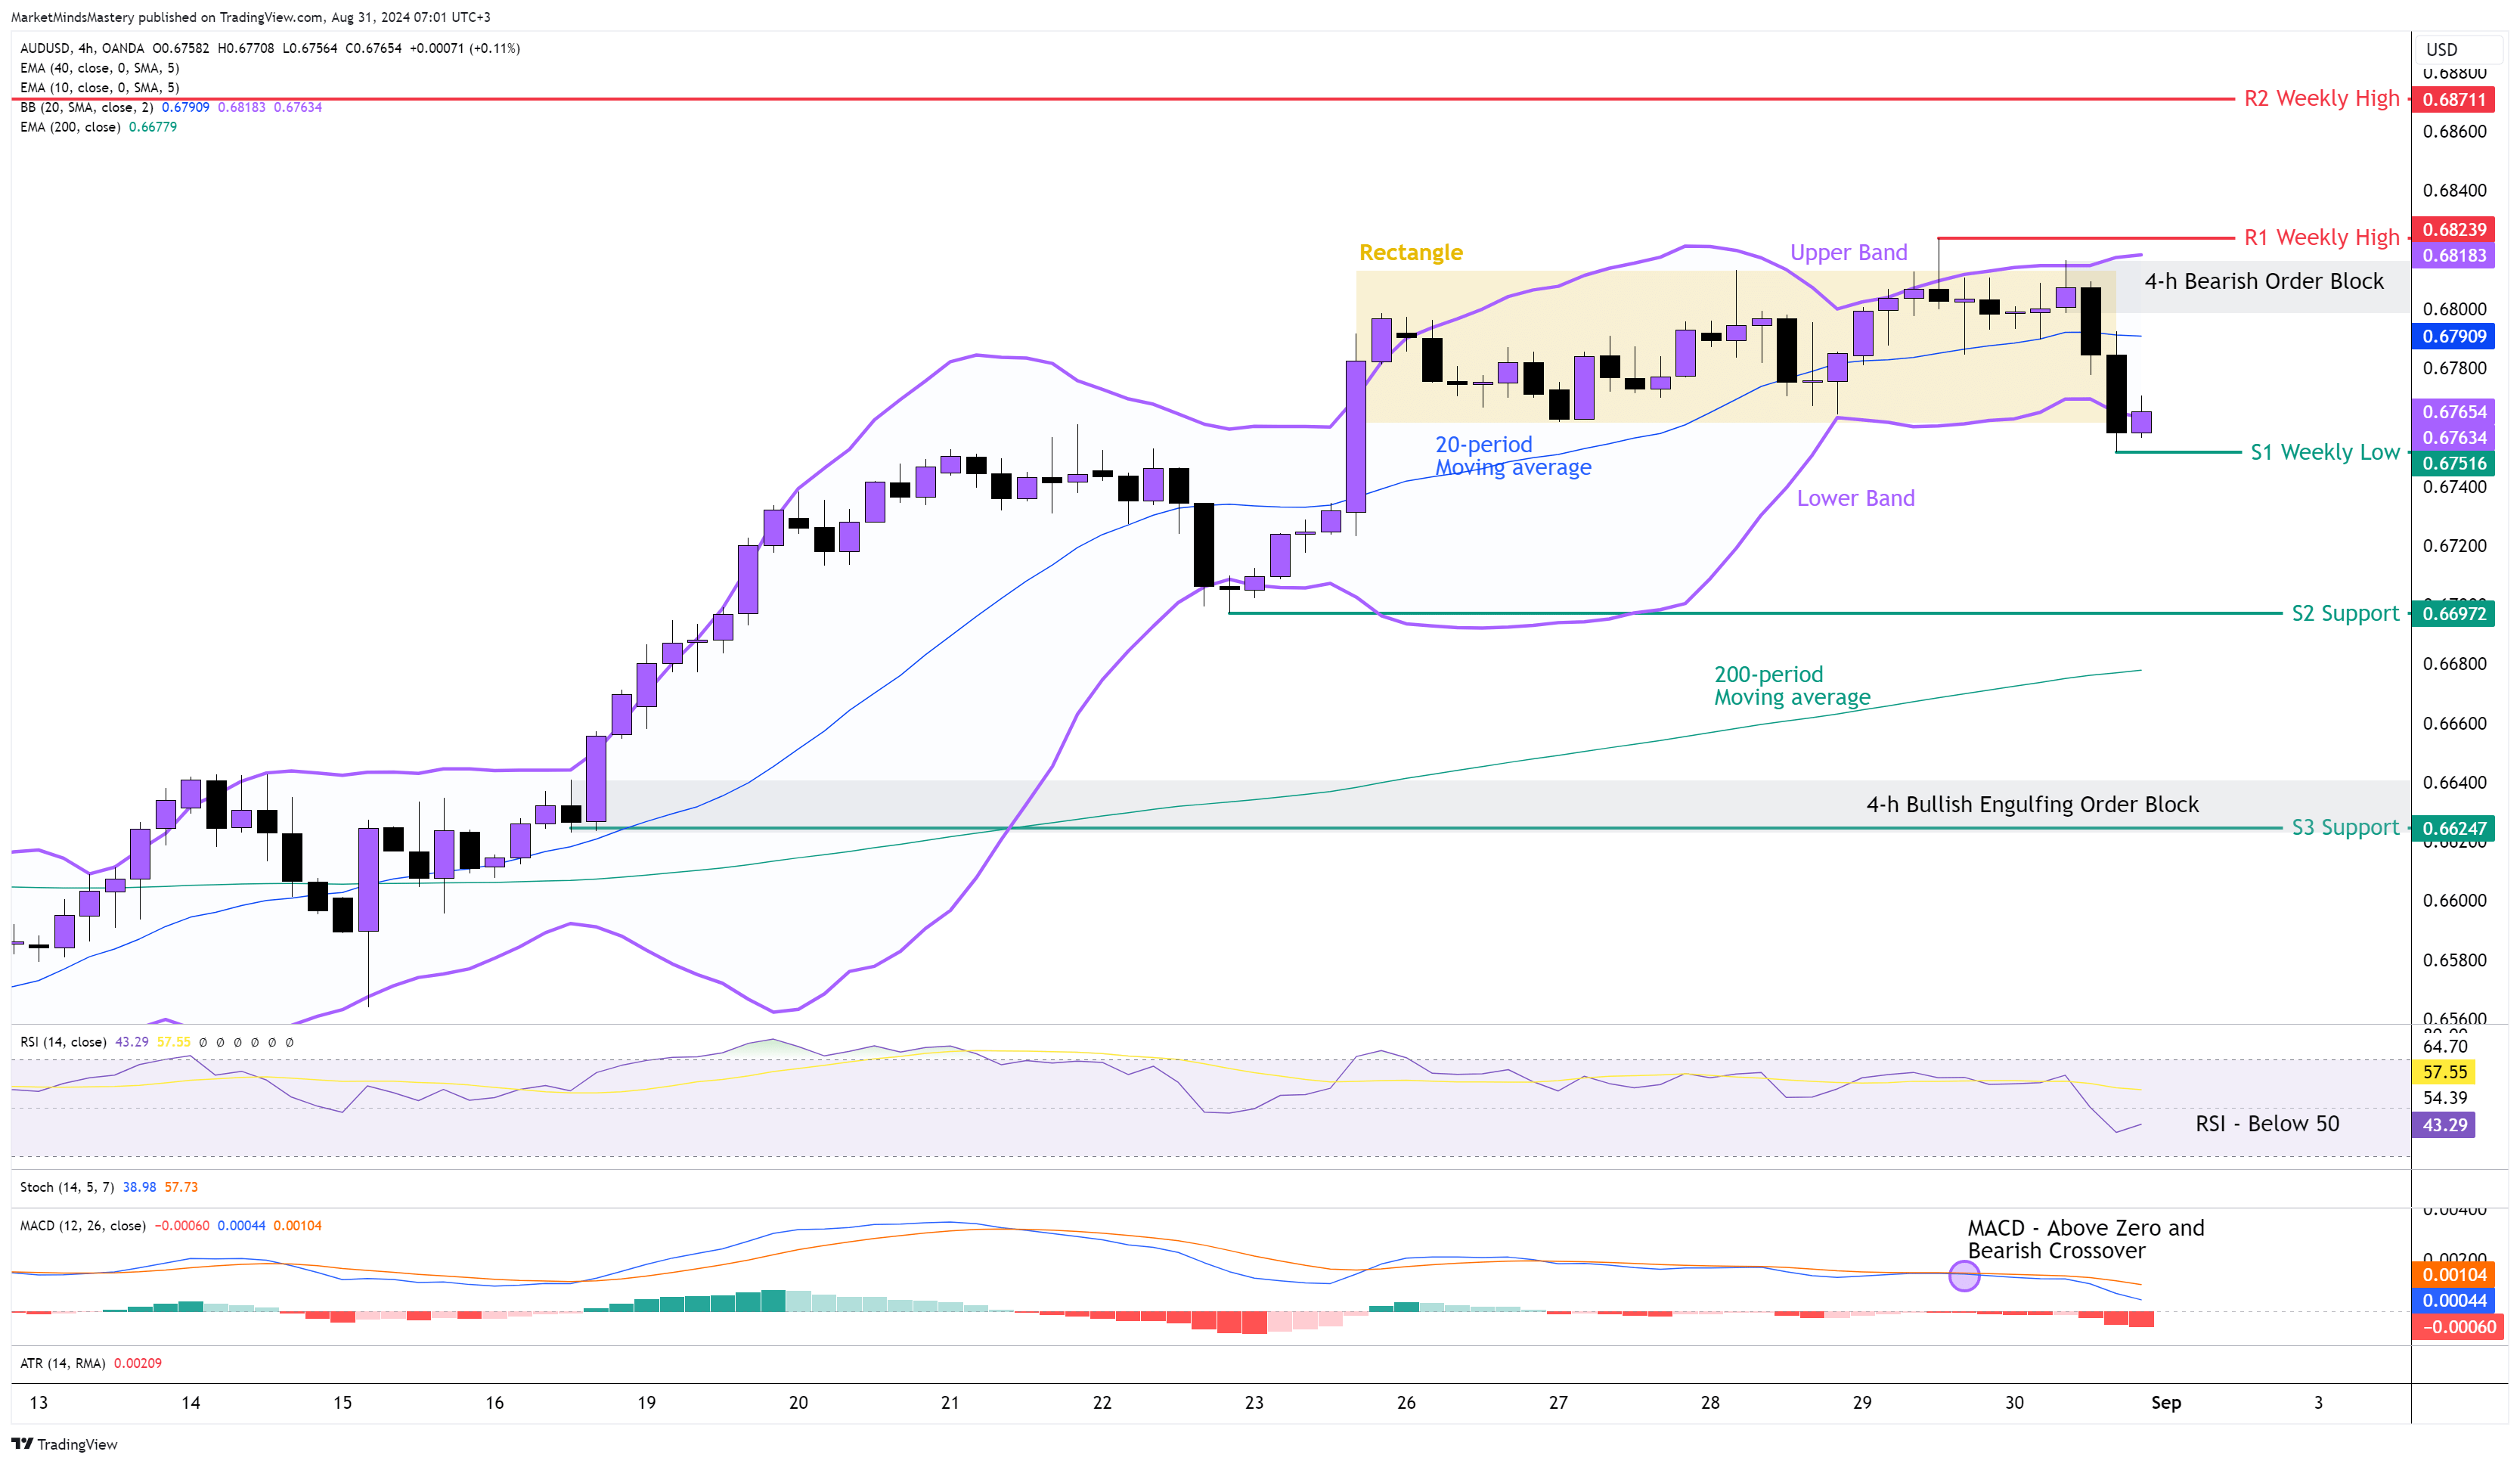
AUD USD 4H
Last week, the price of the AUDUSD currency pair moved to approximately 70 pips. Based on the ATR (Average True Range), the currency usually moves around 130 pips. The candle of the weekly chart ended up being a Spinning Top candlestick. This is a sign of market weakness, and because the price didn't penetrate the recent weekly resistance, this can end up being a Double Top reversal pattern. On the 4-hour chart, during the last five trading days, the price created a top Rectangle, as shown on the chart. The price rejected the Upper Band of the Bollinger Band Indicator, and last Friday, it closed below the Lower Band, creating a Bearish Order Block. Currently, the price is below the 20-period moving average and, at the same time, is above the long-term 200-period moving average. The RSI Oscillator is below the middle line of 50, and this has bearish implications. The MACD is above its Zero line, and it created a Bearish Crossover following the price decline. Starting Monday, if the price moves downwards, the first support, S1, will be the previous week’s low at around 0.67516. If the price penetrates the S1 and keeps lowering, the next support, S2, will be 0.66972. In case the price penetrates the S2 and keeps moving downwards, it will end the existing uptrend, and the next support area S3, will be approximately 0.66247. On the other hand, if the price moves upwards, the first resistance area, R1, is around 0.68239, and it is the previous week’s high. If the price surpasses the R1 and keeps increasing, the next resistance, R2, is around 0.68711, which is an older weekly high level.
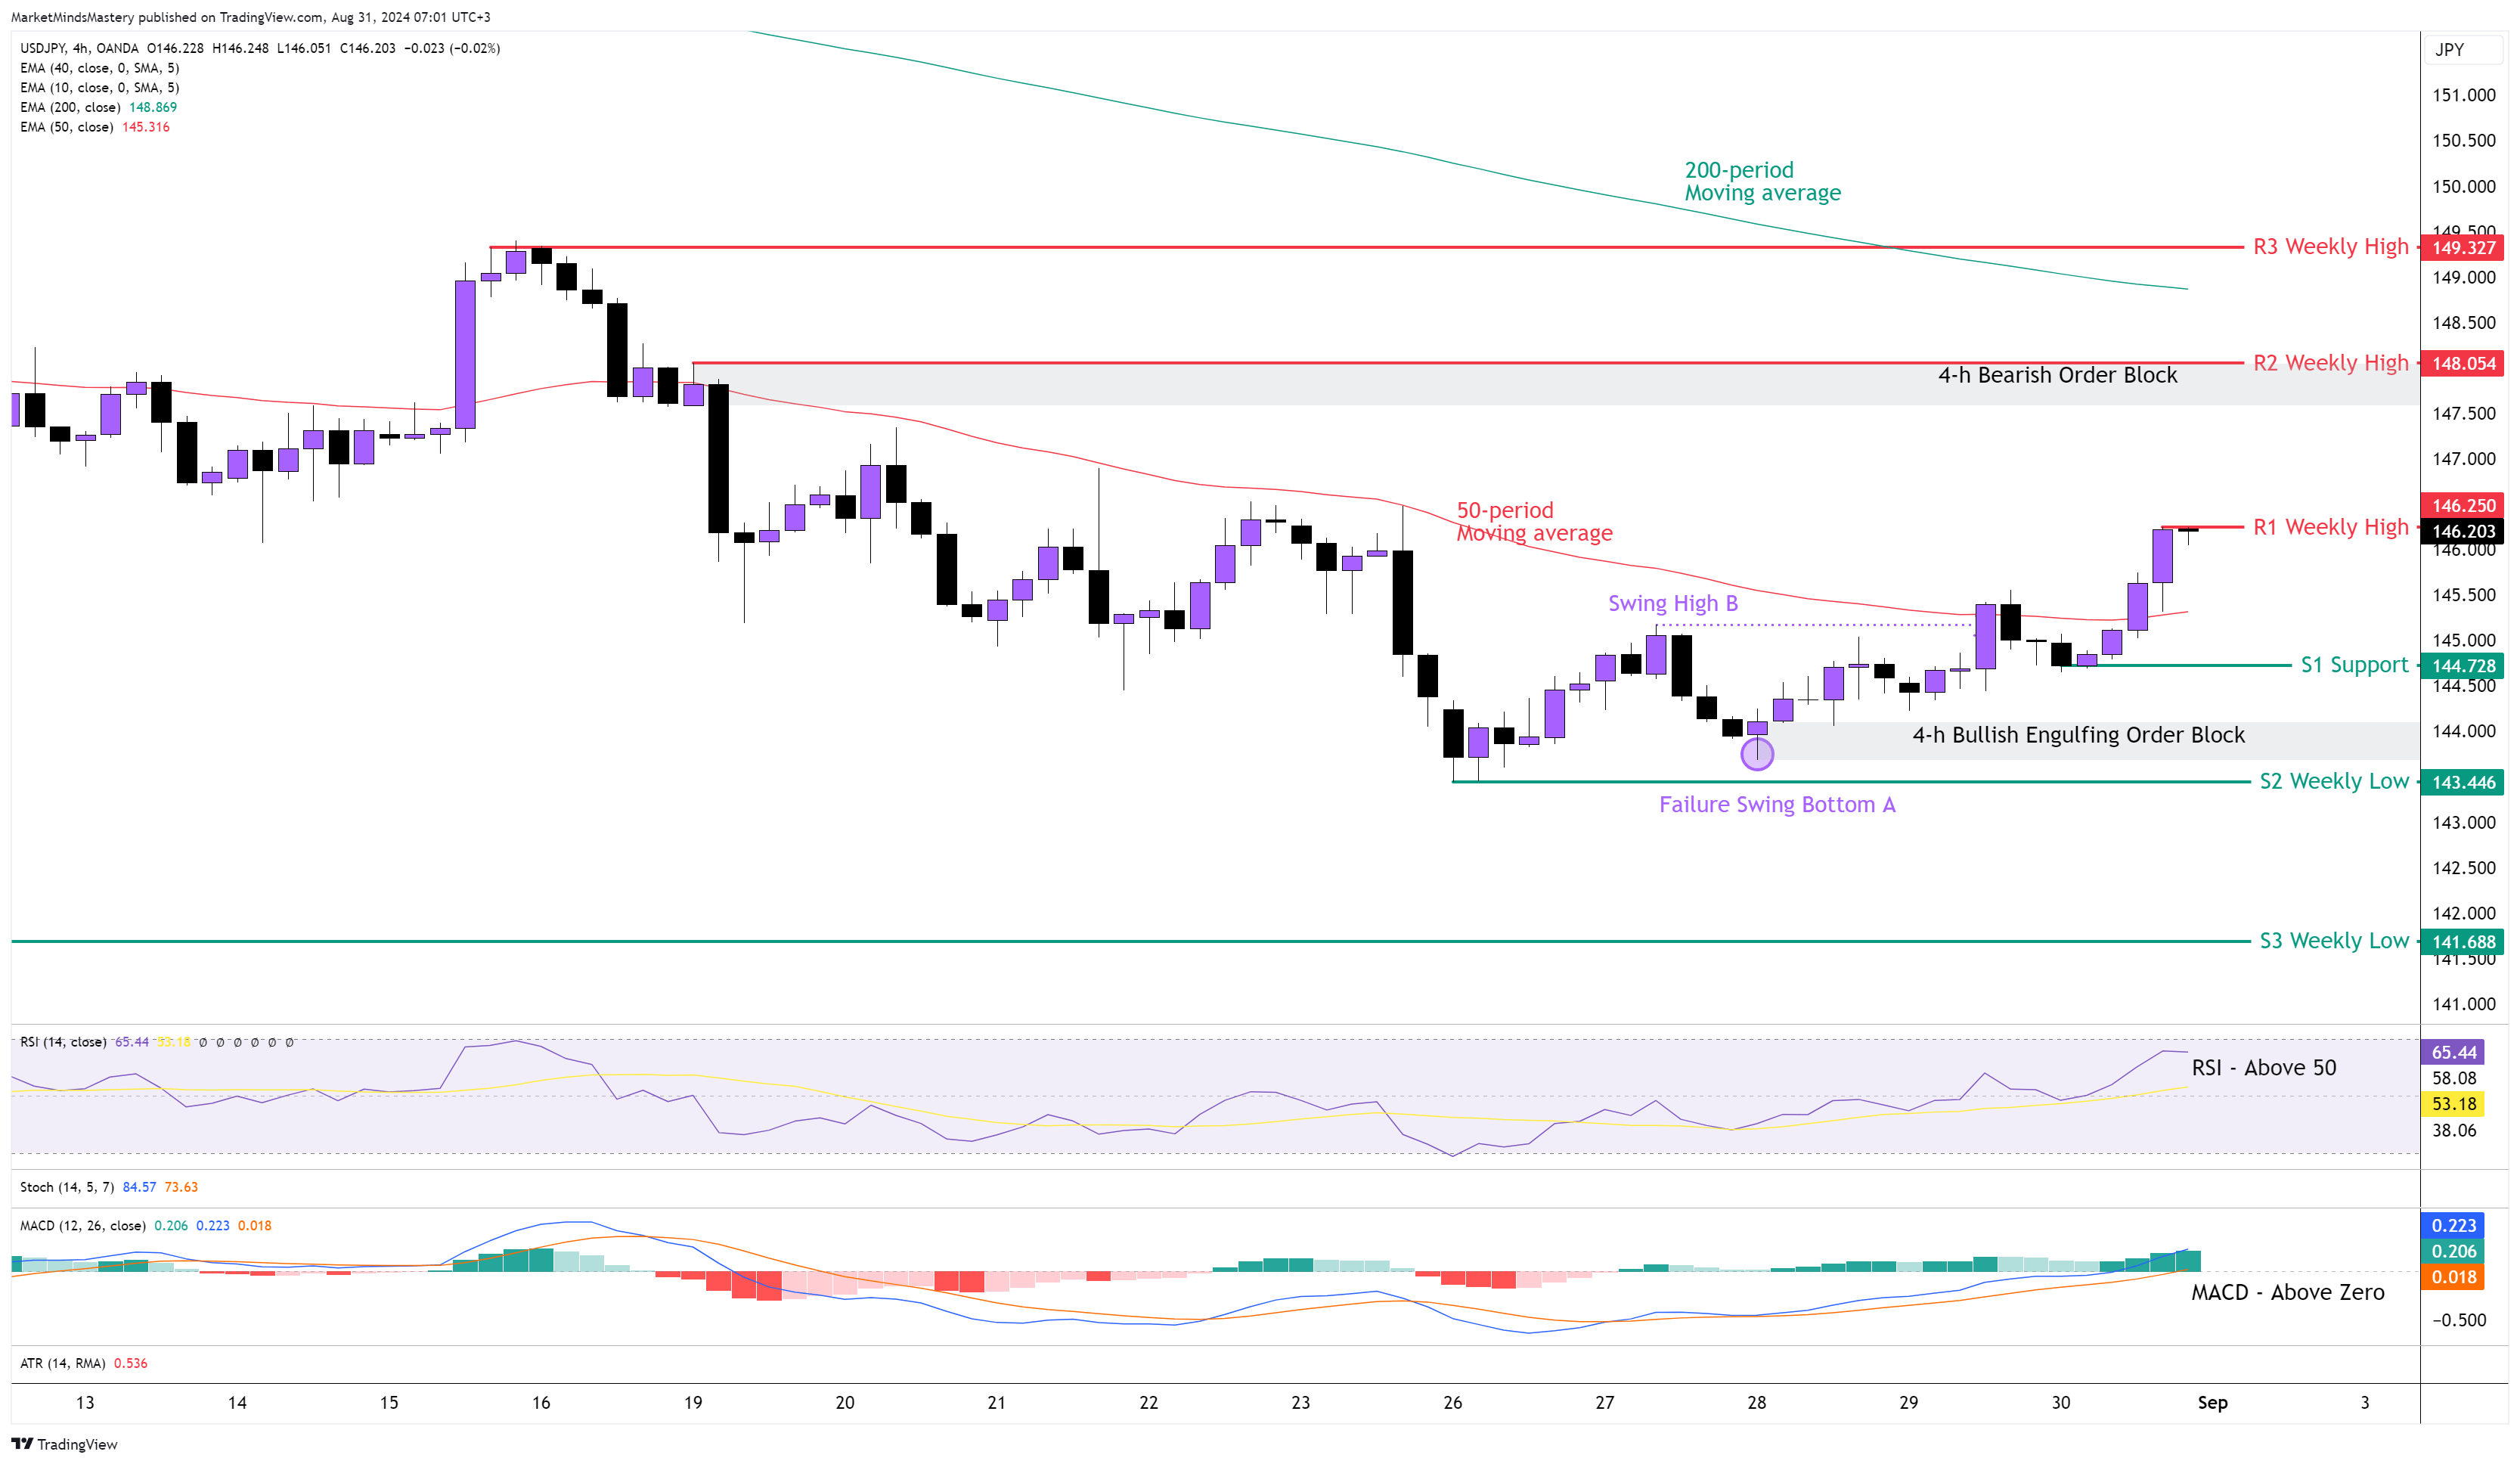
USD JPY 4H
Due to the small range of price moves last week of the USDJPY pair, the price didn't create any significant directional move. The weekly price action ended as a Piercing Pattern, which generally has Bullish implications. The failure of the Swing Bottom at A, followed by the penetration of the swing high at point B, caused a change in the market structure on the 4-hour chart. The price is above the 50-period moving average, and this has bullish implications. The RSI Oscillator is around 65, and it has Bullish implications. The MACD, though, is rising and has moved above its middle line, which has bullish implications. The 200-period moving average is far away from the current price. Last week, the price created a Bullish Engulfing Order Block around 144. If the price continues moving upwards, the first resistance area will be the previous week’s high, around 146.25. If the price penetrates the R1 and keeps moving upwards, the next resistance area, R2, will be approximately 148.054. We pointed out the same price level last week, and it remains the same price level simply because the price didn't move in a defined direction last week. Oppositely, if the price declines and moves downwards, the first support area, S1, will be around 144.72. In case the price penetrates the S1 and moves lower, the next support area, S2, will be the previous week’s low, approximately 143.44. A further downward move finds the next support area, S3, around 141.688.
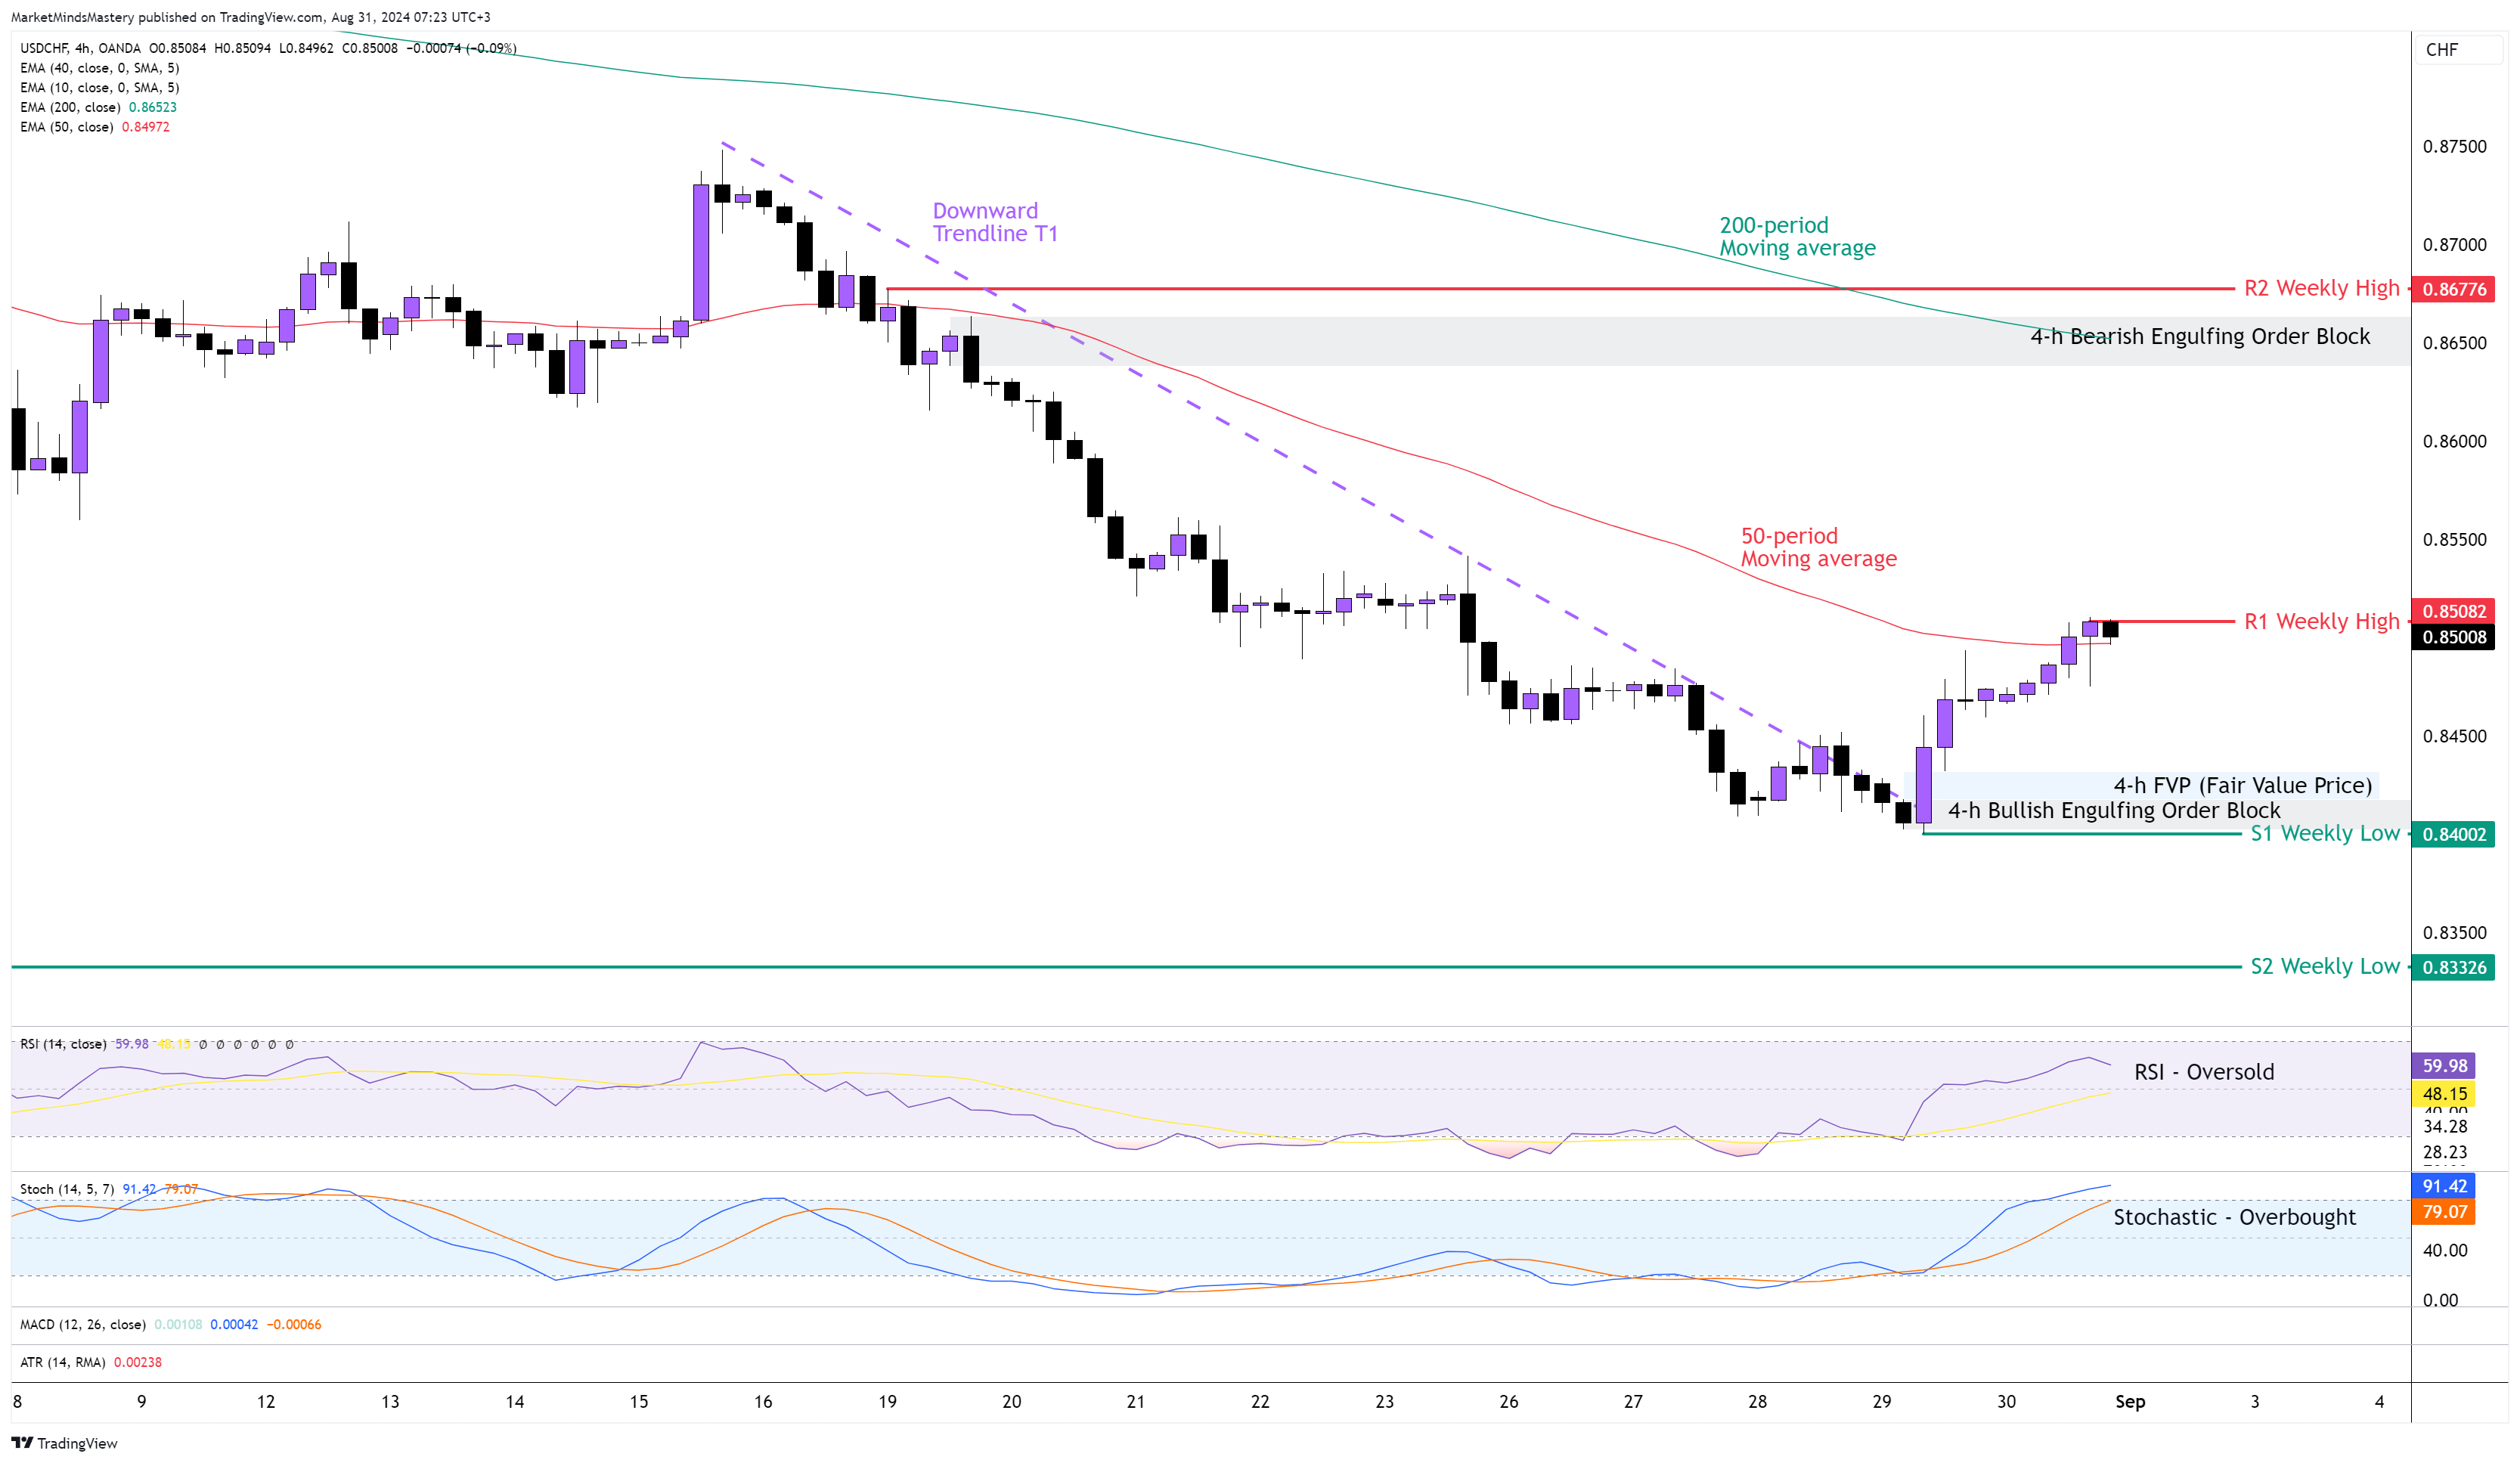
USD CHF 4H
Following the previous week’s Market Outlook, the price on the weekly chart False Brokeout the weekly levels of support, those we pointed to the previous week’s Market Outlook chart. Hence, the price ended up creating a Bullish Hammer. As the Bearish Marubozu proceeded by this bullish hammer the market now has bullish implications. On the 4-hour chart, the recent upward move caused by the Bullish Divergences we saw on the MACD last week caused the price to enter first a retracement phase, and afterwards, the price changed its structure after it broke above the Downward Trendline T1. Although the price didn’t create a new higher high and higher low formation, the break of the T1 Trendline signals the end of the downtrend. The 50-period is below the 200-period moving average, and this is bearish. The RSI is above 50, and this has bullish implications. The Stochastic Oscillator is in an Overbought condition, which is also bullish. The price created a Bullish Engulfing Order Block last week, around 0.8400. In the same area, the price also left an FVP (Fair Value Price). The price current is above the 50-period moving average, and if it remains above and simultaneously if the price moves upwards, the first resistance area, R1, will be the previous week’s high, around 0.85082. If the weekly price action causes the price to break above the previous week's high, the next resistance area, R2, will be around 0.86776. This price level coexists with the 200-period moving average, which can become a dynamic resistance in the market and a 4-hour Bearish Engulfing Order Block.
On the other hand, if the price declines and moves downwards, the first support area, S1, will be the previous week’s low of approximately 0.8400. If the price decreases further, the S1 support will be penetrated, and the next support area, S2, will be around 0.8332, which is an older weekly low level.
GBP JPY 4H
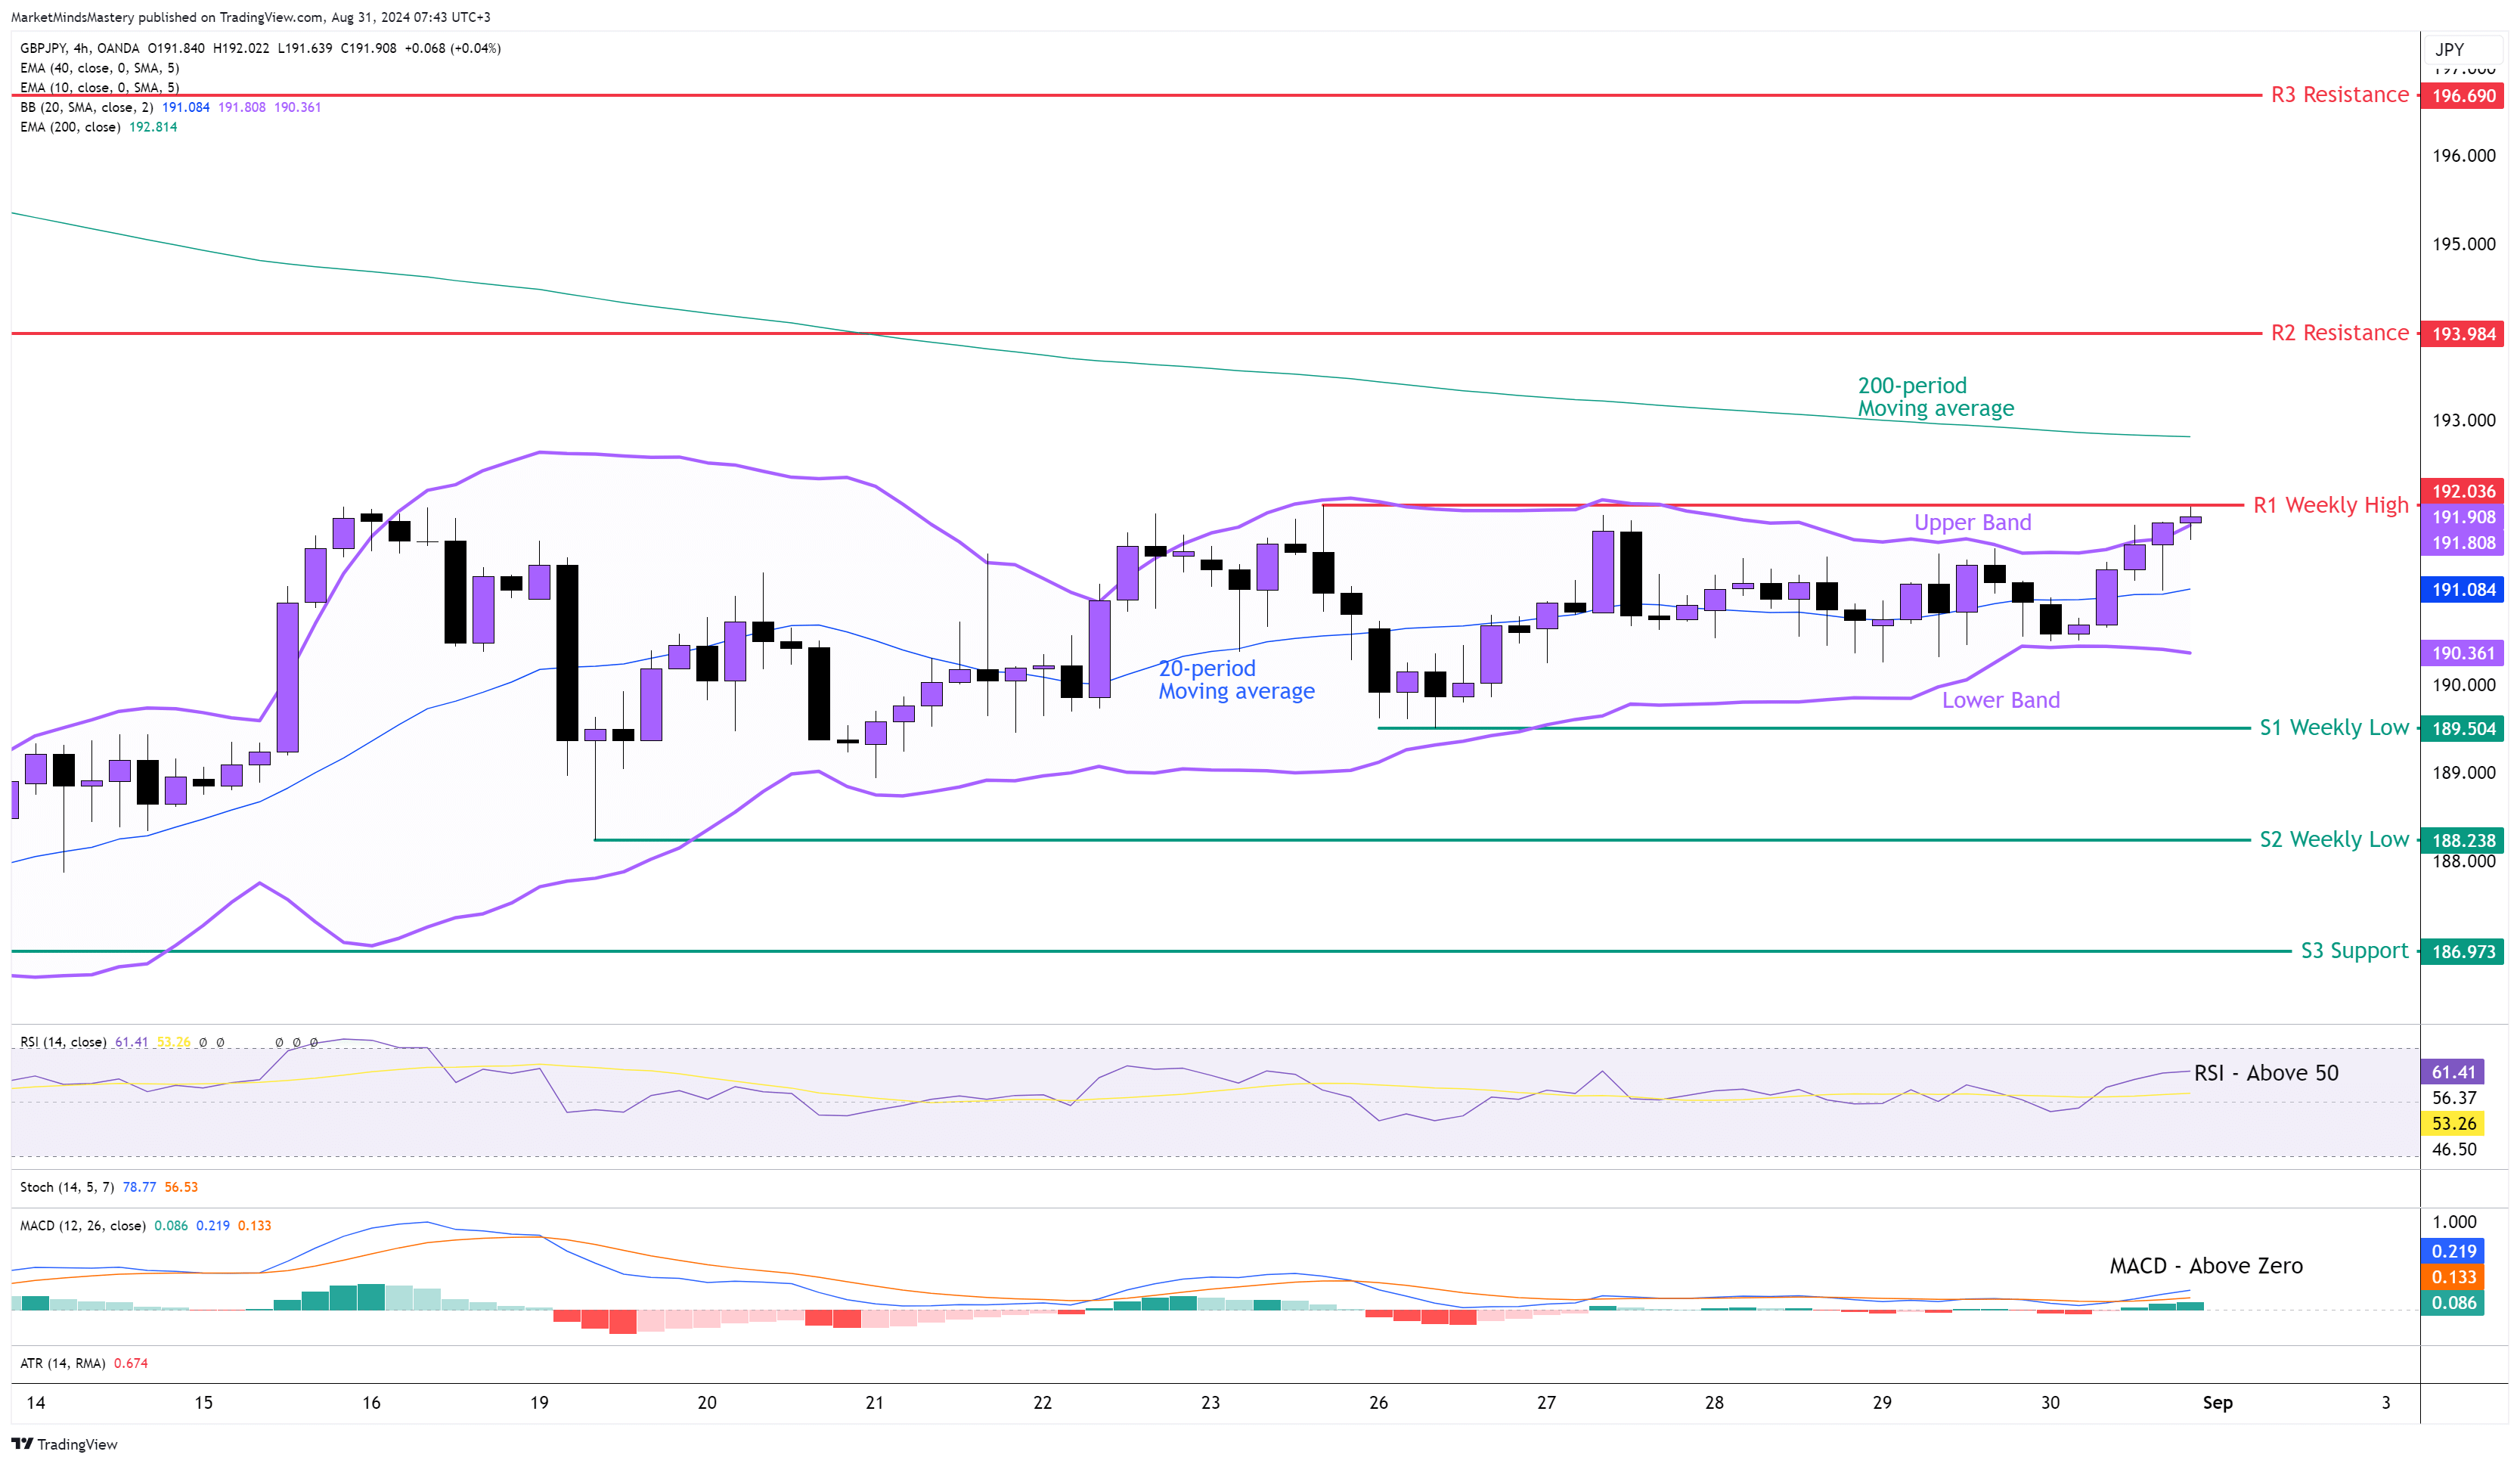
Following the previous week’s market analysis, the GBPJPY remained within the boundaries of the weekly candle from a few weeks ago, which we marked on the chart. This is known as an Inside candle, and it is considered an indecision price action because it lacks a market direction. On the 4-hour chart, the price remained between the Upper and Lower Band of the Bollinger Band indicator. The two bands move in parallel, which shows the price’s equilibrium state. The 20-period moving average, which in this case is the middle line of the Bollinger Band Indicator, was consistently violated by the price, making it a less important indicator last week. The 200-period moving average is above the current price around the 193 level, and it can become a dynamic price resistance. We consider it as dynamic instead of static because it moves as the price fluctuates. The RSI Oscillator is above its middle line of 50, and this has bullish implications.
Additionally, the MACD is above its zero line, which also has bullish implications. Starting Monday, if the price moves upwards, the first resistance area, R1, will be the previous week’s high, around 192.036. If the price penetrates the R1 and keeps moving upwards, the next resistance area, R2, will be around 193. A further upward move will find the R3 resistance at approximately 196.69. On the other hand, if the price is rejected and moves downwards, the first support area, S1, will be the 189.504 level. This is the lowest price for the previous week. If the price penetrates the S1 and keeps moving downwards, the next support area, S2, will be around 188 .23 and the following support S3, the 186.97 level.
GOLD 4H
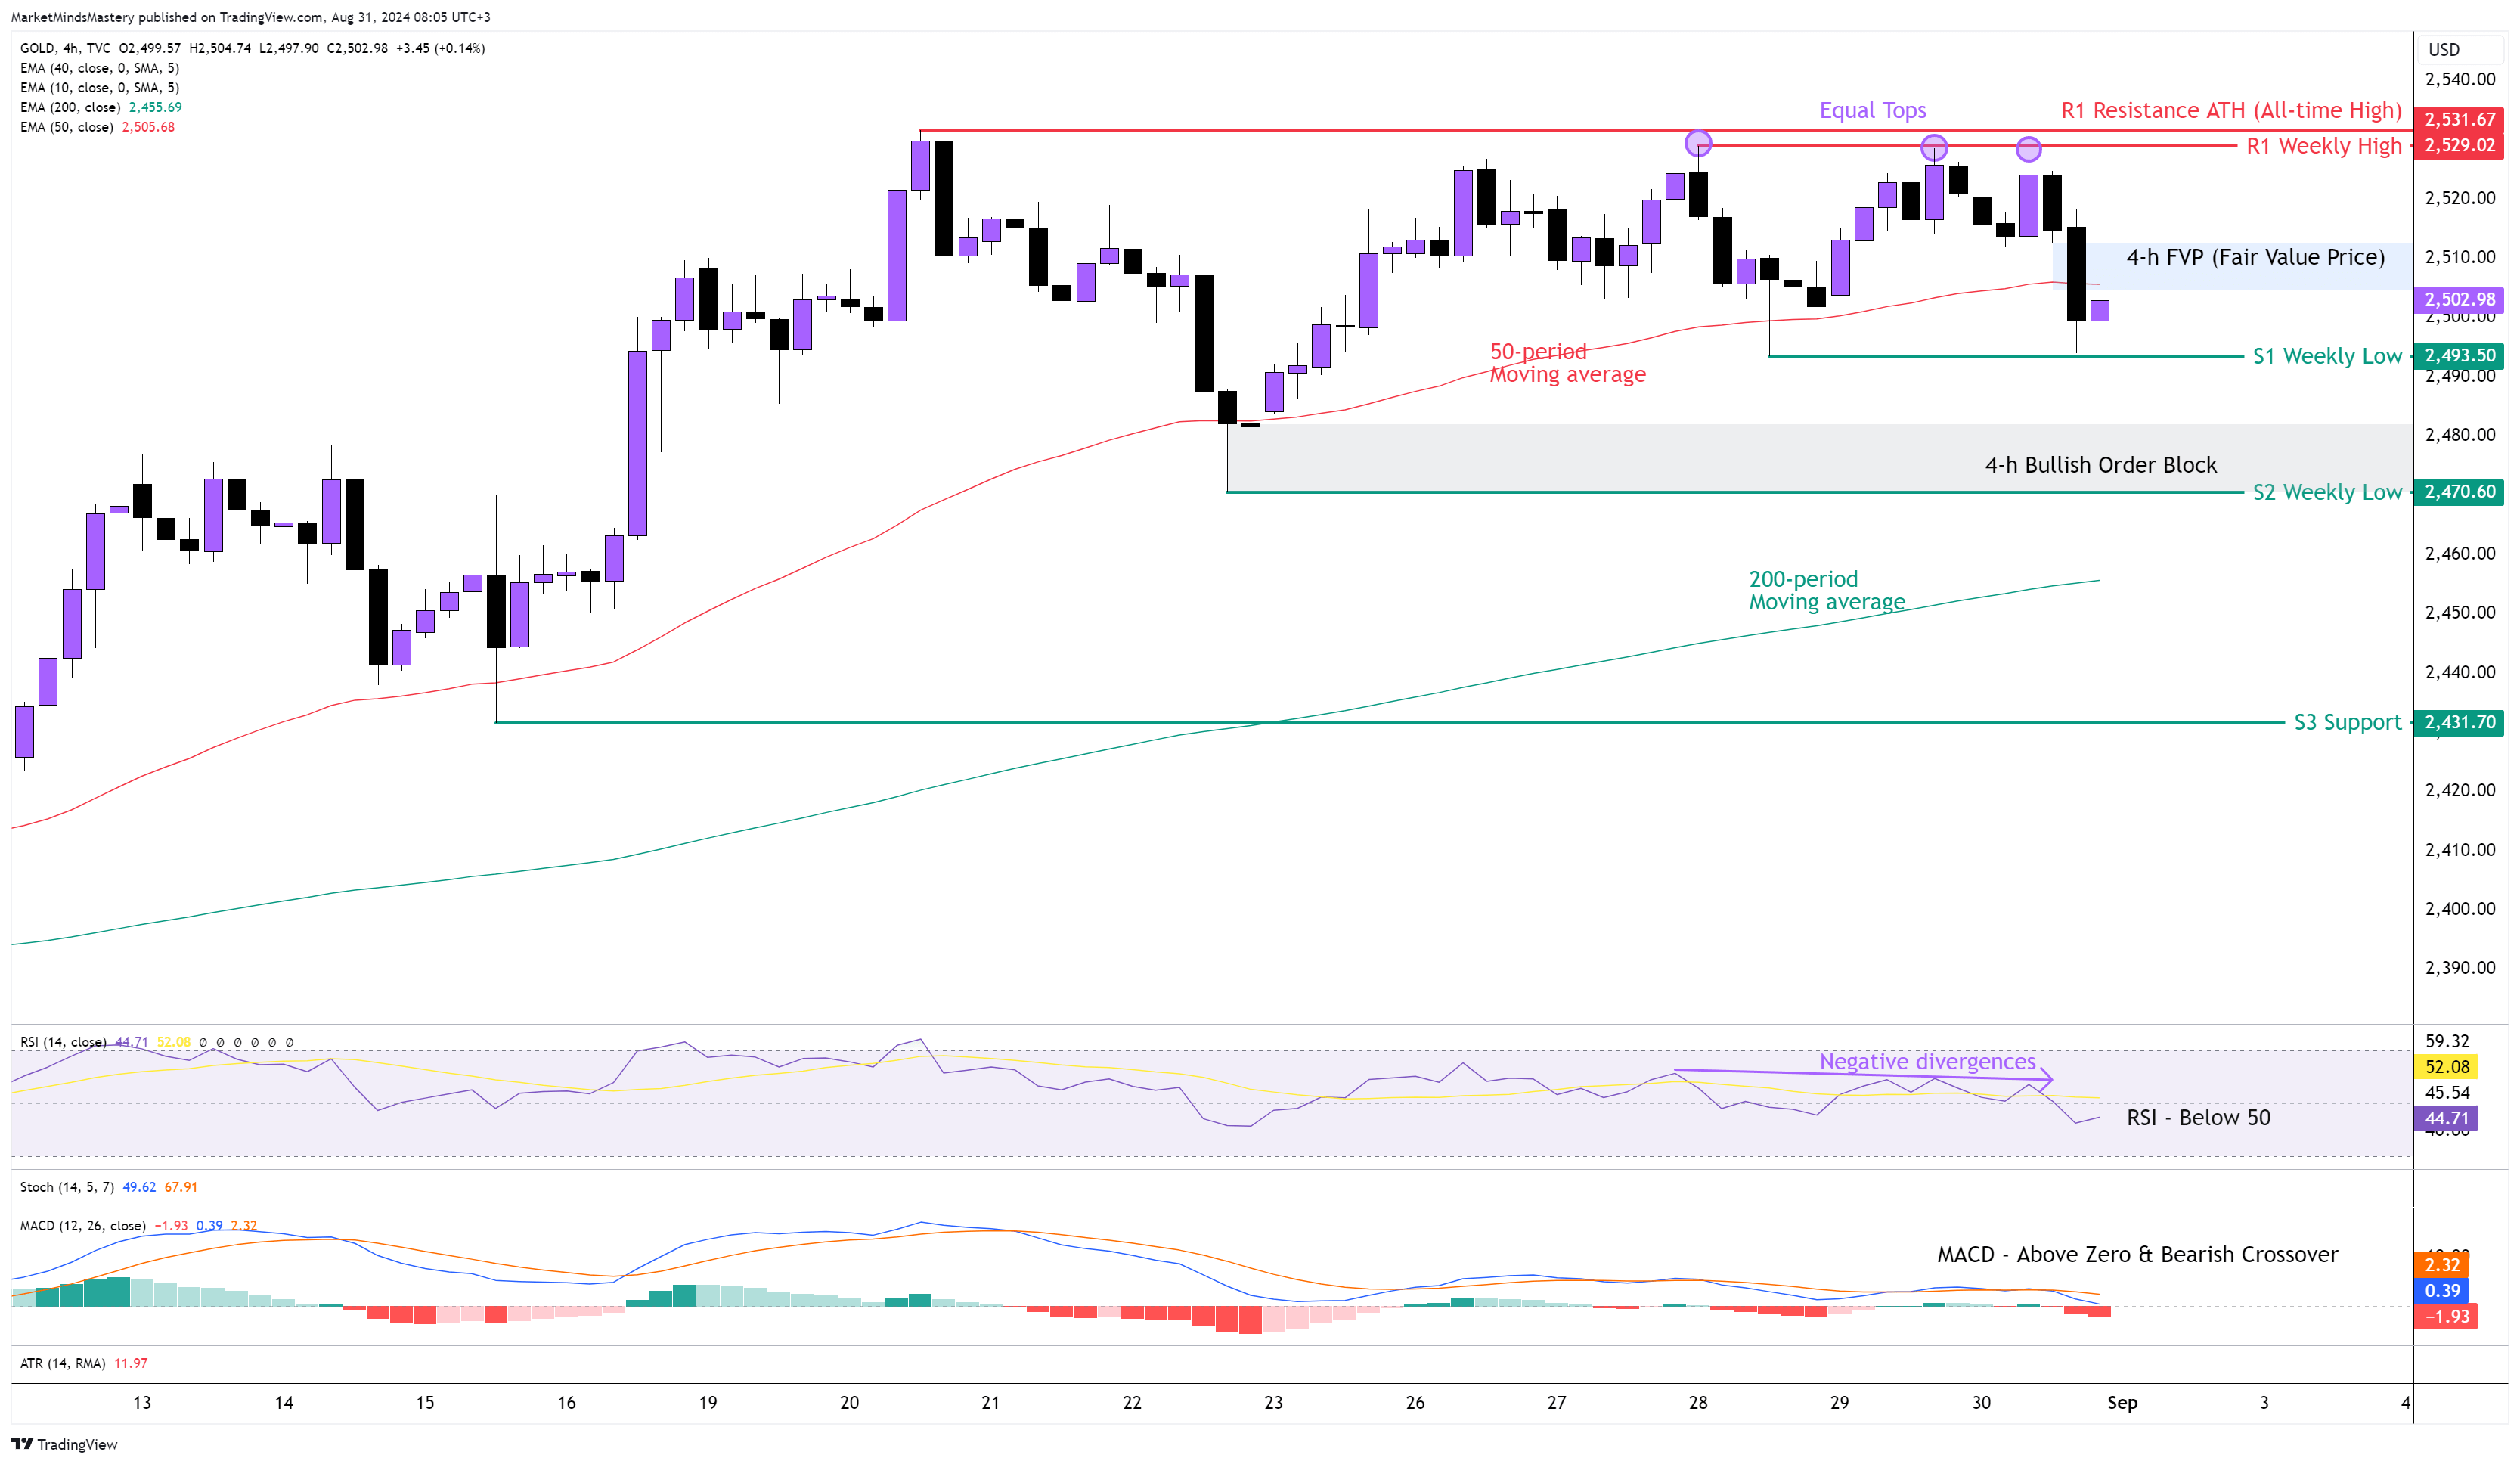
Last week, the price action on the weekly chart of Gold was completed as a Doji Inside candlestick. Therefore, in the Gold market, the price didn't create a new high or a new low. This means that last week’s trading activity occurred within a narrow trading range without any upward or downward market direction. Also, the price didn’t create a new ATH (All-Tme High). On the 4-hour chart, the price created Equal Tops around $5929, and at the same time, the RSI Oscillator printed Negative Diverneces B’ Class. The 50-period is above the 200-period moving average, and this has bullish implications. The MACD is above its zero line, which created a Bearish Crossover. After the topping pattern and the sideways move that occurred last week, if the price declines and moves downwards, the first support area, S1, will be $2493, which is the previous week’s low. If the price breaks below the S1 and declines further, the next support area, S2, will be an older weekly low price level around $2470. At this price level, a Bullish Order Block was created a few weeks ago. If the price penetrates the S2 and keeps lowering, the next support, S3, will be around $2431.
On the other hand, if the price moves upward, the first resistance, R1, will reach the previous week’s high around 2529. This price level is almost the same as the ATH. If the price penetrates the R1 and keeps increasing, the ATH around $2531 becomes the next level of resistance.
USOIL 4H
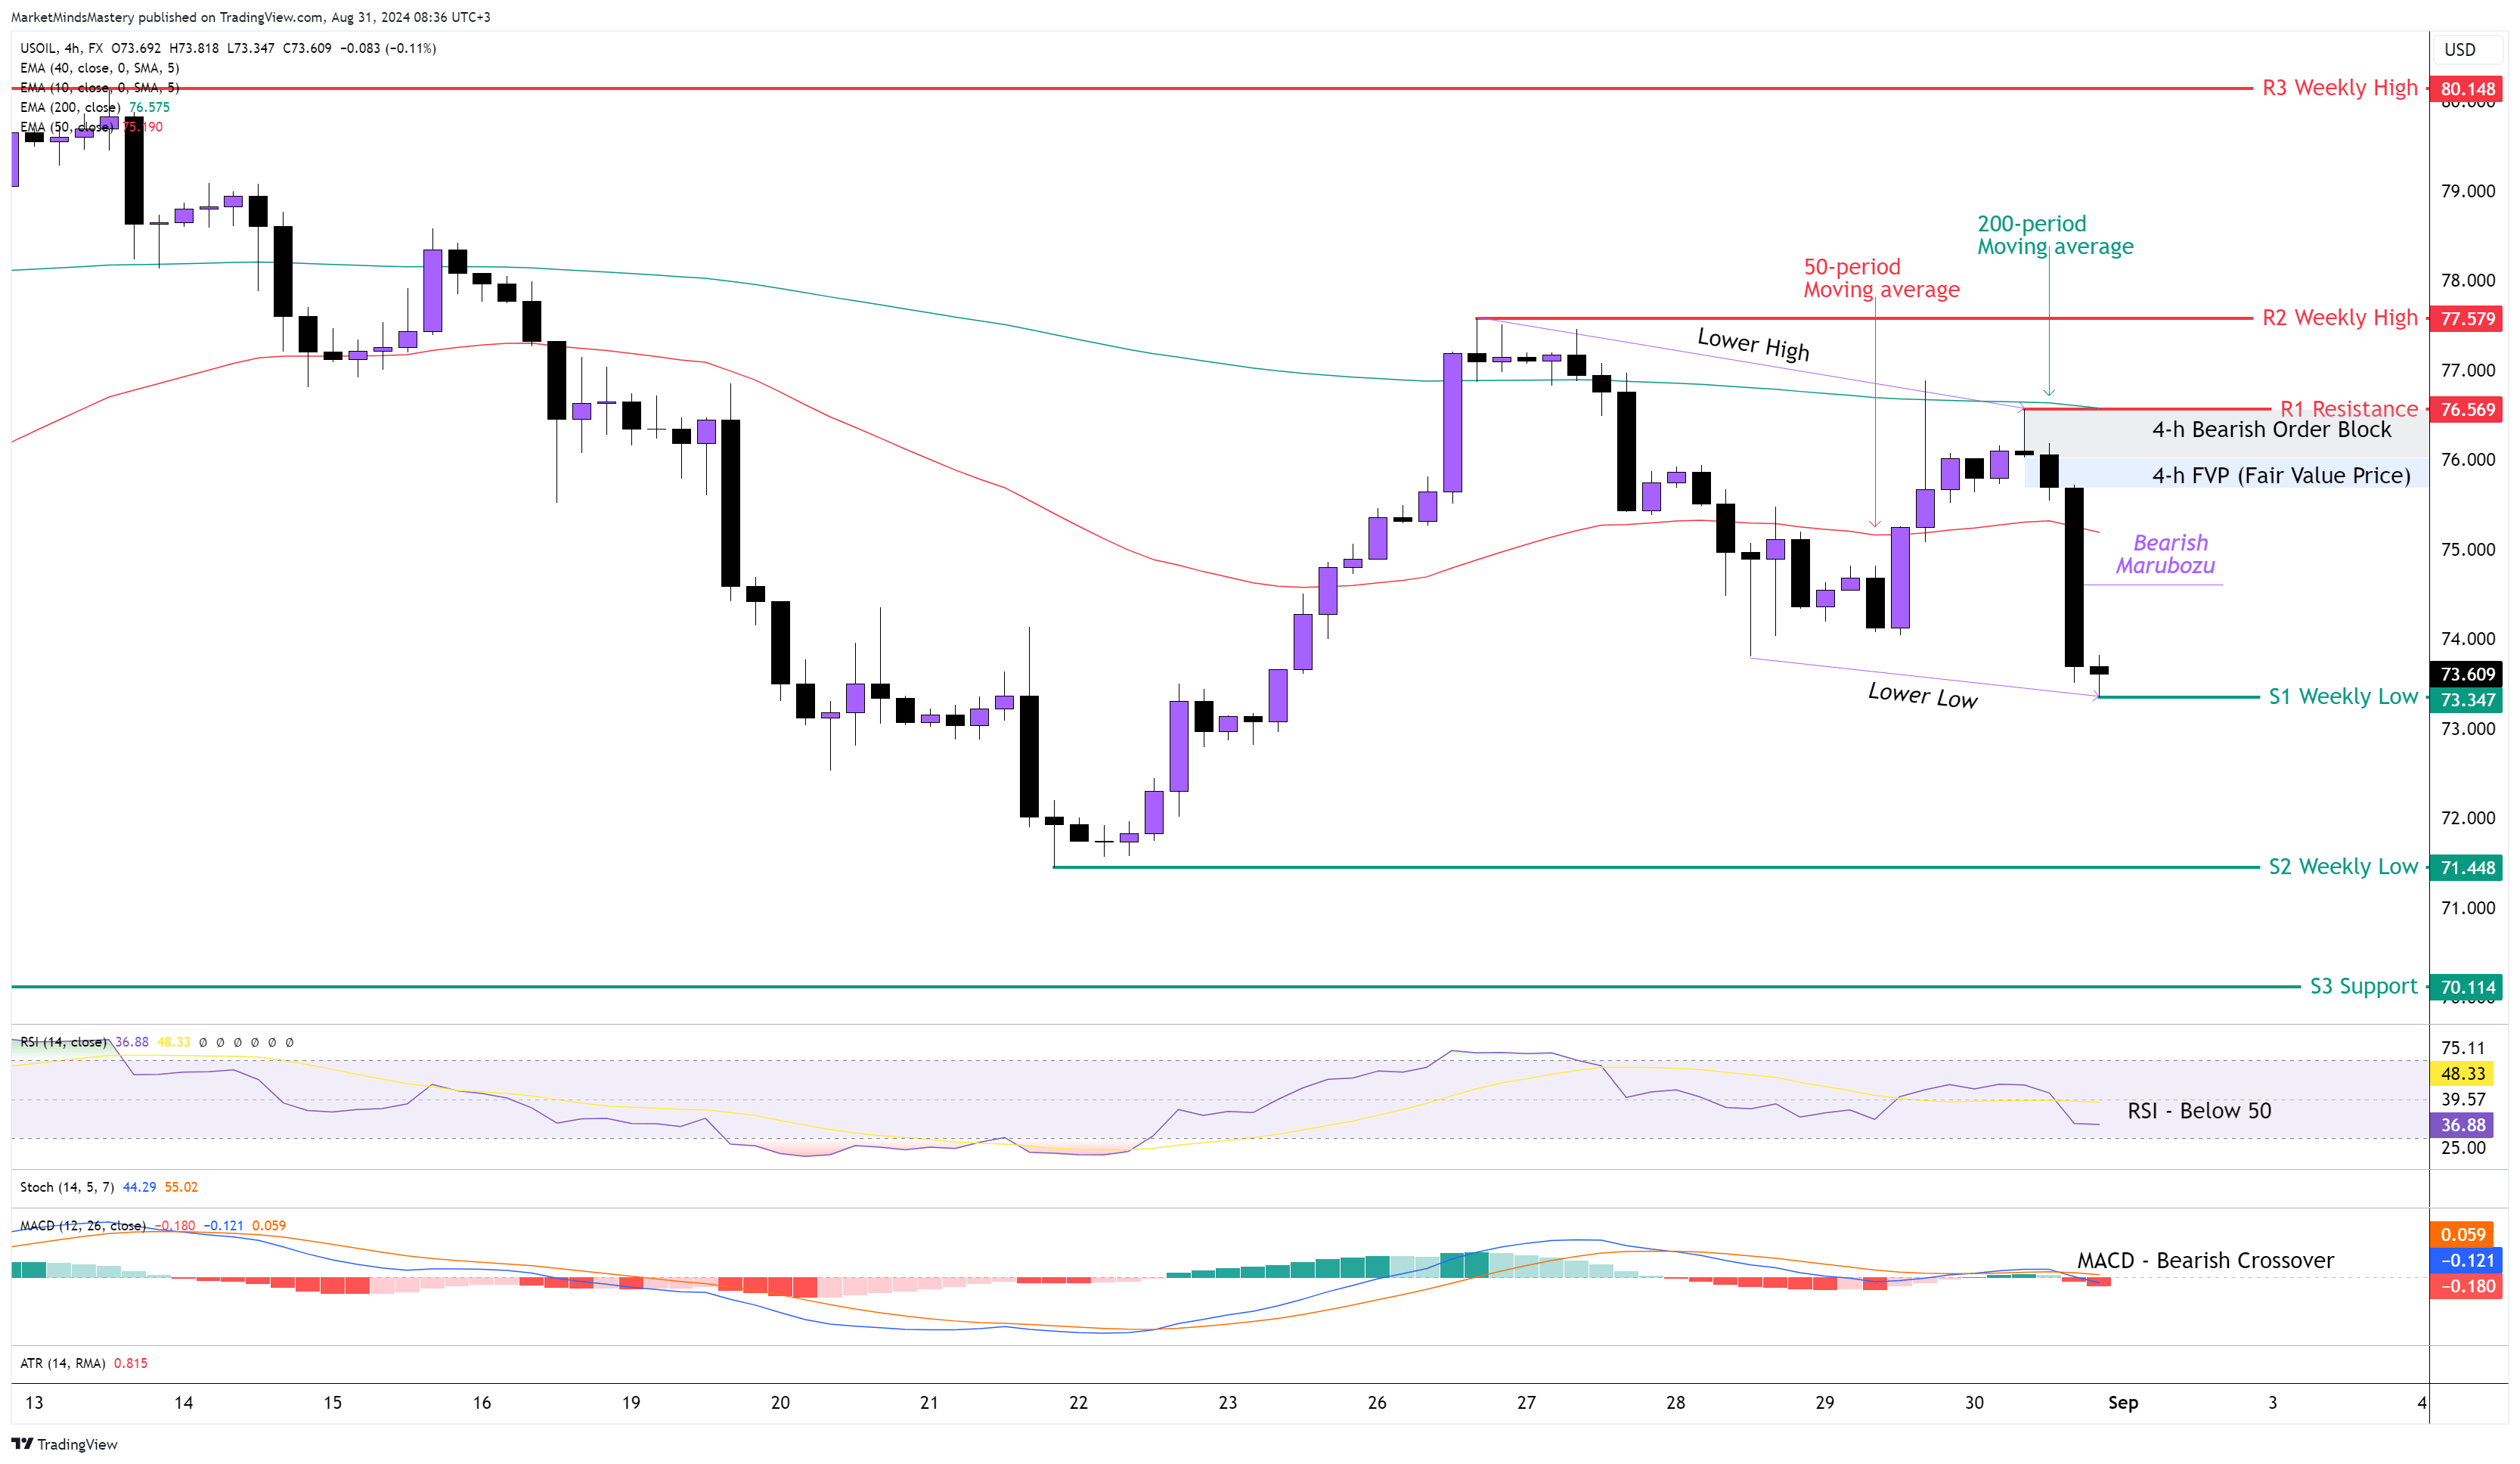
The strength of the US Dollar last Friday, particularly during the New York trading session, established the pace of the USOIL market. The price of the commodity declined with a Bearish Marubiozu, as shown on the chart, and the price created a lower low at the end of the week. The weekly chart’s price action ended as a Berarish candlestick with an Upper Wick rejecting the 10-period weekly moving average (not shown on the above chart). On the 4-hour chart, the 50-period moving average is below the 200-period moving average, which is bearish. The RSI Oscillator is below its middle line of 50, and it has bearish implications. The MACD created a bearish crossover, while the MACD Line (Blue) and the Signal Line (Orange) were both above the indicator’s zero line. As the price made a lower high and a lower low, starting Monday, if the price declines more and moves downwards, the first support area, S1, will be the previous week’s low, around $73.34. If the price penetrates the S1 and keeps lowering, the next support area, S2, will have an older weekly low of approximately $71.44. Oppositely, if the price bounces off and moves upwards, the first resistance area, R1, will be $76.56. Last week, the market created a Bearish Order Block and an FVP (Fair Value Price) around $76. Both these can become additional resistance factors for the price. If the price penetrates the R1 resistance and keeps moving upwards, the next resistance area, R2, will be the previous week’s high, around $77.57.
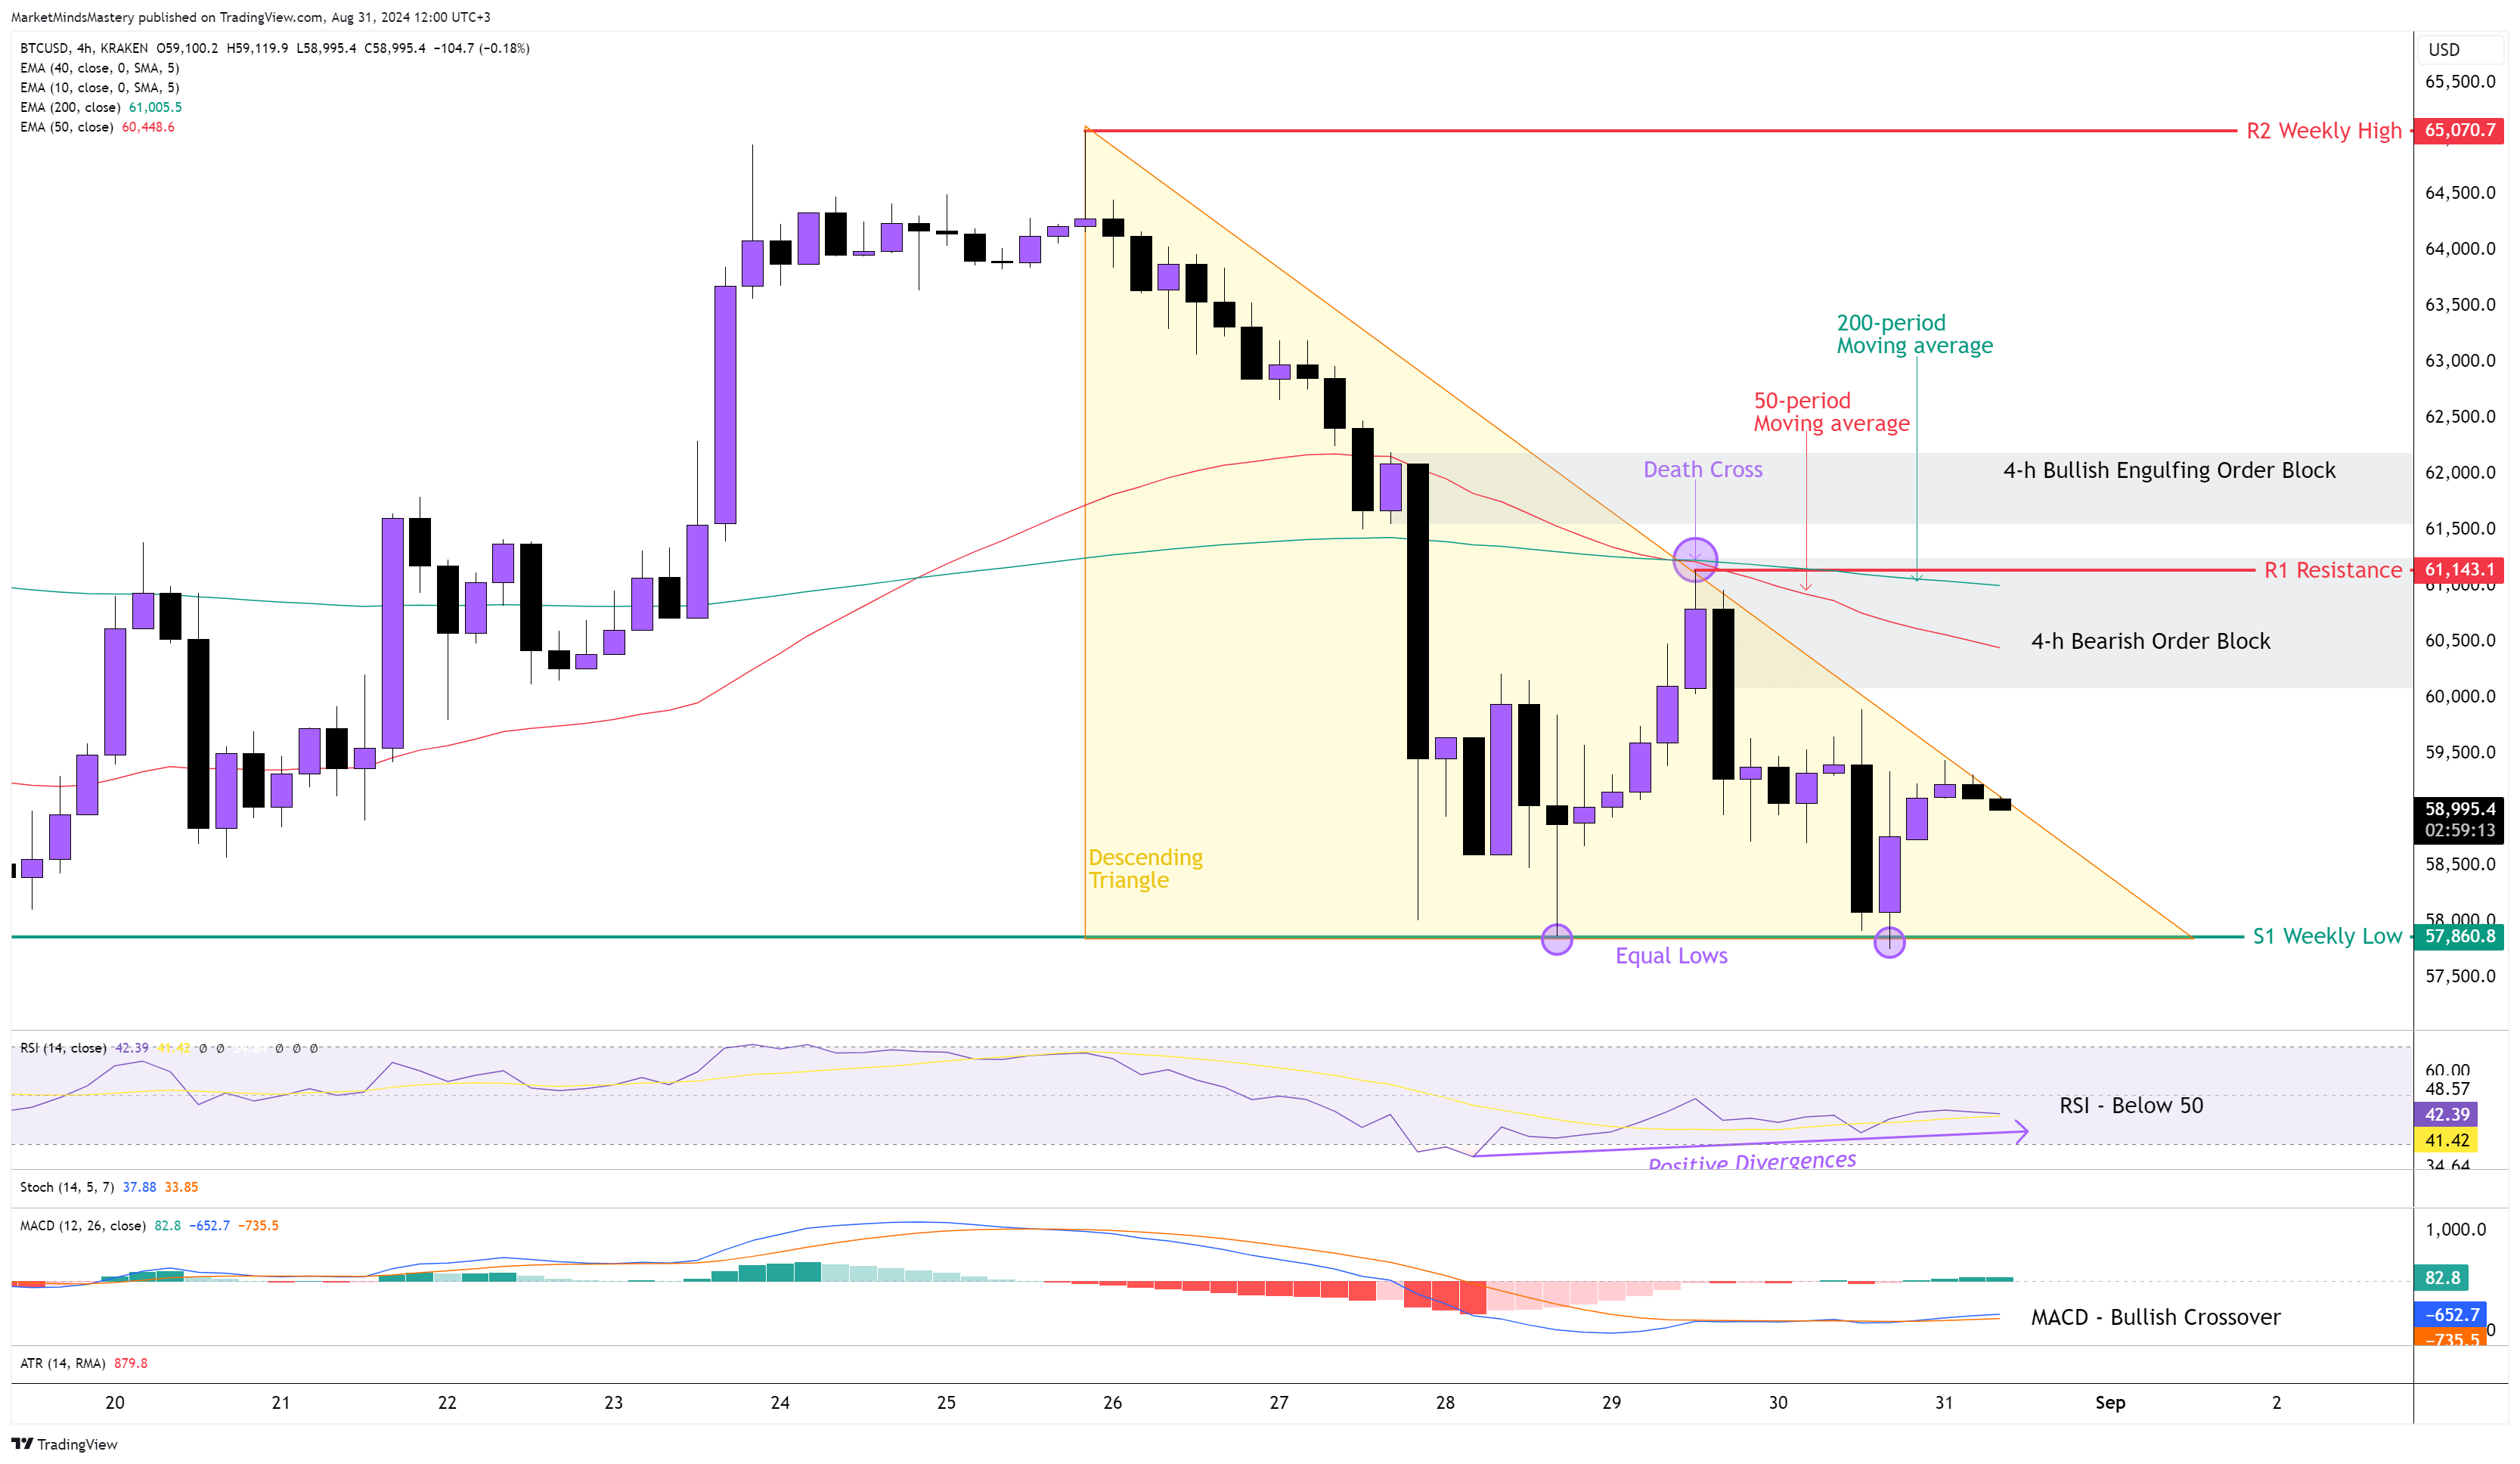
BTC USD 4H
Last week, the price of Bitcoin didn't follow through with the Bullish candle printed on the weekly chart. Therefore, the price declined. The weekly candle ended as a Bearish candle. On the 4-hour chart, the chart pattern was created because the weekly chart’s price decline is called the Descending Triangle. It consists of a series of lower highs and equal lows. Usually, the patterns have bearish implications. Last Thursday, the 50-period crossed below the 200-period, known as the “Death Cross”, and it has bearish implications. The RSI is below its middle line of 50, and it has bearish implications. Additionally, the RSI shows Bullish or Positive Divergences B’ Class because the oscillator was unable to register a new lower low in order to follow the price’s decline as per the above chart.
On the other hand, MACD is below its zero line, which created a bullish crossover. Starting Monday, in case the descending triangle acts as a downtrend continuation rather than as a bottom reversal pattern, and if the price declines and moves downwards, the first support area, S1, will be the previous week’s low, around $57860. If the price penetrates the S1 and keeps lowering, the next support area, S2, will be around $56117. This price level is an older weekly low price. A further downward move will find the next support area, S3, around $54556. Oppositely, if the price finds support around $58000 and moves upwards, the first resistance area, R1, will be $61143. Last Thursday, the price created a Bearish Order Block of around $60000, and it can be an additional resistance factor on the subsequent upward move. If the price penetrates the R1 aerea and keeps increasing, the next resistance area, R2, will be around $65070.
SP 500 4H
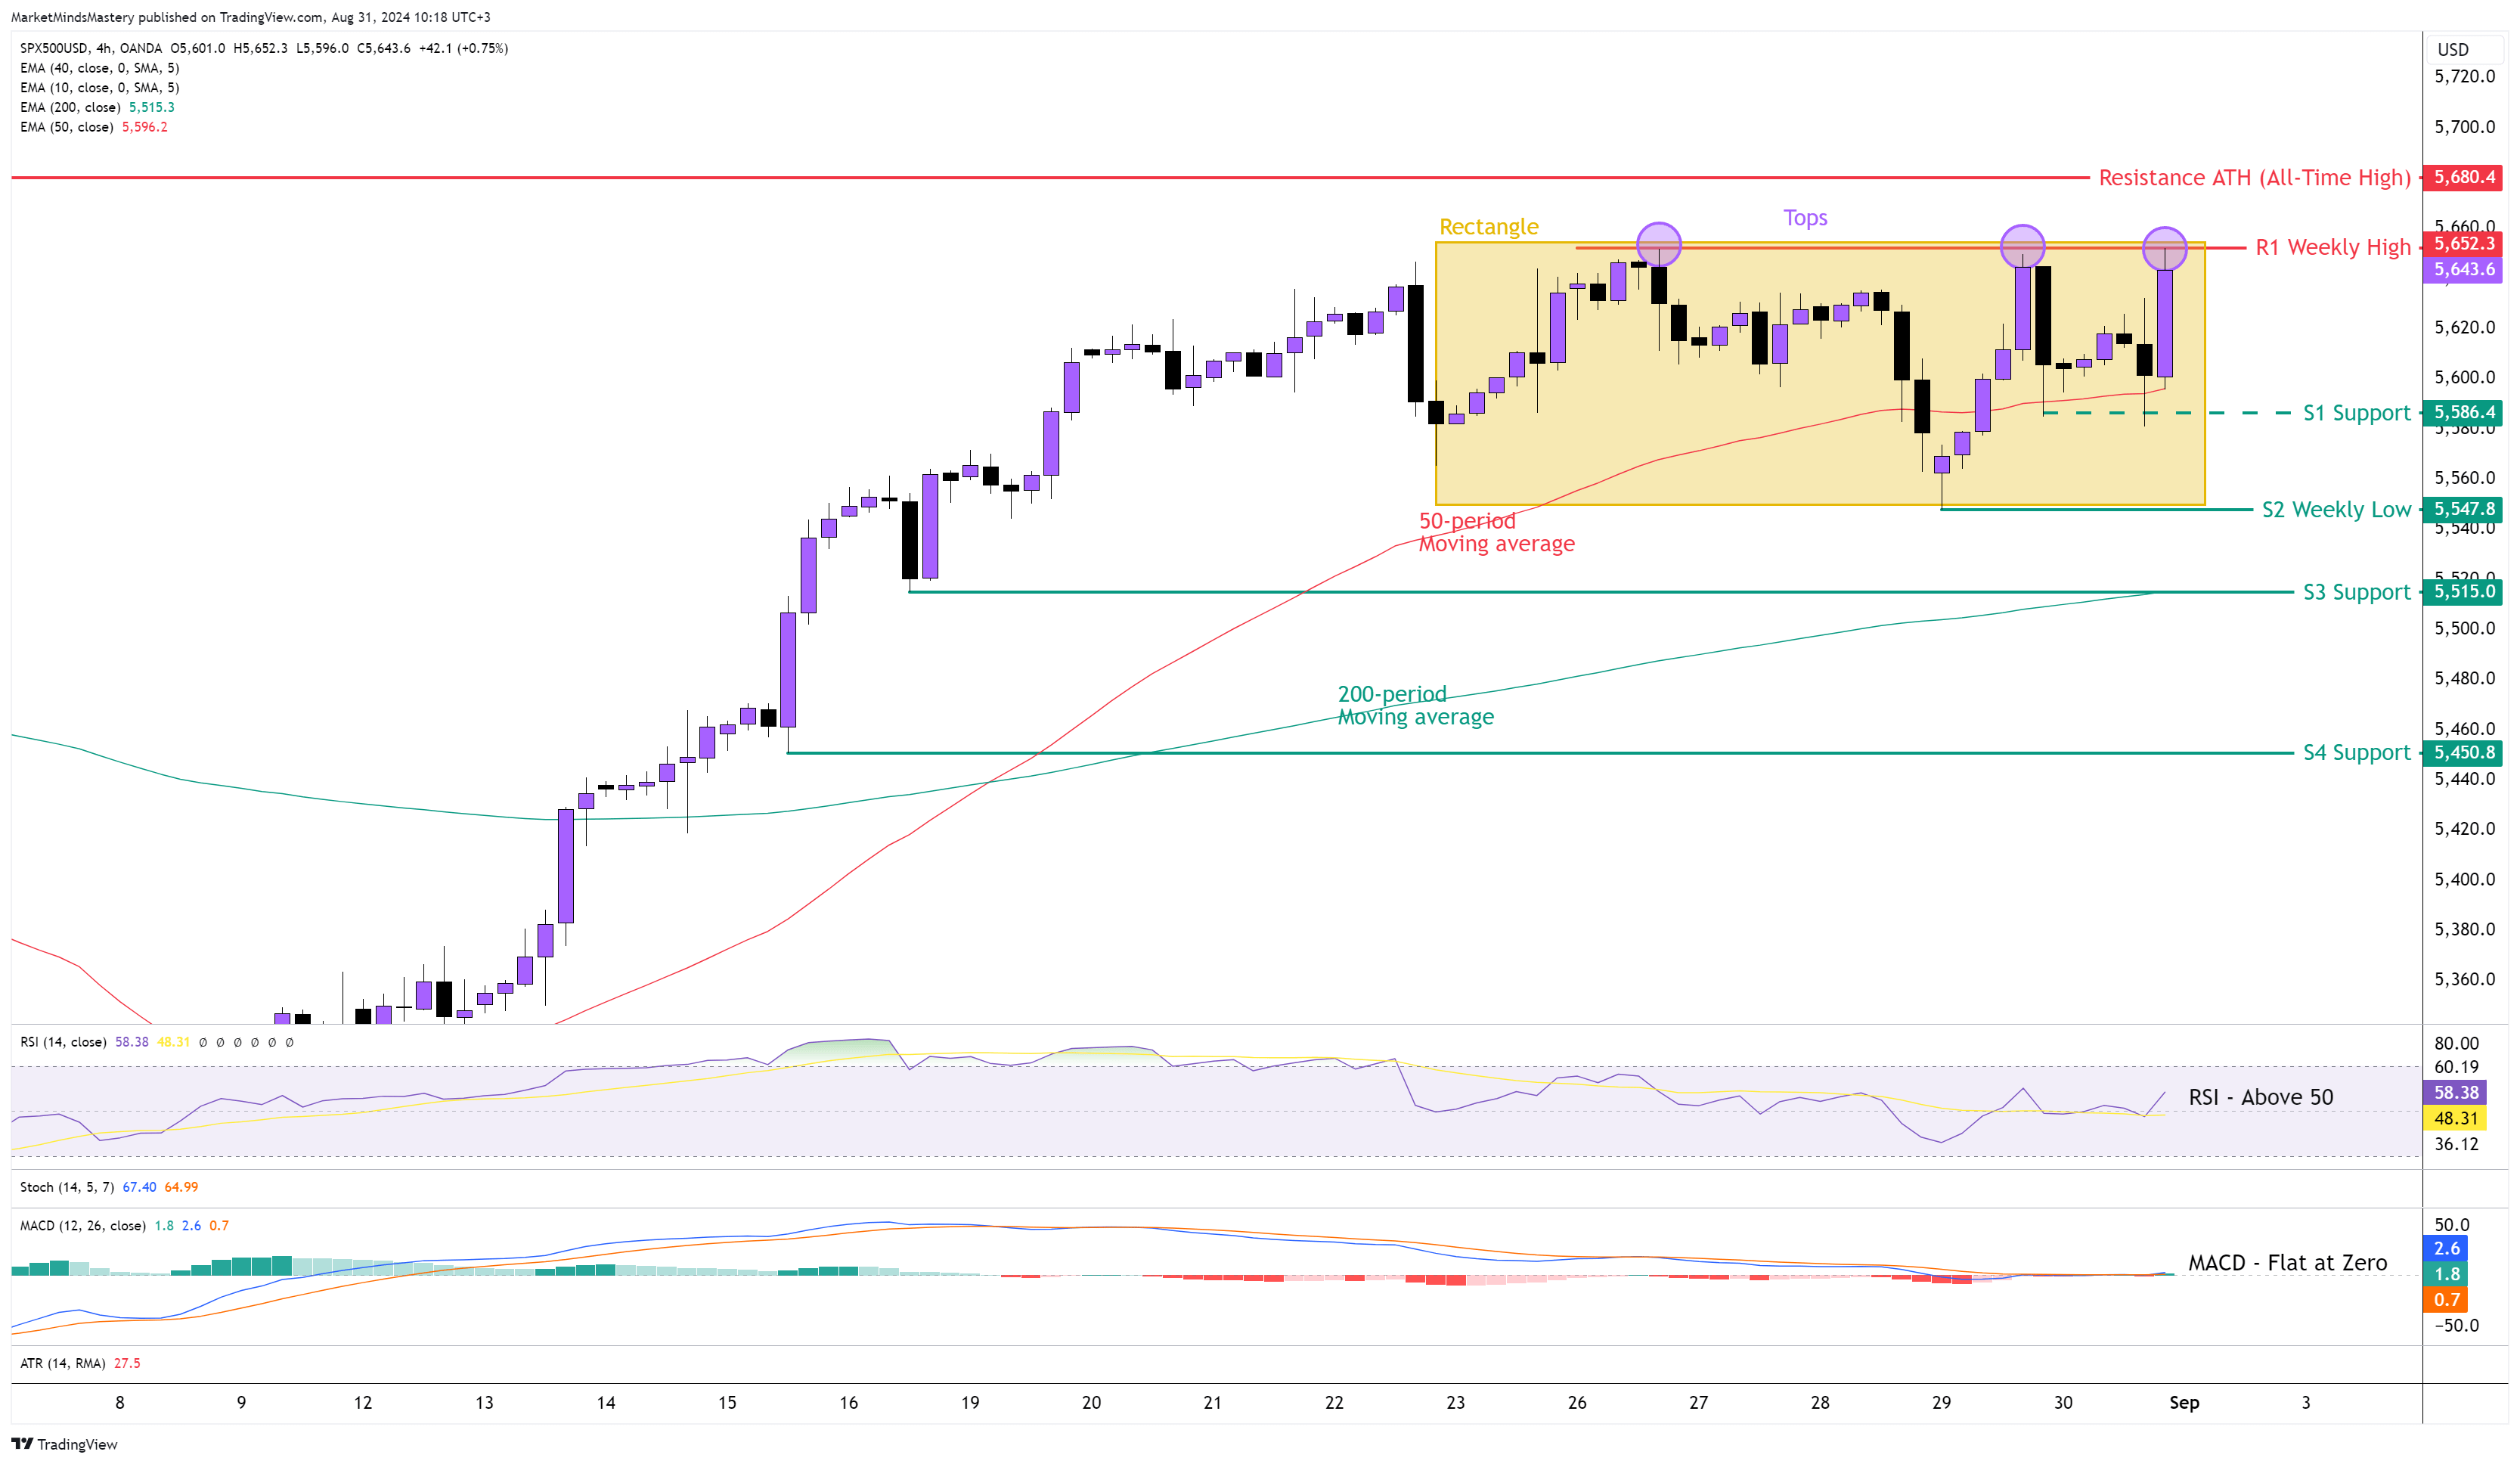
The SP500 remained around $5660 last week without penetrating the ATH (All-Time high). The weekly chart’s candlestick ended as a Dragonfly Doji. On the 4-hour chart, the price created a Top Rectangle chart pattern. Some traders may see this as a Triple Top reversal pattern. However, only if the low at $5547 penetrates and the price declines will it become a confirmed Triple Top Reversal Pattern. The 50-period is above the 200-period moving average, and this has bullish implications. The RSI is above 50, which shows bullishness. The MACD is around its Zero line. Currently, the price is above the 50-period moving average, and it has bullish implications. Starting Monday, if the price keeps increasing, the first resistance area, R1, will be the previous week’s high, around $5652. In case the price penetrates the R1 resistance level and keeps moving upwards, the next resistance area, R2, will be the ATH (All-Time high) at $5680.
On the other hand, if the price moves downwards, the first support area, S1, It will be around $5586. If the price penetrates the S1 and declines further, the next support area, S2, will be the previous week’s low, around $5547. In case the price penetrates the S1 and moves downwards, the topping Pattern explained earlier will be a triple-top reversal pattern, and we will anticipate the start of a new Downtrend. If the price keeps lowering, the next support, S3, will be around $5515, and the S4 support area will be around $5450.
US 30, 4H
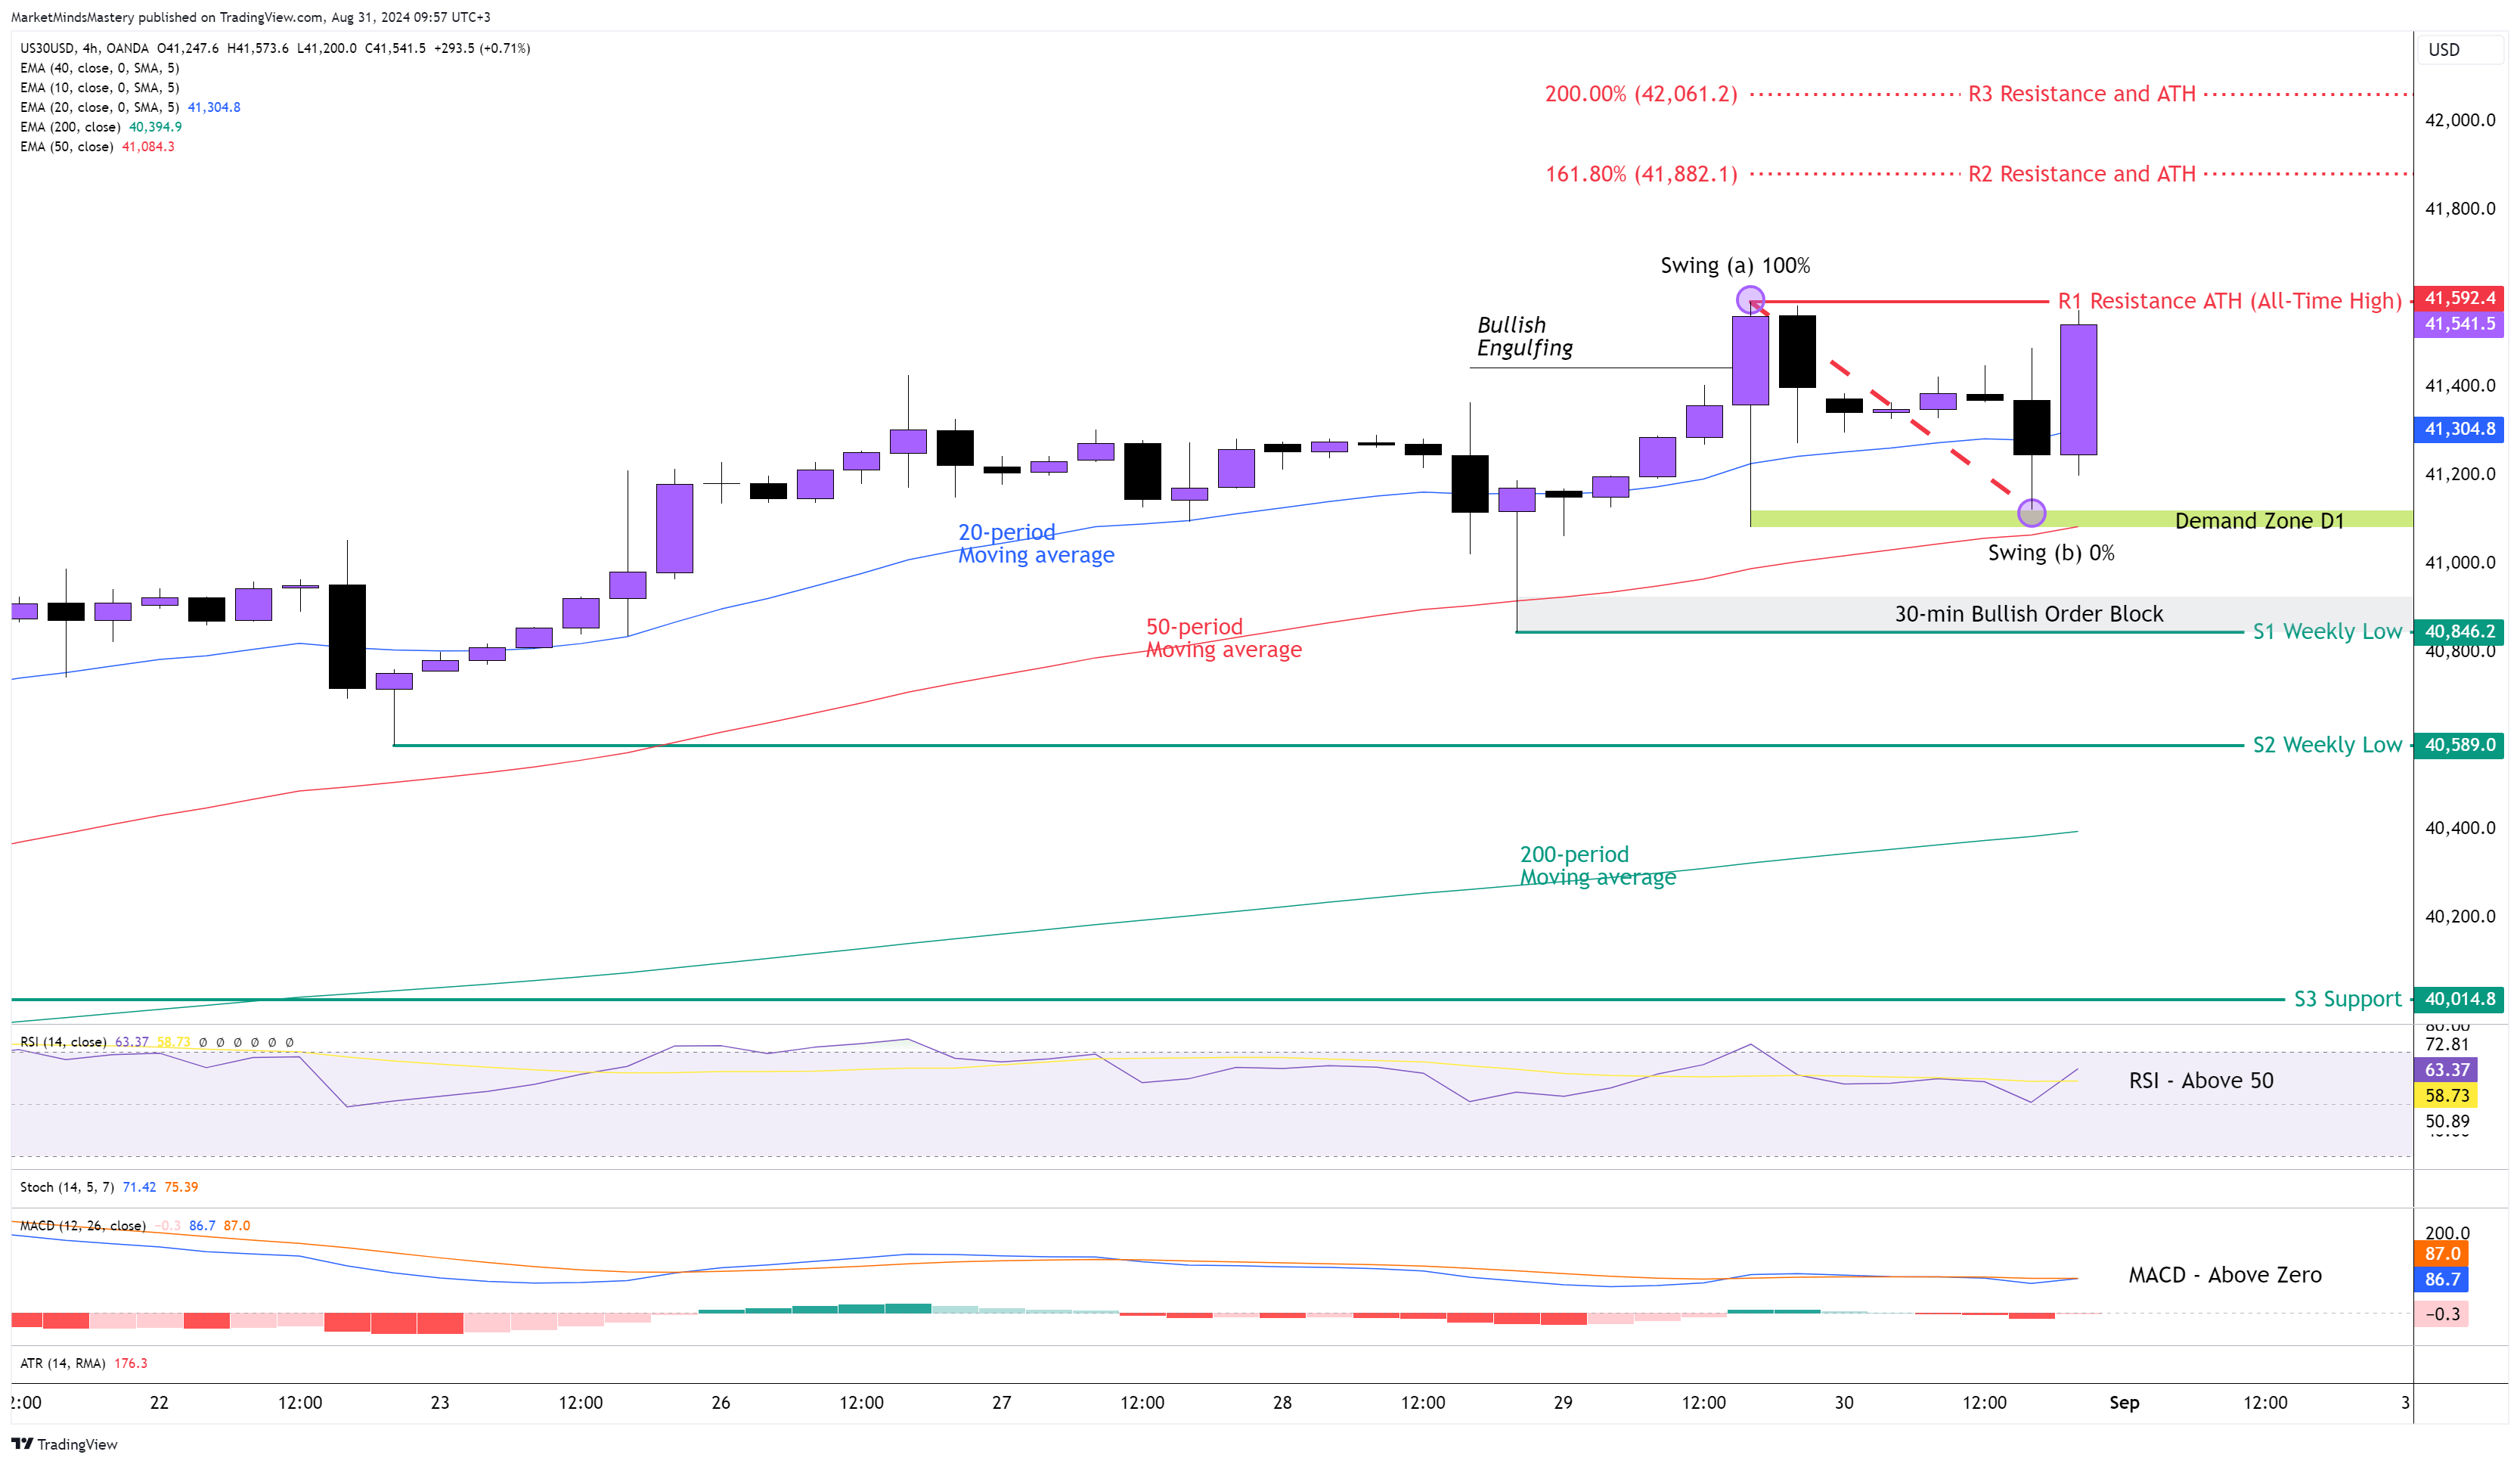
The US30 was the only one of the three major indices (US30, SP500, NASDAQ) that created a new ATH (All-time High). The price on the weekly chart was printed as a bullish candle with a positive closing price. On the 4-hour chart, the Bullish Engulfing printed last Thursday caused the new ATH price, but in fact, it didn’t follow through with an upward move as expected, and the price retraced almost 100% of the move. Around $41100, Bullish Engulfing’s low price became the support, from where the price bounced off, marking the Demand Zone D1. The 20-period is above the 50-period moving average, and this is bullish. The RSI Oscillator is above its middle line of 50, and this has bullish implications. The MACD is above the zero line, which also has bullish implications. Last Wednesday, the price was around $40800. On the 30-minute chart, It created a Bullish Order Block. Starting Monday, if the price moves upwards, the first resistance area, R1, will be the ATH (All-Timer High) around $41592. If the price surpasses the R1 and keeps moving upward, the next resistance area, R2, it will be approximately $41882. This will eventually become the new ATH. In case the price penetrates the R3 and moves further upwards, a new ATH price is expected to be around $42061. We use the Fibonacci Extension tool to find out both the R2 and R3 levels. We measure them by using the starting point, the swing level at point A, and the ending point, the swing area at point B. On the other hand, if the price declines and moves downwards, the first support area, S1, will be the previous week’s low, around $40846. If the price penetrates the S1 and keeps lowering, the next support area\zs S2 and S3 will be $40589 and $40014, respectively.
GER 30, 4H
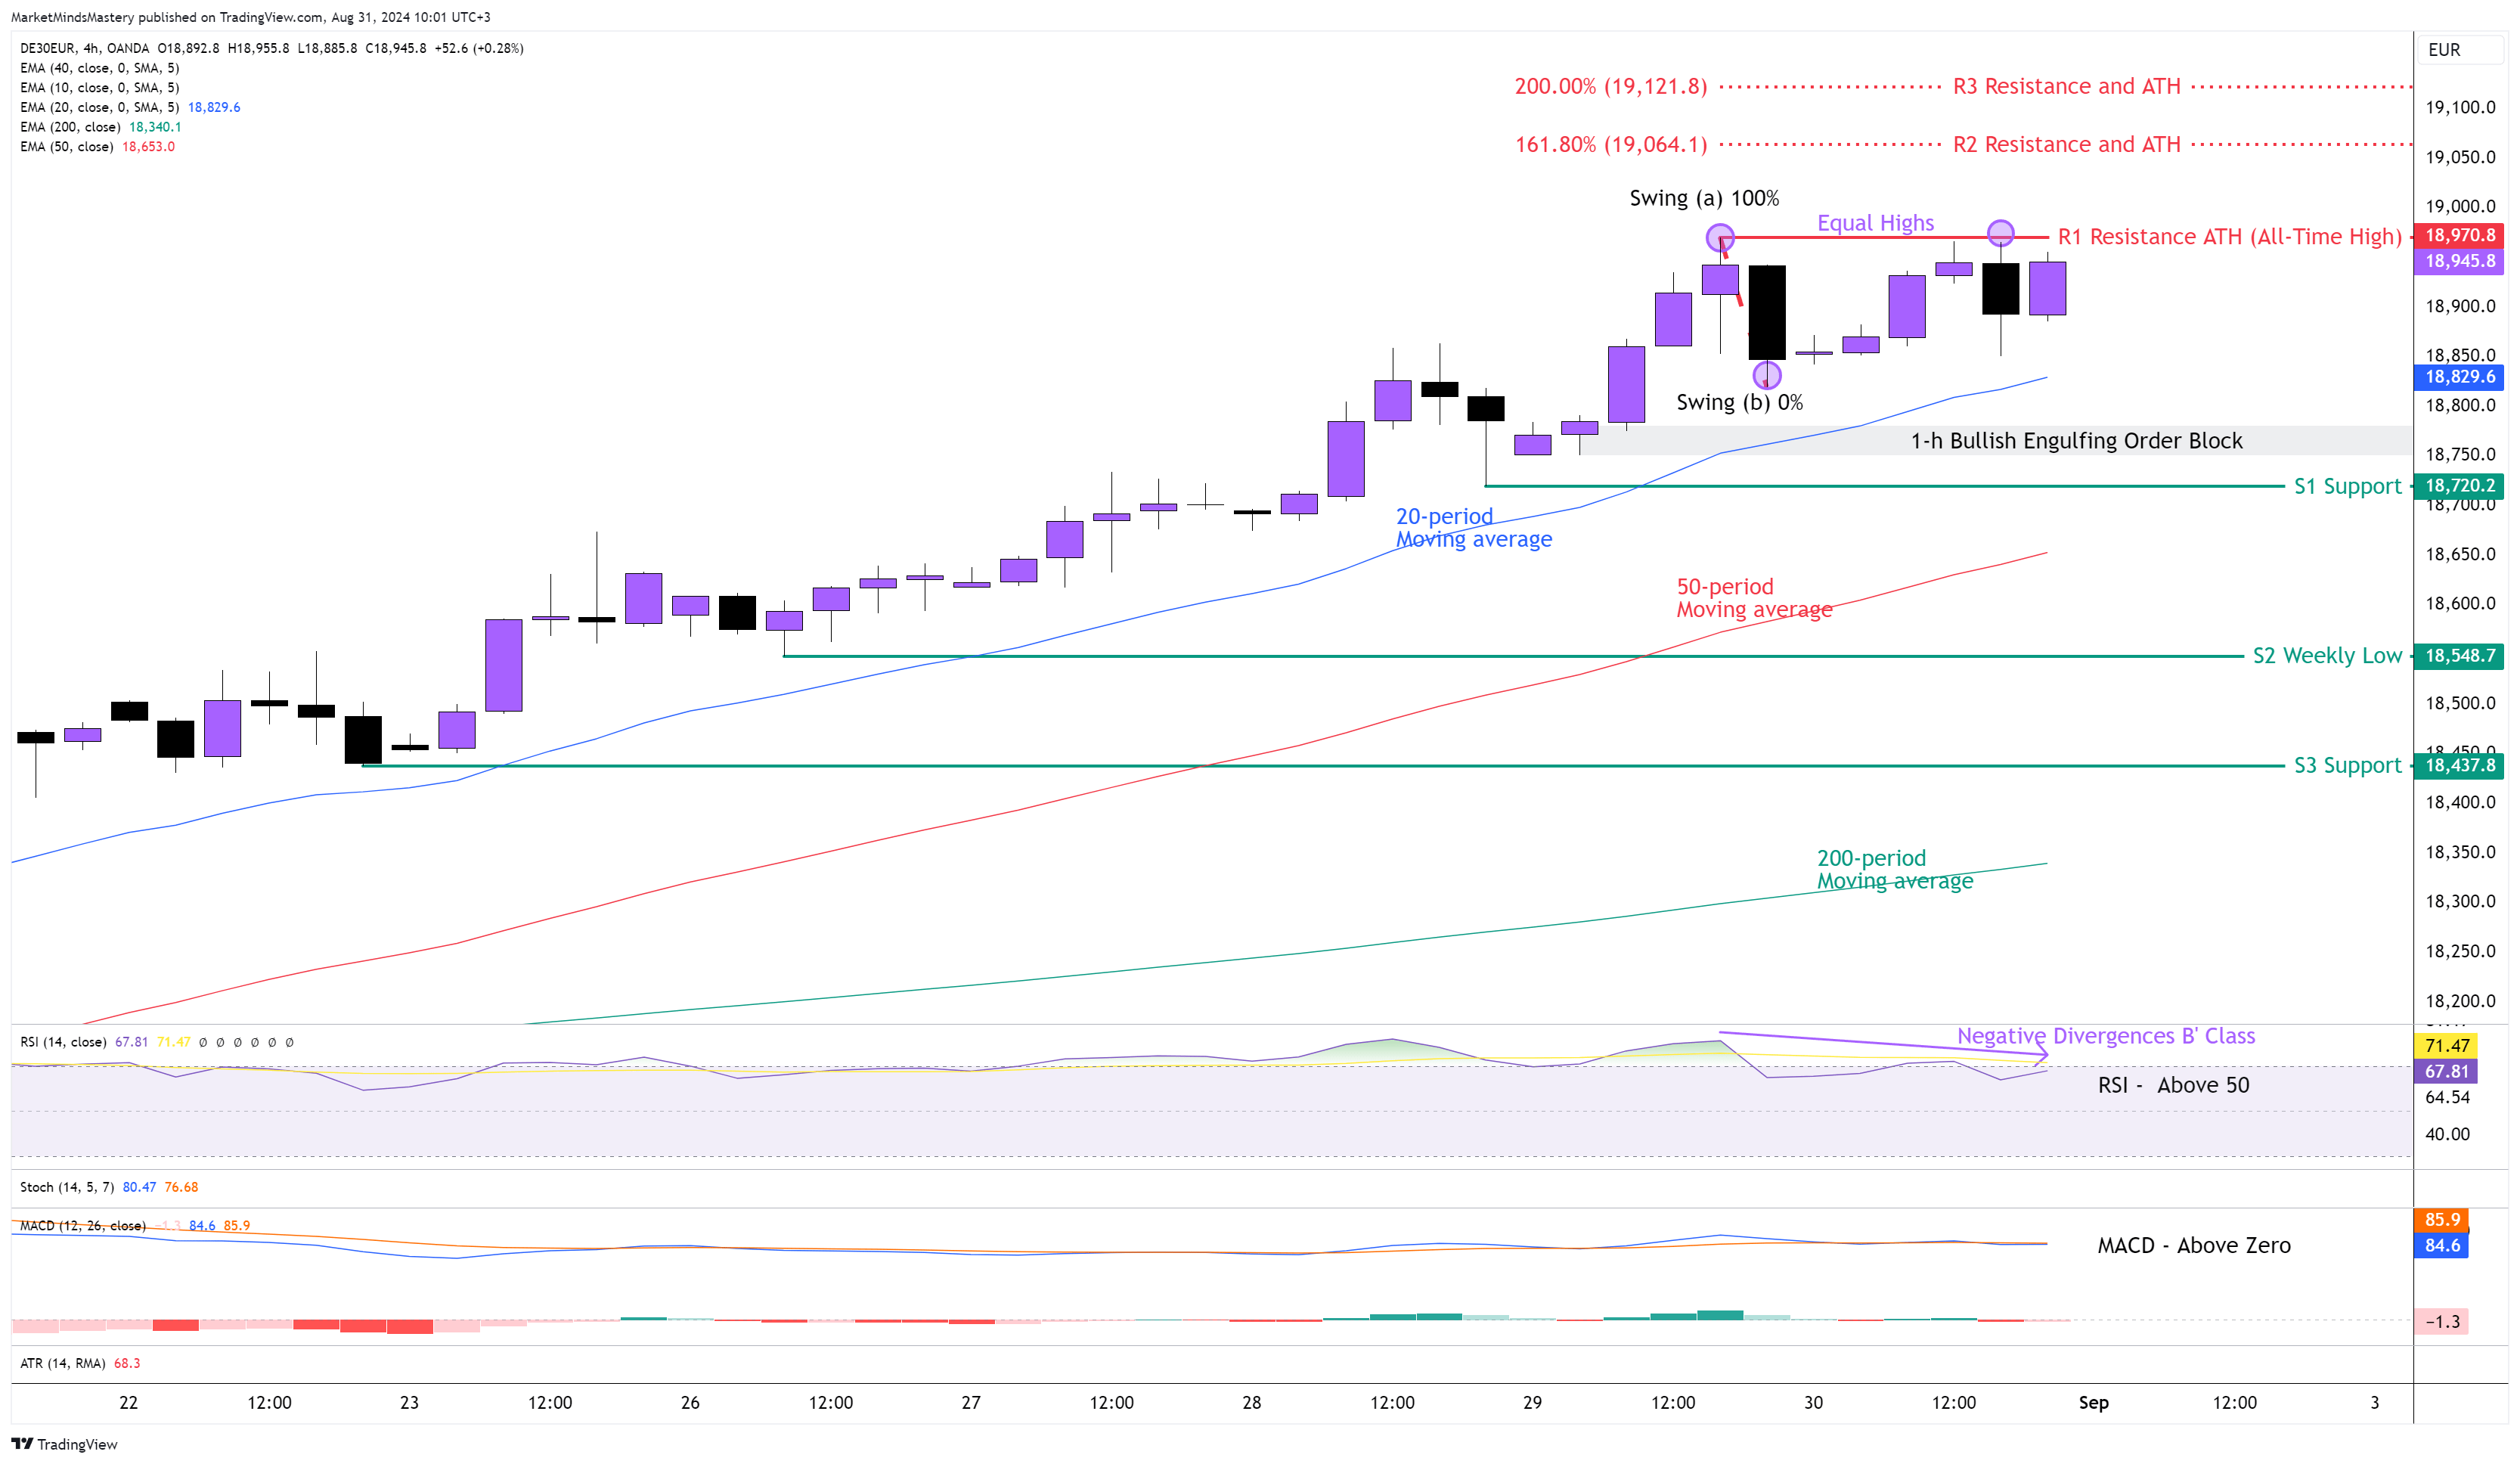
Following the previous week’s Market Outlook, the price of the GER30 registered a new ATH (All-Time high), almost at the 19000 price level. The weekly candle ended as a Bullish Marubozu Candle as both the open and closed candle’s prices are almost at the same level with the candle’s high and low. On the 4-hour chart, the price kept moving upwards in a series of higher highs and higher lows as the uptrend continued. The 20-period moving average is above the 50-period moving average, and the 50-period is above the 200-period moving average. These have bullish implications. The RSI is above its middle line of 50, and it is bullish. Currently, the price makes equal highs around 18970, but the RSI is unable to follow through, and instead of creating equal highs, it creates lower highs. Therefore, we pointed out the Negative Divergences B’ Class on the Oscillator. The Stochastic is at its upper boundary of 80, which means the GER30 price is in an Overbought condition. Starting Monday, if the price continues its upward move, the first resistance area, R1, will be the ATH around 18970. If the price surpasses the R1 and keeps moving upward, the next resistance area R2 will be the 161.8 Fibonacci Extension’s price at 19064. If the price keeps moving upward, the R3 resistance will be 19121, which is the 200% Fibonacci Extension number. Oppositely, if the pierce is rejected and moves lower, the first support area, S1, will be the 18720. If the price penetrates the S1 and keeps lowering, the next support area, S2, will be 18548, which is the previous week’s low. A further downward move finds the next support area, S3, around 18437.
.png)