Following the drop in the US CPI (Consumer Price Index) last week, the US Dollar was among the weakest currencies. The Dollar Index was declining, and the negative CPI report pushed the dollar's value lower. The biggest surprise, though, was the Euro’s performance last week. The reason was the cut of the Interest Rates by the ECB (European Central Bank) from 4.25% to 3.65%, which wasn't followed by a weakness in the Euro. After a significant event outcome like this, if the currency does follow through, it is a sign of the currency’s strength. This is what we have experienced happening in the market many times.
This upcoming week is expected to be a significant one because important news events will be reported. Let's see how each day will likely develop.
Starting Monday, banks in Japan will be closed in observance of Respect for the Aged Day. In China, banks will be closed in observance of the Mid-Autumn Festival. In both cases, we expected the volatility and liquidity around the Asia Trading Session to be minimal. This means that the spreads might widen. Therefore, day traders need to be aware of that. The next major event for the day will be the speech of the ECB (European Central Bank’s) Chief Economist Lane. It will be interesting to understand how the ECB sees Europe’s near future after preceding a rate cut of 0.55% last week. The last event for Monday will be New York’s State Manufacturing Index. Usually, on Mondays, the markets digest the previous week’s events. As no events today cause the markets to create new market structures and direction moves, we expect the volatility to be as normal during the New York Trading Session.
For the second day in a row, the Chinese banks will close on Tuesday. As the Chinese Yuan is not among our favourite tradable currencies, our trading activity during the Asian trading session will not be significantly affected. During the Asian Trading Session, there won’t be any significant news events. Hence, the volatility is expected to be as normal for the Japanese Yen, the Australian dollar and the Kiwi (short for the New Zealand Dollar). Moving into the London Trading Session, in Germany, they will report the German ZEW Economic Sentiment. This directly affects the Euro, and the consensus estimates a drop from 19.2 to 18.6. Currently, the euro is taking advantage of the weakness of the US dollar.
With the New York Trading Session kicks in, in Canada, they will report the Housing Starts. The forecast estimates a drop from 280K to 247K. This indicates that the new residential construction building that started last month is expected to be reported as lower compared to the building construction that started a few months ago. Right after this event, they will announce the new CPI (Consumer Price Index) number in Canada. As per the forecast, the Consumer Price Index is expected to drop from 2.5% to 2.3%. A lower CPI is always important for lower inflation in Canada. However, it is not considered a positive outcome for the Loonie (Short for the Canadian Dollar), and it is a sign of the Canadian Dollar's weakness. If the CPI is reported as per the forecast, and simultaneously if the market follows through, then it can favour bullish opportunities on the USDCAD or cross-currency pairs like the EURCAD and GBPCAD. At the same time, the markets will be anticipating the Retail Sales report in the US. The forecast shows a much lower number compared to the previous reported number. The last report was at 1%, and this time is forecasted to drop to -0.1%. If the actual report follows the forecast and, at the same time, if the market follows through, which means if the traders and all market participants will sell the USD, we will see further weakness of the Greenback. This will enable training opportunities on the major currency pairs.
All market participants anticipate Wednesday as the FED will report the Interest Rates in the US. But first, during the Asian trading session in New Zealand, they will report on the Current Account. In the last six reports, the number has progressed, which is considered a positive fact for New Zealand’s economy and growth. That time is expected to be reported at -3.9B, a number that is greater than the previous report, which was -4.36 B. The next event will be the Trade Balance in Japan, which is currently at -0.76T and is expected to increase more to -0.97 T. We got used to a strong Japanese Yen in the last few weeks, and this type of event can cause some retracement phase on the price charts. The next significant event will be the CPI (Consumer Price Index) in the UK. The consensus estimates an unchanged number, remaining at 2.2%. The Sterling tends to become a highly volatile currency during these events. Day traders need to be aware of managing positions at the event’s release as the volatility tends to be noticeable.
A directional move is expected to occur on the GBP if the outcome deviates significantly from the forecast. Moving into New York’s Trading Session, in the US, they will report the building permits, and the forecast shows an increase in the number of new residential permits issued last month compared with the previous reported number. The last report was 1.40M, and this time is expected to increase to 1.41M. This will temporarily affect the volatility during the event’s report. The market participants will anticipate the Interest Rates report by the FED towards the end of the New York Session. The interest rates in the US currency are 5.5%. The consensus thought estimates a cut to 5.25%. A few weeks ago, in another Market’s Outlook report, we mentioned that in the next few months, all the Central Banks will proceed to a rate cut, and we’ve seen many of them so far cutting their rates. This time, if the FED drops the Interest Rates in the US and the market follows through, not only will the markets experience unusual volatility around the event’s release, but the USD will also become one of the weakest currencies across the board. It is crucial to understand that there are cases when the markets don't follow through with a significant event outcome, as happened last week with the Euro. Therefore, it's essential to see if the price will move in the same direction as the event’s outcome after the event has been released. In less than an hour after the Interest Rates are reported, the FOMC Minutes and the FOMC Press Conference will occur.
The volatility is expected to increase during the Asian Trading Session on Thursday as New Zealand will report the quarterly GDP (Groos Domestic Products). The forecast estimated a drop from 0.2% to -0.4%. This can negatively affect the Kiwi’s value and overall performance. If the actual report confirms the forecasted numbers, the value of the NZD can be affected negatively. The next significant event will be the Employment Change in Australia, which is expected to be reduced from 58.2K to 25.3 K. This is more than a 50% drop. At the same time, they will release the Unemployment Rate, and the consensus shows that it will remain at its current 4.2%. This can also be considered a negative factor based on the value of the Australian dollar. A weakness can be seen in Australia if the reported number confirms the forecast and, at the same time, if the market follows through. Moving into the London trading session, in Switzerland, they will report the Trade Balance and forecast a drop from 5.05B to 4.89 B. Last week, the Swissy didn’t show much strength across the board. All attention will be on the GBP, as the UK will report its Interest Rates. Currently, the rates are 5%, and as per the forecast, none of the Committee members voted for a rate hike. Out of the 9 Members, only 2 voted for rates cut, and the remaining 7 voted for unchanged rates. Therefore, it will be important to see how Sterling will react to this outcome. Usually, unchanged Interest Rates are considered as a weakness for the currency, and the currency’s value tends to depreciate. The next important event will be the Unemployment Claims in the US, and the forecast shows an increase from 230K to 232K. The next event will be the Existing Home Sales in the US, and the consensus estimates a drop from 3.95M to 3.90M. If the US Dolla’s weakness continues, we might see a further price decline on the charts.
On Friday, during the Asian Trading Session, volatility is expected to increase significantly because Japan will report its Interest Rates. The forecast shows unchanged rates, and the Bank of Japan is expected to keep them at 0.25%. As we said earlier, if the interest rates remain unchanged or drop, the currency becomes weak. At the same time, the BoJ will make the Monetary Policy Statement available. We will know how they see the Future of Japan’s economy and how they decided to proceed with the decision about their Interest Rates today. The next important event for the day will be the PPI (Producer Price Index) in Germany. The forecast shows a decrease from 0.2% to -0.1%. If the reported number confirms the forecast, we expect to see weakness in the Euro currency. At the same time, the UK will report its Retail Sales, and the consensus estimates a drop from 0.5% to 0.2%. If the forecast is confirmed and the Sterling becomes weak due to yesterday’s Interest Rates report, we might see more weakness in the GBP. Moving on to New York’s trading session, the Bank of Canada’s Governor Maclem, the ECB President Legarde and the FOMC Member Harker will give a speech. Friday will end with the Retail Sales report in Canada, and the consensus estimates an increase in the number from -0.3% to 0.3%. If the actual reported number confirms the forecasted number and the market follows through, the Canadian Dollar could become the strong currency to focus on during the New York Trading Session.
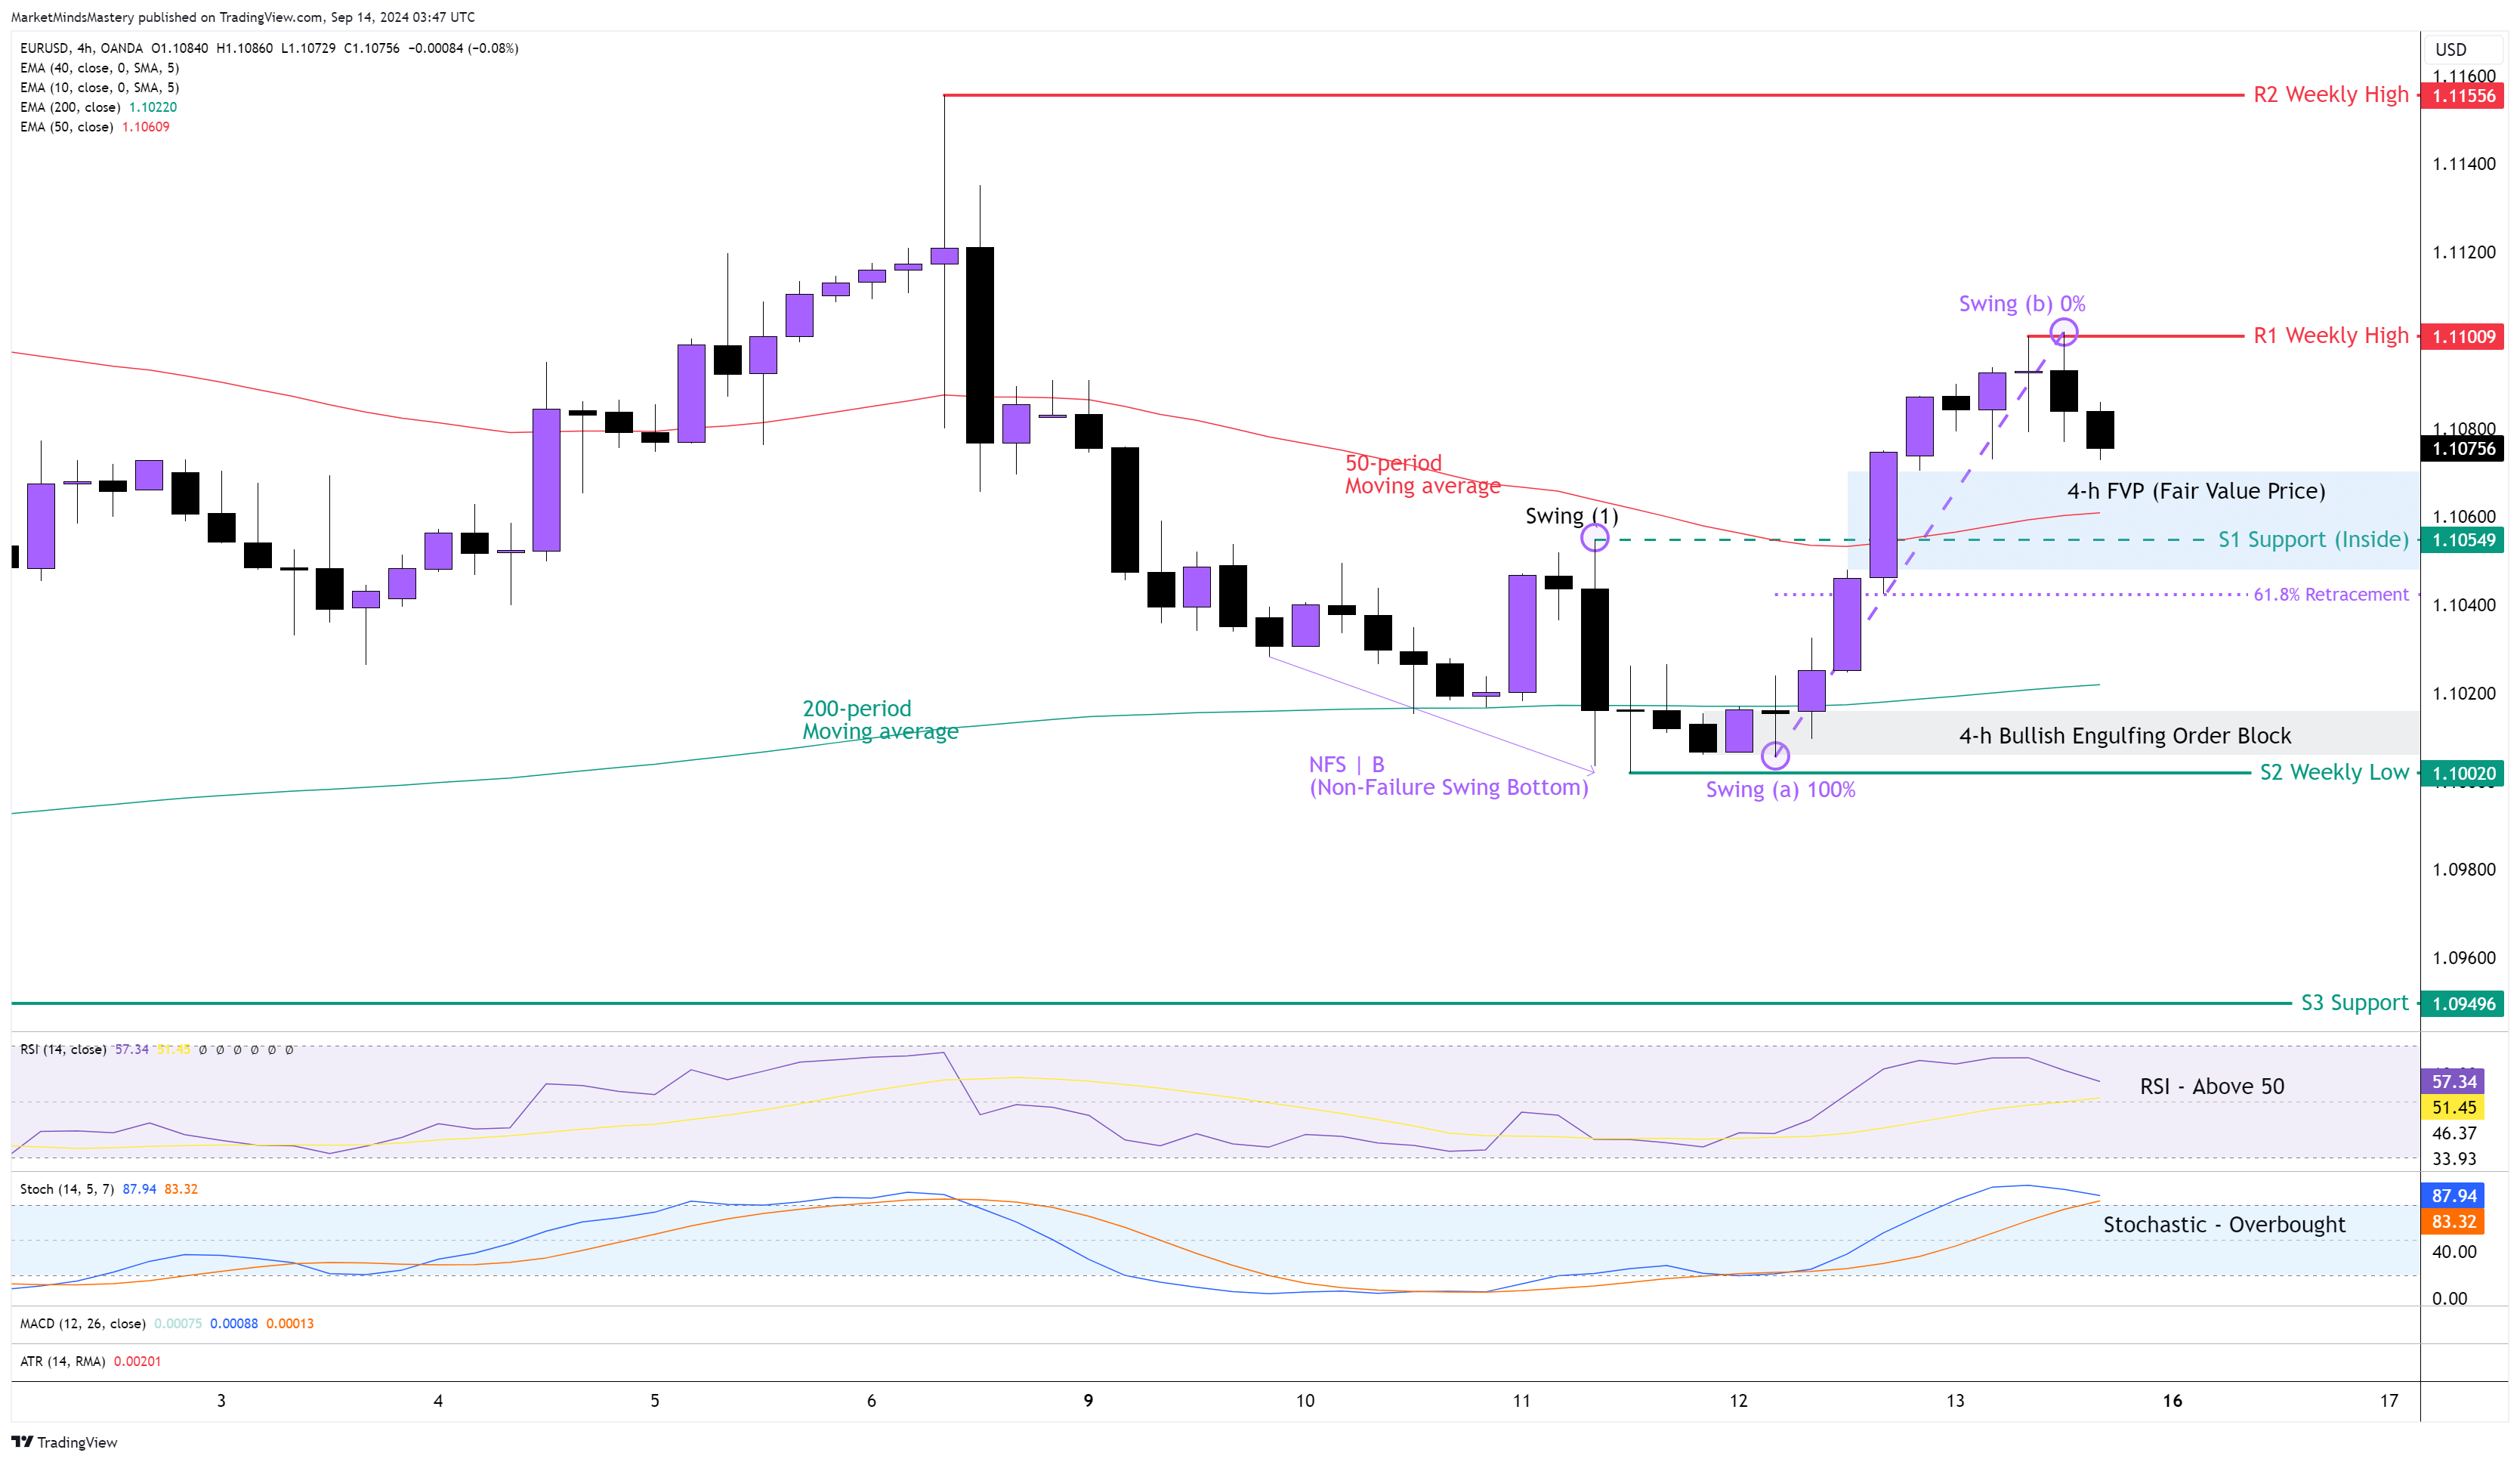
EUR USD 4H

Following the downward price move that started last Monday, the price on Wednesday created an NFSB (Non-Failure Swing Bottom). It then penetrated the swing high at (1), as we show on the chart above, creating a higher high. The weekly chart is in an uptrend, as per the swing analysis, as it maintains its higher high and higher low formation. The price action on the weekly chart is completed as a candle with a small body and a Long-Lower Wick, which usually has bullish implications. The 50-period is above the 200-period moving average, and this has bullish implications. The RSI oscillator is above 50, which indicates bullishness. Additionally, the Stochastic Oscillator is overbought, which is also bullish. Last Thursday, the price created a Bullish Engulfing Order Block on the 4-hour chart around 1.10 and an FVP (Fair Value Price) around 1.1060.
The price started a retracement, and if it continues to move downwards, the FVP area may be filled, and the price can move to the first support area, S1, which will be an inside support of around 1.10459. This level consists of the penetrated swing high (shown as swing (1) on the chart) and the 61.8% Fibonacci retracement measuring the price move from swing (a) to swing (b). If the price penetrates the support level at S1 and declines further, the next support area, S2, will be around 1.10, which is the previous week’s low.
On the other hand, if the price finds support around 61.8% and bounces off and moves upwards away from the support, the first resistance area, R1, is approximately 1.1010, which is the previous week’s high. If the market continues its upward move, it must move above R1, and then the following resistance area, R2, is another weekly high, approximately 1.1155.
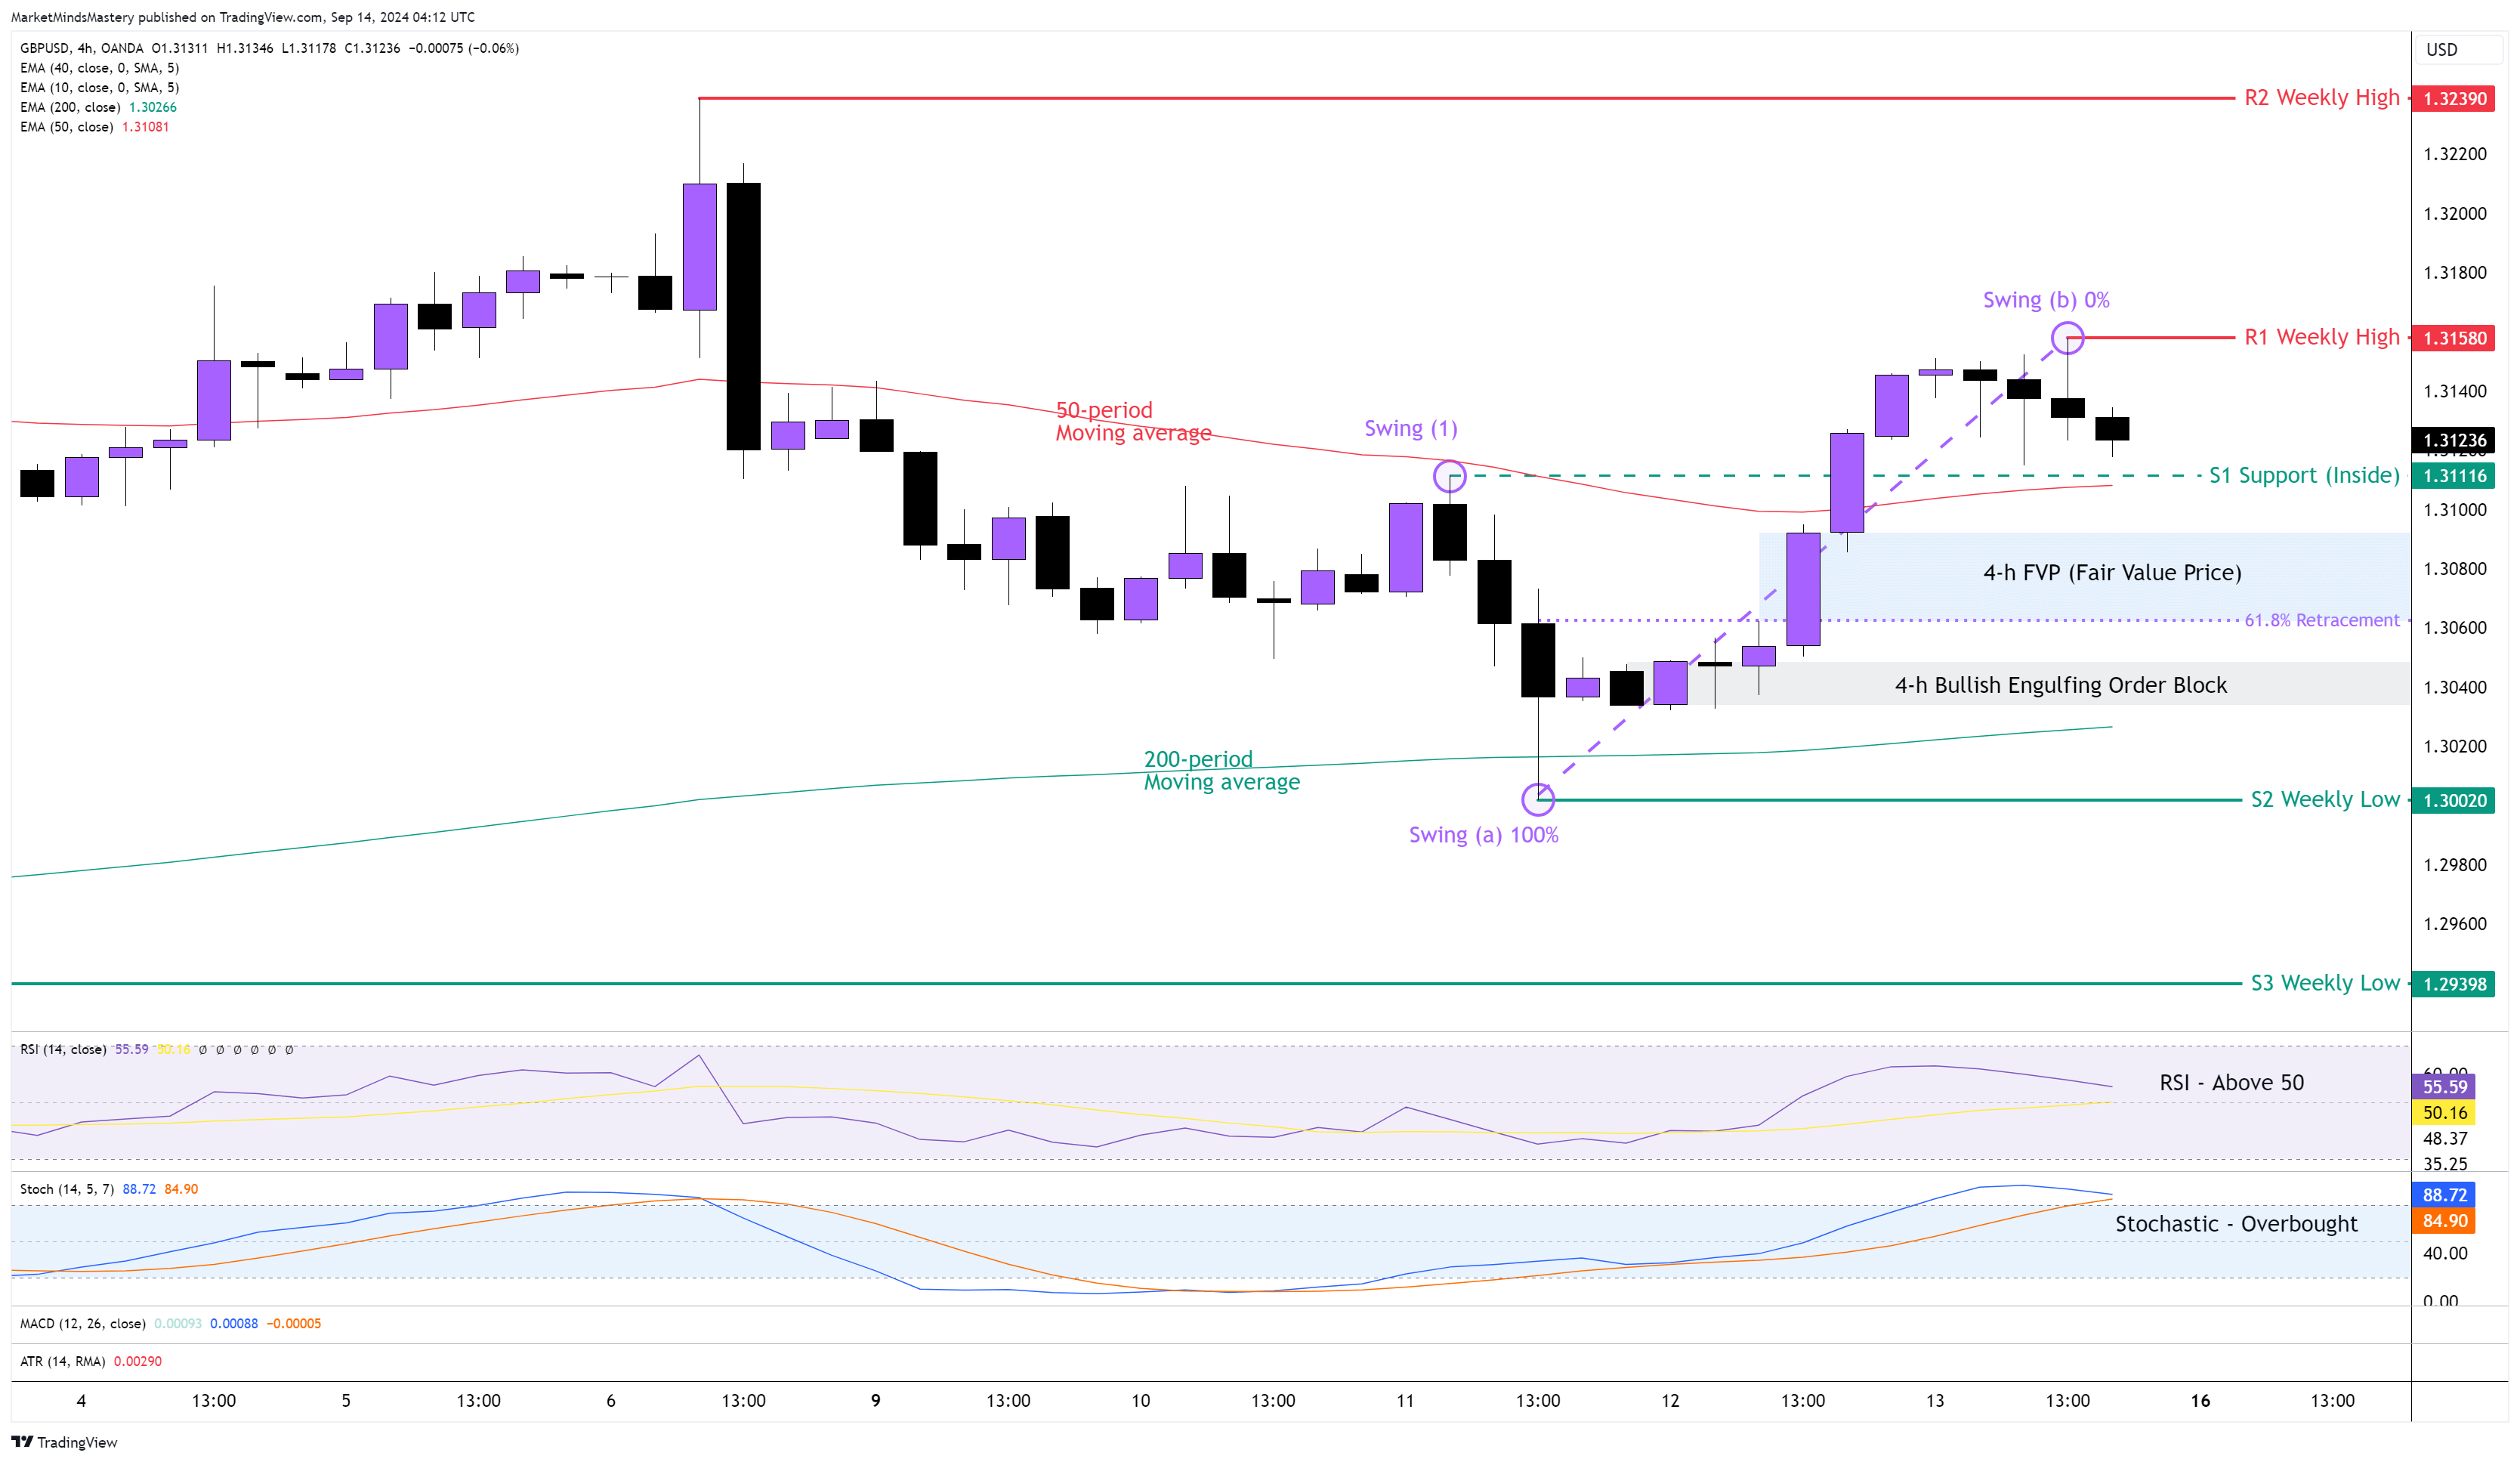
GBP USD 4H
Sterling performed well in the market last week. The weekly chart shows an upward trend as the price maintains a series of higher highs and lower lows, as well as because the 10-period is above the 40-period moving average (not shown on the chart above). The weekly price action shows a Dragonfly candlestick pattern. It has bullish implications because it's within the context of an uptrending market. The price in the GBPUSD currency pair created a new market structure on the 4-hour chart. Last week, the price penetrated the swing at point (1) and created a new high. The 50-period moving average is above the 200-period, and this has bullish implications. Also, the price closed above the 50-period moving average, indicating a bullishness. The RSI is above its middle line of 50, and this is bullish. The Stochastic Oscillator is in an Overbought condition, indicating the bullish strength in the currency price move. Starting Monday, if the price continues moving downward, the first support area, S1, will be an inside support of around 1.3111. This is at the same level as the 50-period moving average. If the price declines further, it might fill up the FVP (Fair Value Price) area around 1.3080. Around 1.3060 is the Golden Ratio 61.8% of the Fibonacci Retracement, which can become a support level. If the price keeps moving downwards, there is a Bullish Engulfing Order Block around 1.3040. A further downward move finds the next support area, S2, around 1.300, which is the previous week’s low. Opposively, if the price bounces off and moves upwards, the price will find the first resistance area, R1, around 1.3158, which is the previous week’s high. If the price continues its upward move, closes above the R1, and moves higher, the next resistance area, R2, becomes an older week’s high of approximately 1.323390.
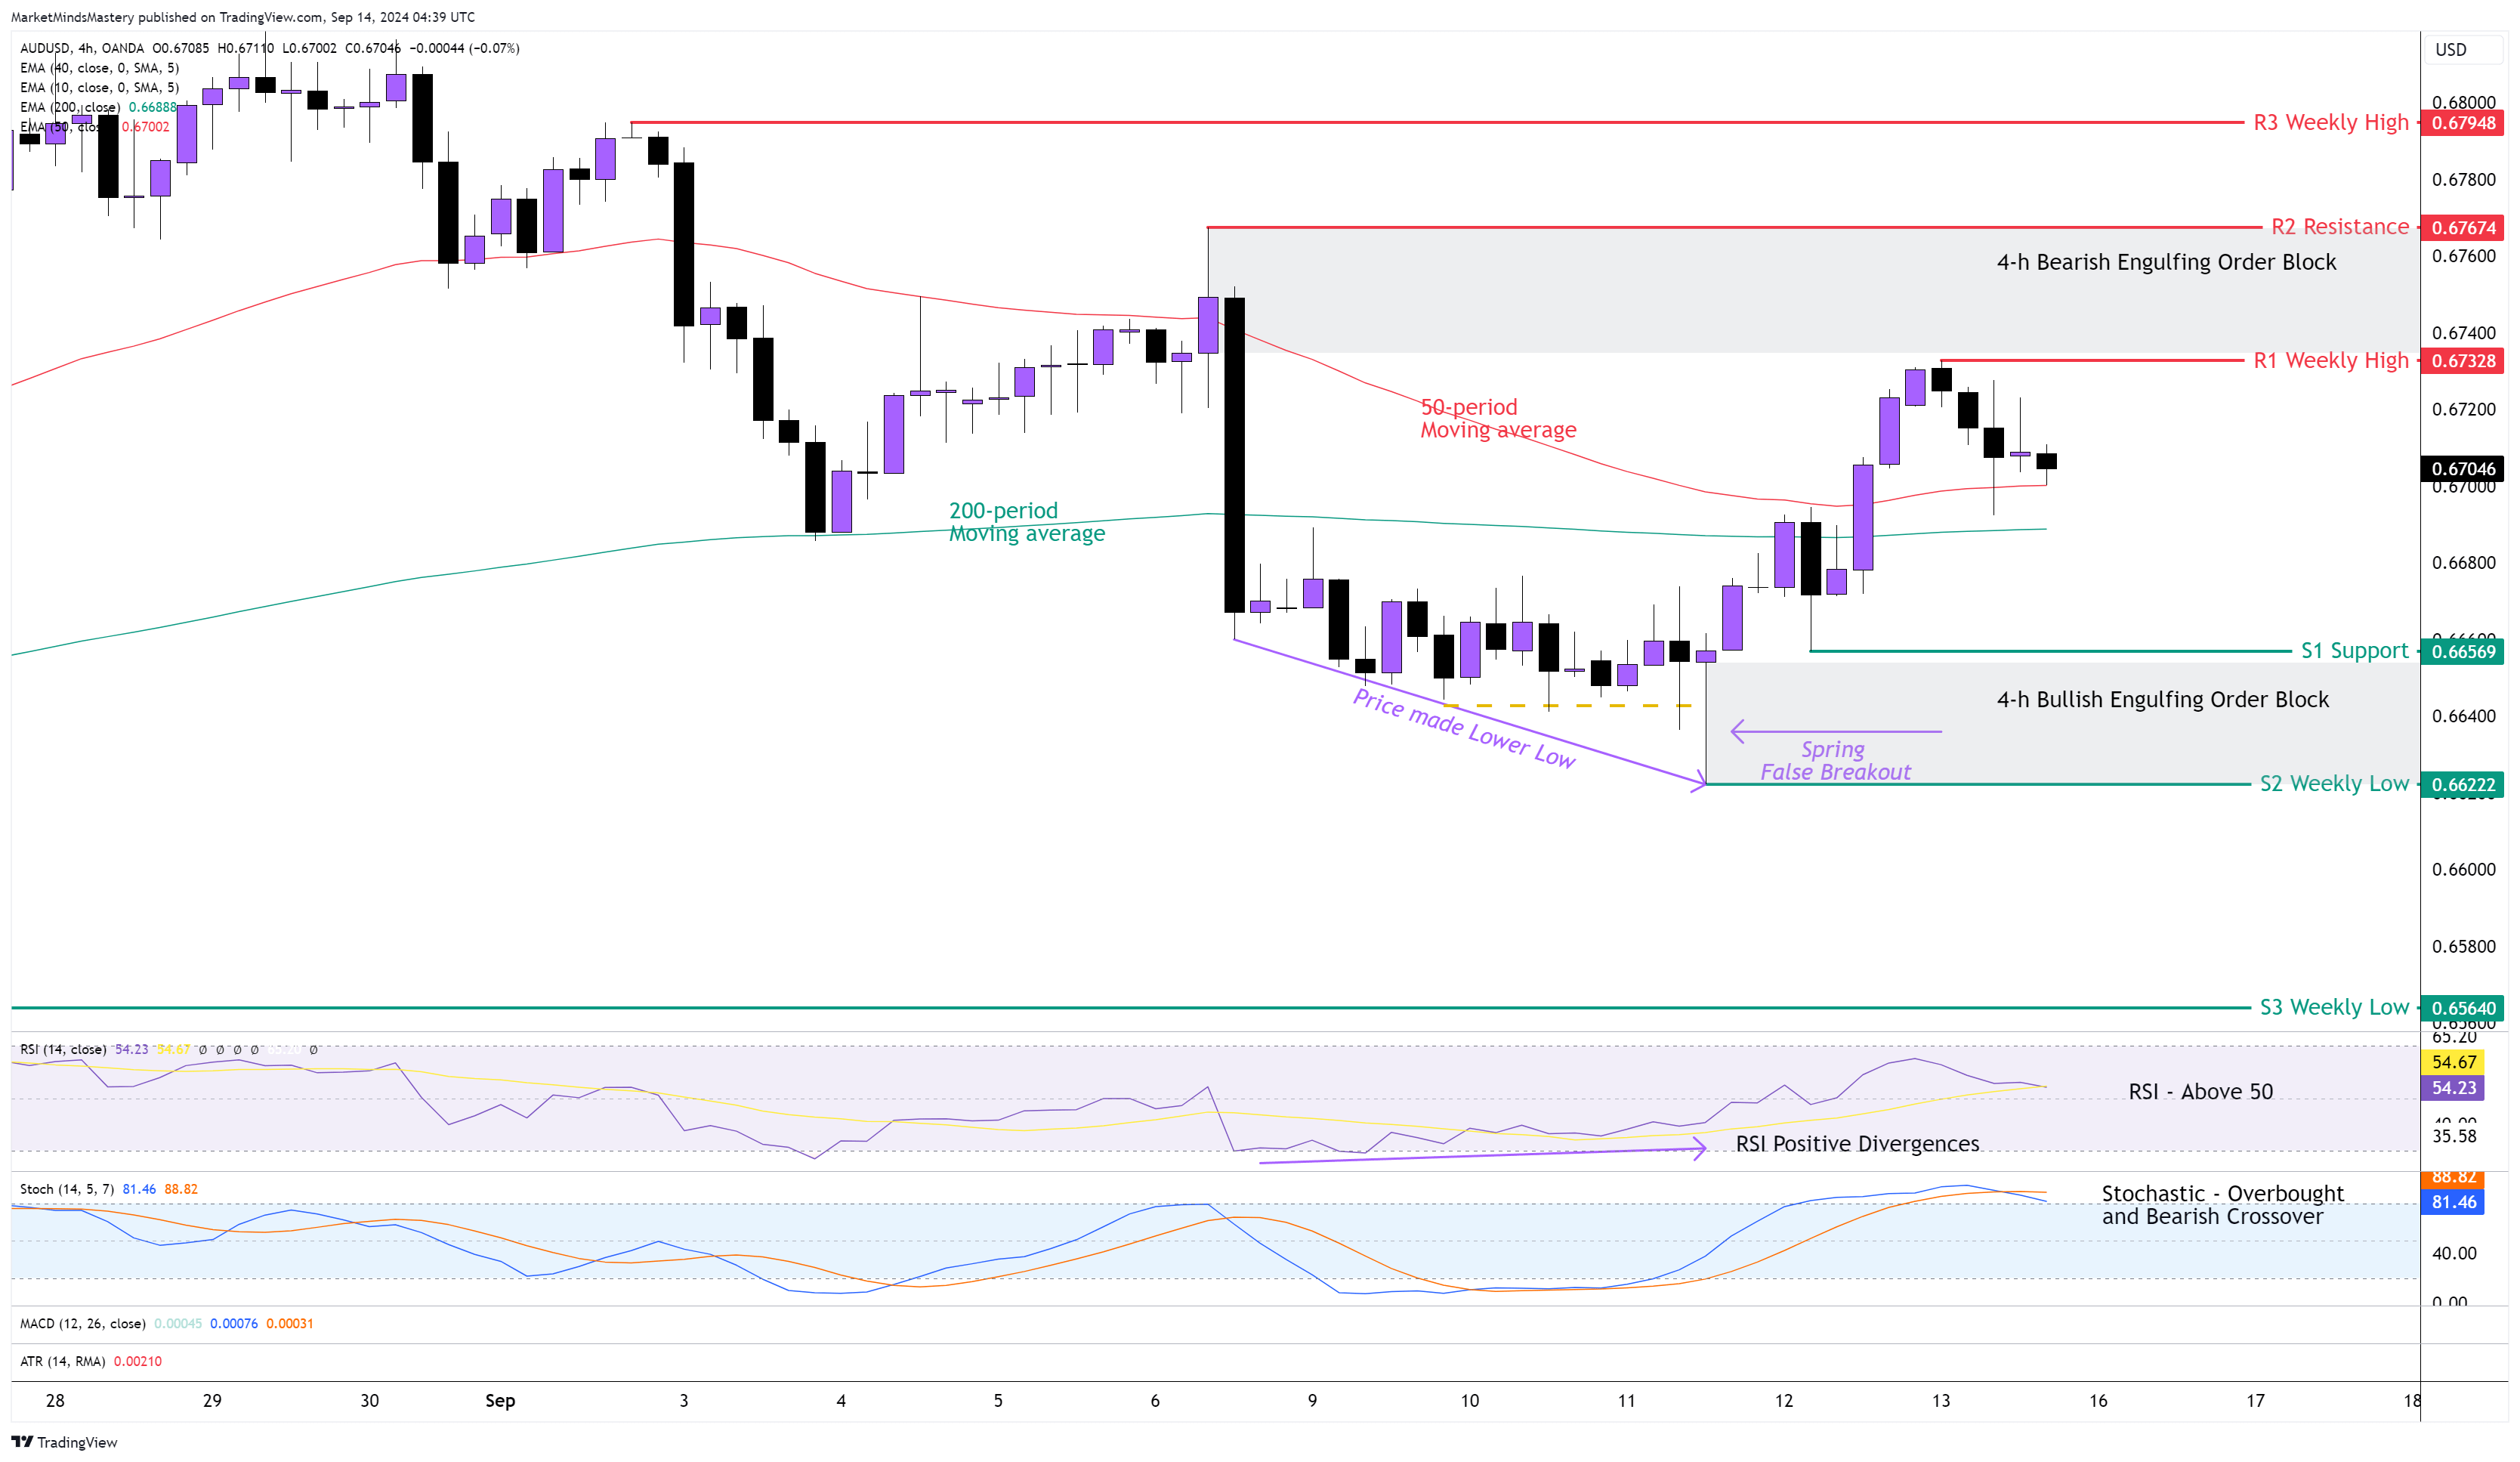
AUD USD 4H
The price action at the end of the previous week created a Bullish candlestick pattern on the Weekly chart. The weekly chart is still in a trading range. On the 4-hour chart, the price created a lower low formation last Wednesday, but the Spring chart pattern caused the price to move downwards temporarily, creating a False Breakout. Then, the price bounced off and moved upwards until the Bearish Engulfing Order Block we pointed out in the last week’s Market Outlook. That caused the RSI Oscillator to show Positive or Bullish Divergences A’ Class. Currently, the RSI is above its middle line of 50, which indicates bullishness. The Stochastic Oscillator is in an Overbought condition, which is an indication of a price strength in the AUDUSD currency pair. At the same time, the %K Line (Blue) crossed below the %D Line (Orange) while the Oscillator is in an Ovebough condition, and this has bearish implications, at least temporarily. The 50-period moving average is above the 200-period, and this is bullish.
Currently, the price trades above the 50-period and the 200-period moving averages. Suppose the price declines further and penetrates both moving averages. The first support area, S1, will be around 0.66569. A Bullish Engulfing Order Block is resting below this level and hasn't been tested yet. If the price decisively penetrates the S1 support and moves under it, the next support area, S2, is last week’s low, approximately 0.66222.
On the other hand, if the price bounces off and moves upward, the first resistance, R1, will be the previous week’s high of approximately 0.673228. If the price penetrates the R1 and moves higher, the next resistance, R2, will be around 0.67674. In case the price also penetrates the R2 resistance and keeps increasing, the next resistance area, R3, will be around 0.67948.
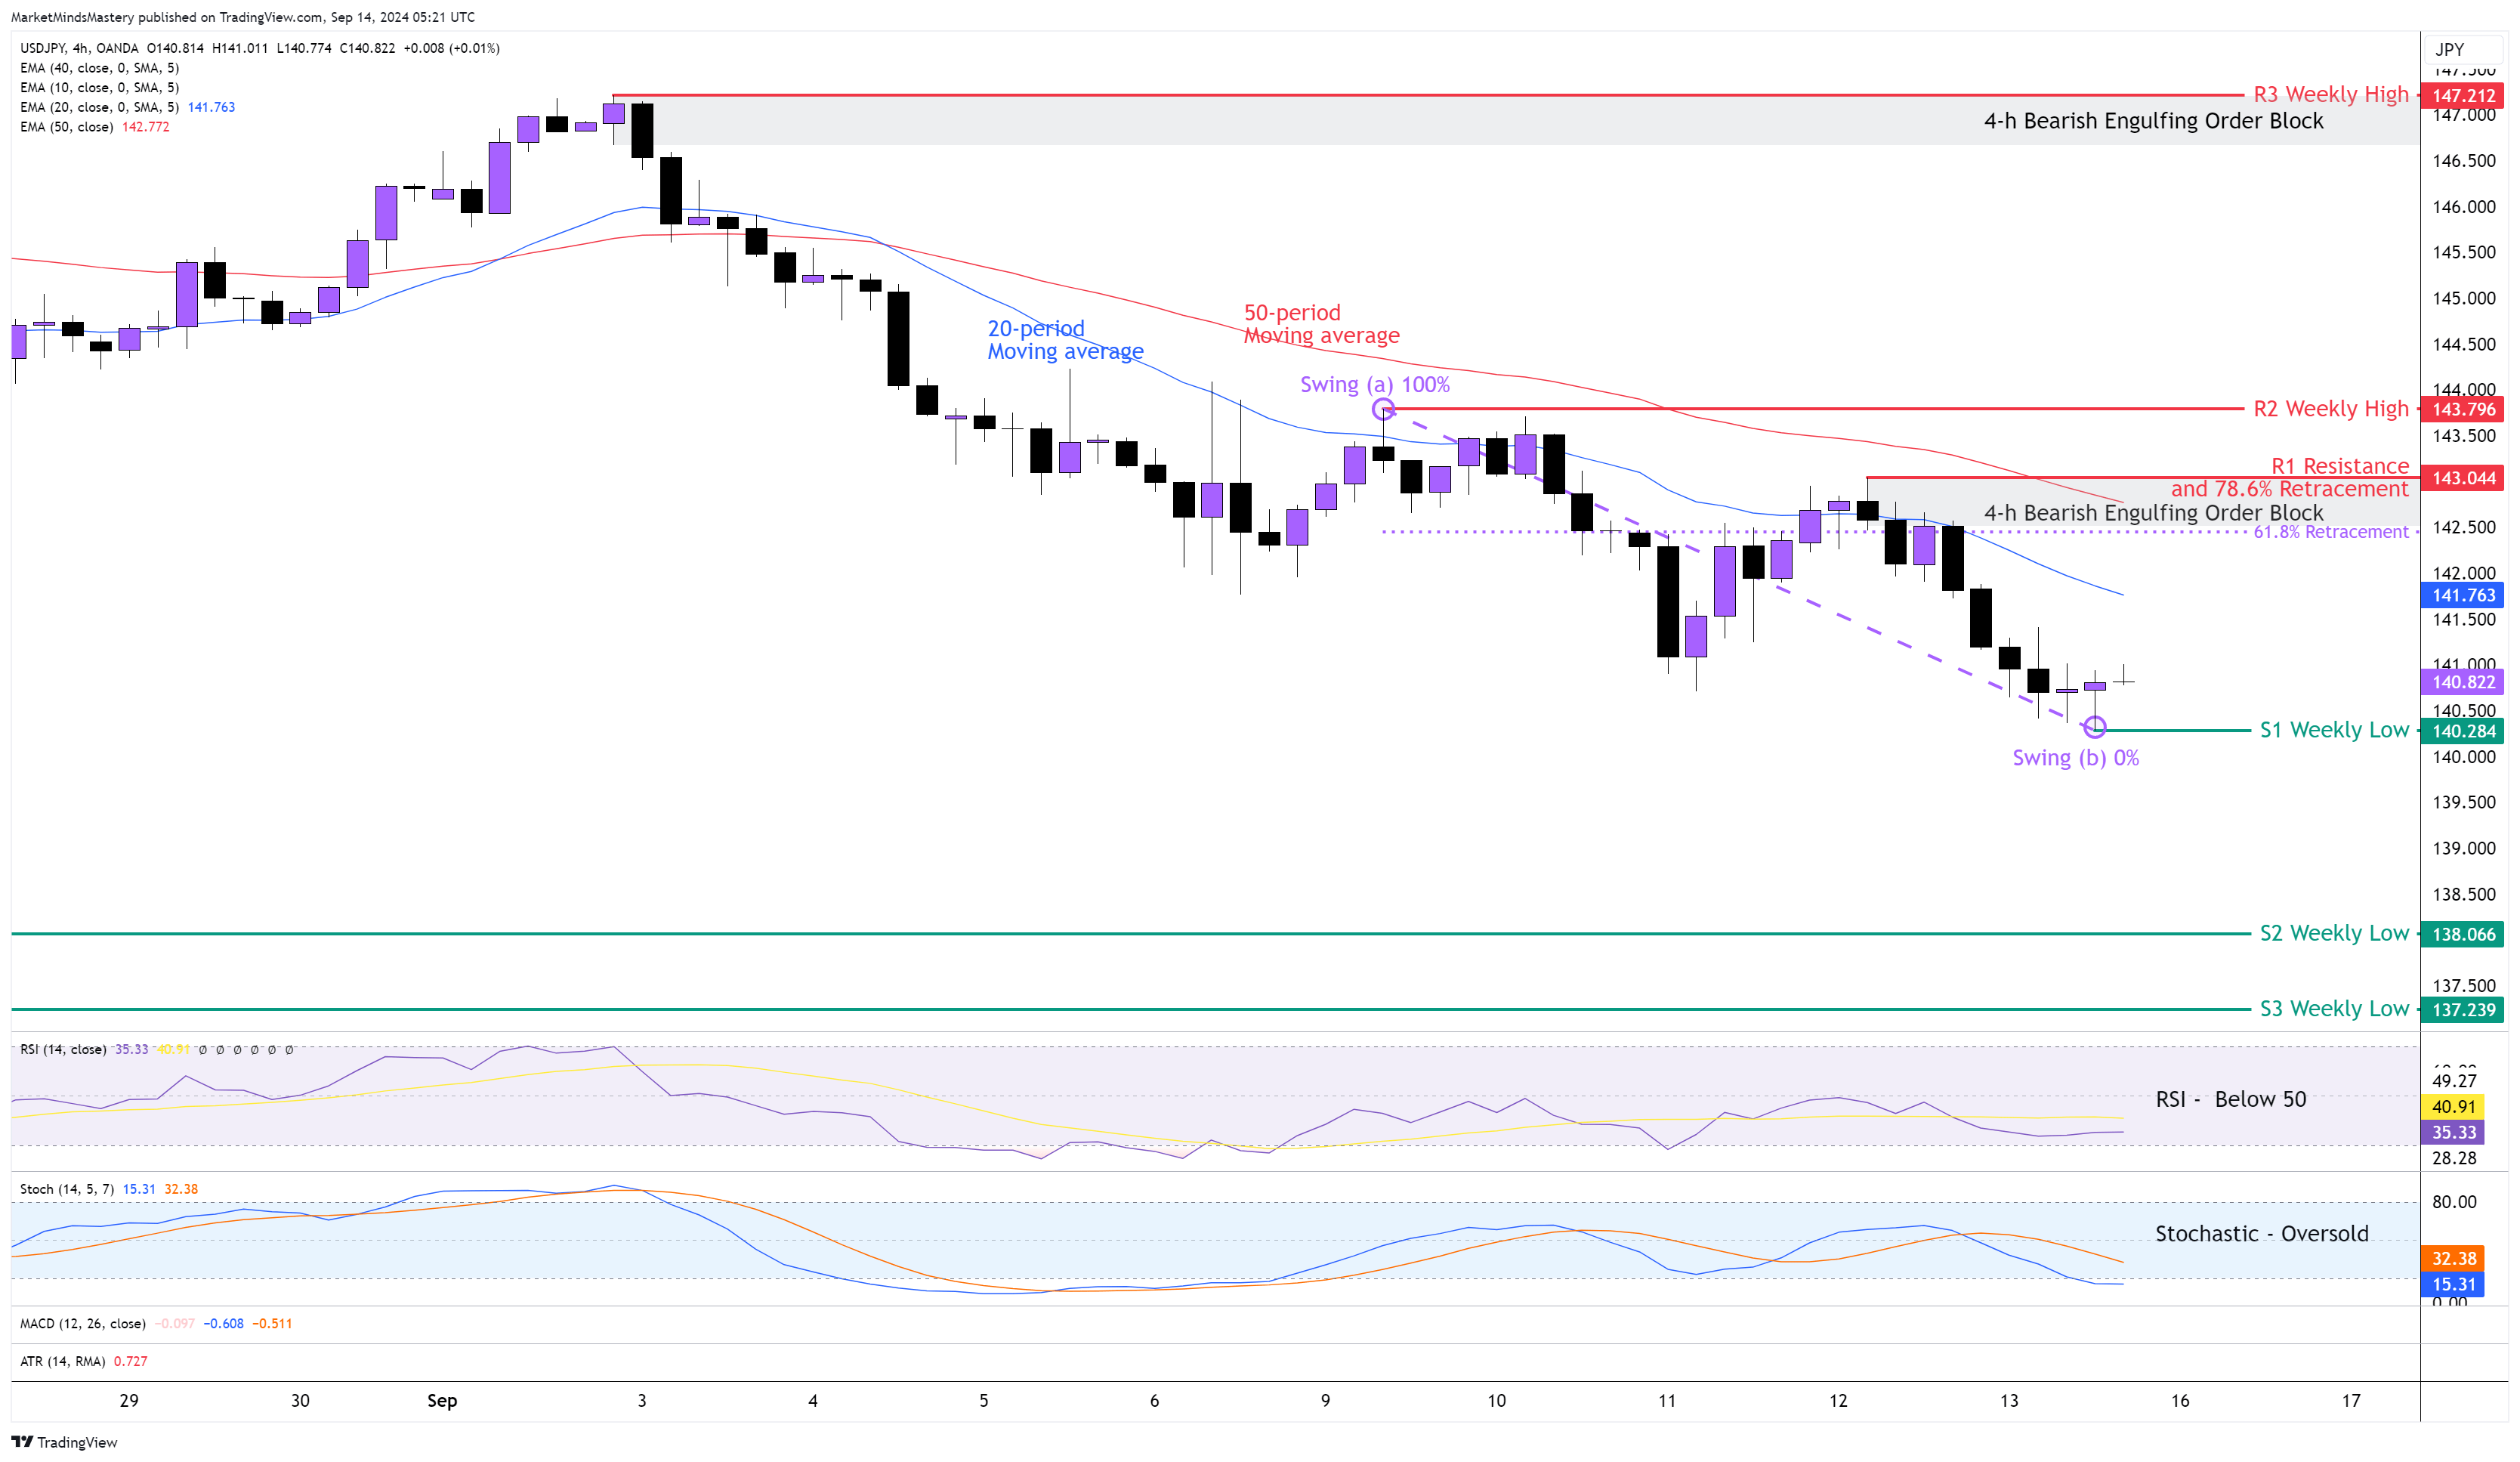
USD JPY 4H
Following last week's continued decline of the USDJPY currency pair, the price kept moving downwards. The Bearish Engulfing candlestick pattern we explained in last week’s Market Outlook played out well and forced the price on the 4-hour chart to create a new series of lower highs and lower lows. The 20-period moving average is below the 50-period, and this is bearish. The RSI is below its middle line of 50, which indicates bearishness. The Stochastic Oscillator is in an Oversold condition, and this is bearish. As the price is downtrending and last Friday was a confirmed swing low at point (b), we can use the Fibonacci Retracement tool to estimate the level of retracement if the currency’s pair downtrend will continue. Starting Monday, if the price enters into a retracement phase and moves upwards, the first resistance area, R1, will be approximately 143.044. This level coexists with the Fibonacci retracement levels between the 61.8% and 78.6%, the 50-period moving average and the 4-h Bearish Engulfing Order Block. In case the price penetrates the R1 and keeps moving upwards, the next resistance area R2, will be the previous week’s high, around 143.796. If the price penetrates the R2 resistance, it will end the downtrend. Conversely, if the price continues the downtrend, the first support area, S1, will be around 140.28, which is the previous week’s low. If the price moves below the S1 support, the next support area, S2, will be an older weekly low price level of around 138.066.
USD CHF 4H
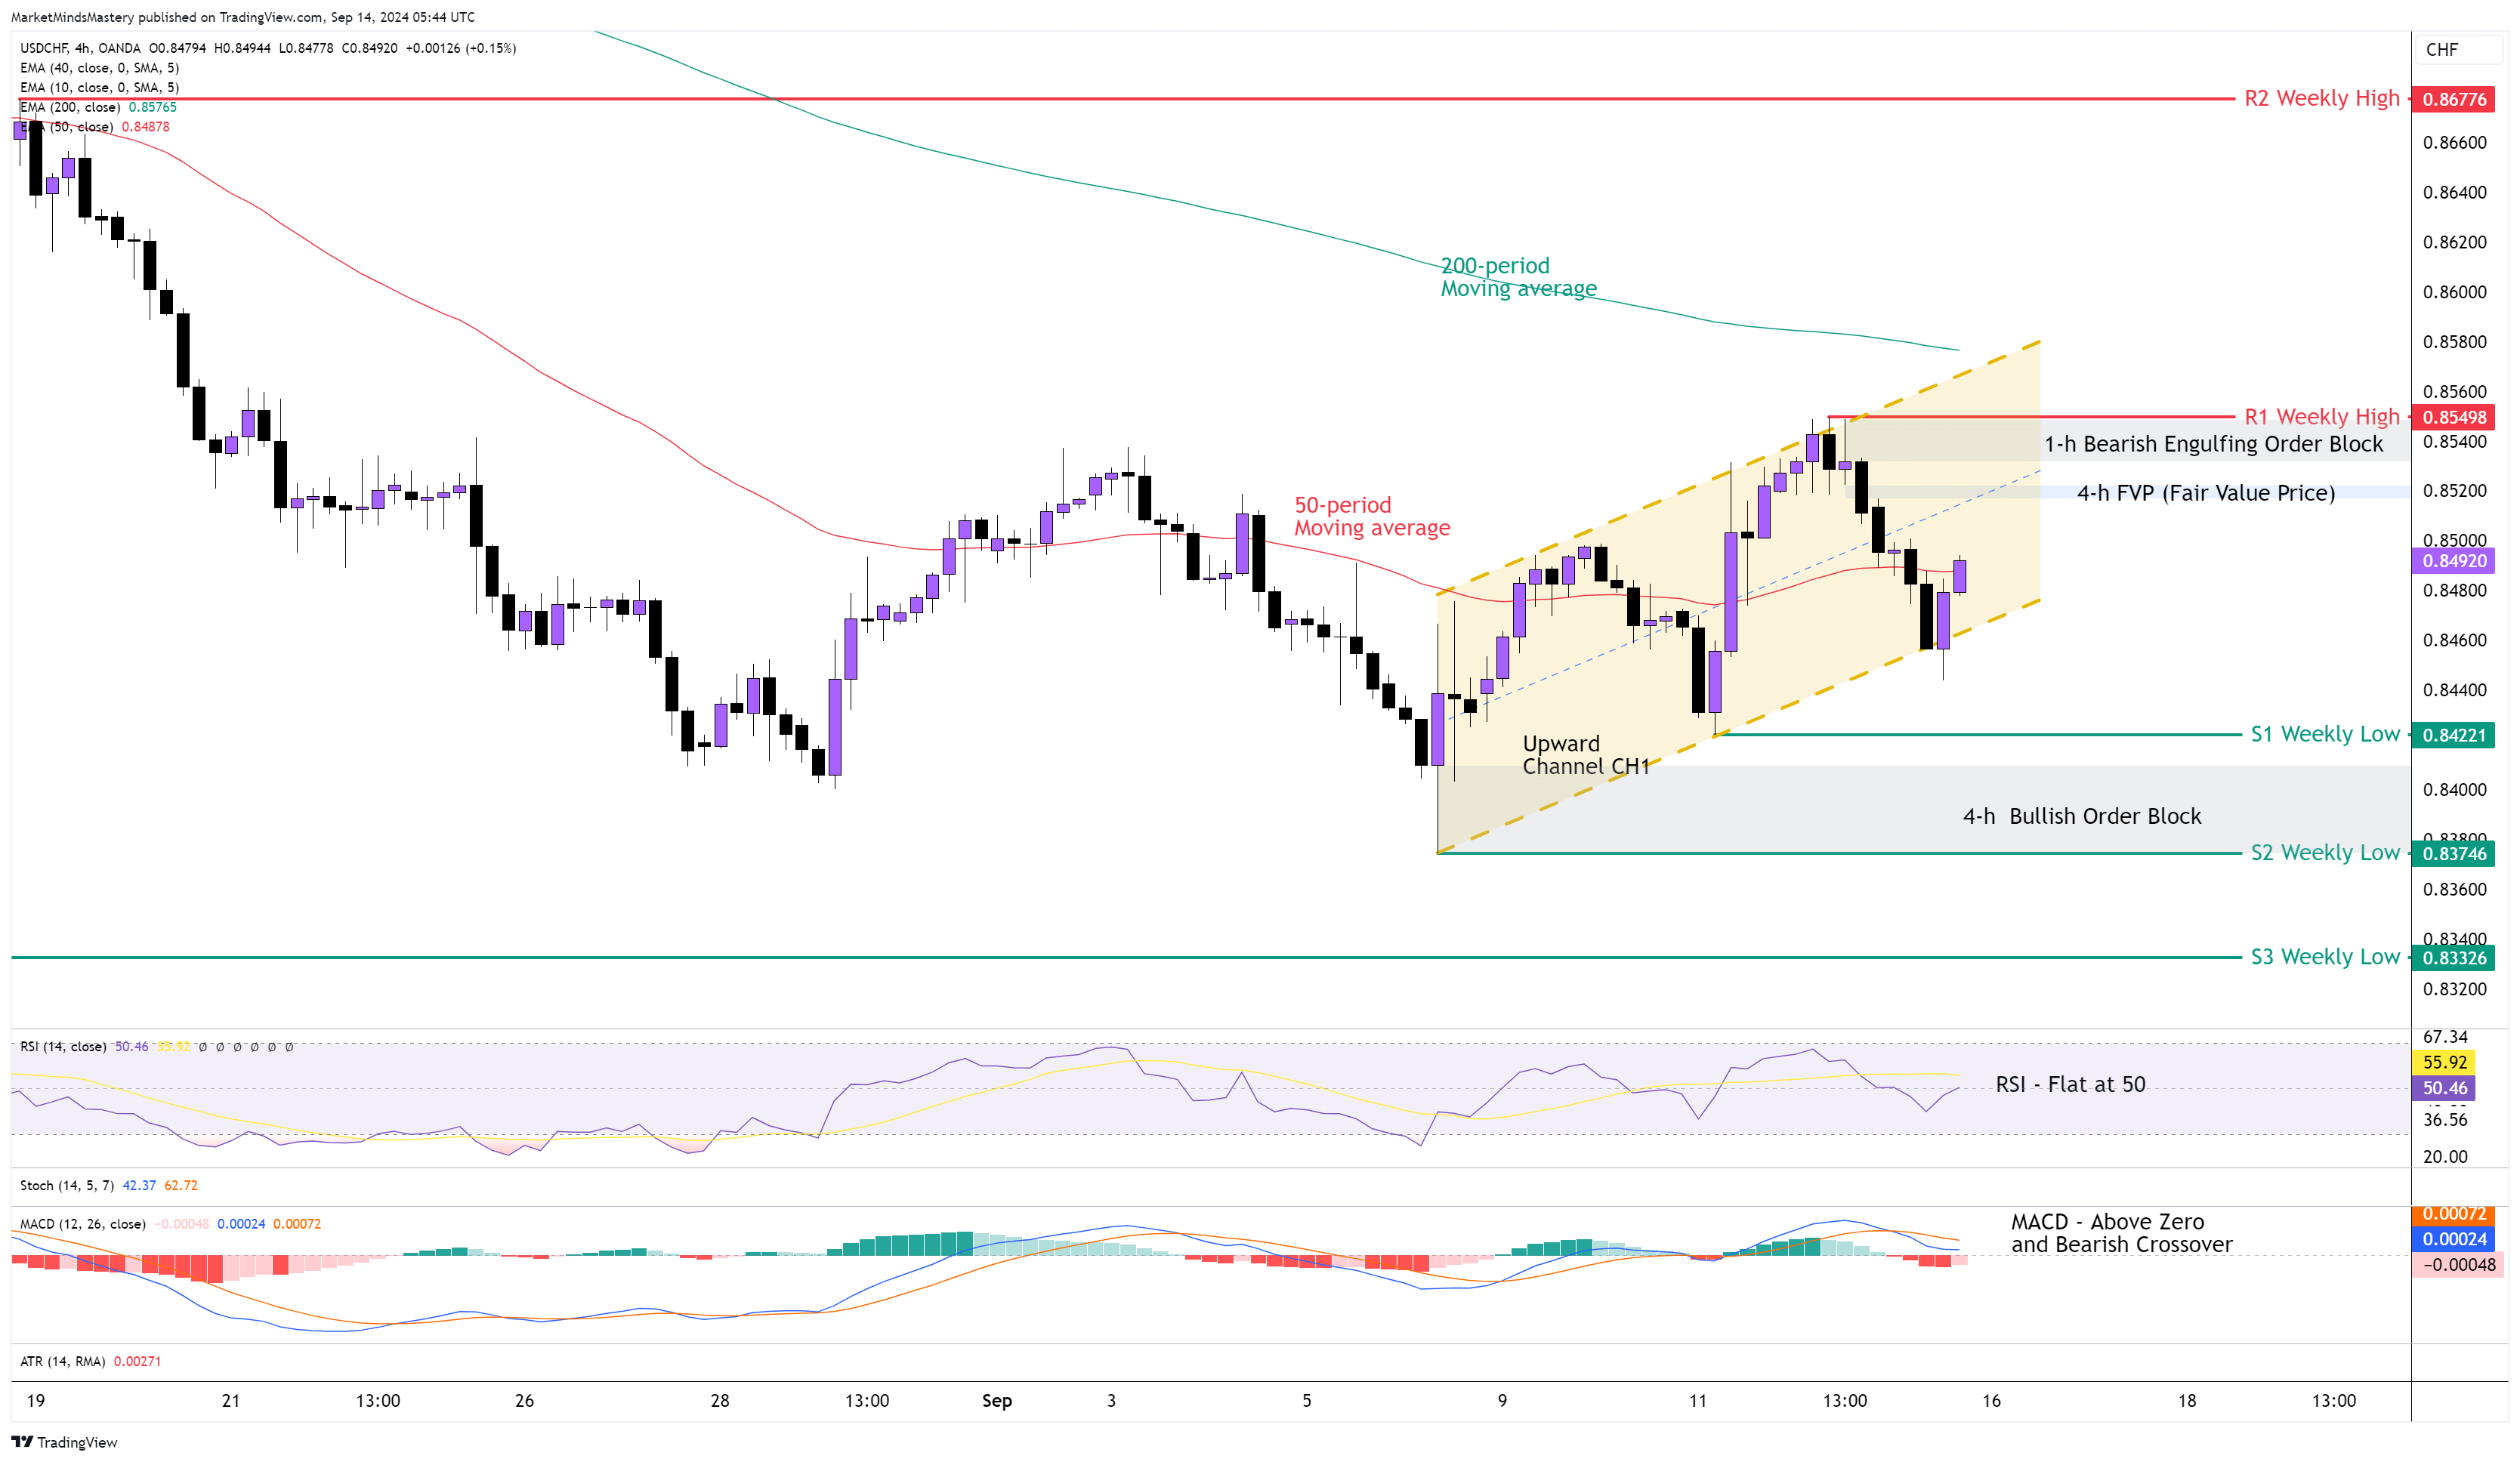
Following the weekly chart’s downtrend last week, the price on the USDCHF currency pair’s on the weekly chart ended as a Bullish candle. Additionally, as per the swing analysis, the market created a swing low formation. On the 4-hour chart, the price is trading within an Upward Channel CH1. As the primary trend (from the weekly chart) is down, the 50-period moving average on the 4-hour chart is below the 200-period moving average, and this has bearish implications. The RSI is flat around the middle line of 50. The MACD is above its zero line with a Bearish crossover, as shown on the chart.
Starting Monday, if the price moves upwards, it might fill up the FVP (Fair Value Price) around 0.85200. The previous week’s high will be the first R1 resistance, approximately 0.85498. A Bearish Engulfing Order Block of the 4-hour chart was found in that area. If the price penetrates the R1 resistance and keeps its upward move, the next resistance area, R2, will be around 0.86776, which is an older weekly high.
On the other hand, if the price will move downwards, the first support area, S1, will be around 0.84221. If the price penetrates the S1 and keeps lowering, the next support area, S2, will be the previous week’s low, around 0.83746. A Bullish Order Block is resting above this level and hasn't been tested yet. If the price penetrates the S2 support and keeps moving downwards, the next support area, S3, will be an older weekly low price level of around 0.83326.
GBP JPY 4H
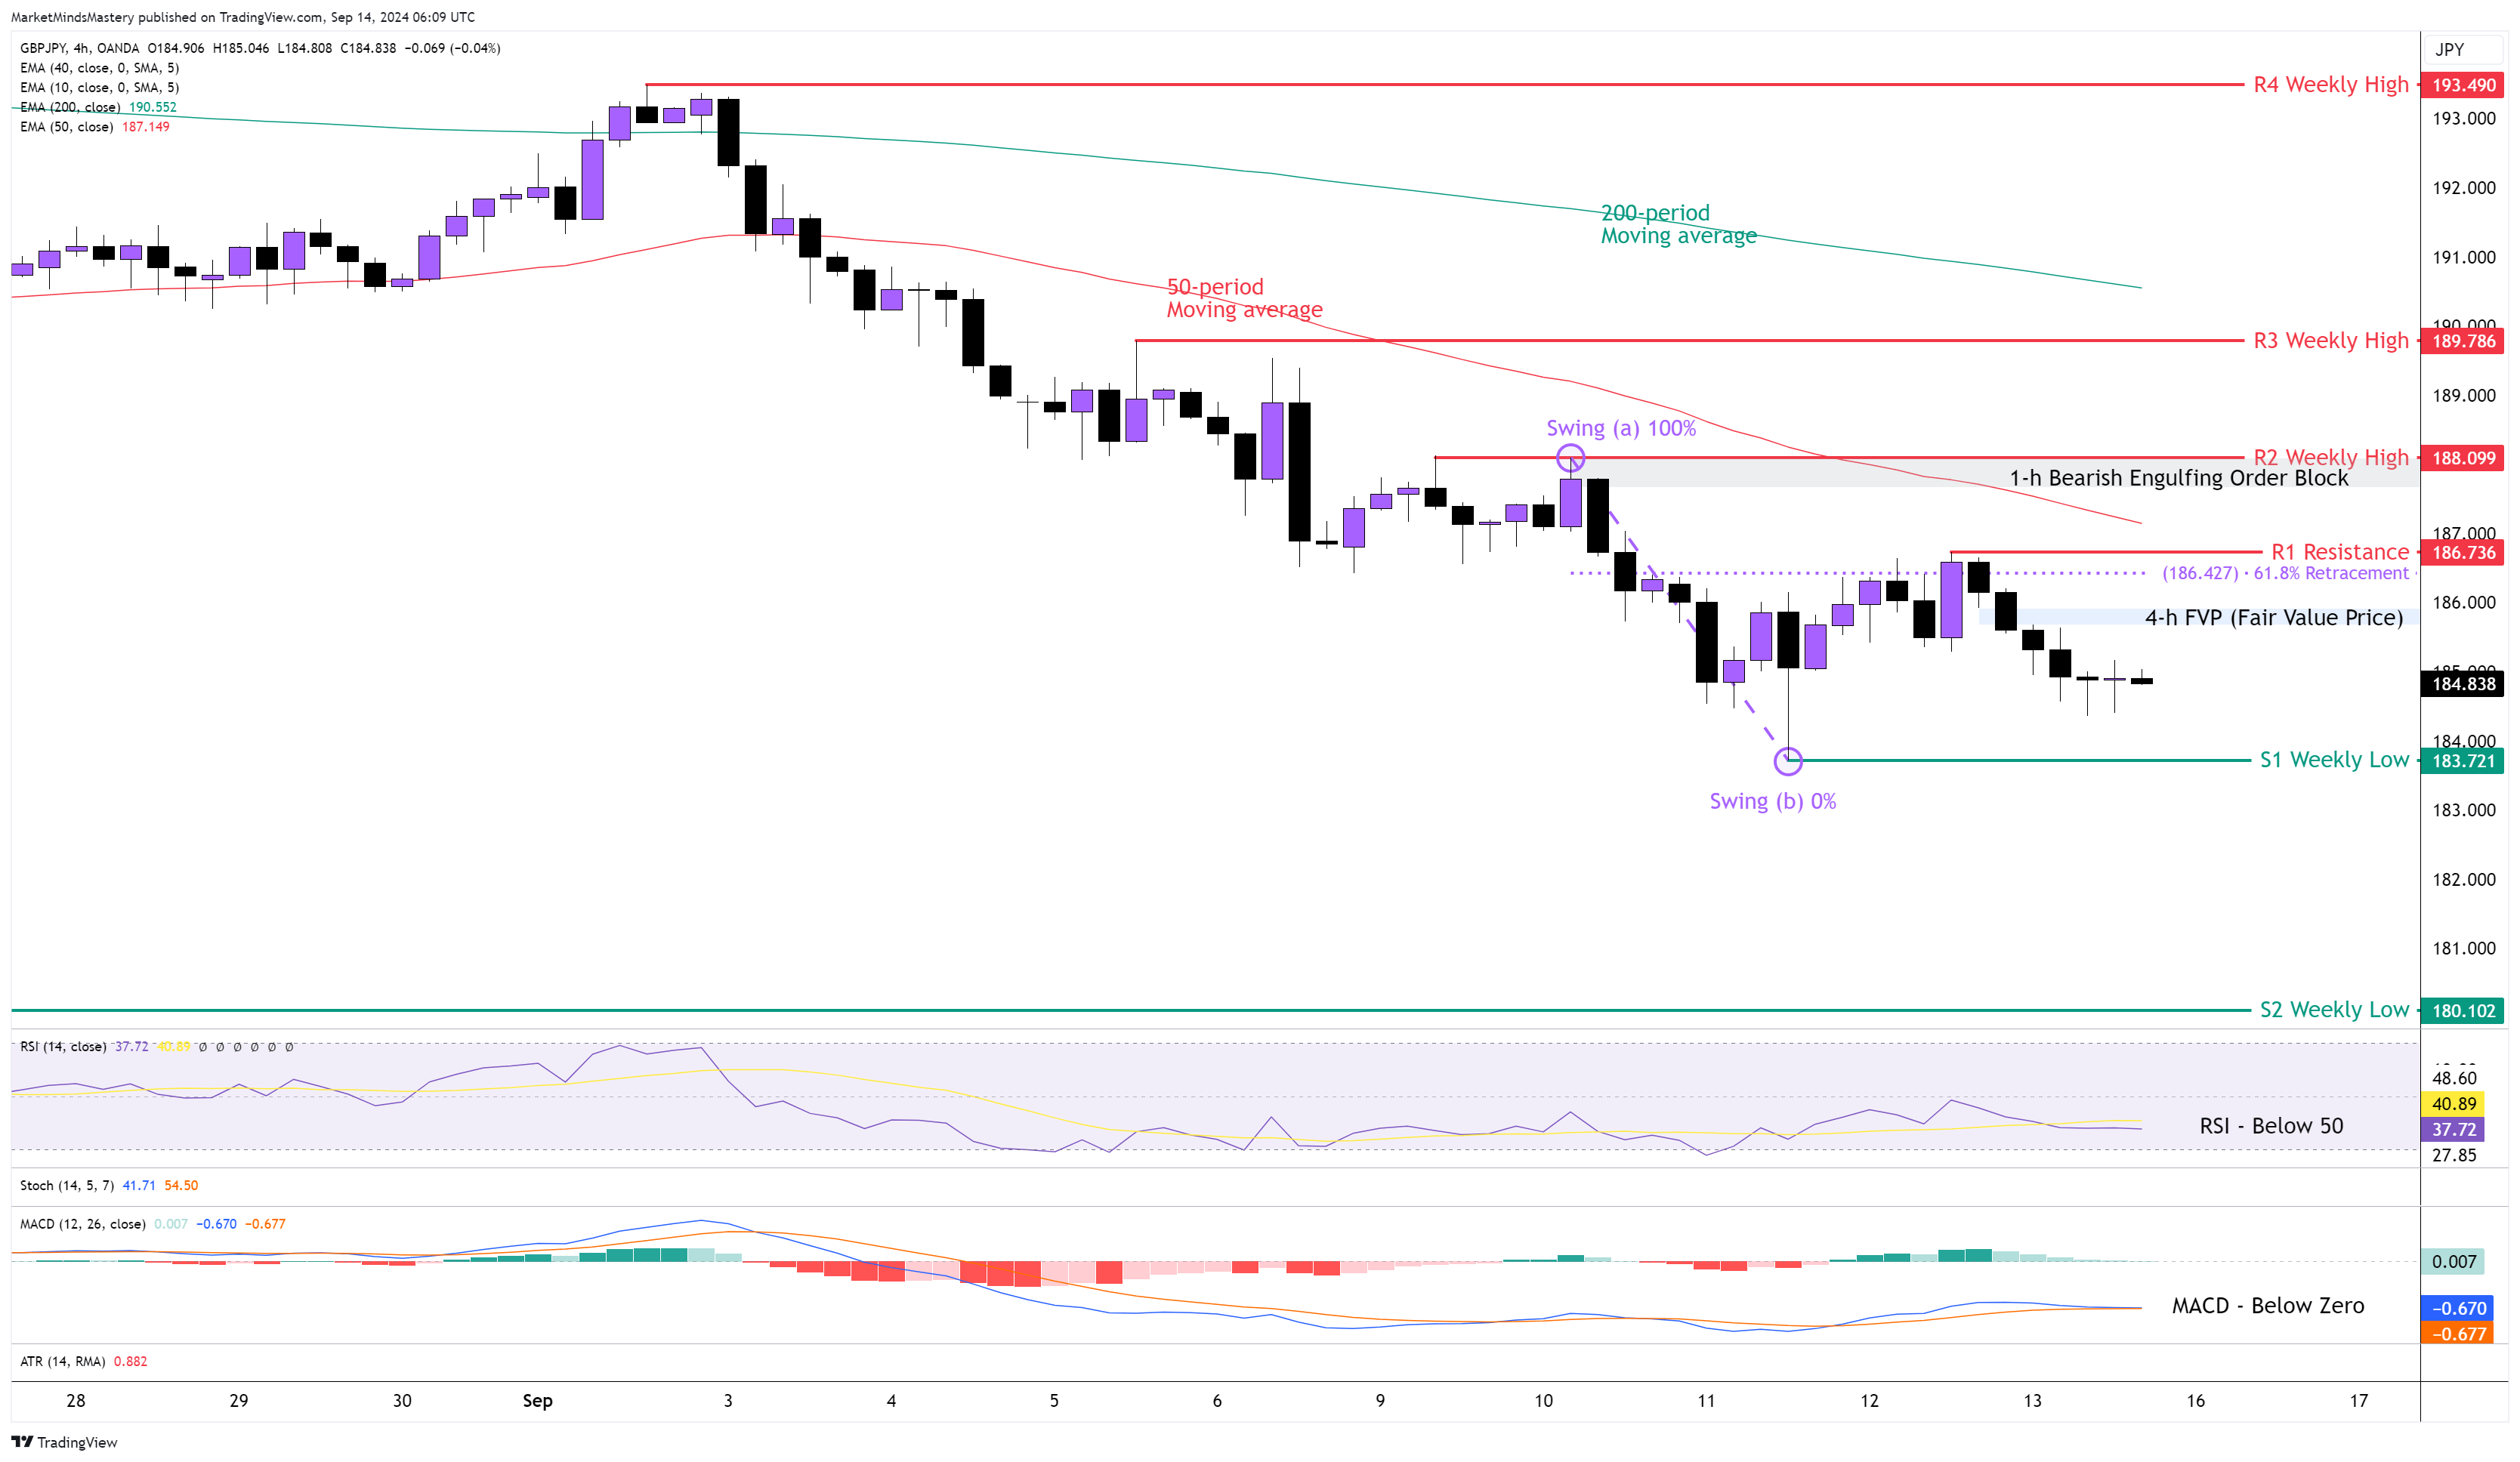
Following last week’s price action, which was a Bearish Engulfing, it followed through, and the price kept moving downwards. On the 4-hour chart, the price kept the lower highs and lower lows formation, and the downtrend is clearly visible in this time frame. The 50-period moving average is below the 200-period, and this is bearish. The RSI Oscillator is below its middle line of 50, and this has bearish implications. The MACD is below its zero line, which is bearish. Both MACD’s lines, the Signal Line (Orange) and the MACD Line (Blue) are flat, touching each other, and this shows that the prices didn't make a directional move in the past few periods on the 4-hour chart. Last Tuesday, a Bearish Engulfing Order Block was created around the 188.00 price level on the hourly chart. Additionally, last Thursday, an FVP (Fair Value Price) was created around the 186.00 area.
Starting Monday, if the price continues to move downwards, the previous week’s low will be the first S1 support, approximately at 183.72. A break and rally below the S1 support allows the price to move downwards until the S2 support, around 180.10, which is another weekly lower price level.
Oppositely, if the price meets buying pressure and moves upwards, the first resistance area, R1,
It will be around 186.736. This price level coexists with the Golden Ratio of 61.8% of the Fibonacci retracement from the swing (a) to the swing at point (b) and the 50-period moving average. If the price penetrates the R1 and keeps increasing, the next resistance area, R2, will be the previous week’s high, around 189.09. In case the price penetrates the R2 resistance and moves upwards, the next resistance, R3, will be an older weekly high price at 189.786.
GOLD 4H
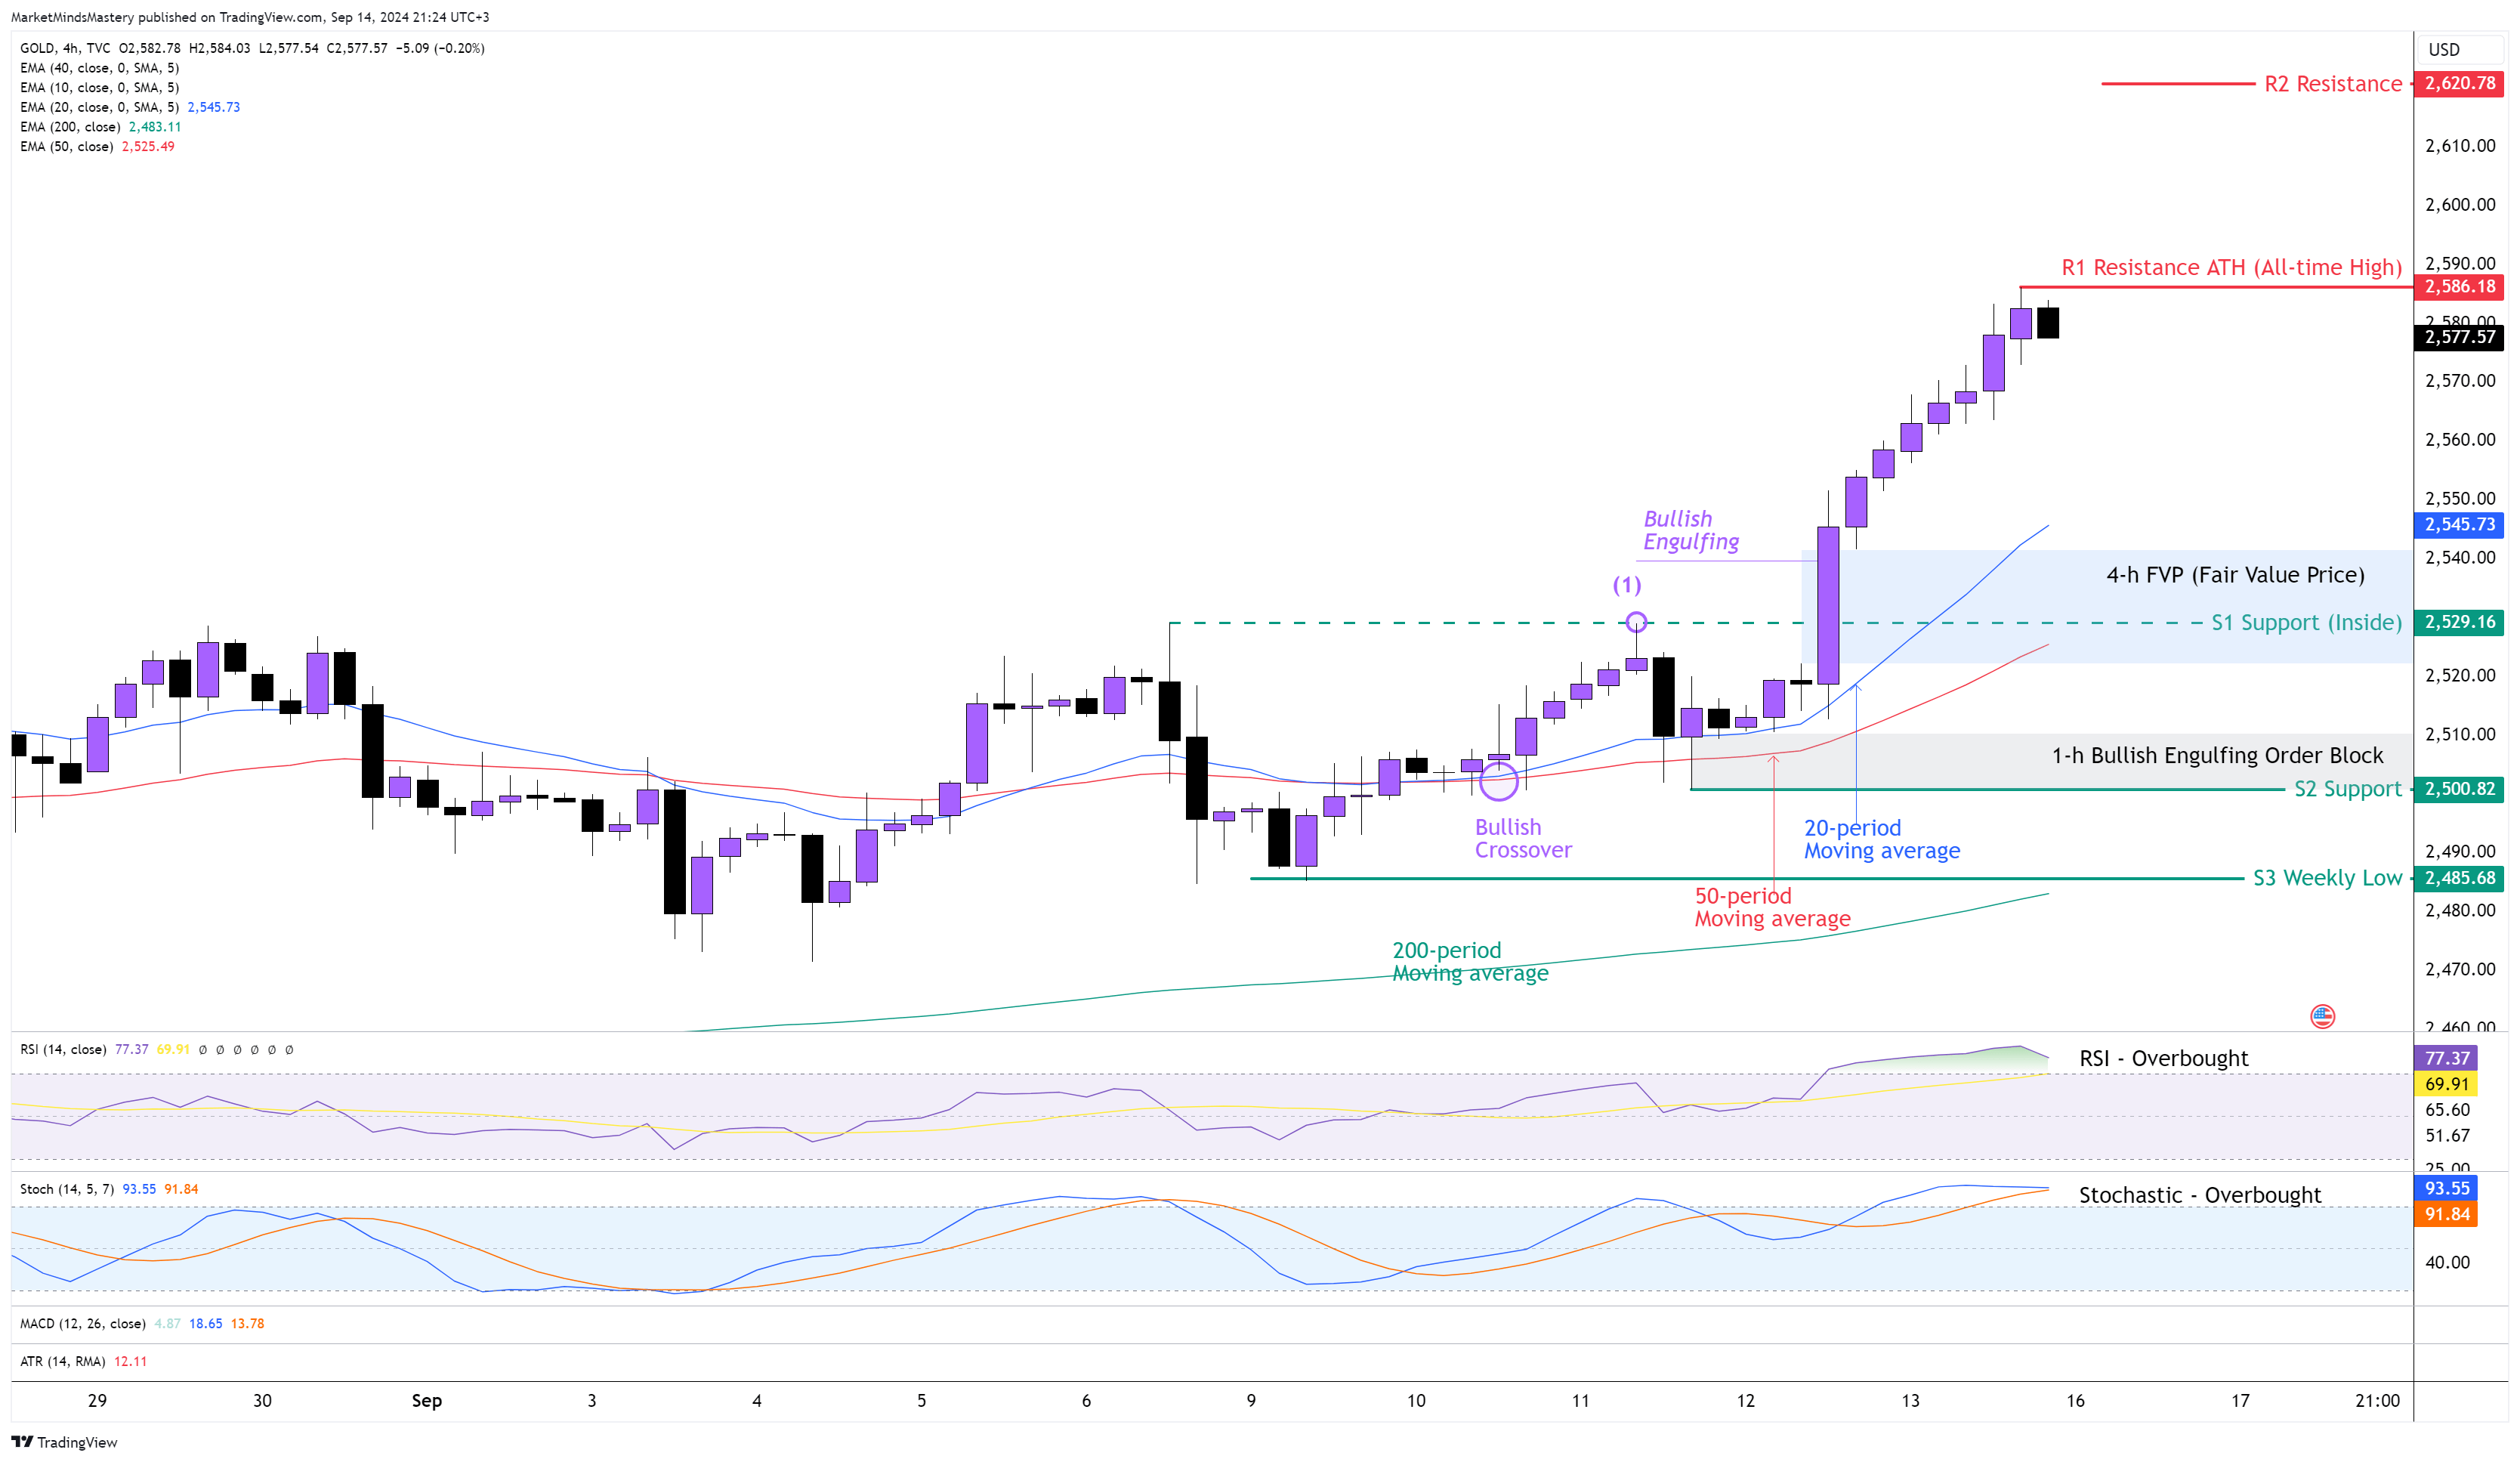
Following the last three weeks of price consolidation, the price created an upward breakout, keeping the major uptrend valid. On the 4-hour chart, the price created a series of higher highs and higher lows. Last Tuesday, the 20-period moving average crossed above the 50-period moving average, known as the “Bullish Crossover,” and this has bullish implications. The RSI line reached the number 70, which means that the Oscillator is in an Overbought condition, and this is bullish. Additionally, the Stochastic Oscillator is in an Overbought condition as it crosses above its upper boundary, which is 80. As the GOLD registered a new ATH (All-Time High) price of around $2586 if the price from Monday onwards continues moving upwards, the next resistance could be approximately around $2620, and this is based on the ATR (Average True Range). In case the price moves downwards to enter into a corrective phase, the first support area, S1, will be an inside support of around $2529. This is considered a key level of support because it coexists with the most recent swing high, as shown at point (1), the 50-period moving average, the middle of the Bullish Engulfing candle, and the FVP (Fair Value Price) created last Thursday. In case the price penetrates the S1, and keeps moving downwards, the next support area, S2, will be around the $2500. At this price level, a Bullish Engulfing Order Block was created last Wednesday, and it can become an additional support area for the price.
USOIL 4H
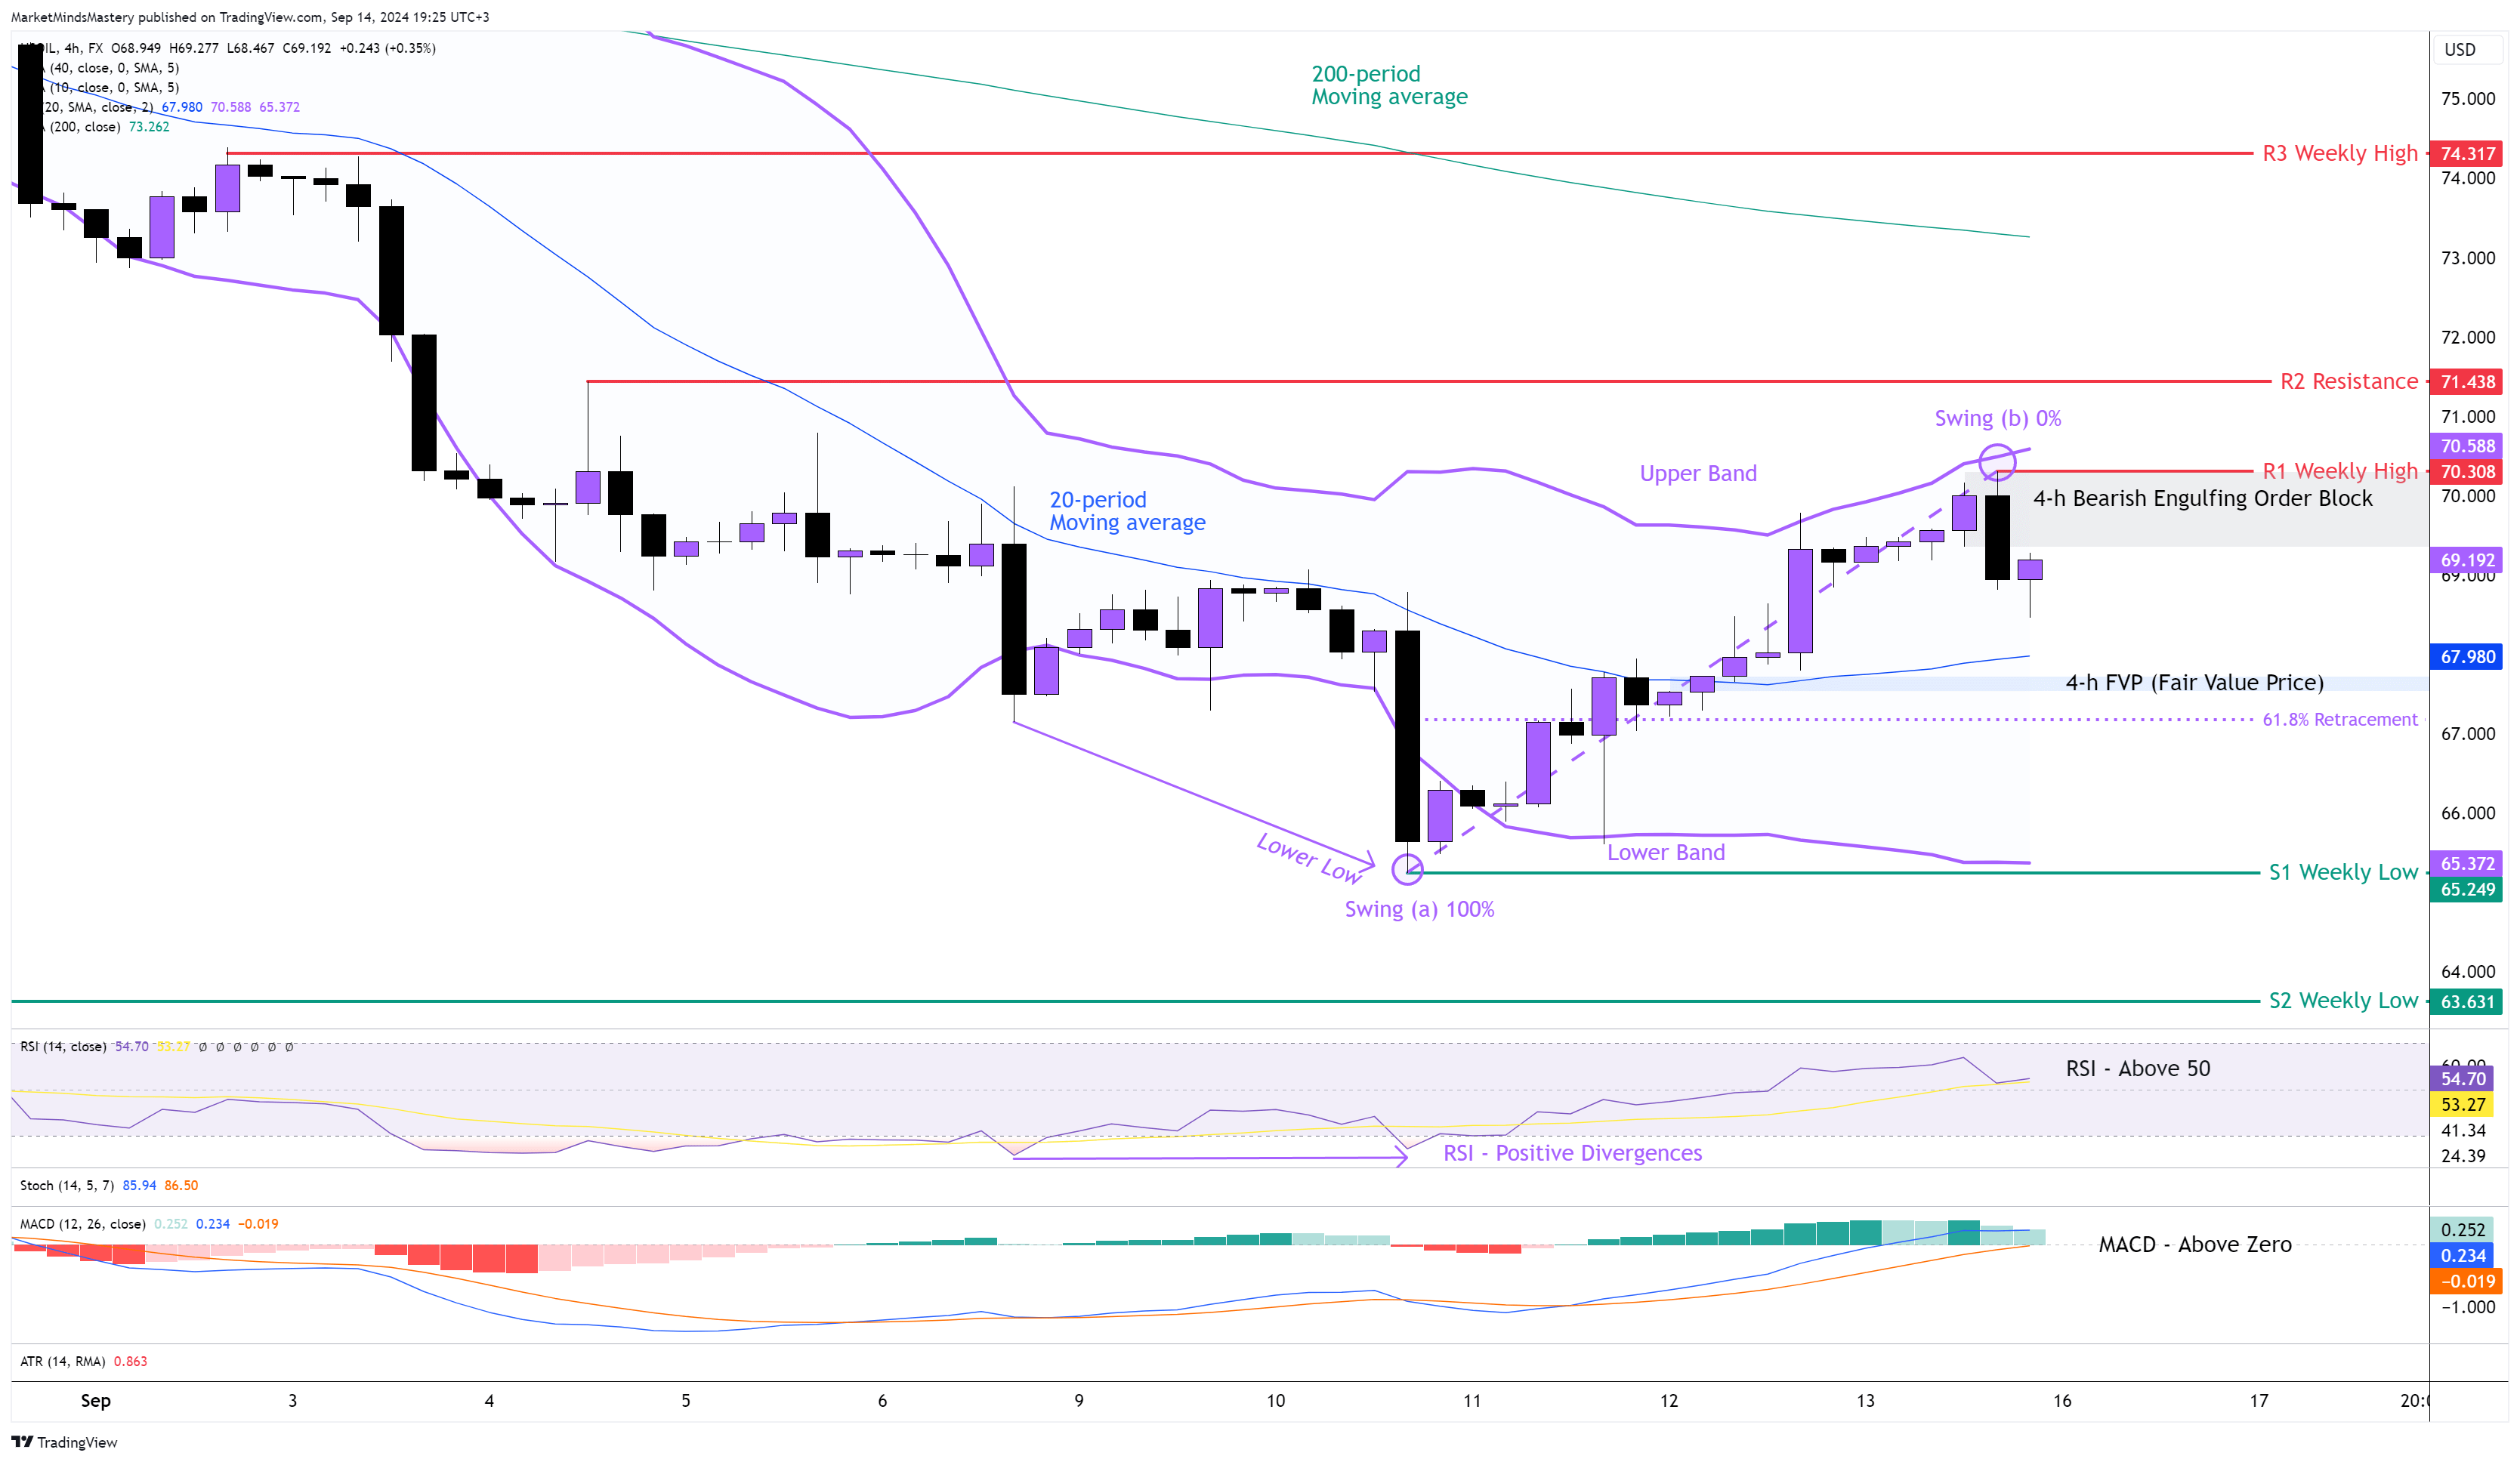
Following the previous week’s Market Outlook, the price of USOIL declined until last Wednesday, when an accumulation of buy orders around $66.00 caused it to bounce off and move upwards, creating a new high. Therefore, the Weekly chart ended with the Bullish price action candlestick with a Long-Lower Wick. On the 4-hour chart, the price is above the 20-period moving average, which has bullish implications. As the price made a higher high formation and as last Friday, the price created a swing high at point (b), we can use the Fibonacci retracement tool to estimate the potential retracement level as shown on the chart. Last Thursday, the price created an FVP (Fair Value Price) around the $67.50 price level.
Last Friday, the price of a 4-h Bearish Engulfing Order Block was established at around $70.00. The RSI is above 50, indicating bullishness. The MACD crossed above the zero line, indicating bullishness. The MACD’s Histogram is above its zero line, indicating rising prices. Using the Bollinger Band Indicator, the price currently is around the Upper Band. Therefore, if the price moves upwards, the previous week’s high will be the first R1 resistance, approximately $70.38. If the price penetrates the R1 resistance and keeps increasing, then the next resistance area, R2, will be around $71.43. A further upward move will find the next area of resistance, R3, at $74.31.
Conversely, if the price starts a retracement phase and moves downwards, the first support area will be S1 around $65.37, which is the previous week’s low. A further downward move will find the next support area, S2, around $63.63, which is an older weekly low price level.
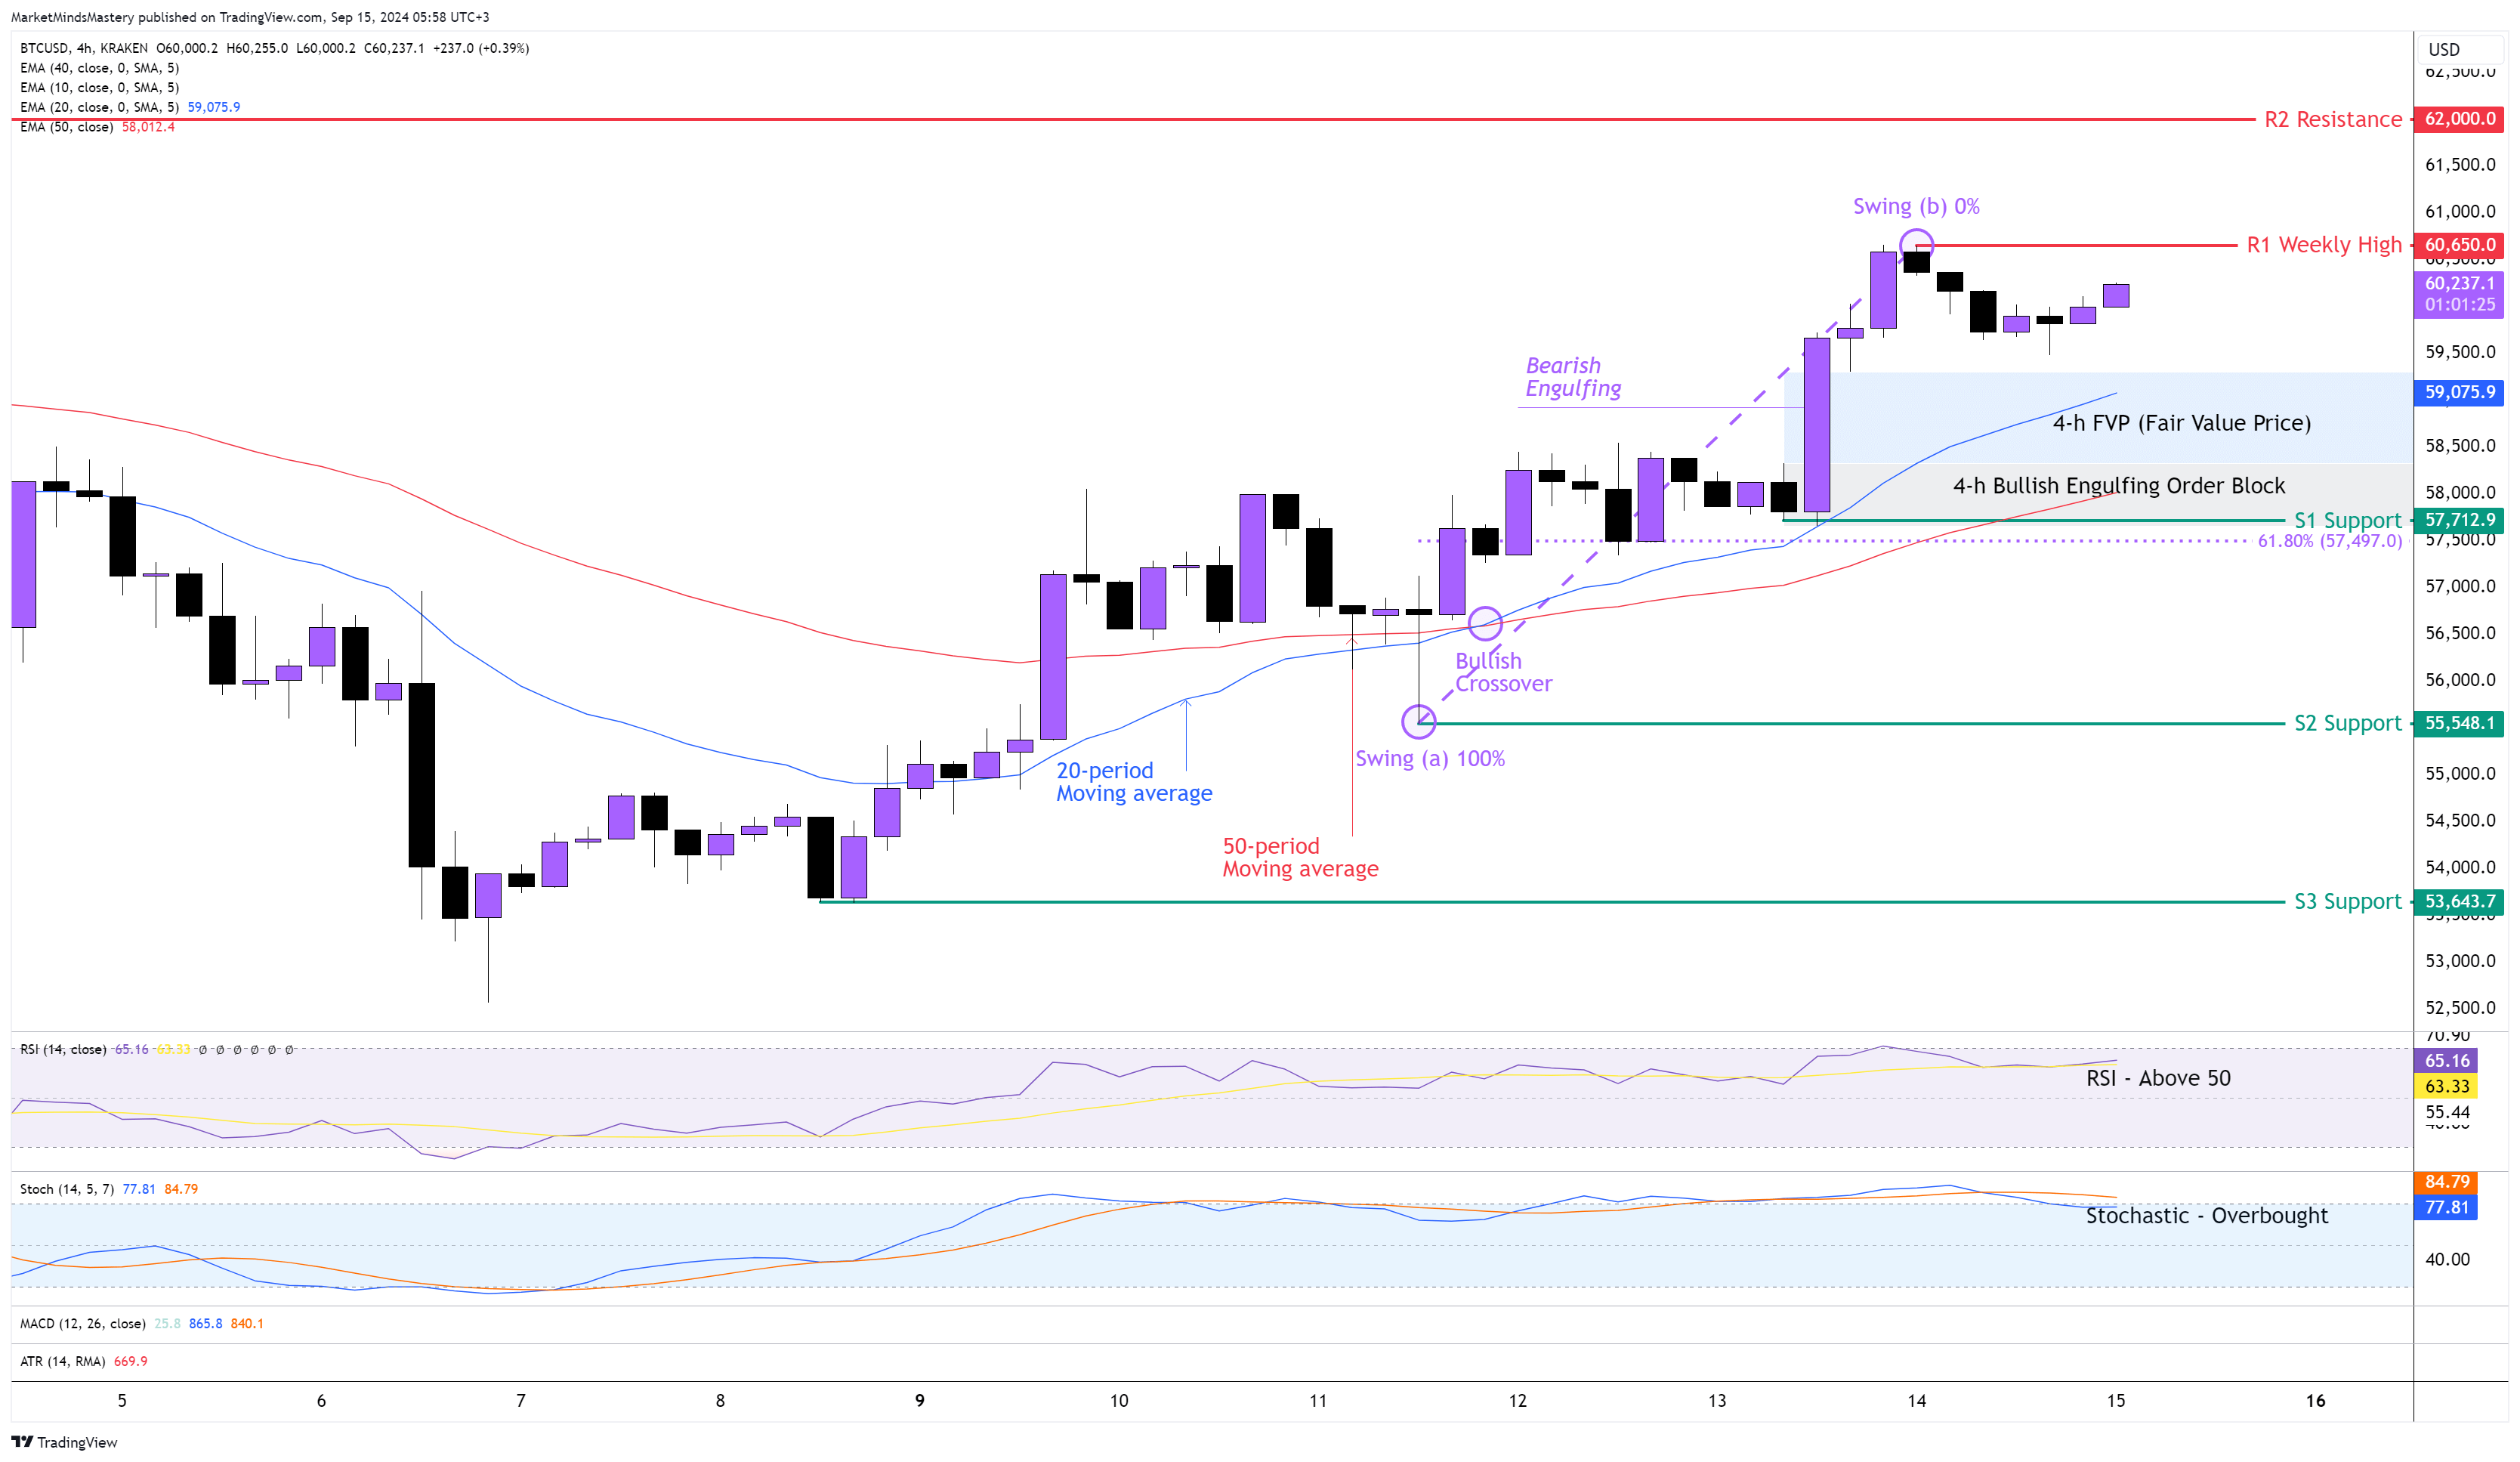
BTC USD 4H
The price of Bitcoin advanced last week while the US Dollar was losing its value. The weekly price action ended as a Bullish Marubozu, indicating a robust upward move. On the 4-hour chart, the price created a new market structure and started a series of higher highs and higher lows, indicating an uptrend is in place. Last Wednesday, the 20-period crossed above the 50-period moving average, known as a “Bullish Crossover.” The RSI is above the middle line of 50, which is bullish.
Additionally, the Stochastic Oscillator is in an Overbought condition, but it created a bearish crossover as the %K Line (Blue) crossed below the %D Line (Orange), while the Oscillator is above its upper line of 80. Currently, the price created a swing high at point (b). If this is the beginning of a retracement phase, and the price starts moving downwards, the first support area, S1, will be around $57712. This area is considered a key level of support because it consists of the FVP (Fair Value Price), the 4-h Bullish Engulfing Order Block, the 50-period moving average and the 61.8% Golden Ratio of the Fibonacci numbers that are found if we measure from the swing at point (a) until the swing at point (b).
If the price penetrates the S1 support and keeps lowering, the next support area, S2, will be around $55548. In case the price penetrates and the S2 support and keeps moving downward, the next support area, S3, will be around $53643. Oppositely, if the price moves upwards, the first resistance area, R1, will be around $60650, which is the previous week’s high. If the price breaks through the R1 level and keeps moving upwards, the next resistance area, R2, will be around $62000.
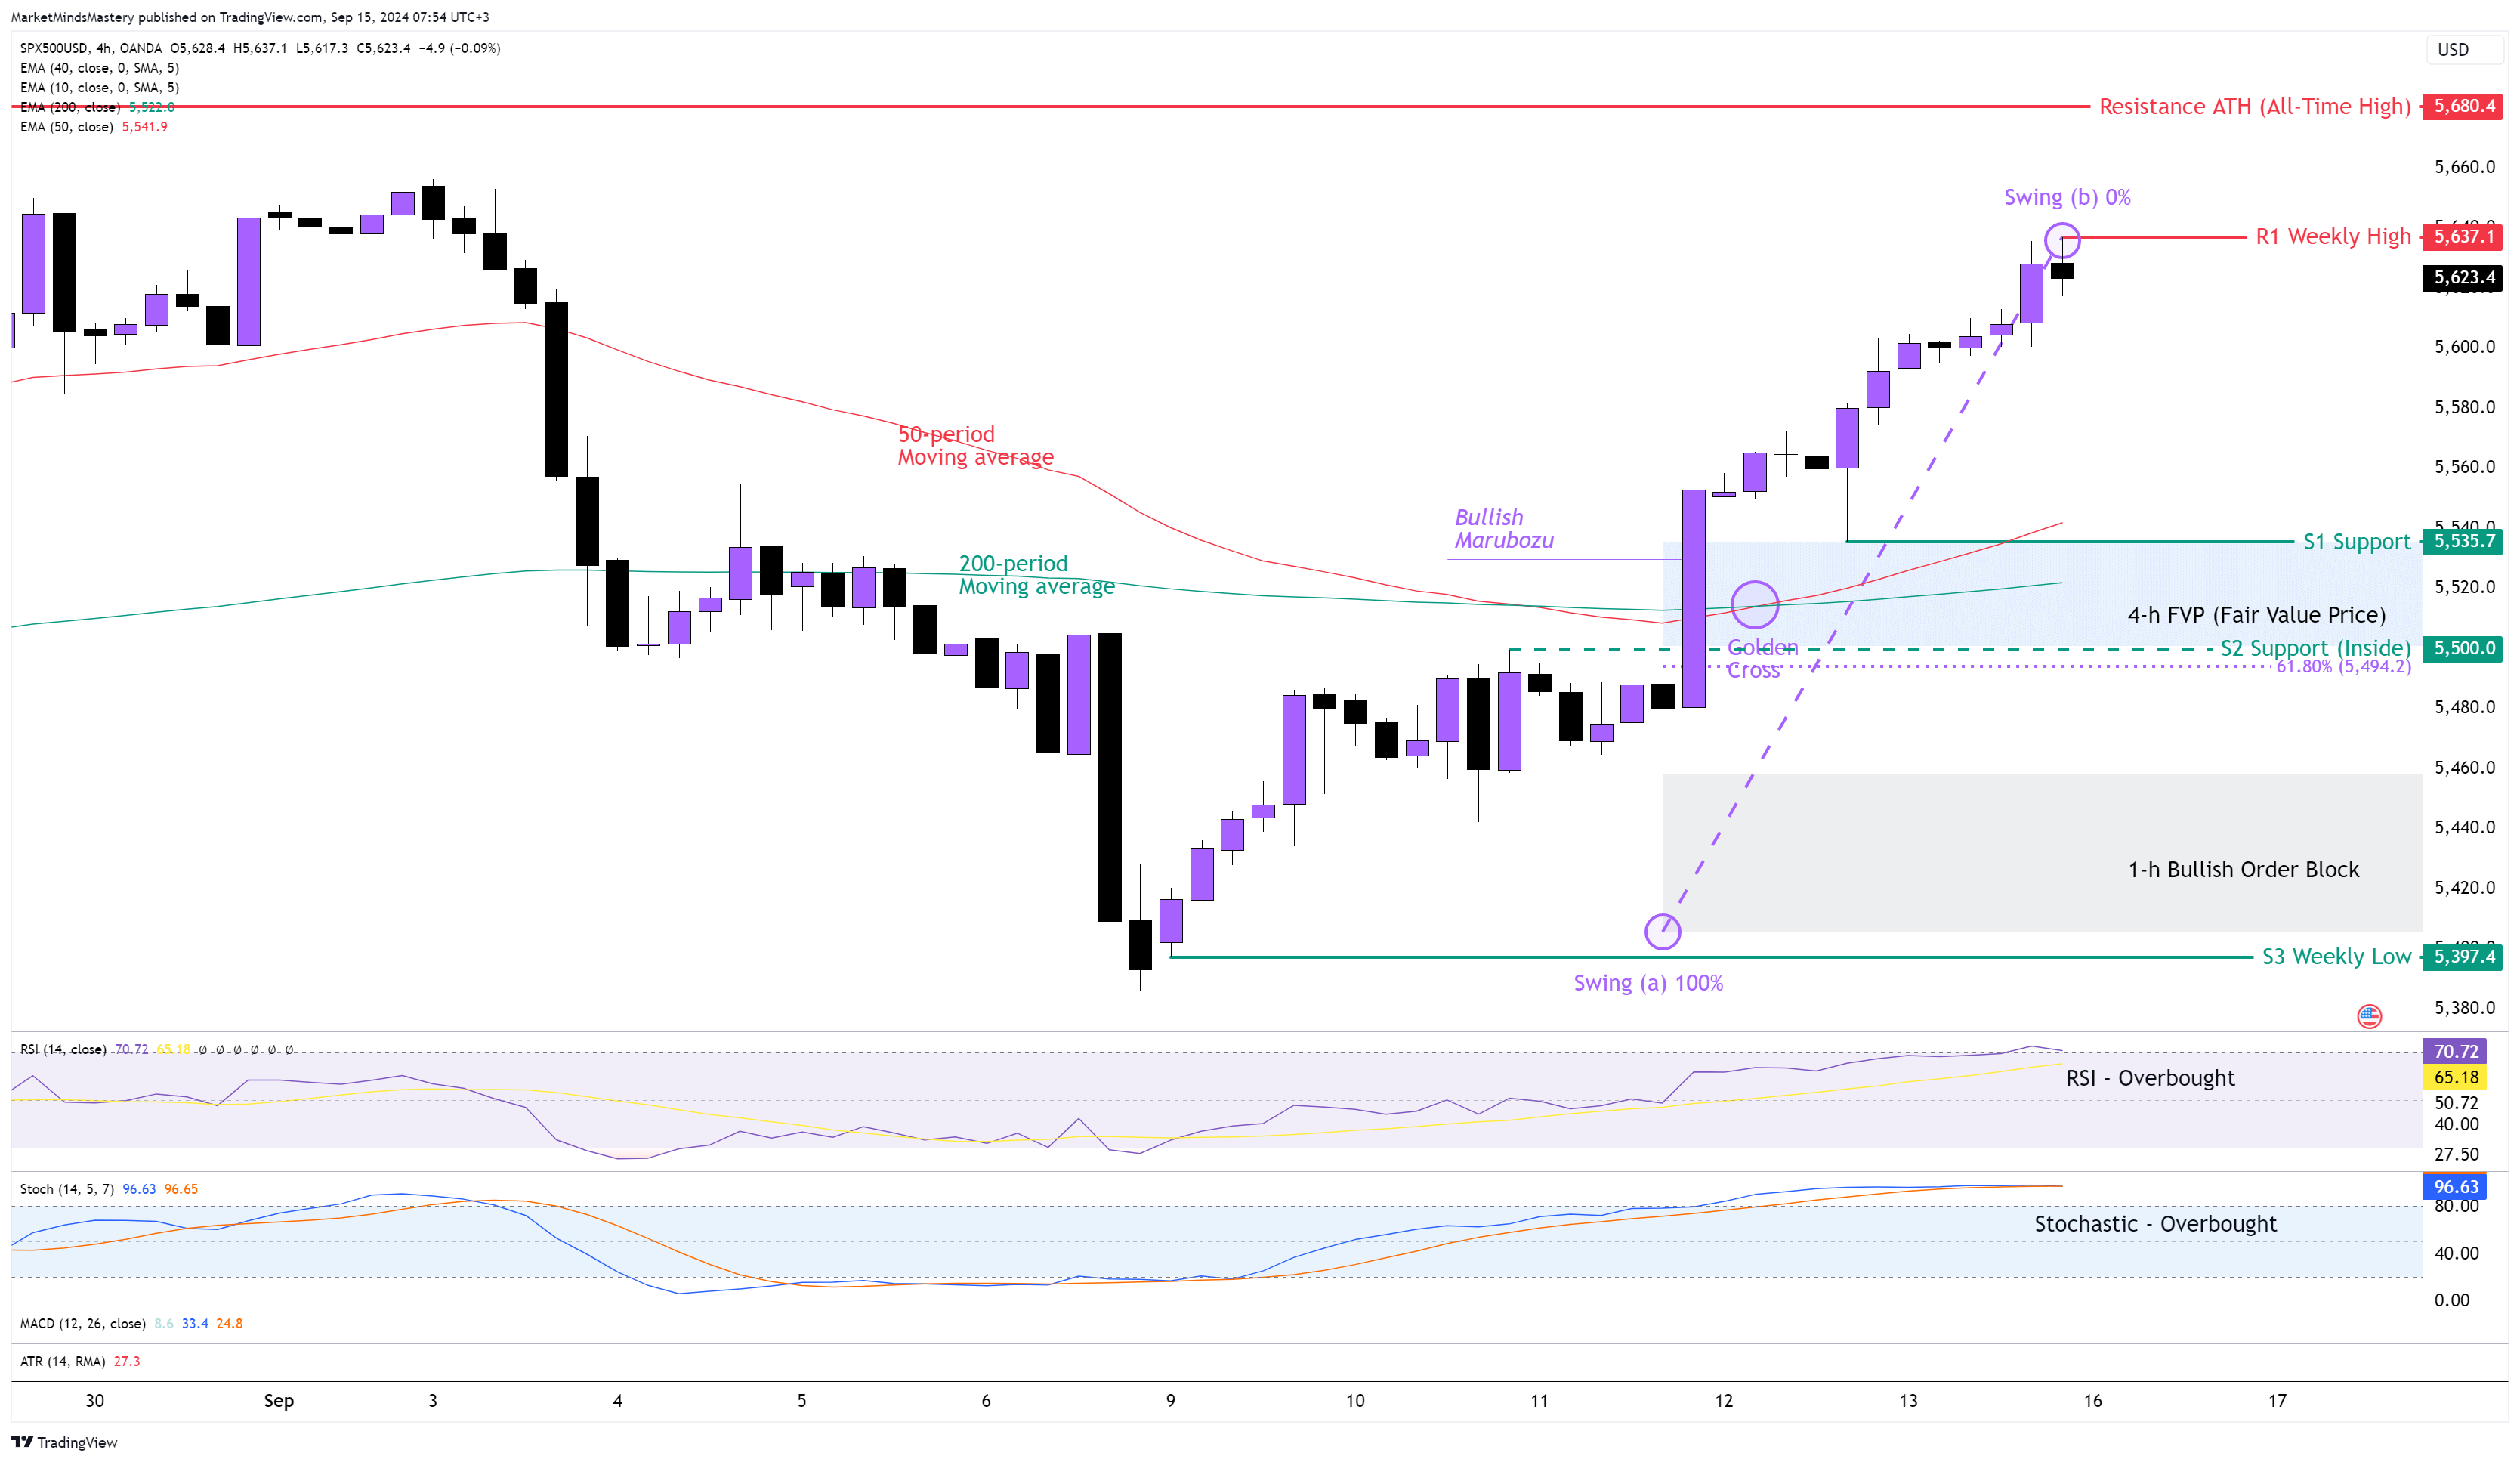
SP 500 4H
Following the previous week’s Market Outlook, the price of the SP500 has stopped making lower highs and lower lows since the beginning of last week. Last Wednesday, the price printed a Bullish Marubozu candlestick pattern, causing the price to create a new market structure. Since then, the price has been moving upwards. The 50-period crossed above the 200-period moving average known as the Golden Cross. The RSI Oscillator is in an Overbought condition after the price moved upward last Friday. Also, the Stochastic Oscillator is in an Overbought condition as it crosses above its upper boundary, which is 80. If the price starts a retracement phase and moves downwards, the first support area, S1, will be around $5535. If the price penetrates the S1 support and keeps lowering, the next support area, S2, will be an inside support of around $ 5,500. This is considered a key level of support because it consists of the 61.8% Golden Ratio, as we measure it from the swing at point (a) to the swing at point (b), and the FVP (Fair Value Price) that was created last Wednesday. In case the price penetrates the S1 and keeps moving downwards, the next support area, S3, will be around $5397, which is the previous week’s low.
On the other hand, if the price keeps moving upward, the first resistance area will be the previous week’s high, around $5637. If the price penetrates the R1 resistance and keeps moving upwards, the next resistance area will be the ATH price, around $5680.
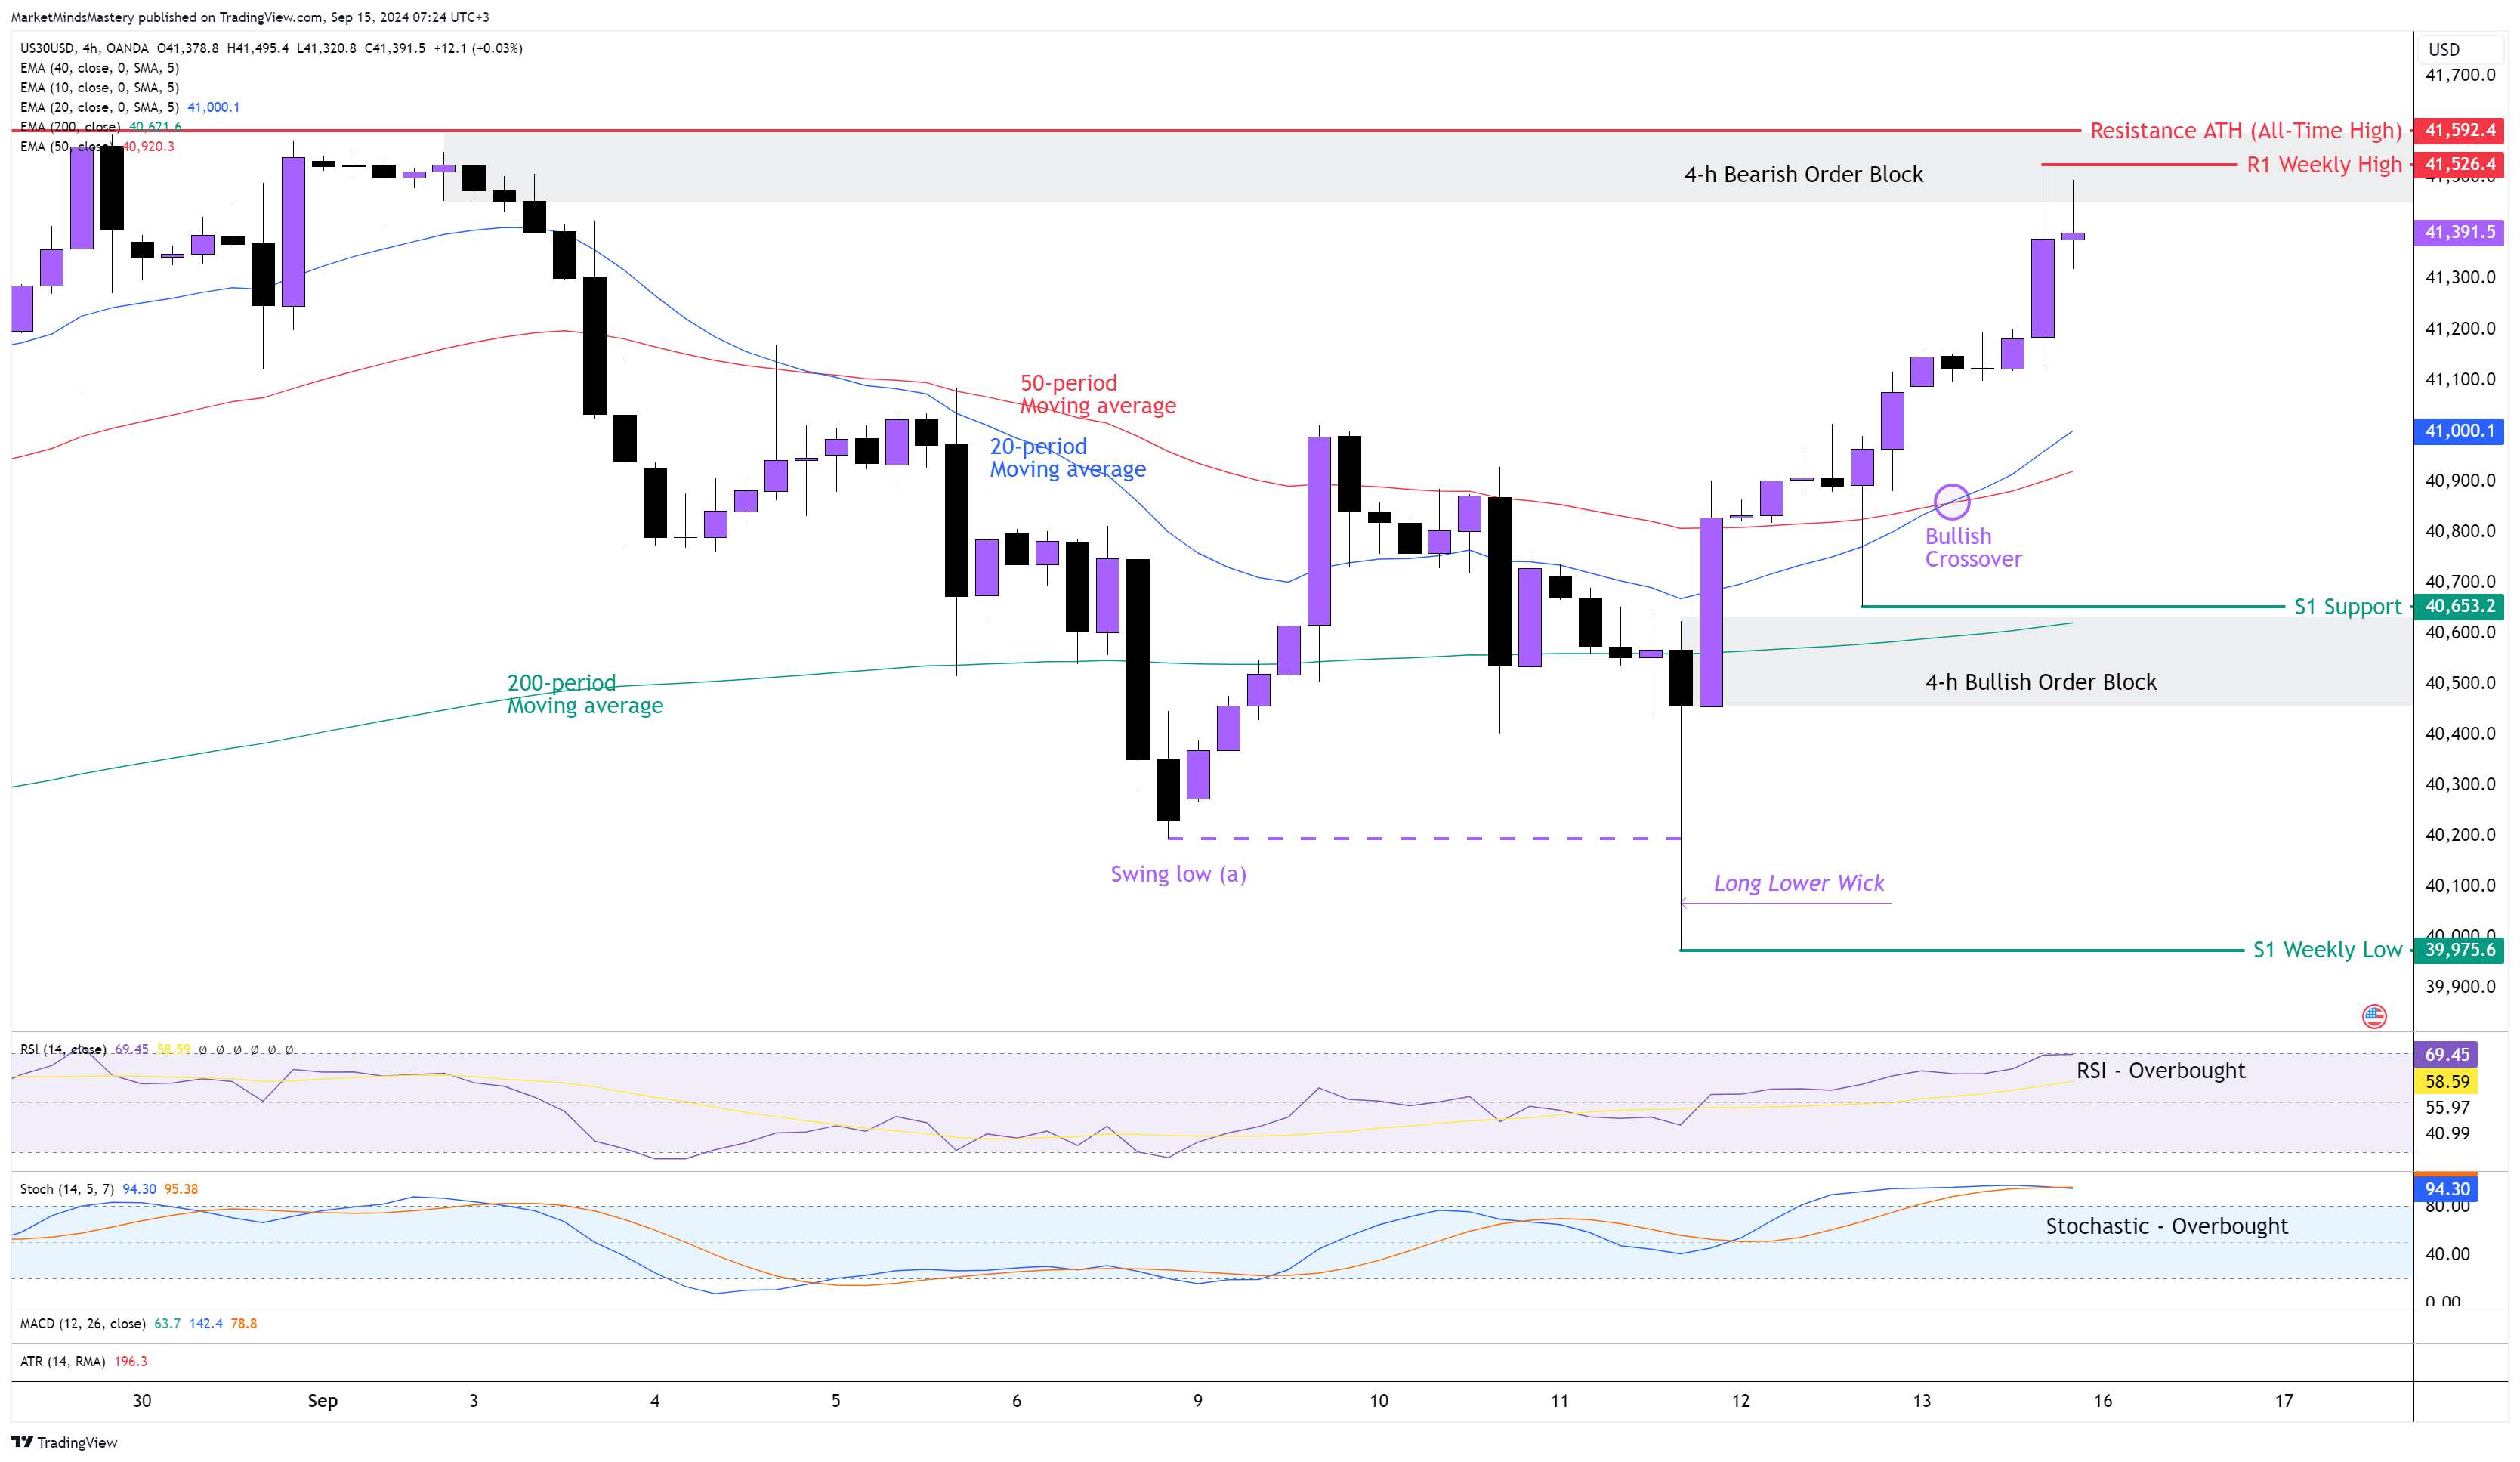
US 30, 4H
The price of the US30 rose last week, and it almost reached the ATH (All-Time high) at around $41592. The Bearish Order Block we marked on the chart last week, around $41500, caused the price to stop moving upward last Friday. However, the weekly candle ended as a Bullish candle. The change of market structure occurred last Wednesday once the price tested the swing low at point (a) around $40200, and by the end of the trading session, it printed a candle with a long lower wick, which generally has bullish implications. Additionally, on the same day, the price created a 4-h Bullish Order Block at approximately $40500. Both Oscillators, the RSI and the Stochastic reached their Overbought condition, and these have bullish implications.
As the price started making higher highs and higher lows, the 20-period moving average crossed above the 50-period following the upward price move. If the price continues moving upwards, the first resistance area, R1, will be the previous week’s high of around $41526. If the price penetrates the R1 resistance and keeps moving upward, the next resistance area, R2, will be around $41592, which is the ATH (All-Time High) price.
Conversely, if the price declines and moves downward, the first support area, S1, will be around $40653. This level coexists with the Bullish Order Block and the 200-period moving average, which can act as dynamic support for the price. In case the price penetrates the S1 support and declines more, the next support area, S2, will be around $39975, which is the previous week’s low.
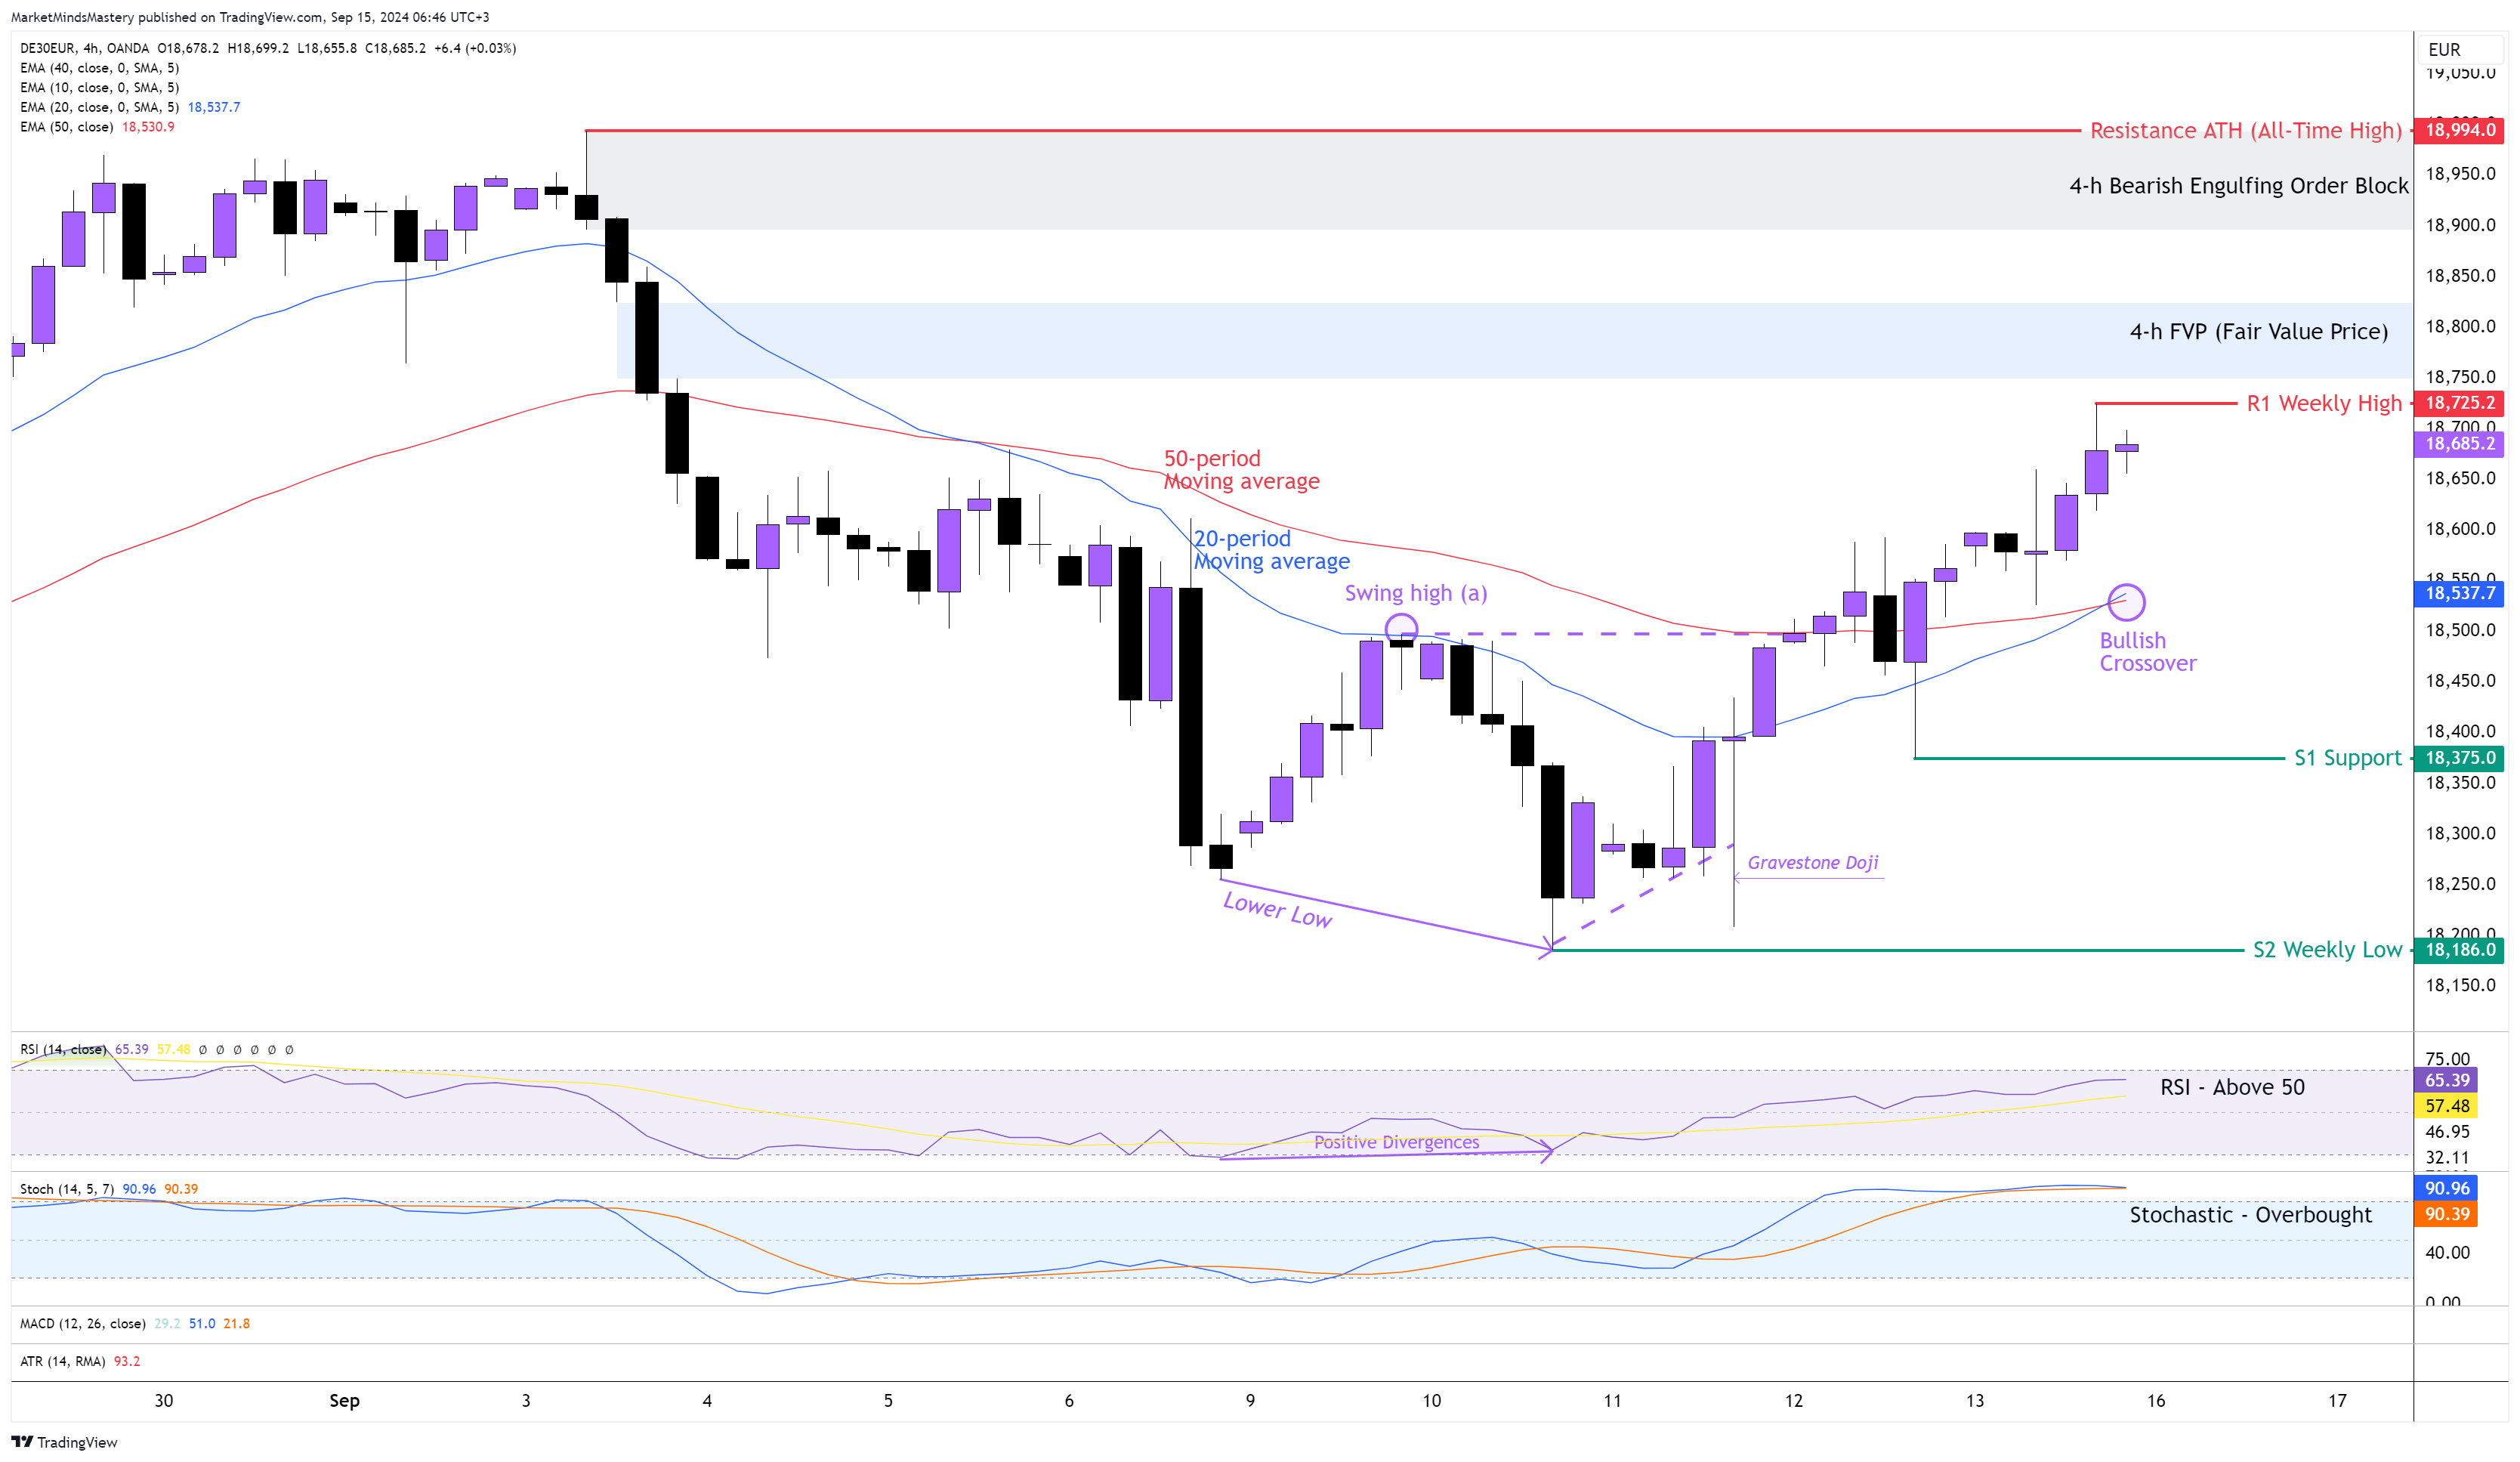
GER 30, 4H
Last week, the price action of the GER30 on the weekly chart ended as a Bullish candle. However, looking at the weekly market structure, the most recent candles made lower highs and lower lows. On the 4-hour chart, last Tuesday, the price showed a lower low formation, but the RSI was unable to follow printed Positive (Bullish) Divergences. That caused the price to enter a retracement phase, which ended as a reversal last Thursday as the price penetrated the swing high at point (a), as shown on the chart. Towards the end of the New York Trading Session last Friday, the moving averages created a Bullish Crossover. The 50-period is above the 200-period moving average, which is bullish. The RSI oscillator is above 50, indicating bullishness. Also, the Stochastic Oscillator is in an Overbought condition and this has bullish implications. Starting Monday, if the price keeps increasing, the first level of resistance will be the previous week’s high, around 18725. If the price penetrates the R1 and keeps moving upwards, it is likely to “fill up” the FVP (Fair Value Price) around 18800. If the price keeps moving higher, the next static resistance price level will be the ATH (All-Time High) around 18994. Around this price level, there is an Order Block which hasn’t been tested yet.
On the other hand, if the price declines and moves downwards, the first support area, S1, will be around 18375. If the price penetrates the S1 and keeps lowering, the next support area, S2, will be the previous week’s low, around 18186.