Last week, the markets focused on the Euro primarily because the ECB voted for the Eurozone's Interest Rates. As we explained last week, the Euro was most likely to be the weakest currency overall. Once the ECB announced a rate cut to 3.4%, traders around the world were selling the Euro against other currency pairs. Most traders were selling the EURUSD. Among the Euro, the Swiss Frank was one of the weakest currencies. The leading currency last week was the US Dollar. As we move towards the end of the month, we will have a lot of speeches from Central Bank leaders.
Only a few significant events will be reported on Monday. In China, they will report the 1-year and the 5-year loan prime rate. The 1-year rate is expected to drop from 3.35% to 3.15%, and the 5-year rate from 3.85% to 3.65%. This can negatively affect the Chinese Yuan, and its value against the USD is expected to decrease. The next event will be the German PPI (Producer Price Index), and the forecast estimates a drop from 0.2% to -0.2%. This can affect the Euro directly and can potentially keep it on the decline. In terms of volatility, during all three major trading sessions, the Asian, London and New York markets are expected to become more volatile around their opening time.
On Tuesday, during the Asian trading session, volatility is expected to increase as New Zealand will report the Trade Balance. As a country with intense import and export activity, New Zealand’s Dollar has become sensitive to this event. Currently, the Trade Balance is -220.3M. If the reported number is positive for the Kiwi, we expect the NZD to gain some strength and the price of the NZDUSD to increase. The BRICK Summit meeting's first day will start today. The next significant event for the day will be the BOE (Bank of England) Governor Bailey's speech. This will occur during the New York Trading session and is expected to increase the volatility in the GBP. Less than an hour later, Harker, who is a member of the FOMC will, gave a speech. The day will end with the speech of the ECB President Legarde. Last week, the ECB cut its interest rates for the second consecutive month. We expected to find valuable information on how the ECB sees the future of the European economy and how they plan to proceed afterwards.
On Wednesday, the market volatility is expected to be as usual during the Asian and London trading sessions. There won't be any significant news events that can affect the market and create unexpected and sudden moves. Moving into the New York Trading Session, the focus will be on the BoC (Bank Of Canada) as they will report their Interest Rates. The BoC is planning to proceed with a rate cut of 50 Basis Points, which means that from 4.25% to drop to 3.75%. It has been a while since the Canadian Dollar has been a weak currency, and it has given some advantages to the USD, the Euro, and the Sterling. If this time, the BoC will cut rates by 50 points, and at the same time, if the markets follow through, we expect weakness in the Loonie (short for the Canadian Dollar). In this case, we can see the rate of the USDCAD increasing to at least 1.39000 level as per a detailed chart analysis. The New York trading session will continue with another speech by ECB President Legarde and ECB Chief Economist Lane. Next will be the Total Existing Home Sales Annual Report in the US. The forecast estimates an increase from 3.86M to 3.9M, which, in this case, can positively favour the US Dollar. The next event that is expected to affect the volatility during the New York Session will be the BoC Press Conference, after announcing the Interest rates. Usually, they explain why they did it and what they aim for afterwards. The day will end with a speech by the RBNZ (Reserve Bank of New Zealand) Governor Orr, the BoE Governor Bailey and the BoJ(Bank of Japan) Governor Ueda.
On Thursday, the volatility during the Asian trading session is expected to be normal. Moving into the European and London trading sessions, the French Manufacture PMI will be reported, and the consensus estimates an increase from 44.6 to 45.1. At the same time, the French Flash Services PMI is also expected to increase from 49.6 to 49.9. In Germany, the Flash manufacturing PMI is expected to increase only by 0.1, which means from 40.6 to 40.7, whereas the Flash Services PMI is expected to remain at 50.6. Thirty minutes later, in the Eurozone, the Flash Manufacture PMI from 45.0 is expected to increase to 45.1 and the Flash Services PMI from 51.4 to 51.5. The Brick Summit will continue for the second day.
Next, in the UK, they will report the Flash Manufacture PMI, which is expected to remain at 51.5, and the Flash Services PMI, which is expected to decrease from 52.4 to 52.3.
The US unemployment Rate is expected to increase from 241K to 243K as we enter the New York Trading Session. This can negatively affect the US dollar and perhaps cause the major currency pairs, if they are still in a downtrend by that time, to start a retracement phase. The next significant event, which usually causes a lot of volatility in the US Dollar, will be the Flash Manufacturing and the Services PMI in the US. The Manufacture PMI is expected to increase from 47.3 to 47.5, and the Services PMI will decrease from 55.2 to 55.0. The trading day will end with the New Home Sales report in the US. The consensus estimates an increase from 716K to 717K.
The volatility is expected to be noticeable during the Asian trading sessions in Japan. They will report the CPI (Consumer Price Index). As per the forecast, the current 2% is expected to drop to 1.7%. If the actual report confirms the forecast and the markets follow through simultaneously, the weakness of the Japanese Yen will be evident. In this case, we can see a direct and upward move in both USDJPY and GBPJPY. The next important event will be the Retail Sales in Canada. As per the forecast, it is expected to drop from 0.9% to 0.4%. If, by this time, the Canadian Dollar weakens due to the interest rates report and the drop in retail sales, Loonie’s weakness is expected to continue. The trading day and the trading week will end with the (DGO )Durable Goods Orders in the US. The forecast shows a decrease from 0.0% to -0.1%. This event is expected to affect New York’s trading session volatility and its outcome in directly affecting the US dollar.
EUR USD 4H

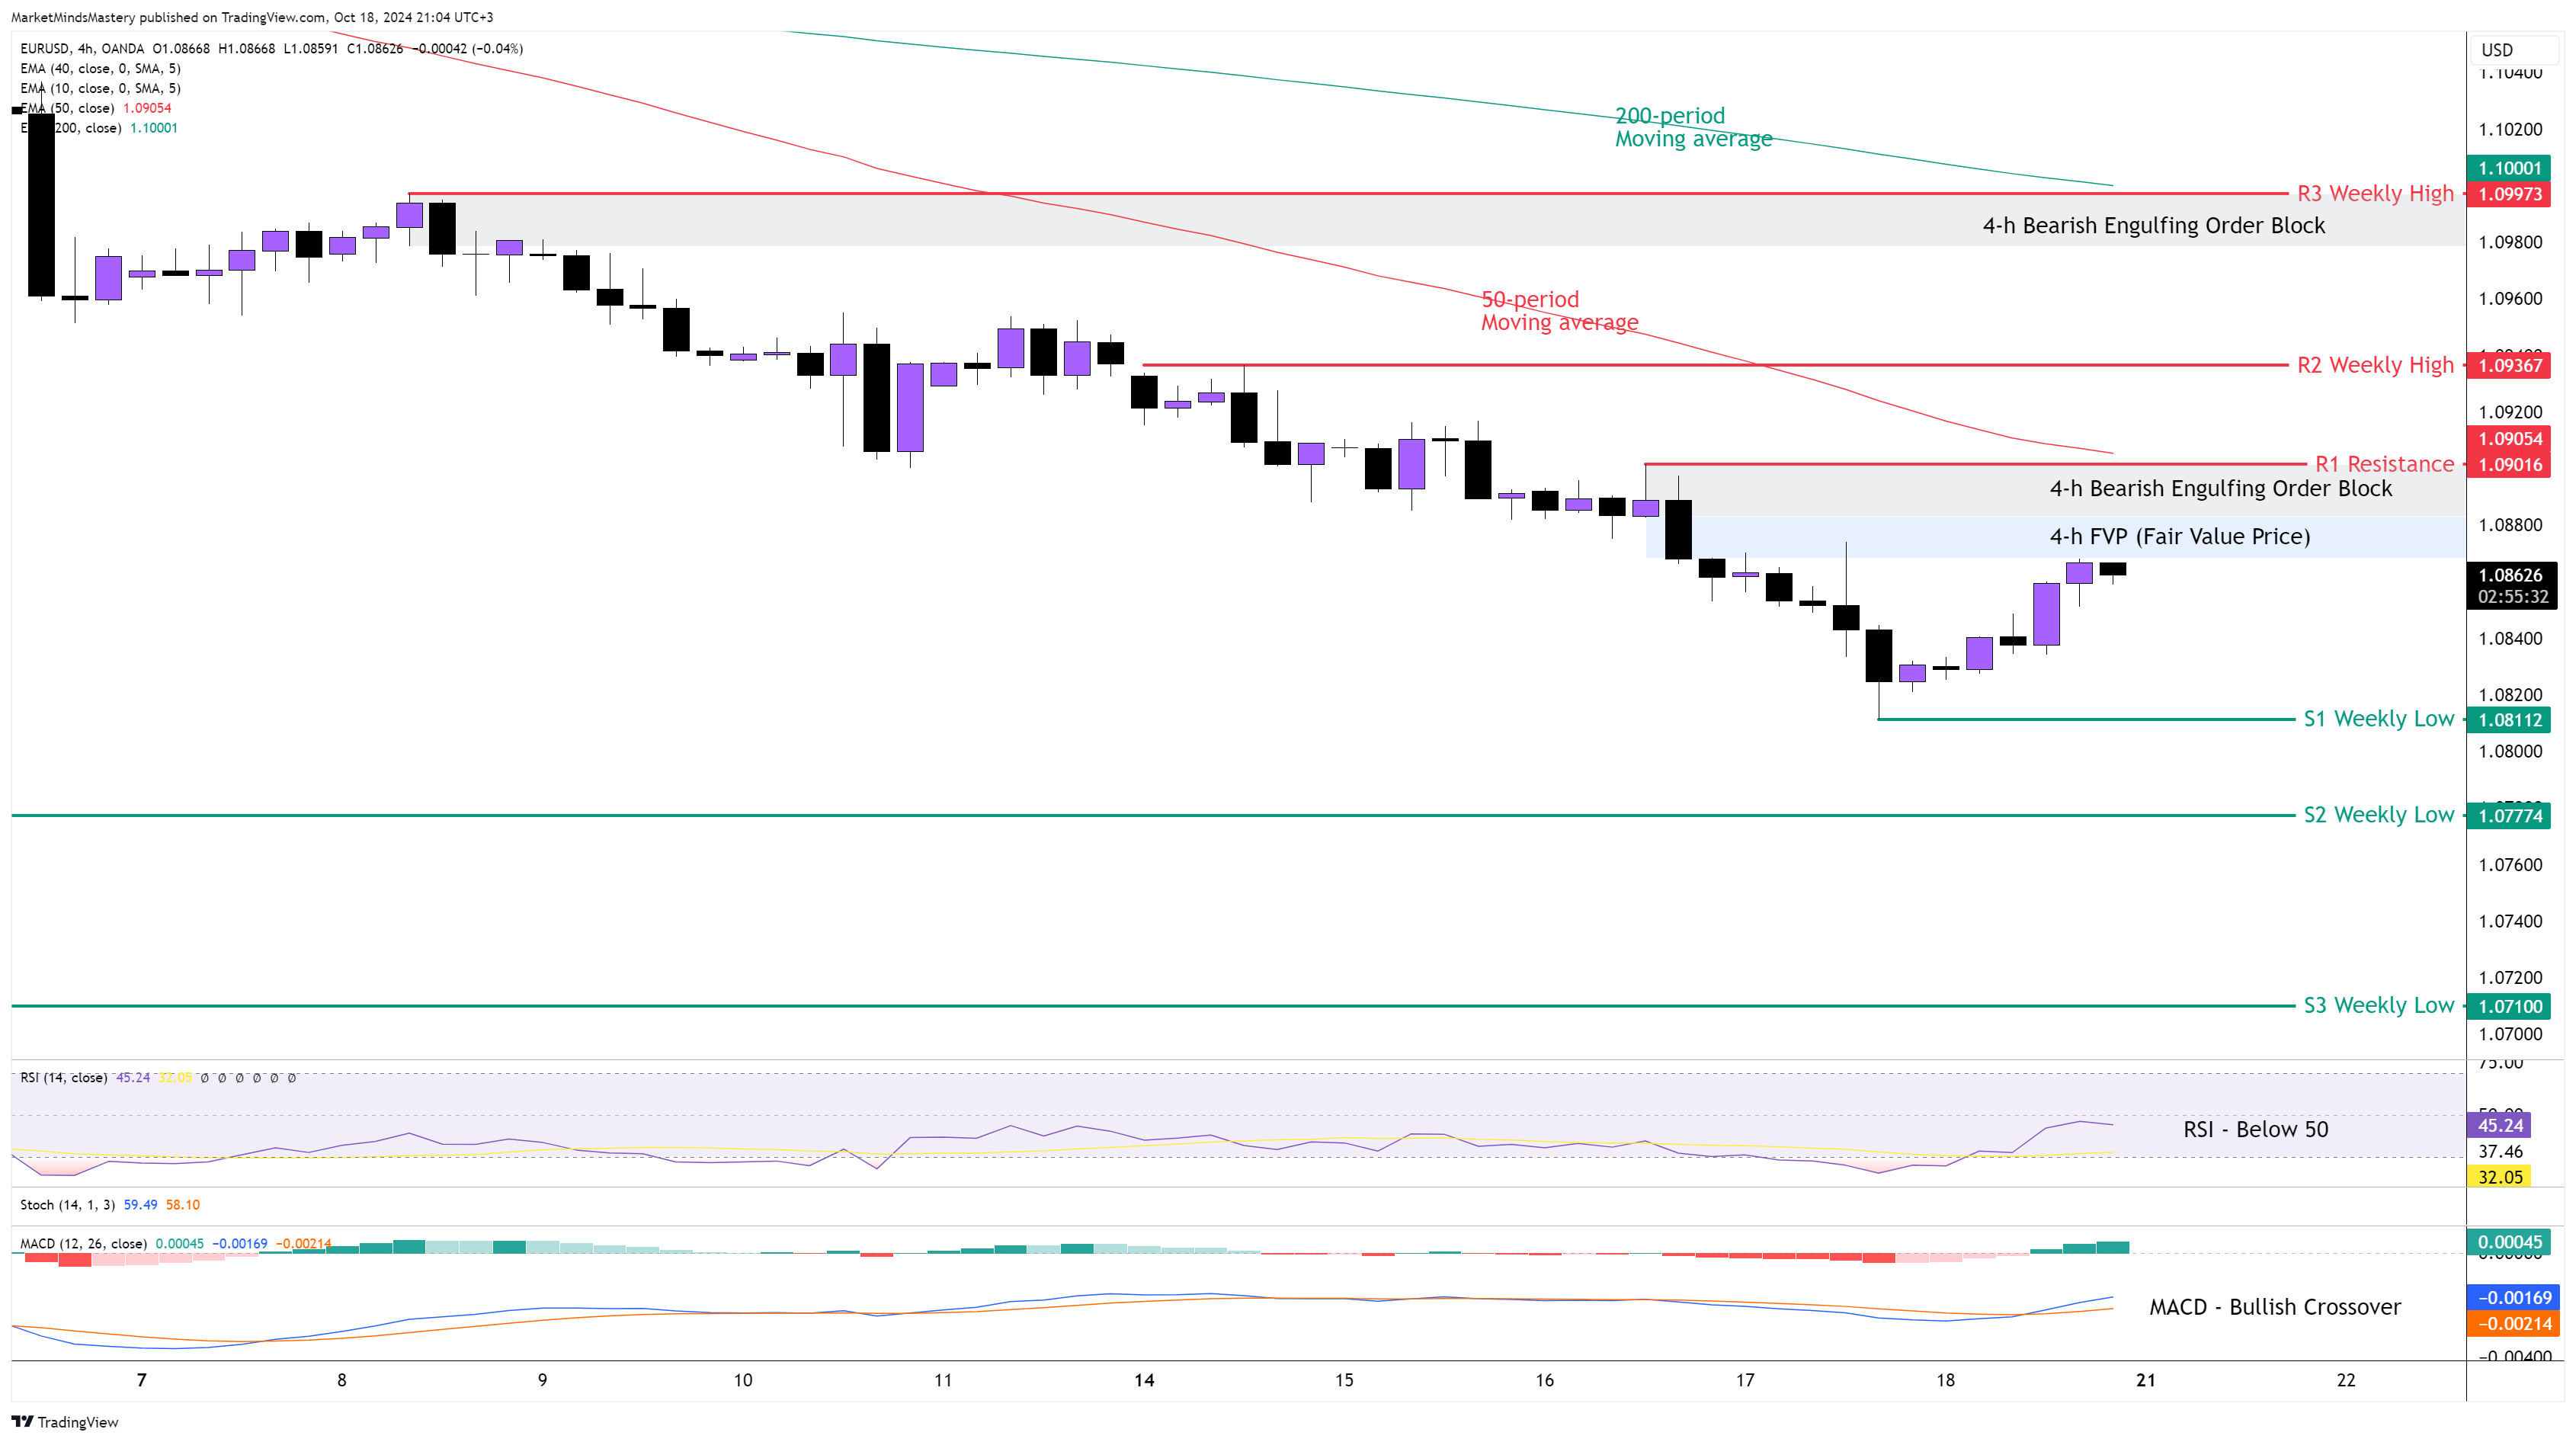
Following the previous week’s analysis, the price of EURUSD continued moving downwards, penetrating the 40-period weekly moving average as the ECB cut their interest rates for a second consecutive month. The weekly chart ended as a Bearish continuation candlestick. On the 4-hour chart, the price kept making lower highs and lower lows, creating a Bearish Engulfing Order Block last Wednesday at around 1.0890. The price reached the 4-hour FVP (Fair Value Price) area, around 1.0870, which temporarily halted the decline.
The 50-period is below the 200-period moving average, indicating bearishness. The RSI Oscillator is below its middle line of 50, which is bearish. Additionally, the MACD created a Bullish Crossover while both the MACD Line (Blue) and the Signal Line (Orange) were below the zero line. If the price moves upwards from here, the first resistance area, R1, will be around 1.09016, a level that coincides with a 4-hour Bearish Engulfing Order Block. If the price penetrates the R1 resistance and keeps moving upwards, the next key resistance level, R2, will be around 1.09367, which also aligns with the 50-period moving average and is the previous week’s high. In case the price keeps moving upwards, then the next resistance area, R3, will be at 1.09973.
Conversely, if the price continues the overall market downtrend, the first support area, S1, will be around 1.08112, which is the previous week’s low. If the price breaks below this level, the next support area, S2, will be around 1.07774, which is an older weekly level. A further downward move will find the next support area, S3, around 1.07100.
GBP USD 4H
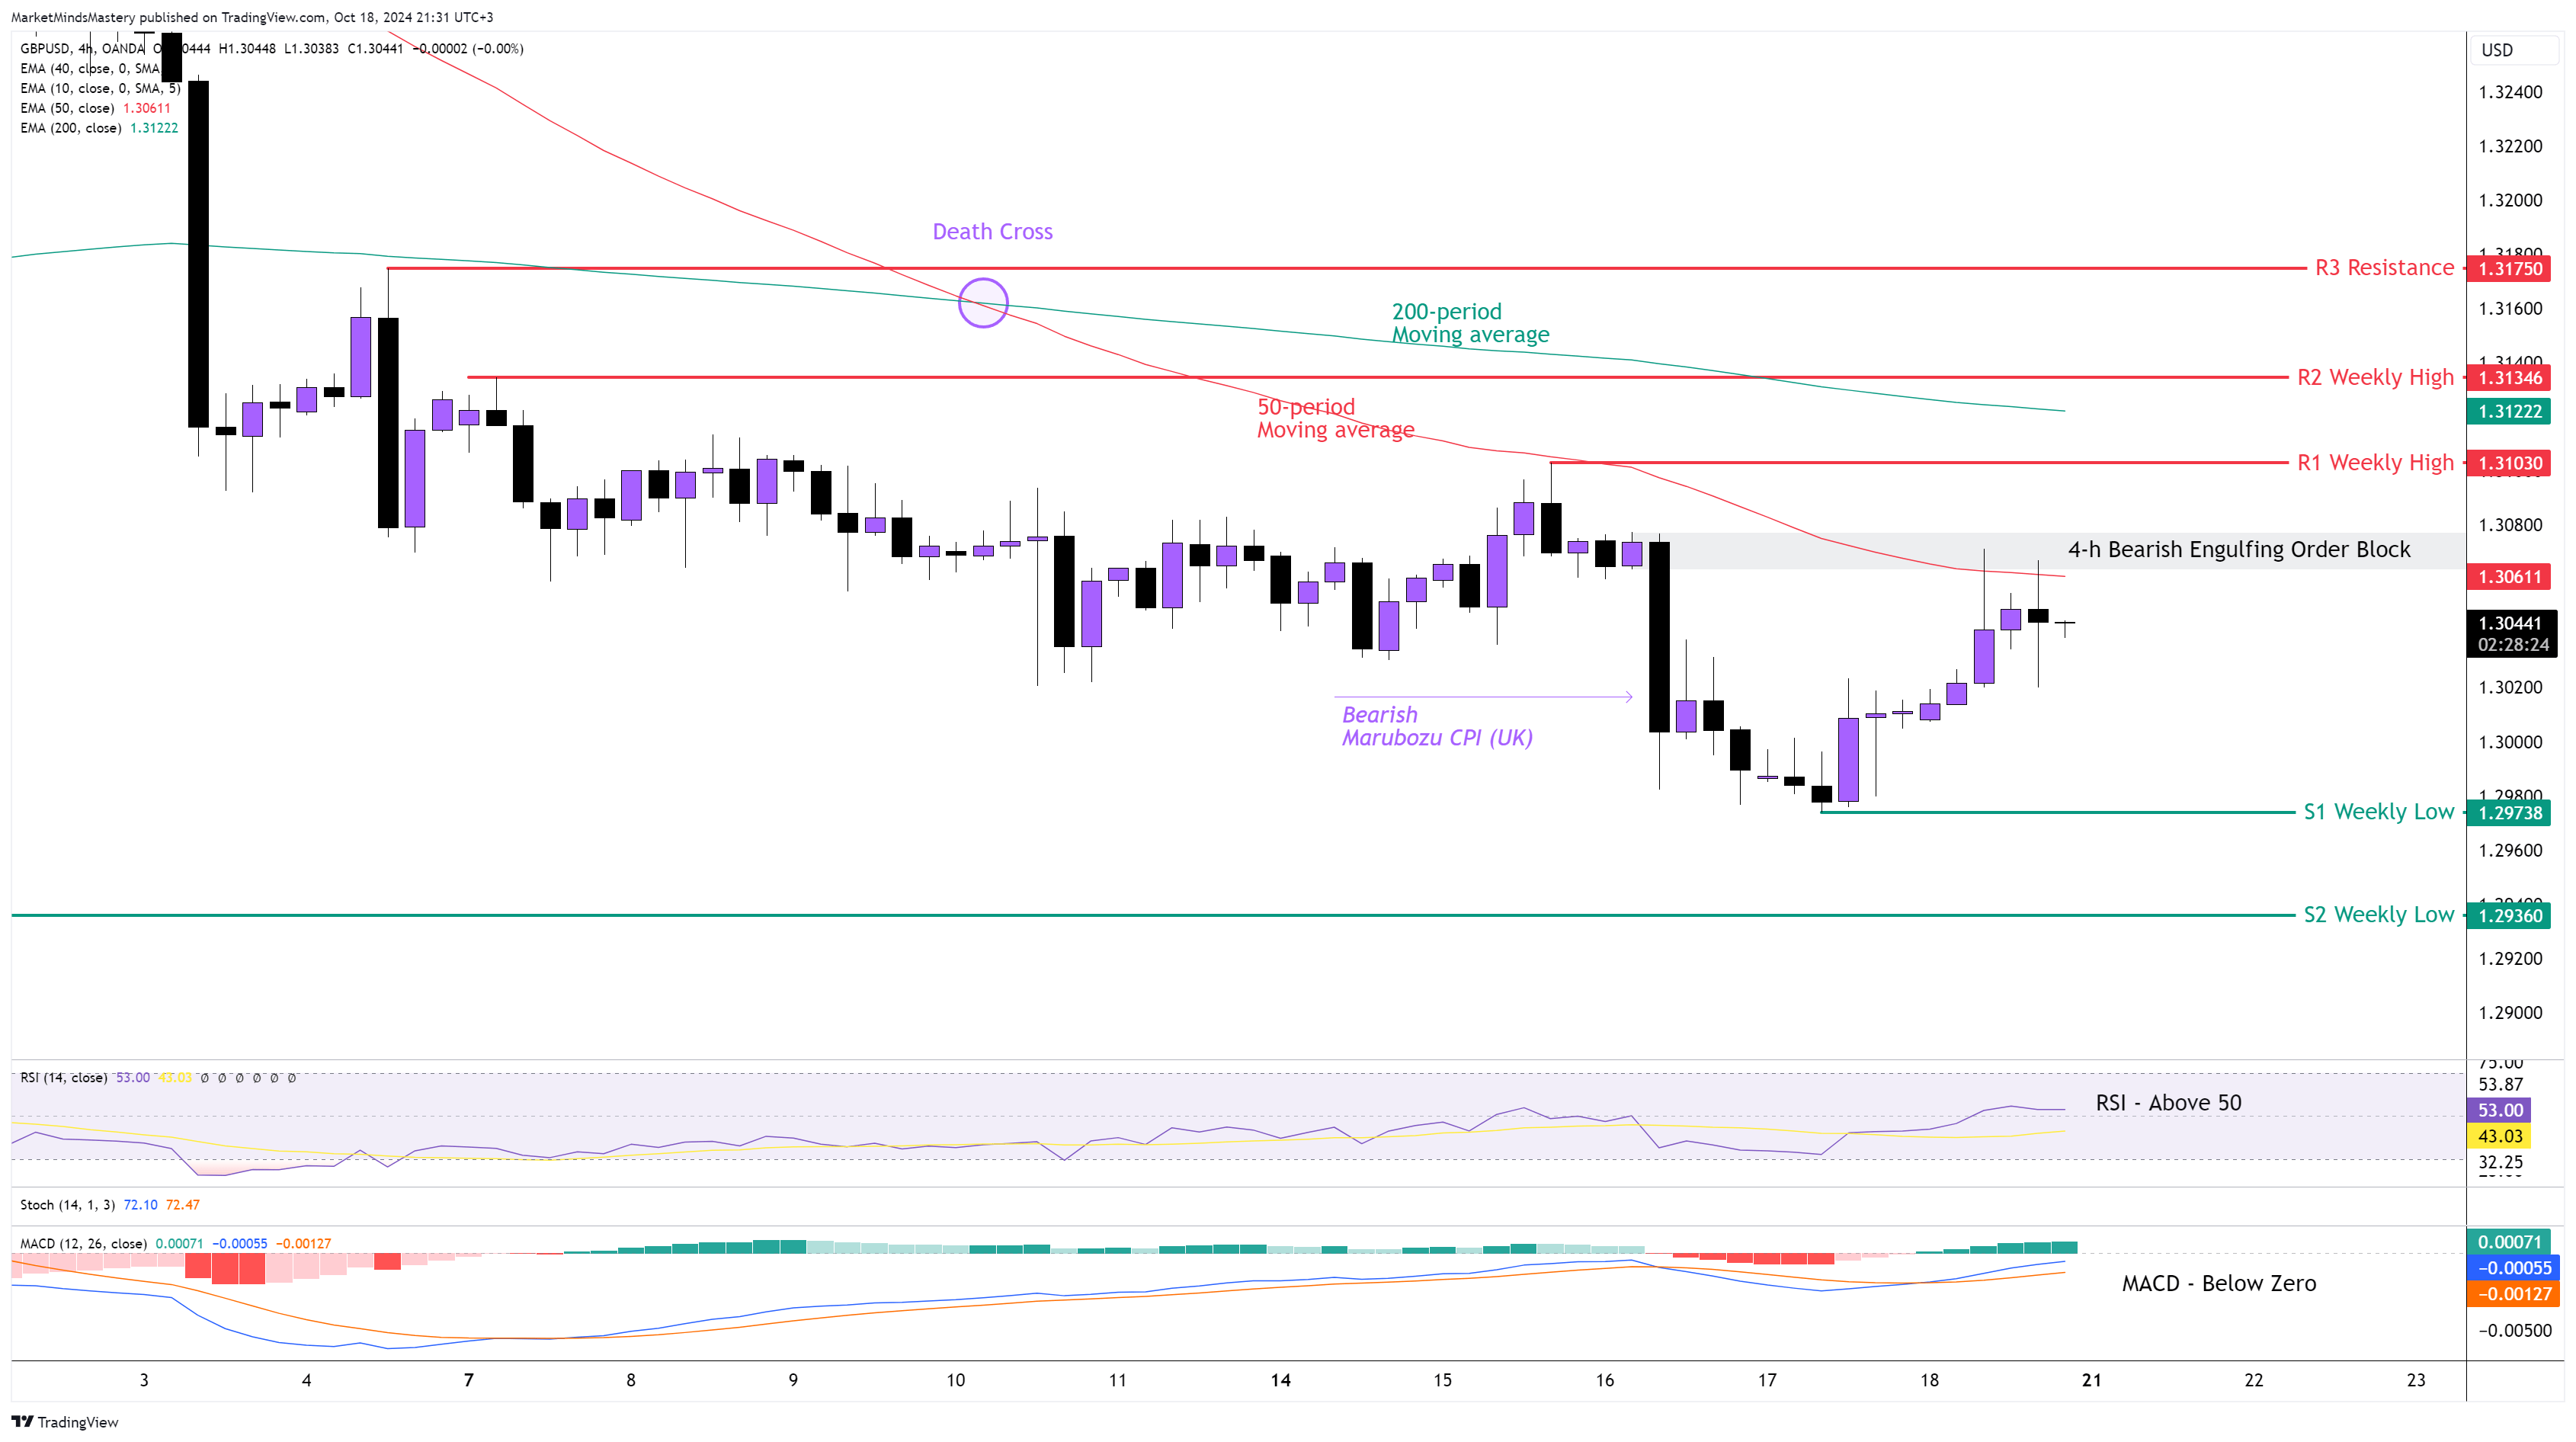
Following the Bearish momentum in GBPUSD, the currency pair continued its downward move last week, primarily because of Sterling’s weaknesses rather than the US dollar’s strength. On the weekly chart, the candlestick price action is called a long-legged doji. On the 4-hour chart, the 50-period moving average crossed below the 200-period moving average, which is called the "Death Cross," and it has bearish implications.
The price created a Bearish Marubozu candlestick pattern last week after the UK CPI (Consumer Price Index) report, which negatively affected the Sterling and forced the GBPUSD to move downwards. The price then found temporary support at the 1.29738 level, which marks the S1 Weekly Low. However, as the price remains below the 4-hour Bearish Engulfing Order Block, which was created last Wednesday at around 1.30610, it can become a potential resistance zone for the price. The RSI is above 50, and this has bullish implications. The MACD is below the zero line, but it created a Bullish Crossover once the MACD Line (Blue) crossed above the Signal Line (Orange), which is also bullish.
Starting Monday, if the price moves upwards, the first resistance area, R1, will be at 1.31030, the previous week’s high. If the price surpasses the R1 resistance and keeps moving upwards, the next resistance area, R2, will be around 1.31346, another weekly level. If the price penetrates the R2 resistance and keeps moving upwards, then the next resistance area, R3, will be at 1.31750.
Alternatively, if the price is rejected and moves downwards, the first support area, S1, will be around 1.29738, the previous week’s low. If the price surpasses the S1 support and keeps moving downward, the next support area, S2, will be approximately 1.29360, which is an older weekly level.
AUD USD 4H
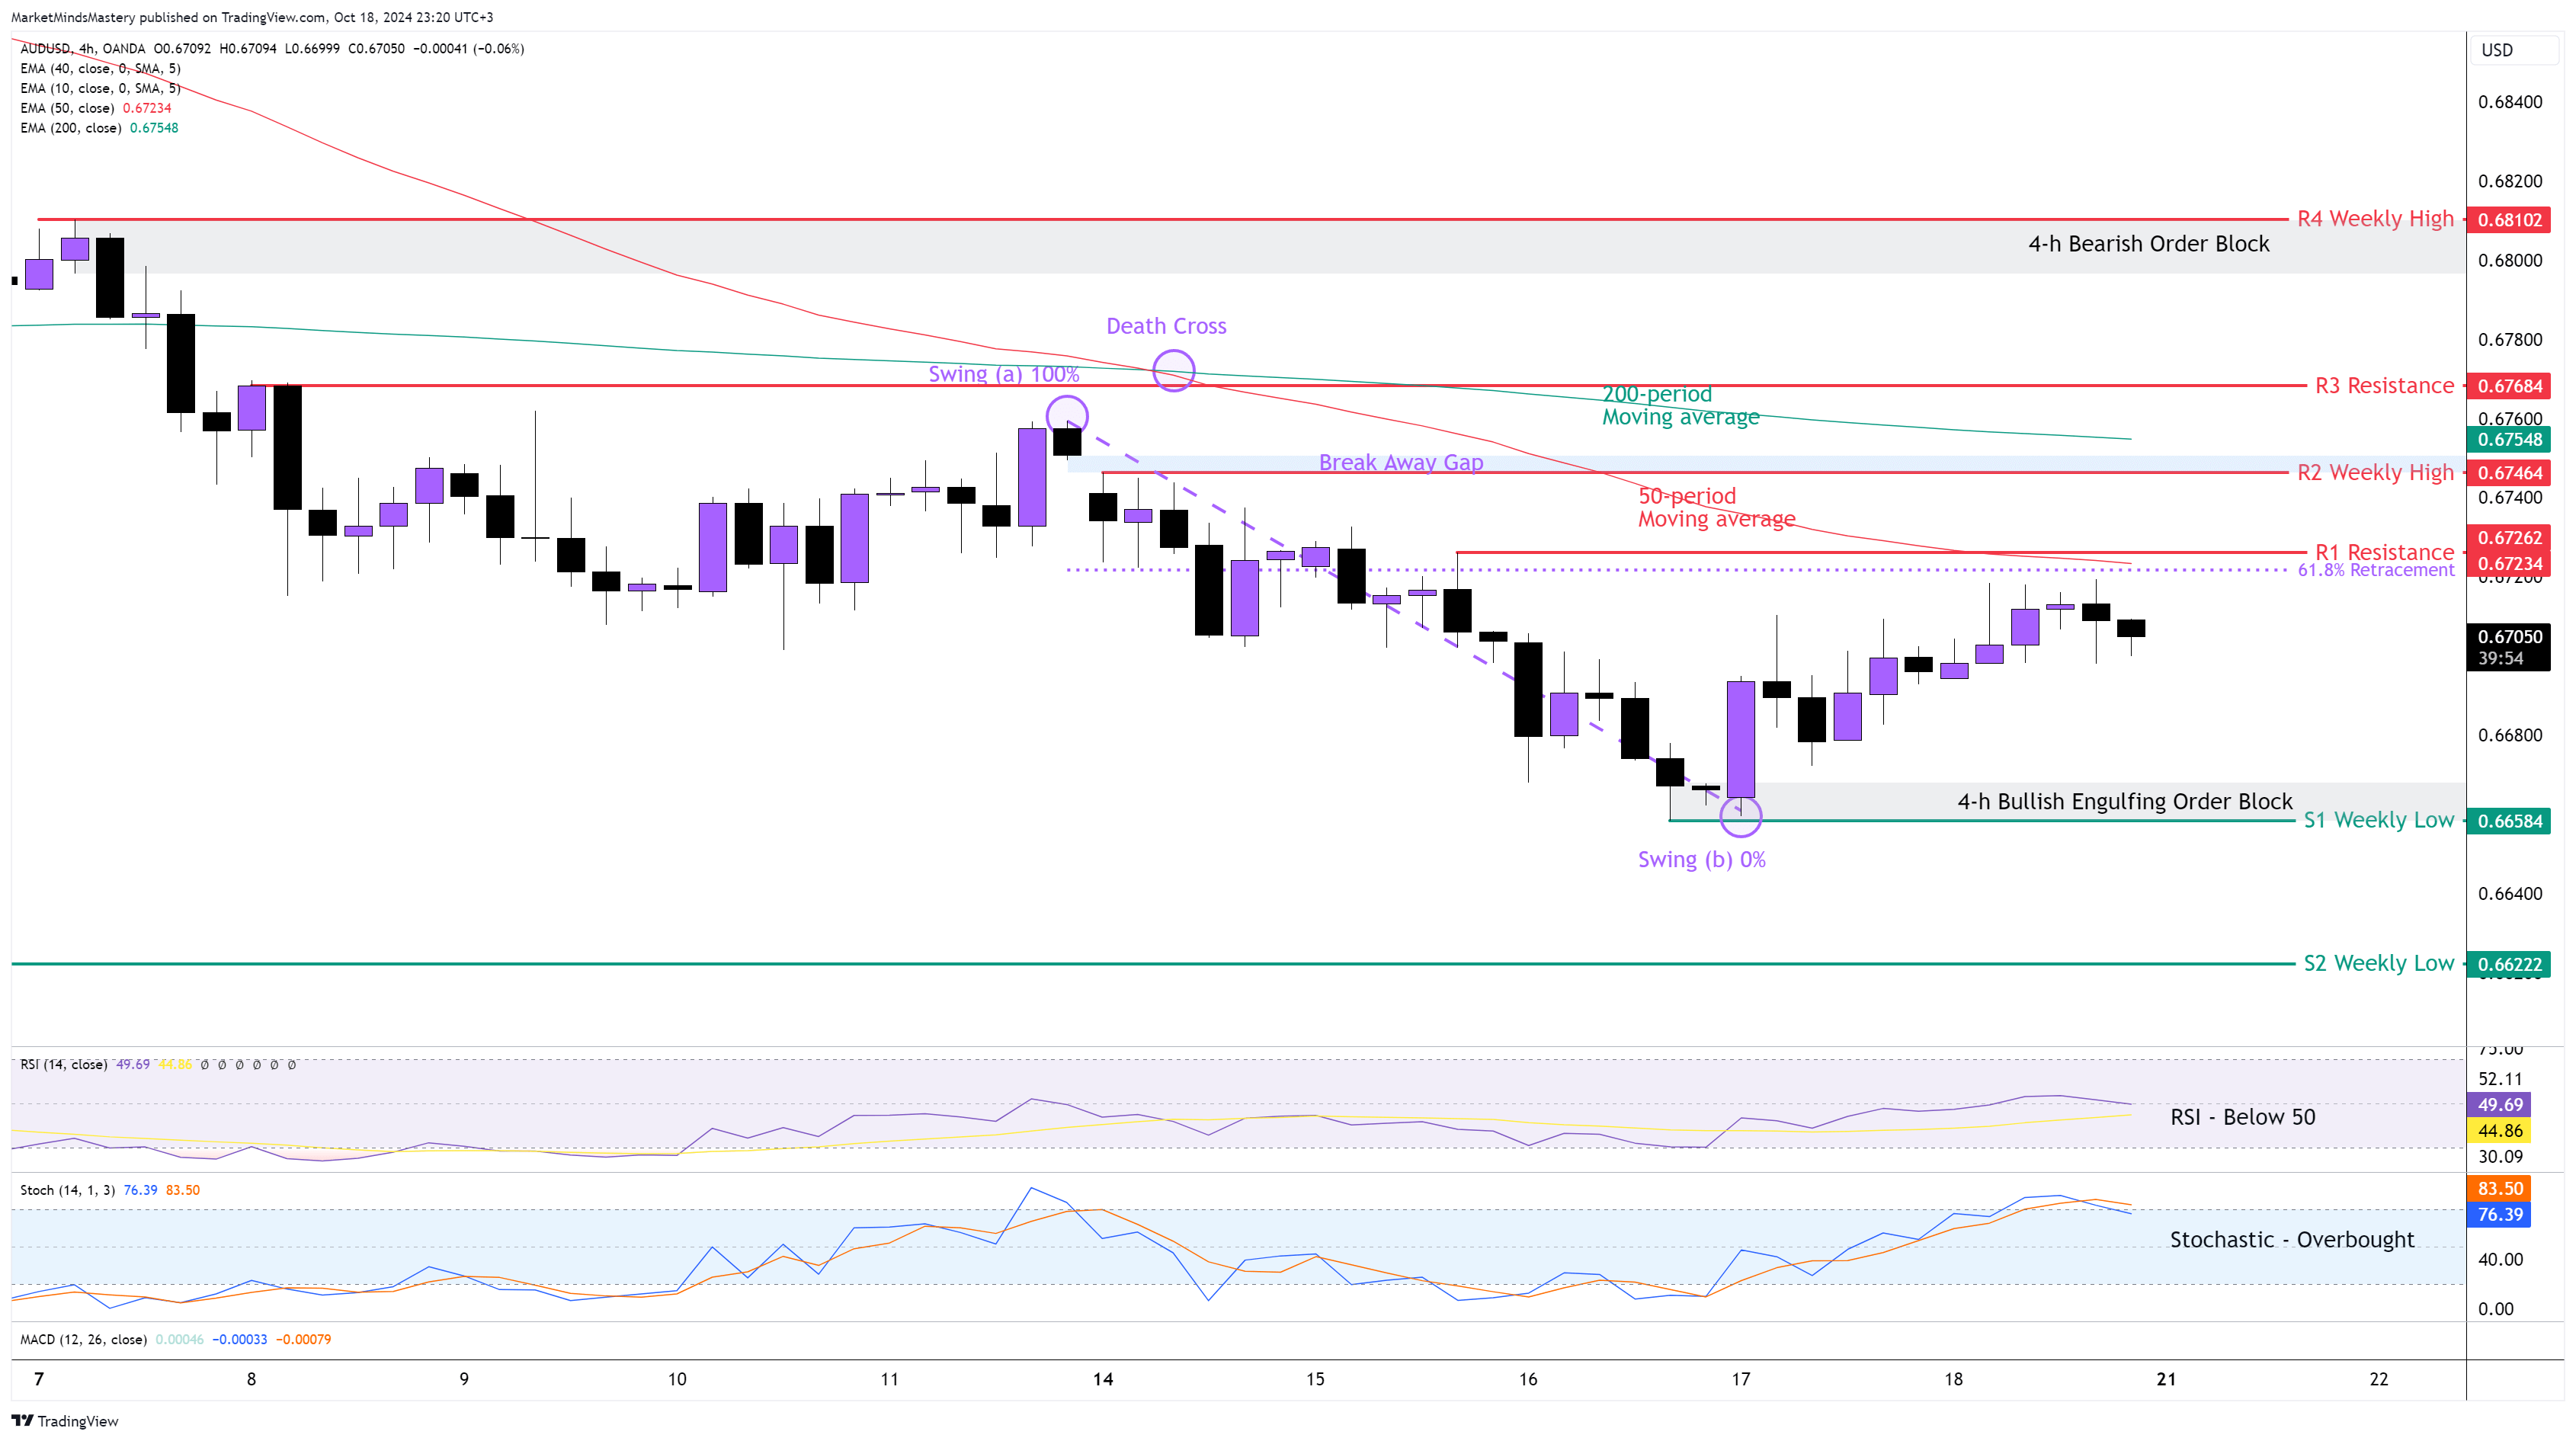
Despite the price decline last week on the AUDUSD weekly chart, the primary trend is an uptrend, as the 10-period is above the 40-period weekly moving averages (not shown on the chart). The improved number in the Unemployment rate in Australia last Thursday was the driving factor for the upward move that occurred since last Thursday in the AUDUSD. On the 4-hour chart, the 50-period is crossed below the 200-period moving average. This has bearish implications. This crossover is called "Death Cross", and it occurred last Monday. While this happened, the price moved through a Break Away Gap after the swing high at point (a) at 0.67684. The price then moved downwards, creating a 4-hour Bullish Engulfing Order Block around 0.66584 last Thursday. The RSI is below its middle line of 50, indicating bearishness. The Stochastic Oscillator is at its Overbought condition and it created a Bearish Crossover as the %K Line (Blue) crossed below the %D Line (Orange).
Starting Monday, If the price moves upwards, the first resistance area, R1, will be around 0.67262. This price level is considered a key level of resistance as it consists of the Golden Ratio 61.8% Fibonacci from the swing high at point (a) to the swing low at point (b) and the 50-period moving average, as shown on the chart. In case the price penetrates the R1 and keeps moving upwards, the next resistance area, R2, will be at 0.67464, which is the previous week’s high. If the price surpasses the R2 resistance and keeps increasing, then the next resistance area, R3, will be approximately 0.67684. This price level coexists with the 200-period moving average, and it can become an additional resistance to the price.
Conversely, if the price is rejected and moves downwards, the first support area, S1, will be around 0.66584, which is the previous weekly low. If the price penetrates the S1 support and keeps moving downwards, the downtrend will resume, and the next support area, S2, will be at 0.66222, which is an older weekly level.
USD JPY 4H
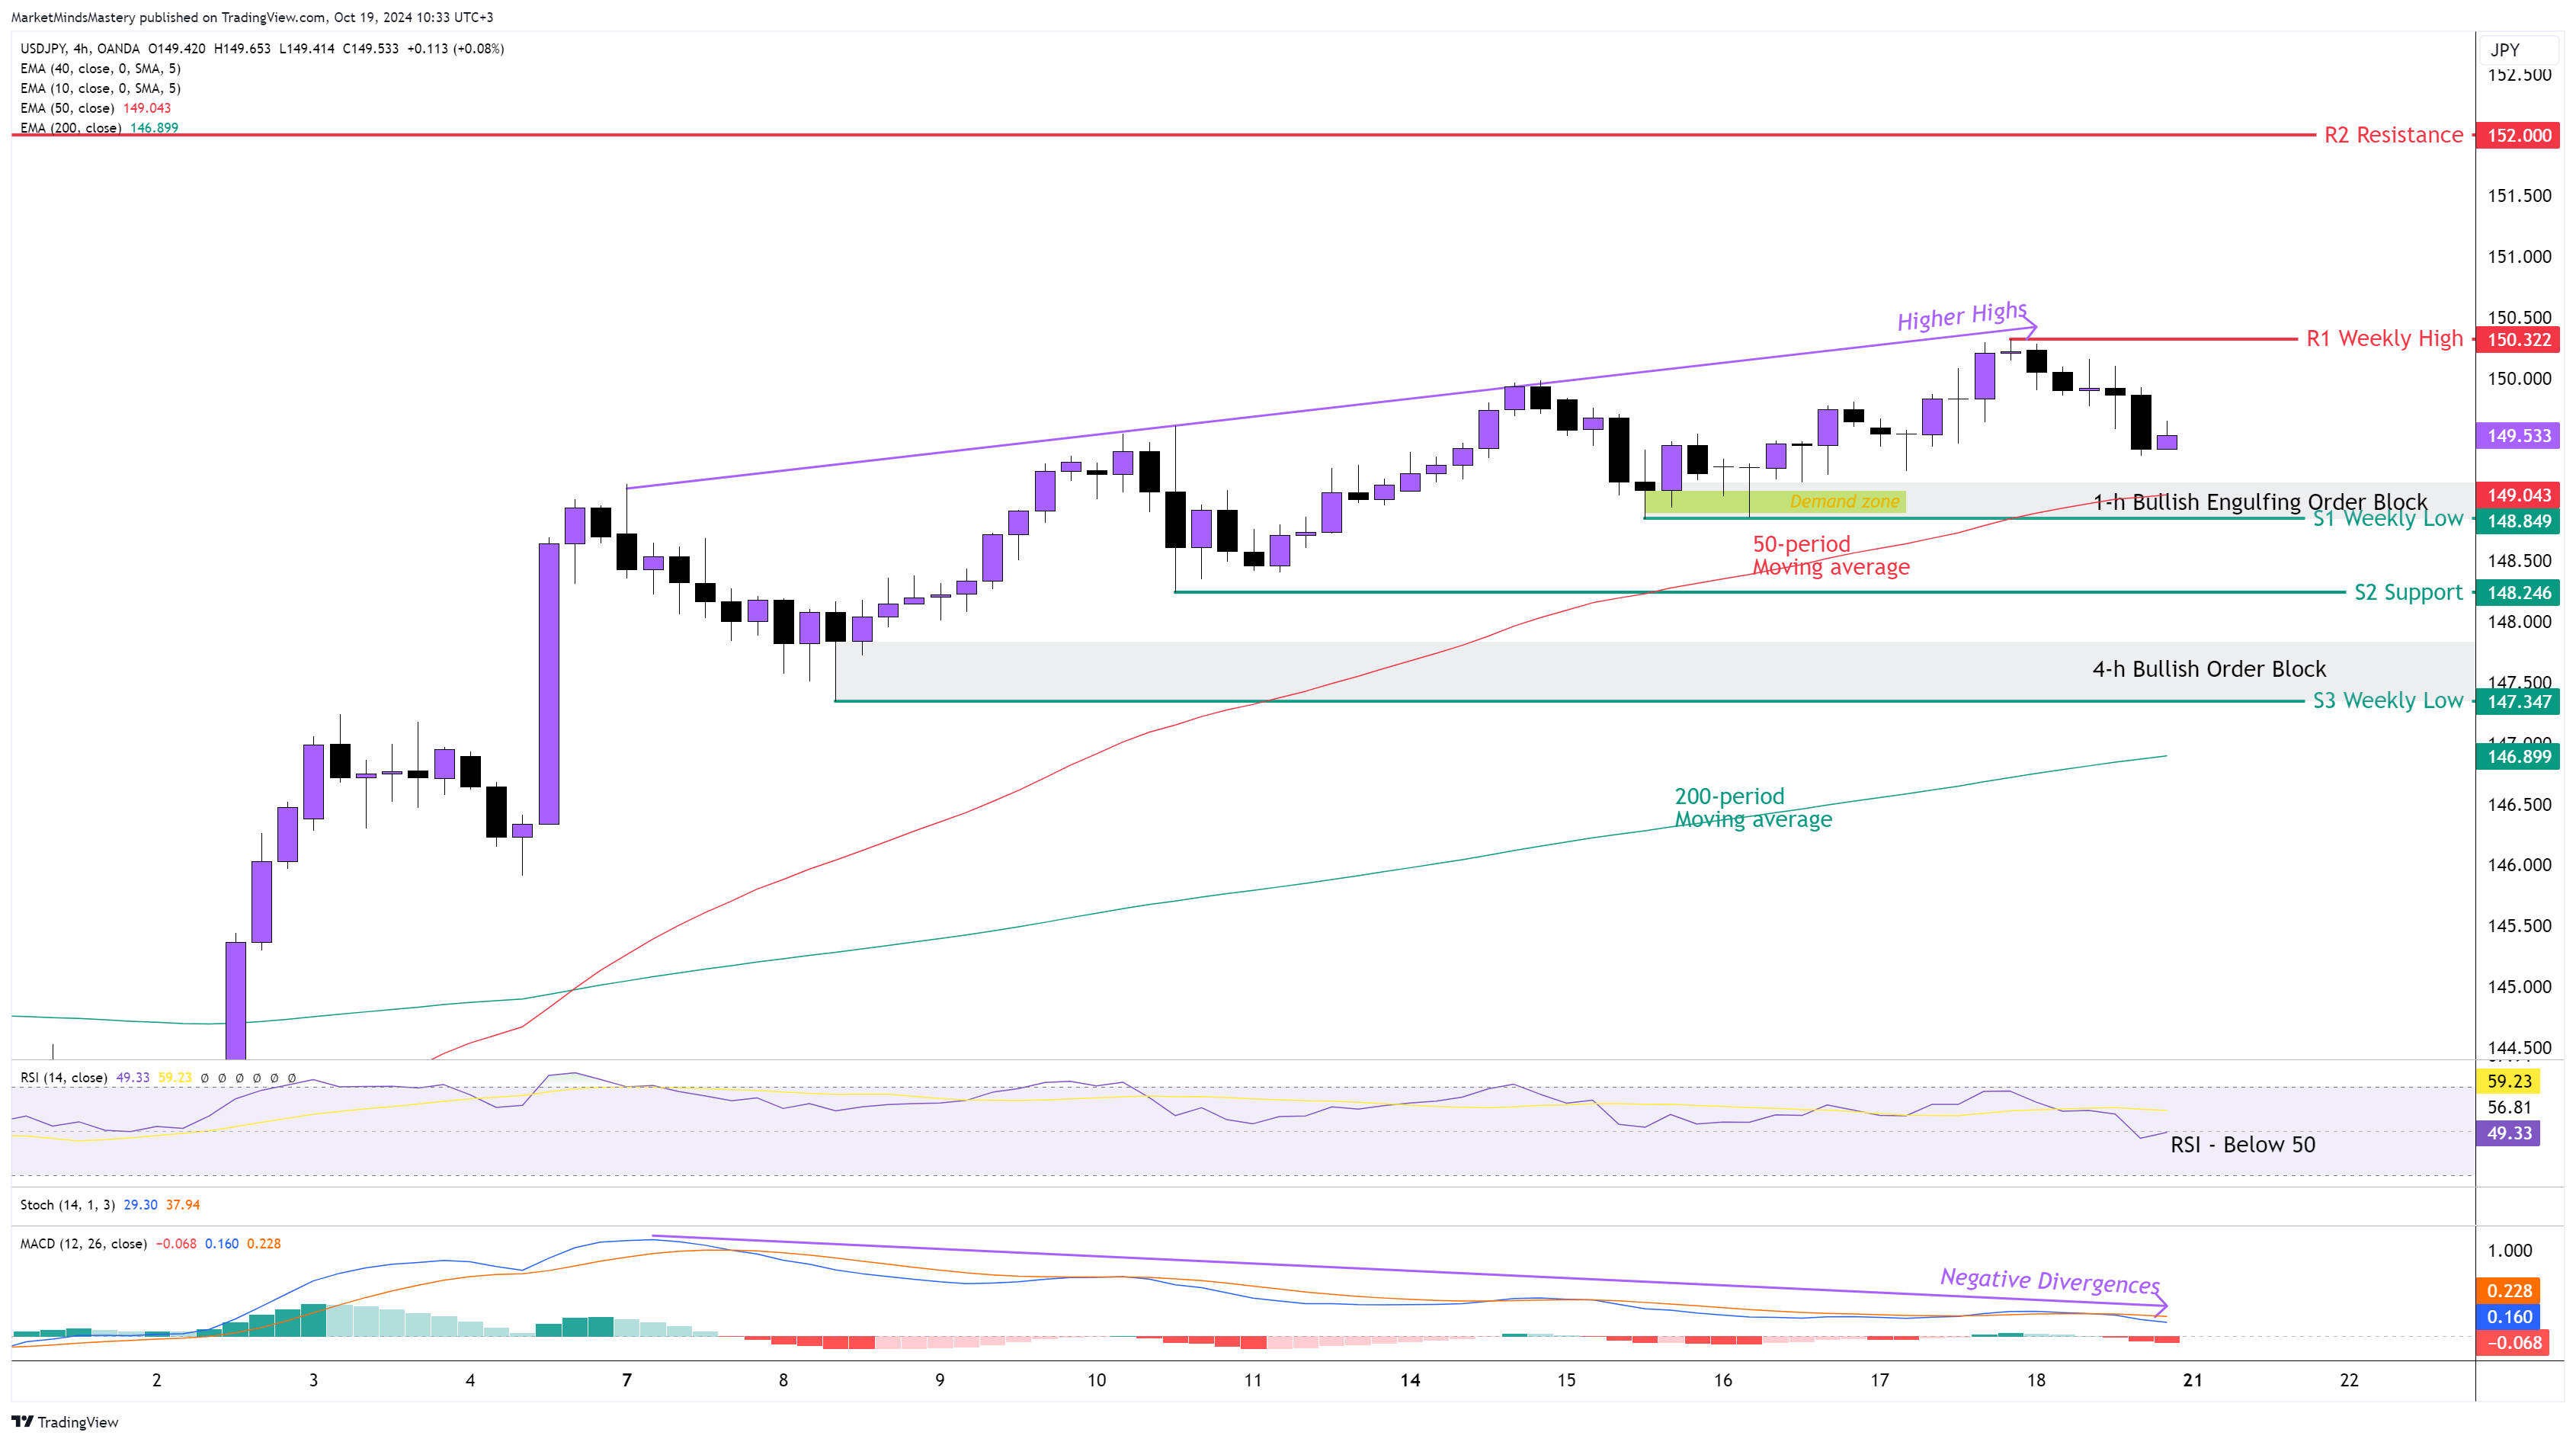
Following the previous week’s Market Outlook, the USDJPY price keeps moving upwards. However, the weekly chart created a Shooting Star reversal Price Action. On the 4-hour chart, the price kept increasing making higher highs and higher lows formation. Still, at the same time, the MACD showed Negative Divergences for the second week in a row, indicating the lack of bullish momentum in this market. The 50-period moving average is above the 200-period moving average, which is bullish. The RSI Oscillator is flat around its middle line of 50. Currently, the price is above the 50-period moving average. If the price remains above the 50-period and keeps moving upward, the first resistance area, R1, will be around 150.322, which is the previous week’s high. If the price penetrates the R1 and keeps moving upwards, the next resistance area, R2, will be at 152.000.
On the other hand, if the price moves downwards, the first key level of support, S1, will be 148.84. The reason we consider this as a key level of support is that it consists of the Bullish Engulfing Order Block created last Tuesday, and it can act as additional price support. Also, the 50-period moving average is in this area. If the price penetrates the S1, it will change the market structure, and the current uptrend will come to an end. If the price keeps moving downwards, the next support area, S2, will be at 148.24. If the price surpasses the S2 and keeps lowering, the next support area, S3, will be an older weekly level of around 147.34. At this level, a Bullish Order Block was created a few weeks ago, and it hasn’t been tested yet.
USD CHF 4H
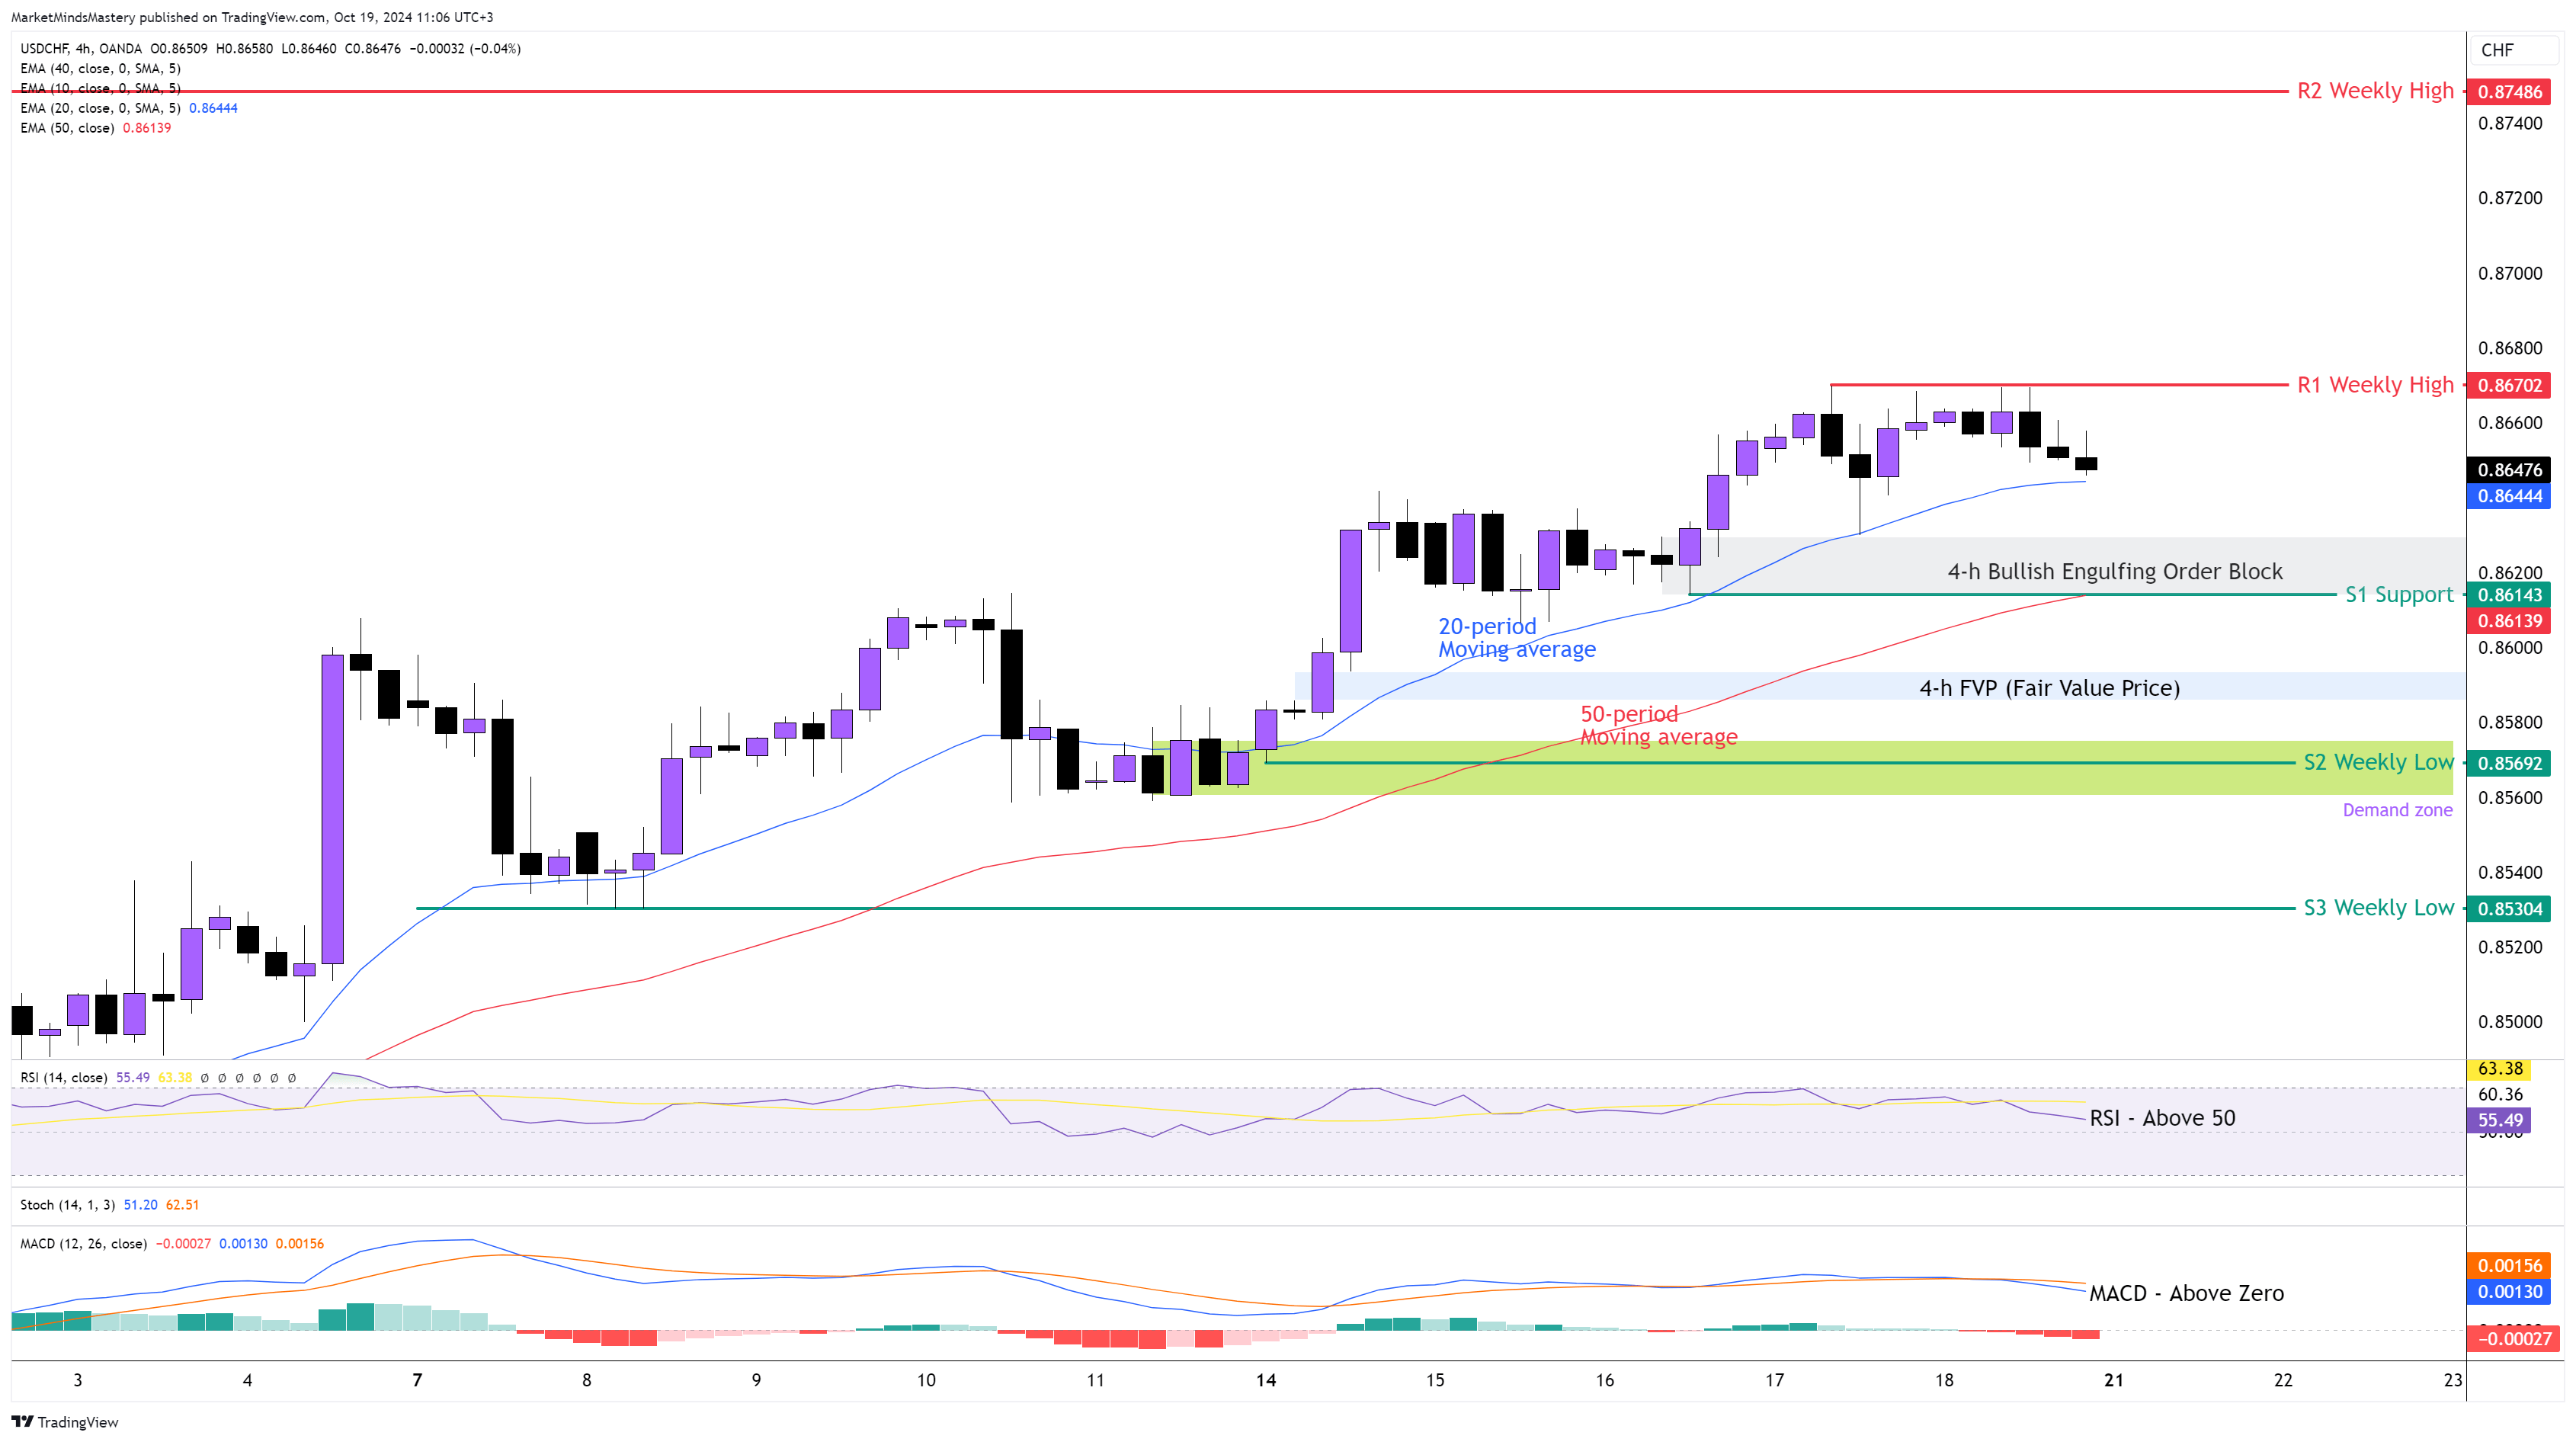
Last week, the Swiss Frank was considered one of the weakest currencies overall, giving the USD an advantage. On the weekly chart of the USDCHF, the price ended as a Bullish Continuation candle, with the candlestick’s closing price above the 10-period weekly moving average. On the 4-hour chart, the 20-period is above the 50-period moving average, and this is bullish. The RSI Oscillator is above its middle line of 50, which has bullish implications. The MACD is also above the zero line. Currently, the price is above the 20-period moving average.
Starting Monday, if the price remains above the 20-period and keeps moving upwards, the first resistance area, R1, will be around 0.86702, which is the previous week’s high. If the price penetrates the R1 and keeps moving upwards, the next resistance area, R2, will be at 0.87486, which is an older weekly level.
Conversely, if the price is rejected and moves downwards, the first support area, S1, will be around 0.86143. At this price level, a Bullish Engulfing Order Block was created last Wednesday, and it can act as additional price support. If the price penetrates the S1 and keeps moving downward, the price will test the FVP (Fair Value Price) that was created last Monday. If the price keeps moving lower, the next support area, S2, will be at 0.85692, which is the previous week’s low and also a significant Demand area, as shown on the chart. A further downward move will find the next support area, S3, around 0.85304.
GBP JPY 4H
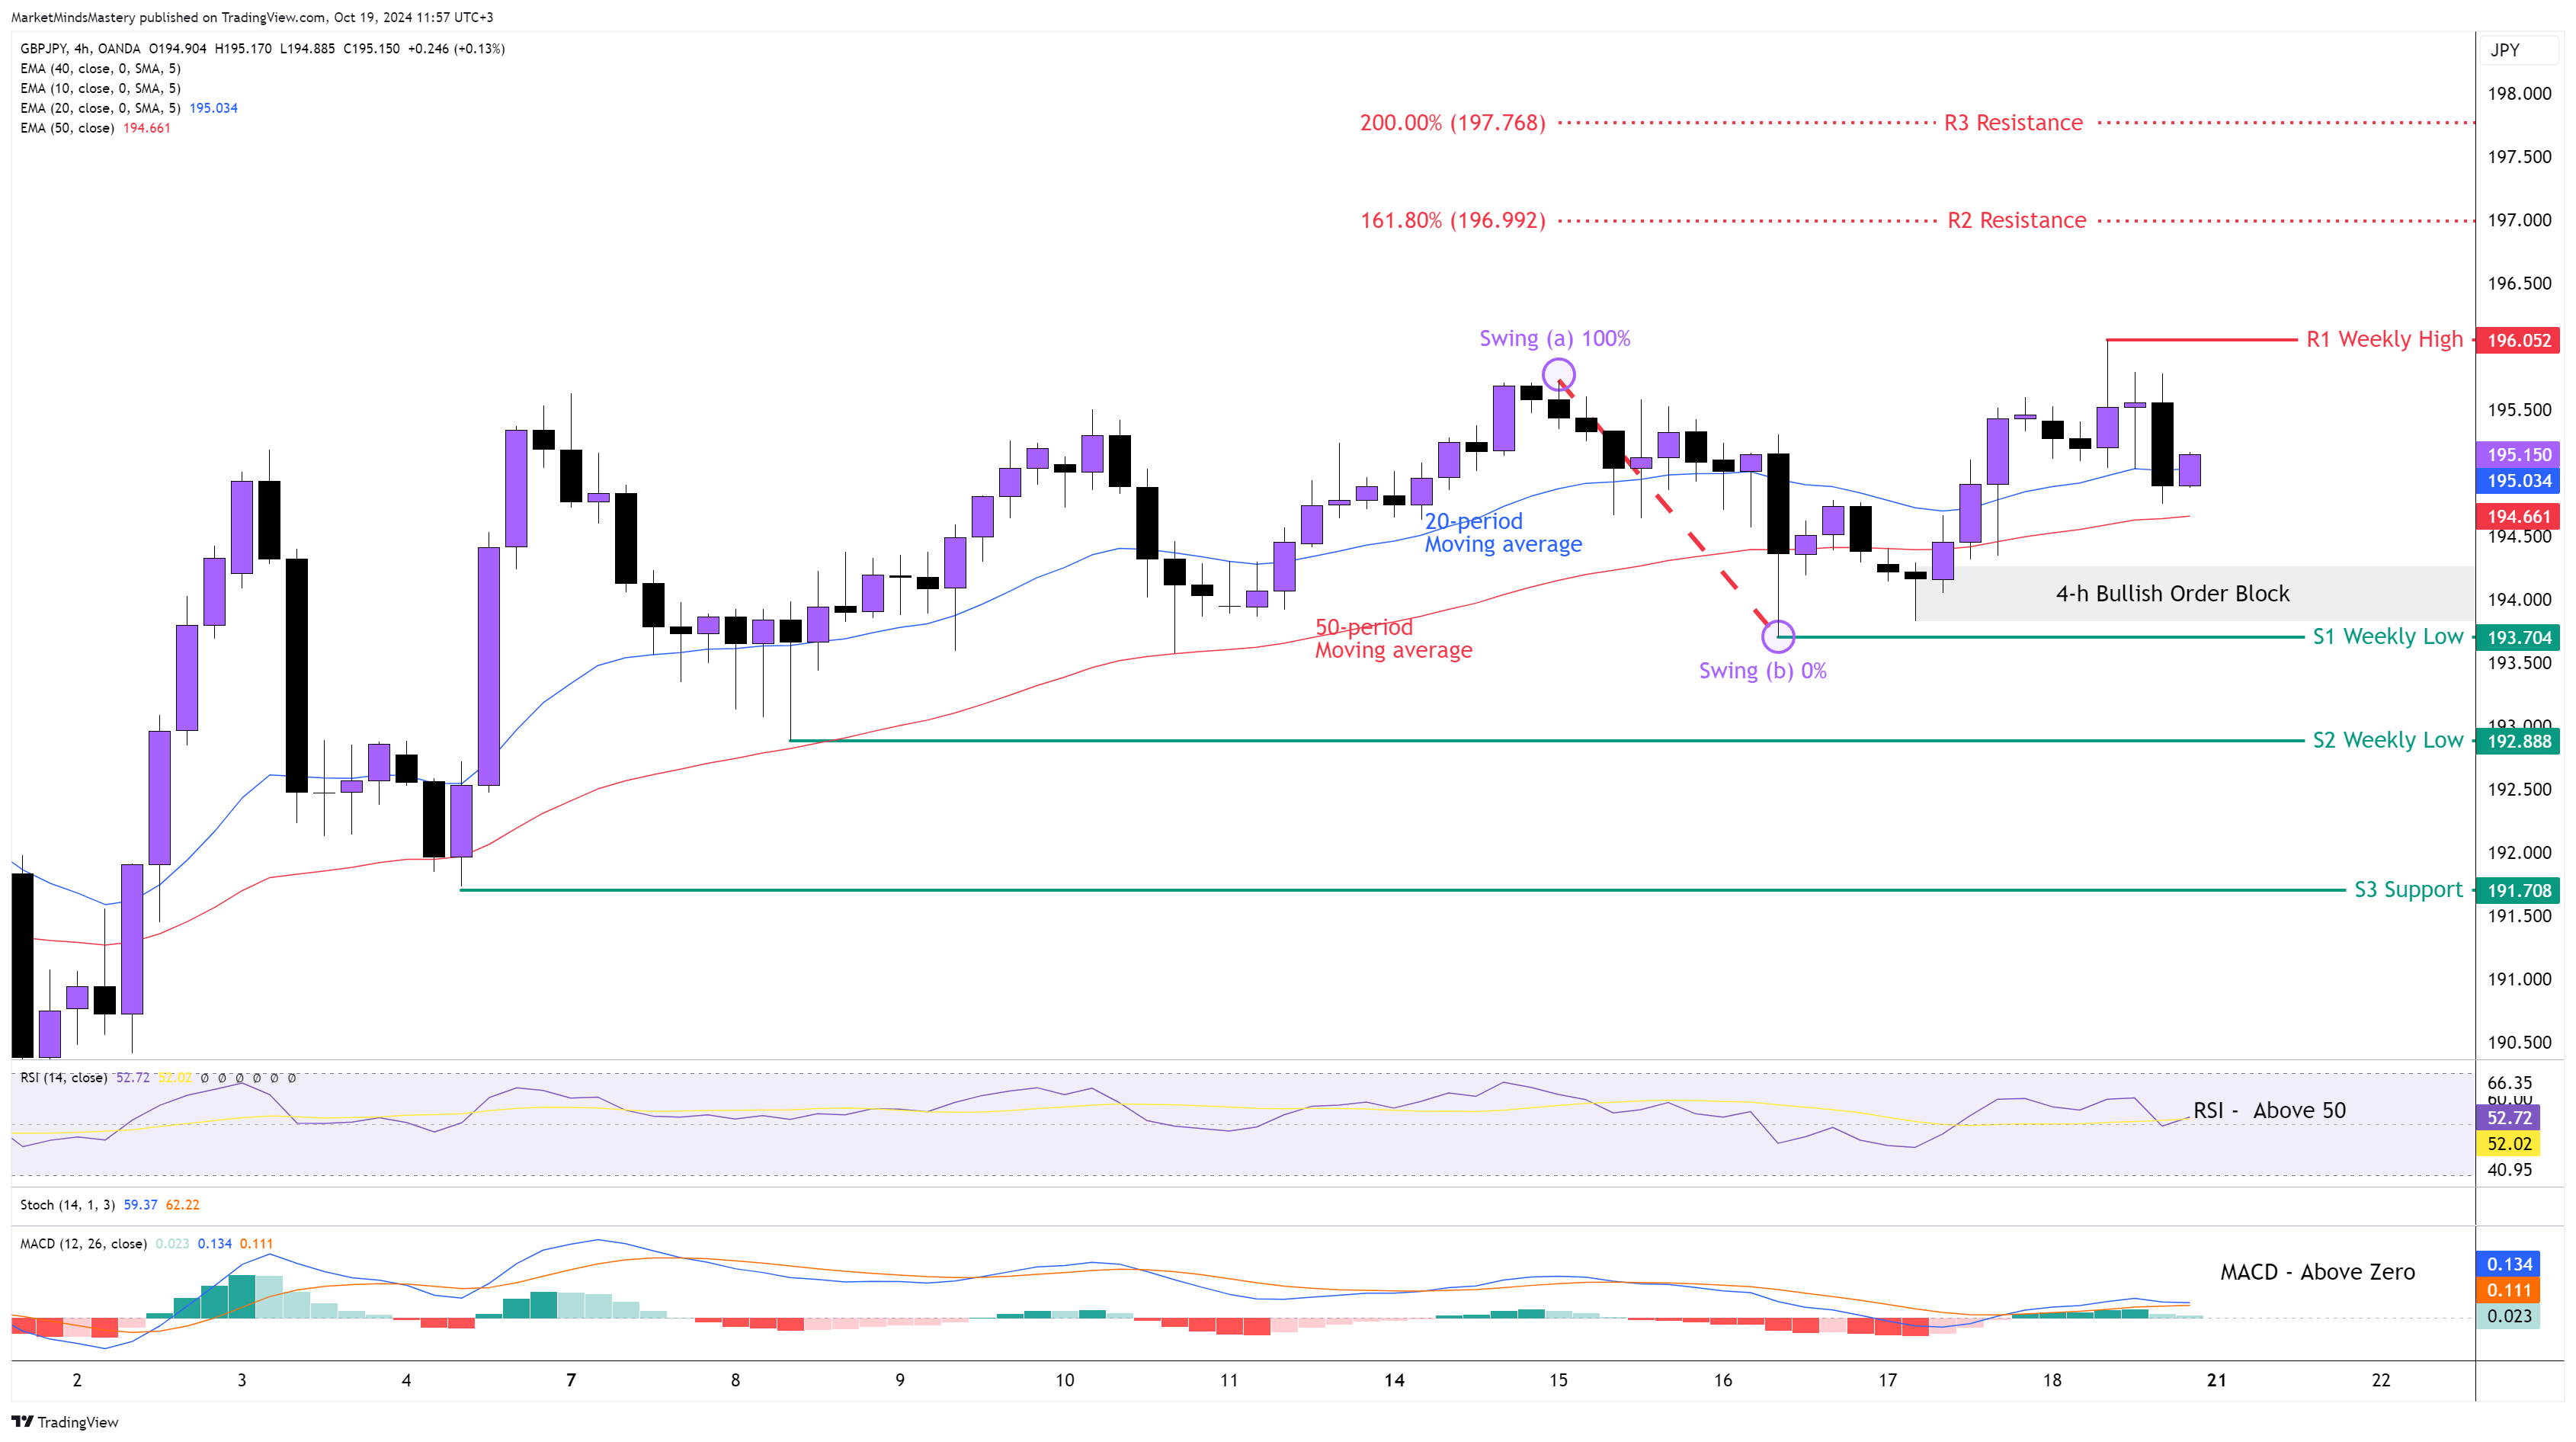
Following the previous week’s Market Outlook, the price of the GBPJPY currency pair maintained a bullish bias as the price on the weekly chart ended as a Long-Legged Doji candlestick. This caused the price on the 4h-chart to move sideways. As per the moving averages analysis, the 20-period is above the 50-period, which is bullish. However, their distance is becoming narrower, which is an indication of the market’s sideways move. The RSI is above its middle line of 50, and this is bullish. The MACD is also above the zero line, which has bullish implications. If the price keeps moving upwards, the first resistance area, R1, will be around 196.052, which is the previous week’s high. If the price penetrates the R1, it means the market will resume its uptrend, and if the price keeps rising, the next resistance area, R2, will be at 196.992, which is the 161.8% Fibonacci Extension if we measure the swing from point (a) until the swing at point (b) as shown on the chart. If the price penetrates the R2 and keeps moving upwards, the next resistance area, R3, will be 197.768, which is the 200% Fibonacci extension.
On the other hand, if the price is rejected and moves downwards, the first support area, S1, will be around 193.704, which is the previous week’s low. This is considered a key level of support for this market because an Order Block was formed last Thursday, and it can act as additional support. If the price penetrates the S1, it will create a new market structure. In this case, if the price keeps moving downwards, the next support area, S2, will be around 192.888, which is an older weekly low. A further downward move will find the next support area, S3, at approximately 191.708.
GOLD 4H
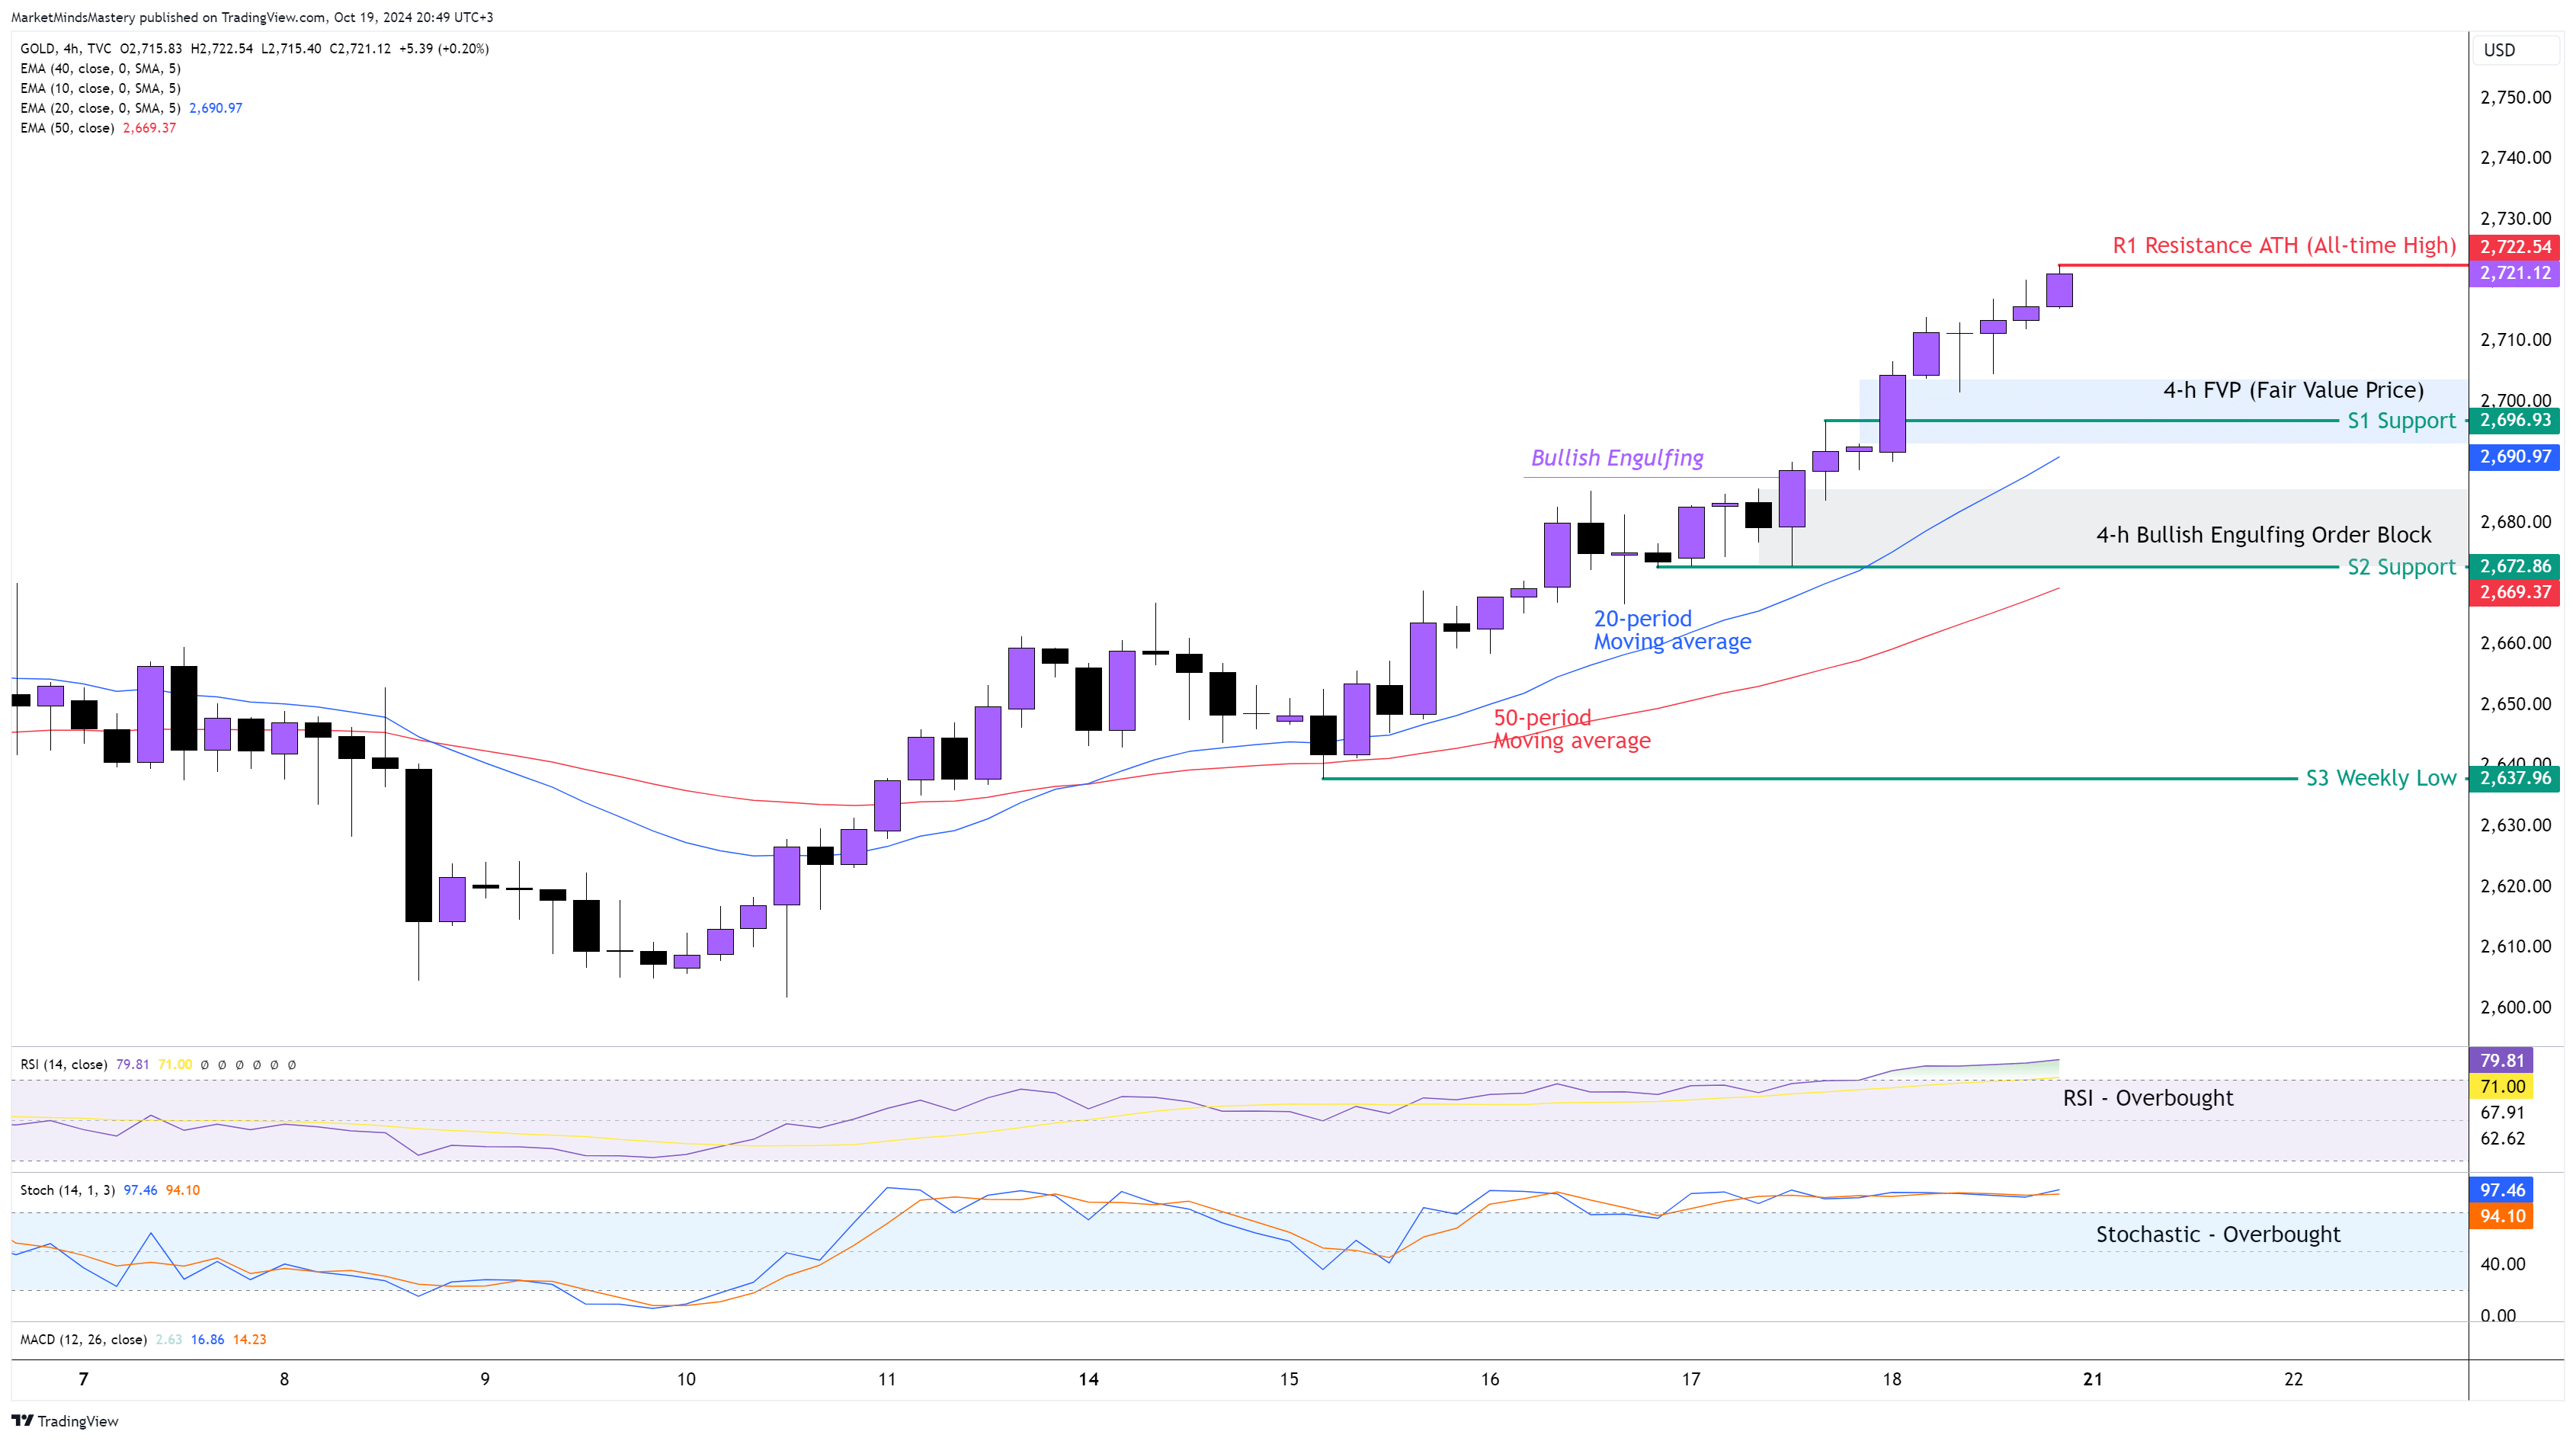
Last week, we explained why the GOLD is in a strong Bullish Momentum. The weekly chart is not only in an uptrend, but also the price action indicates bullish momentum. Hence, last week, the price created a new ATH (All-Time High) around $2721, and the weekly candlestick’s closing price is near its high point. On the 4-hour, though, the 20-period is above the 50-period moving average, and this is bullish. Most of the previous week’s candles were bullish candles, and the retracement that occurred was shallow and had a very short duration. The RSI is in an Overbought condition, indicating bullishness. Since last Tuesday, the Stochastic Oscillator moved above its upper boundary of 80 and became Overbought as the price rallied aggressively. If the price continues its upward move and it will keep moving upwards, the first resistance area, R1, will be the ATH at $2722. Suppose the price penetrates the R1 and keeps moving upwards. In that case, we can not estimate the next resistance area using the Fibonacci Extension because there are no swings on the price chart created from a price retracement for this purpose.
On the other hand, If the price moves downwards, the first support area, S1, will be around $2696. This price level coexists with an FVP (Fair Value Price), which was created last Friday, and it can act as additional support. If the price penetrates the S1 and keeps moving downwards, the next support area, S2, will be approximately $2672. This is considered a key level of support as it consists of the 50-period moving average and the Bullish Engulfing Order Block, which formed last Thursday and hasn’t been tested yet. In case the price declines further, the next support area, S3, will be at $2637, which is the previous week’s low.
USOIL 4H
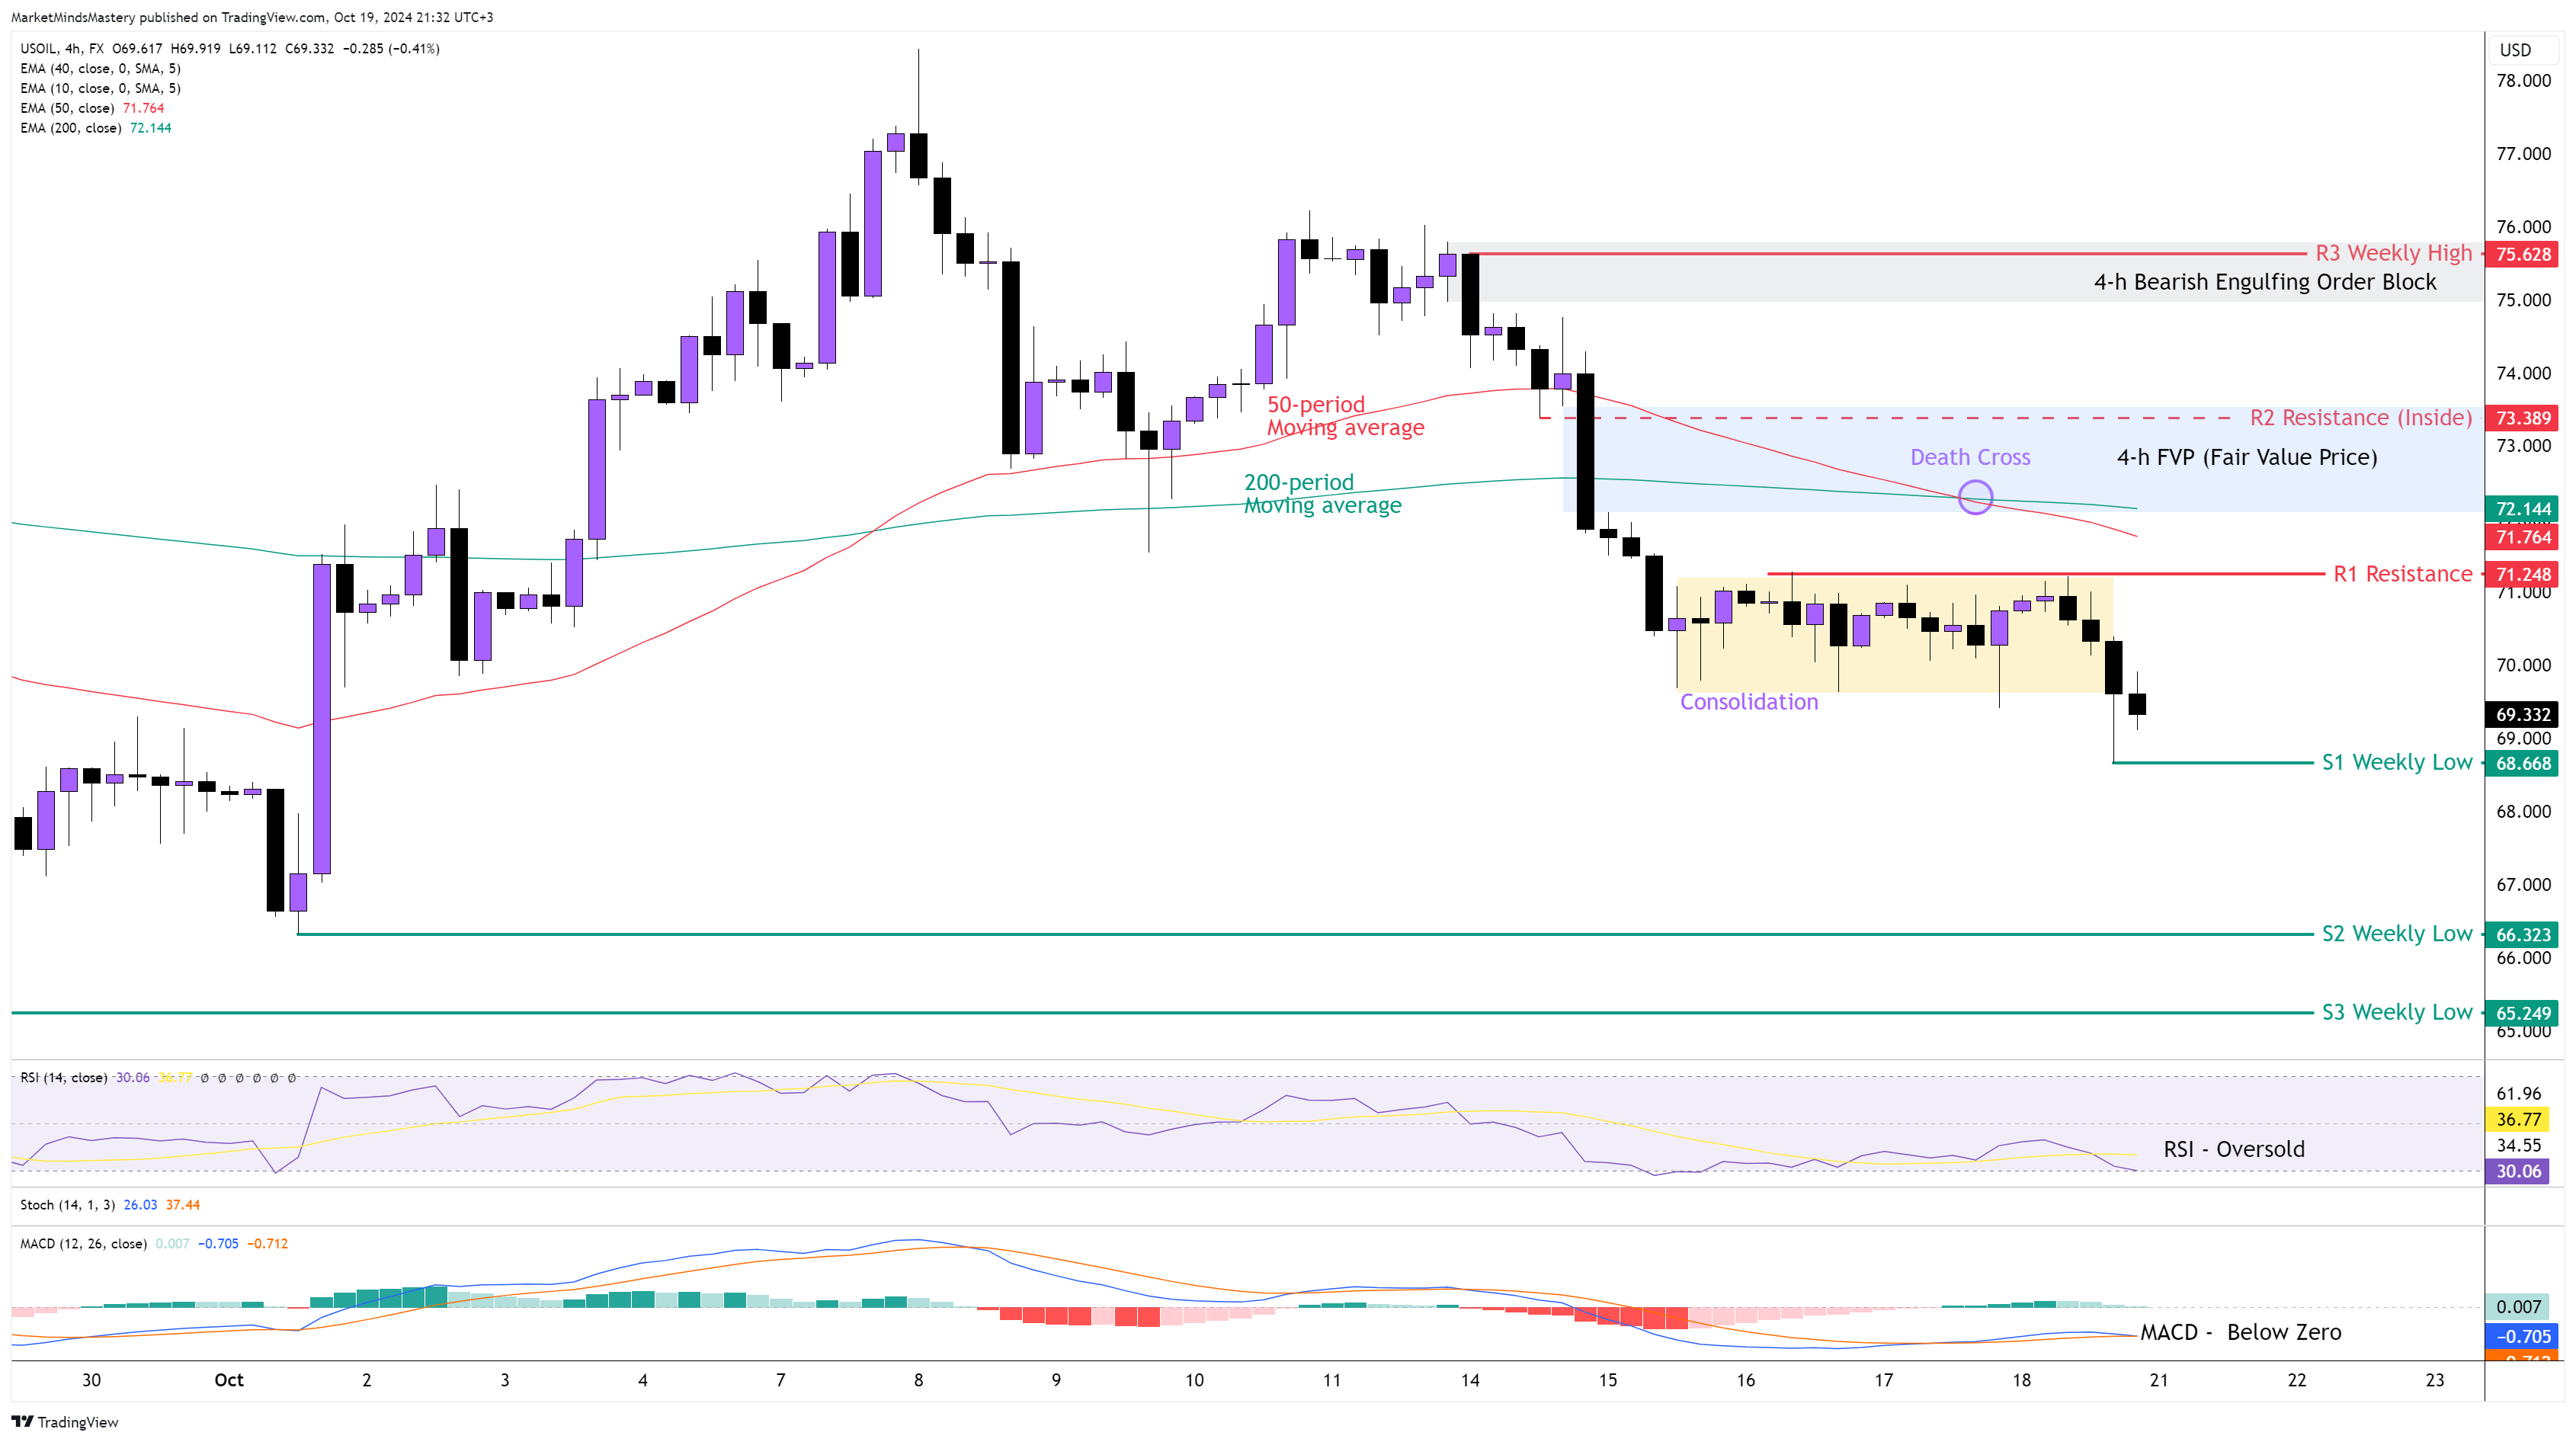
As per the previous week’s market analysis, we explained that the weekly price action could force the price to bearish momentum due to the weekly Spinning-top candlestick rejecting the 40-period weekly moving average. Last week, the price sold off aggressively, and the weekly candle ended as a Bearish Continuation candlestick pattern. On the 4-hour chart, the 50-period crossed below the 200-period moving average last Thursday, known as the Death Cross. The RSI Oscillator is in an Oversold condition, indicating bearishness. The MACD is below its zero line, and this has bearish implications. Last Tuesday, the price created a consolidation phase, which was resolved with a downward breakout last Friday during the New York trading session. Therefore, if the price will continue moving downwards, the first support area, S1, will be around $68.66, which is the previous week’s low. In case the price penetrates the S1 and keeps declining, the next support area, S2, will be $66.32, which is an older weekly level approximately 220 pips away from the S1.
Conversely, if the price finds support, bounces off and starts moving upwards, the first resistance area, R1, will be around $71.24. If the price surpasses the R1 and keeps increasing, the next resistance area, R2, will be an Inside resistance of approximately $73.38. This level coexists with the FVP (Fair Value Price) that was created last Monday, and It hasn’t been tested yet. If the price surpasses the R2 resistance and keeps moving upward, the next resistance area, R3, will be around $75.62, which is the previous week’s high. This is considered a key resistance level because it coexists with the 4-h Bearish Engulfing Order Block that was also created last Monday, and it can act as an additional resistance.
BTC USD 4H
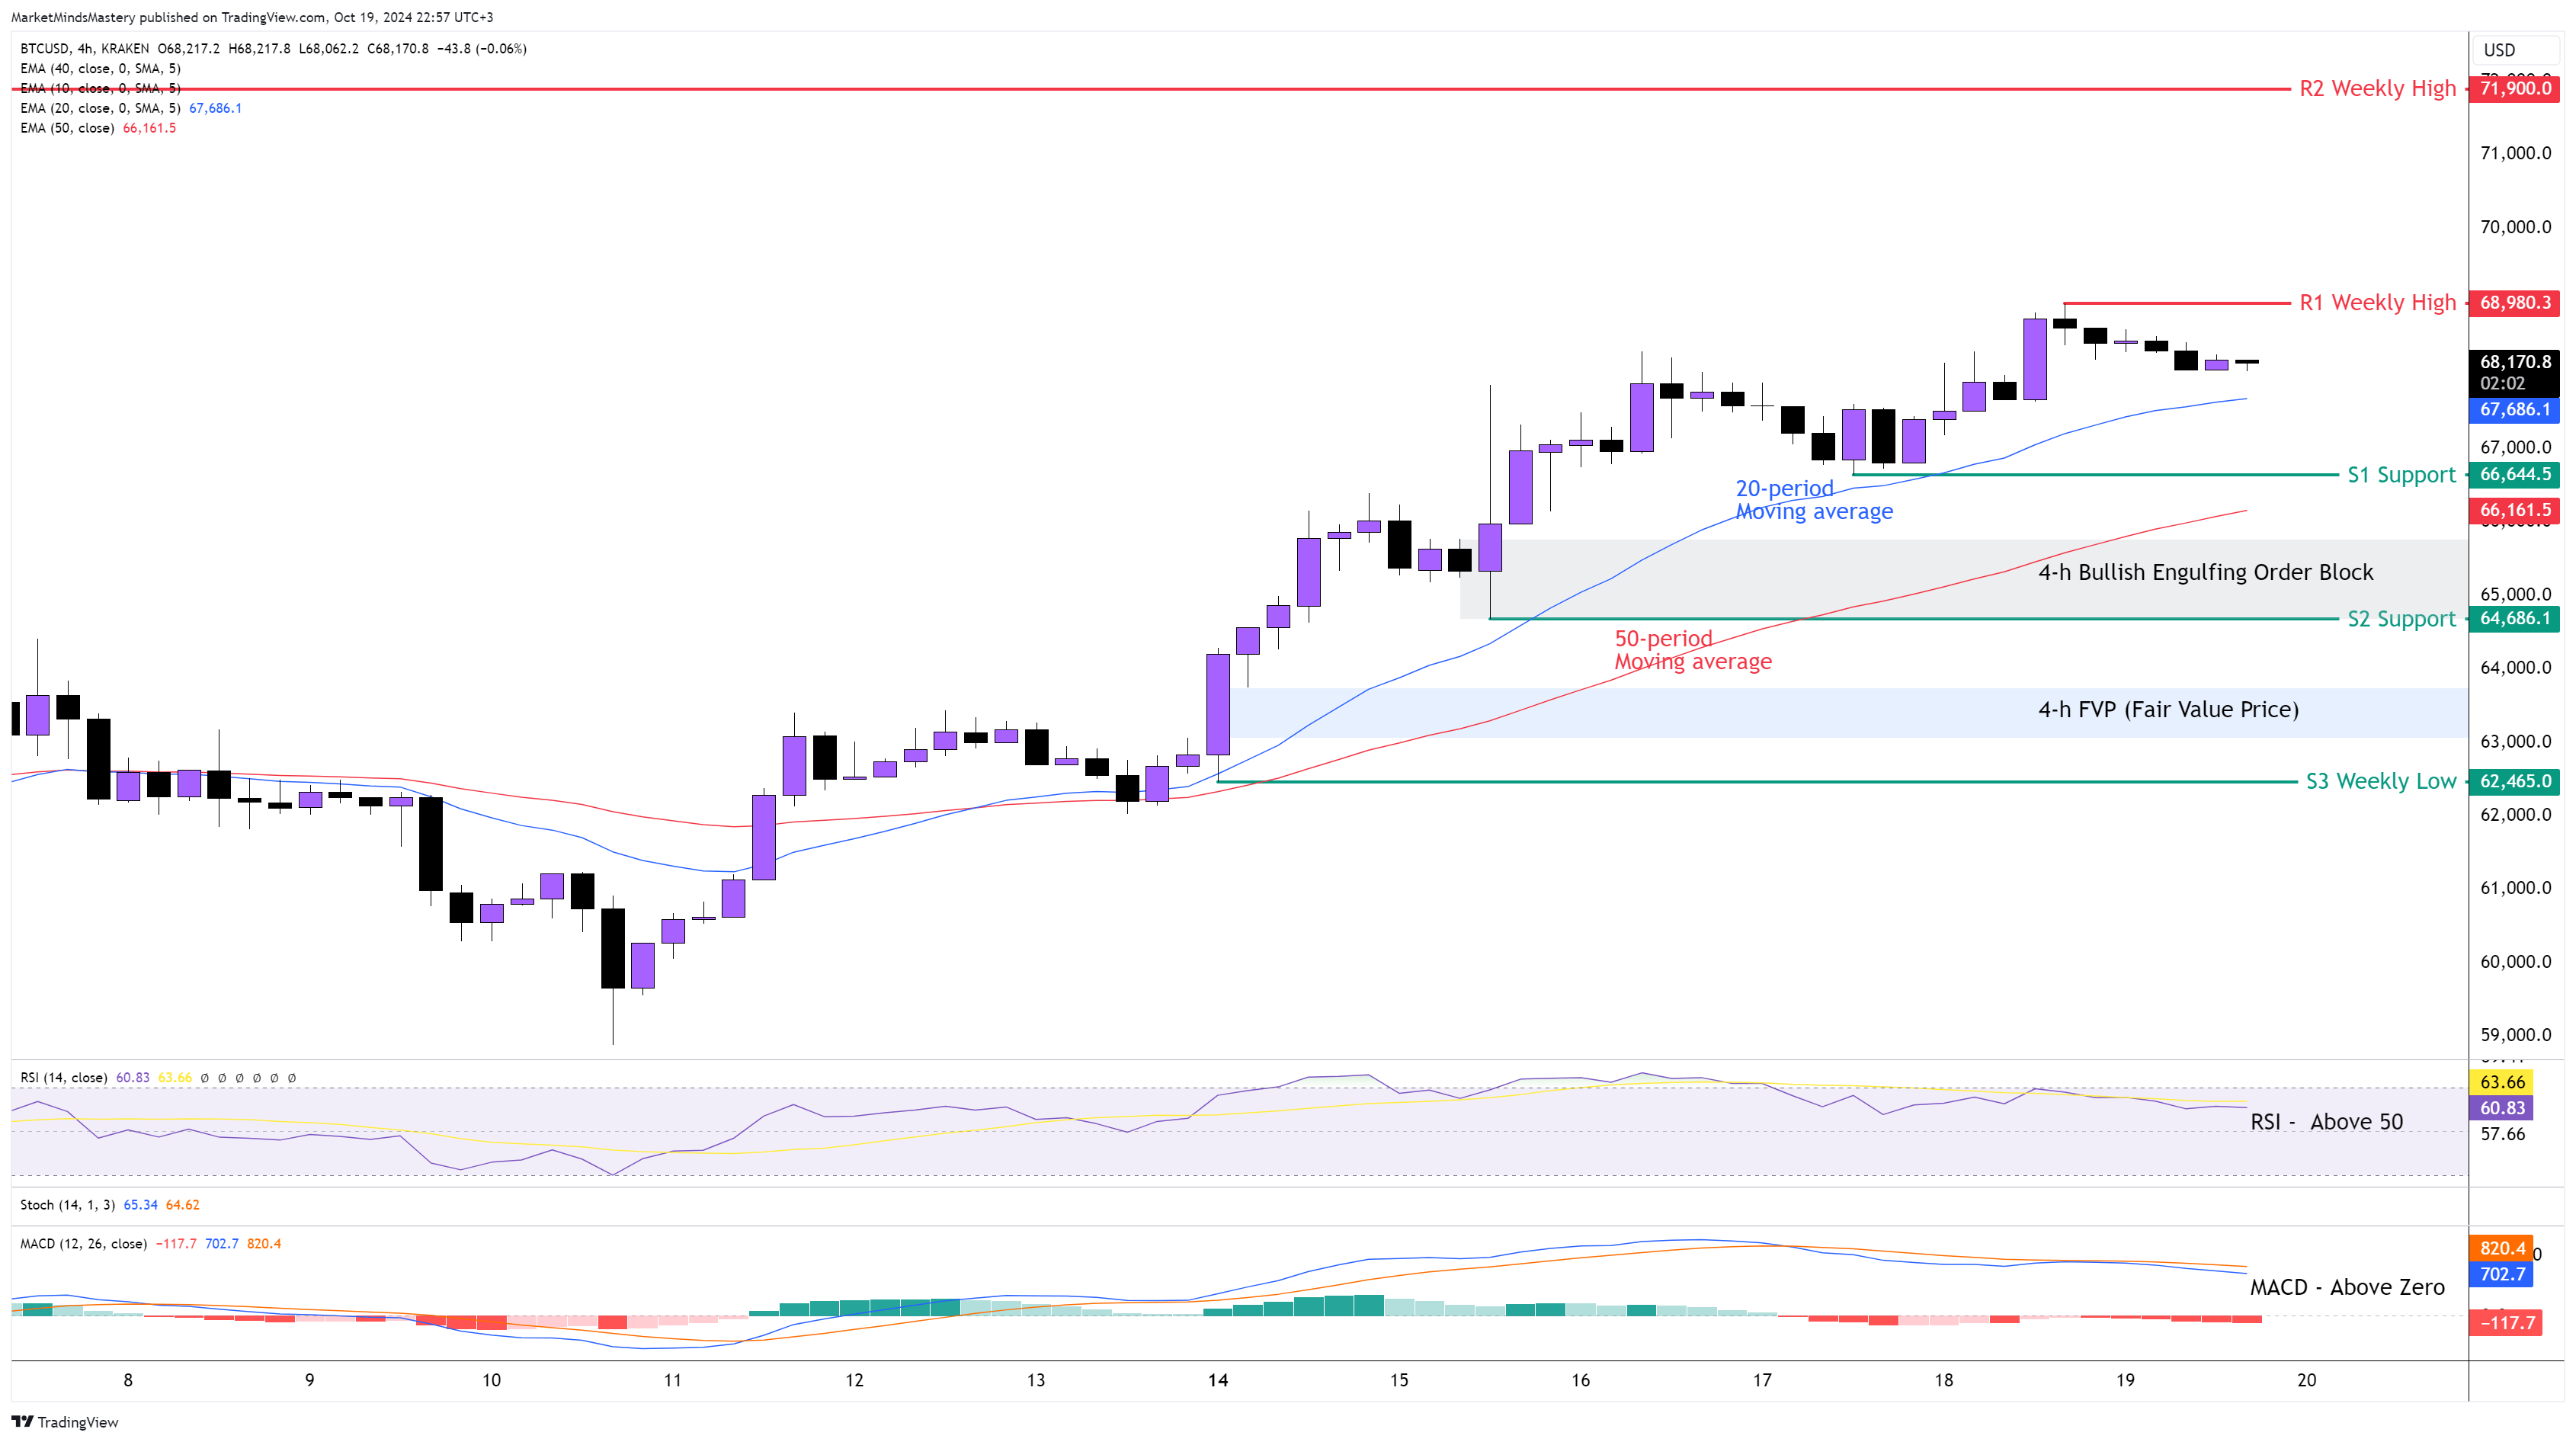
The price of the BTCUSD rose last week, and the weekly price action ended as a Bullish Marubozu candlestick. This means that this market is driven primarily by buy orders. The price showed significant bullish momentum last Monday. On the 4-hour chart, the price successfully tested the FVP (Fair Value Price) we pointed out on the chart, and since then, it just kept moving upwards. The 20-period is above the 50-period moving average, and this is bullish. The RSI is above its middle line of 50, and this has bullish implications. The MACD is above zero, indicating bullishness. The price currently makes higher highs and higher lows. Hence, if the price keeps moving upwards, the first resistance area, R1, will be around $68980, which is the previous week’s high. In case the price penetrates the R1 and keeps moving upwards, the next resistance area, R2, will be around $71900, which is an older weekly level.
Oppositely, if the price is rejected and moves downward, the first support area, S1, will be around $66644. This level coexists with the 20-period moving average. If the price penetrates the S1 and keeps moving downwards, the next support area, S2, will be around $64684. This is considered a key level of support as it coexists with the 4-h Bullish Engulfing Order Block created last Tuesday and the 50-period moving average, which can both act as an additional supporting factor for the price. In case the price penetrates the S2 and keeps lowering, the next support area, S3, will be the previous week’s low, around $62465.
SP 500 4H
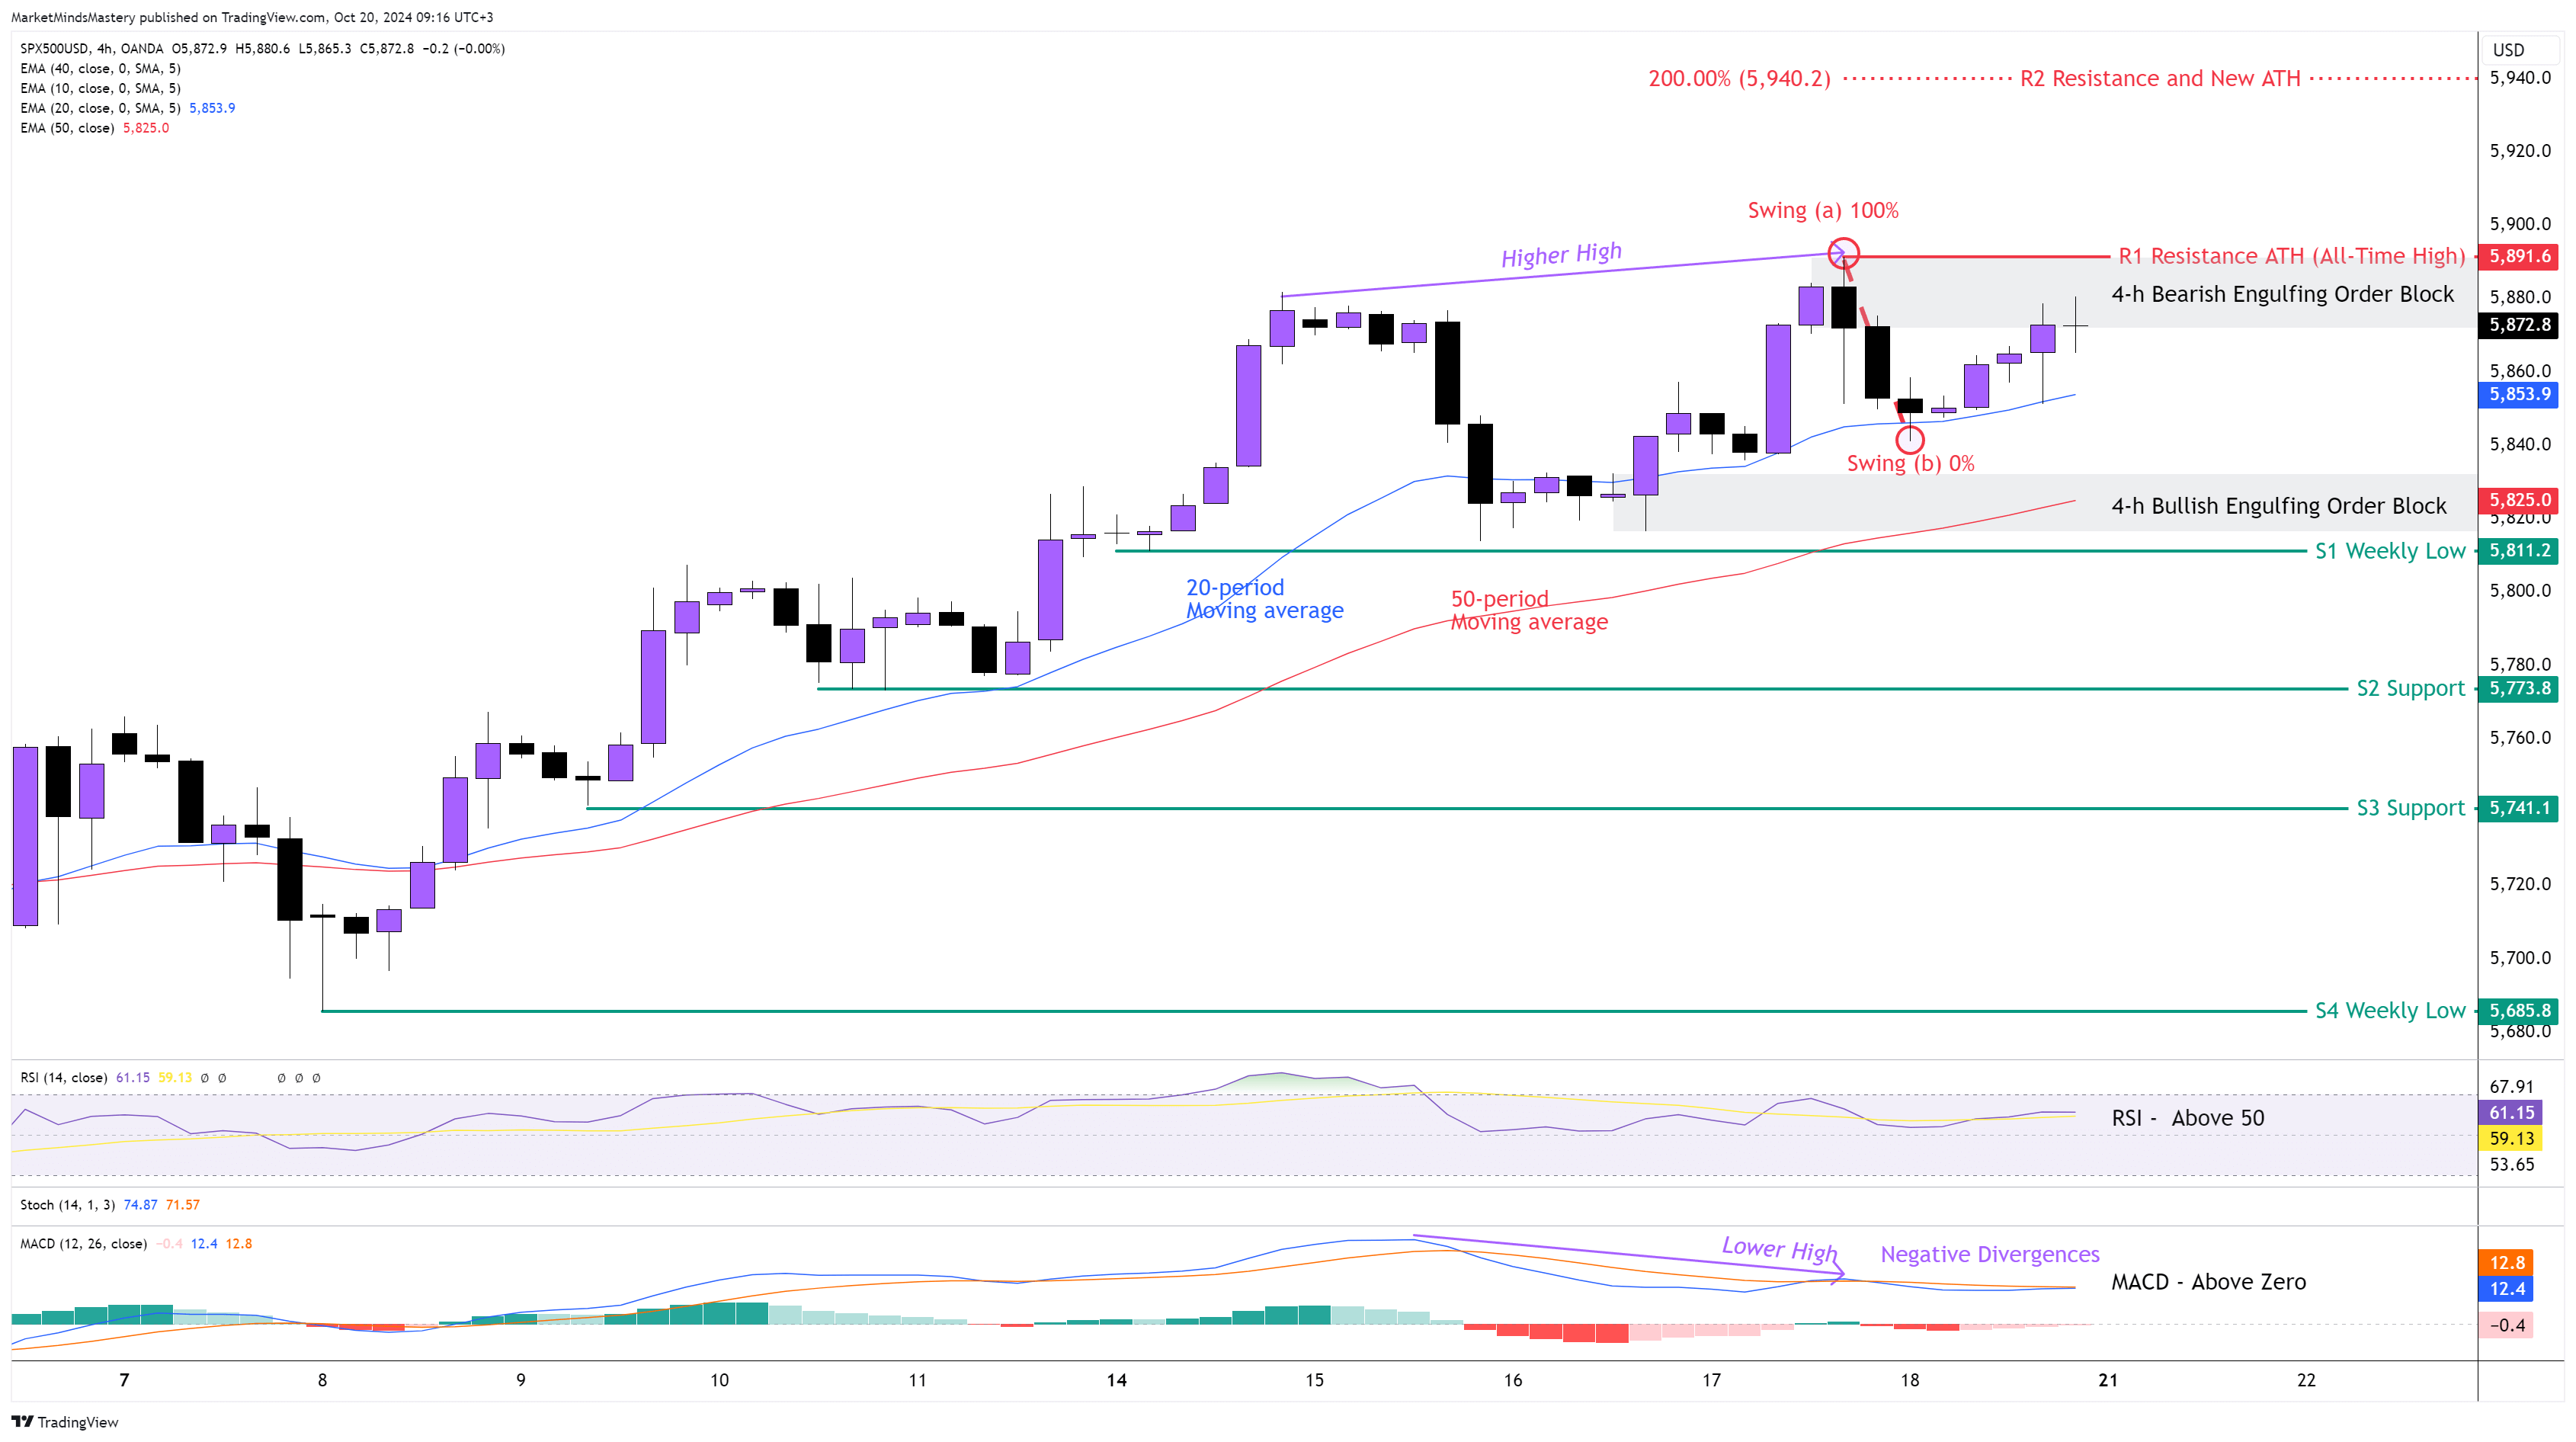
The price on the weekly chart of the SP500 created a Bullish Continuation candle, and the market created a new ATH(All-Time High) around $5891.The 4-hour chart kept moving upwards in a series of higher highs and higher lows. The 20-period moving average is above the 50-period moving average, which is bullish. The RSI Oscillator is above its middle line of 50, and this has bullish implications. The MACD is above this zero line. The MACD’s Histogram is below zero, which means that the price is currently in a retracement phase. During the last impulsive upward move, last Thursday, when the price registered its new ATH around $5891, the MACD didn't follow through, and it showed Negative (Bearish) Divergences A’ Class. Starting Monday, if the price moves upwards, the first resistance area, R1, will be the ATH at $5891. Last Thursday, the price created a Bearish Engulfing Order Block in that area, and it can act as an additional resistance. If the price penetrates the R1 and keeps moving upwards, the next resistance area, R2, will be around $5940, which is the 200% Fibonacci, meaning the swing from point (a) until point (b), as shown on the chart.
Oppositely, if the price is rejected and moves downwards, the first support area, S1, will be around $5811, which is the previous week’s low. We consider this to be the key level of support on this chart, as the level consists of a 4-h Bullish Engulfing Order Block created last Wednesday and a 50-period moving average. In case the price penetrates the S1, it will change the market’s structure and the current uptrend will end. If the price keeps moving downwards, the next support area, S2, will be around $5773. A further move to the downside finds the S3 support being around $5741.
US 30, 4H
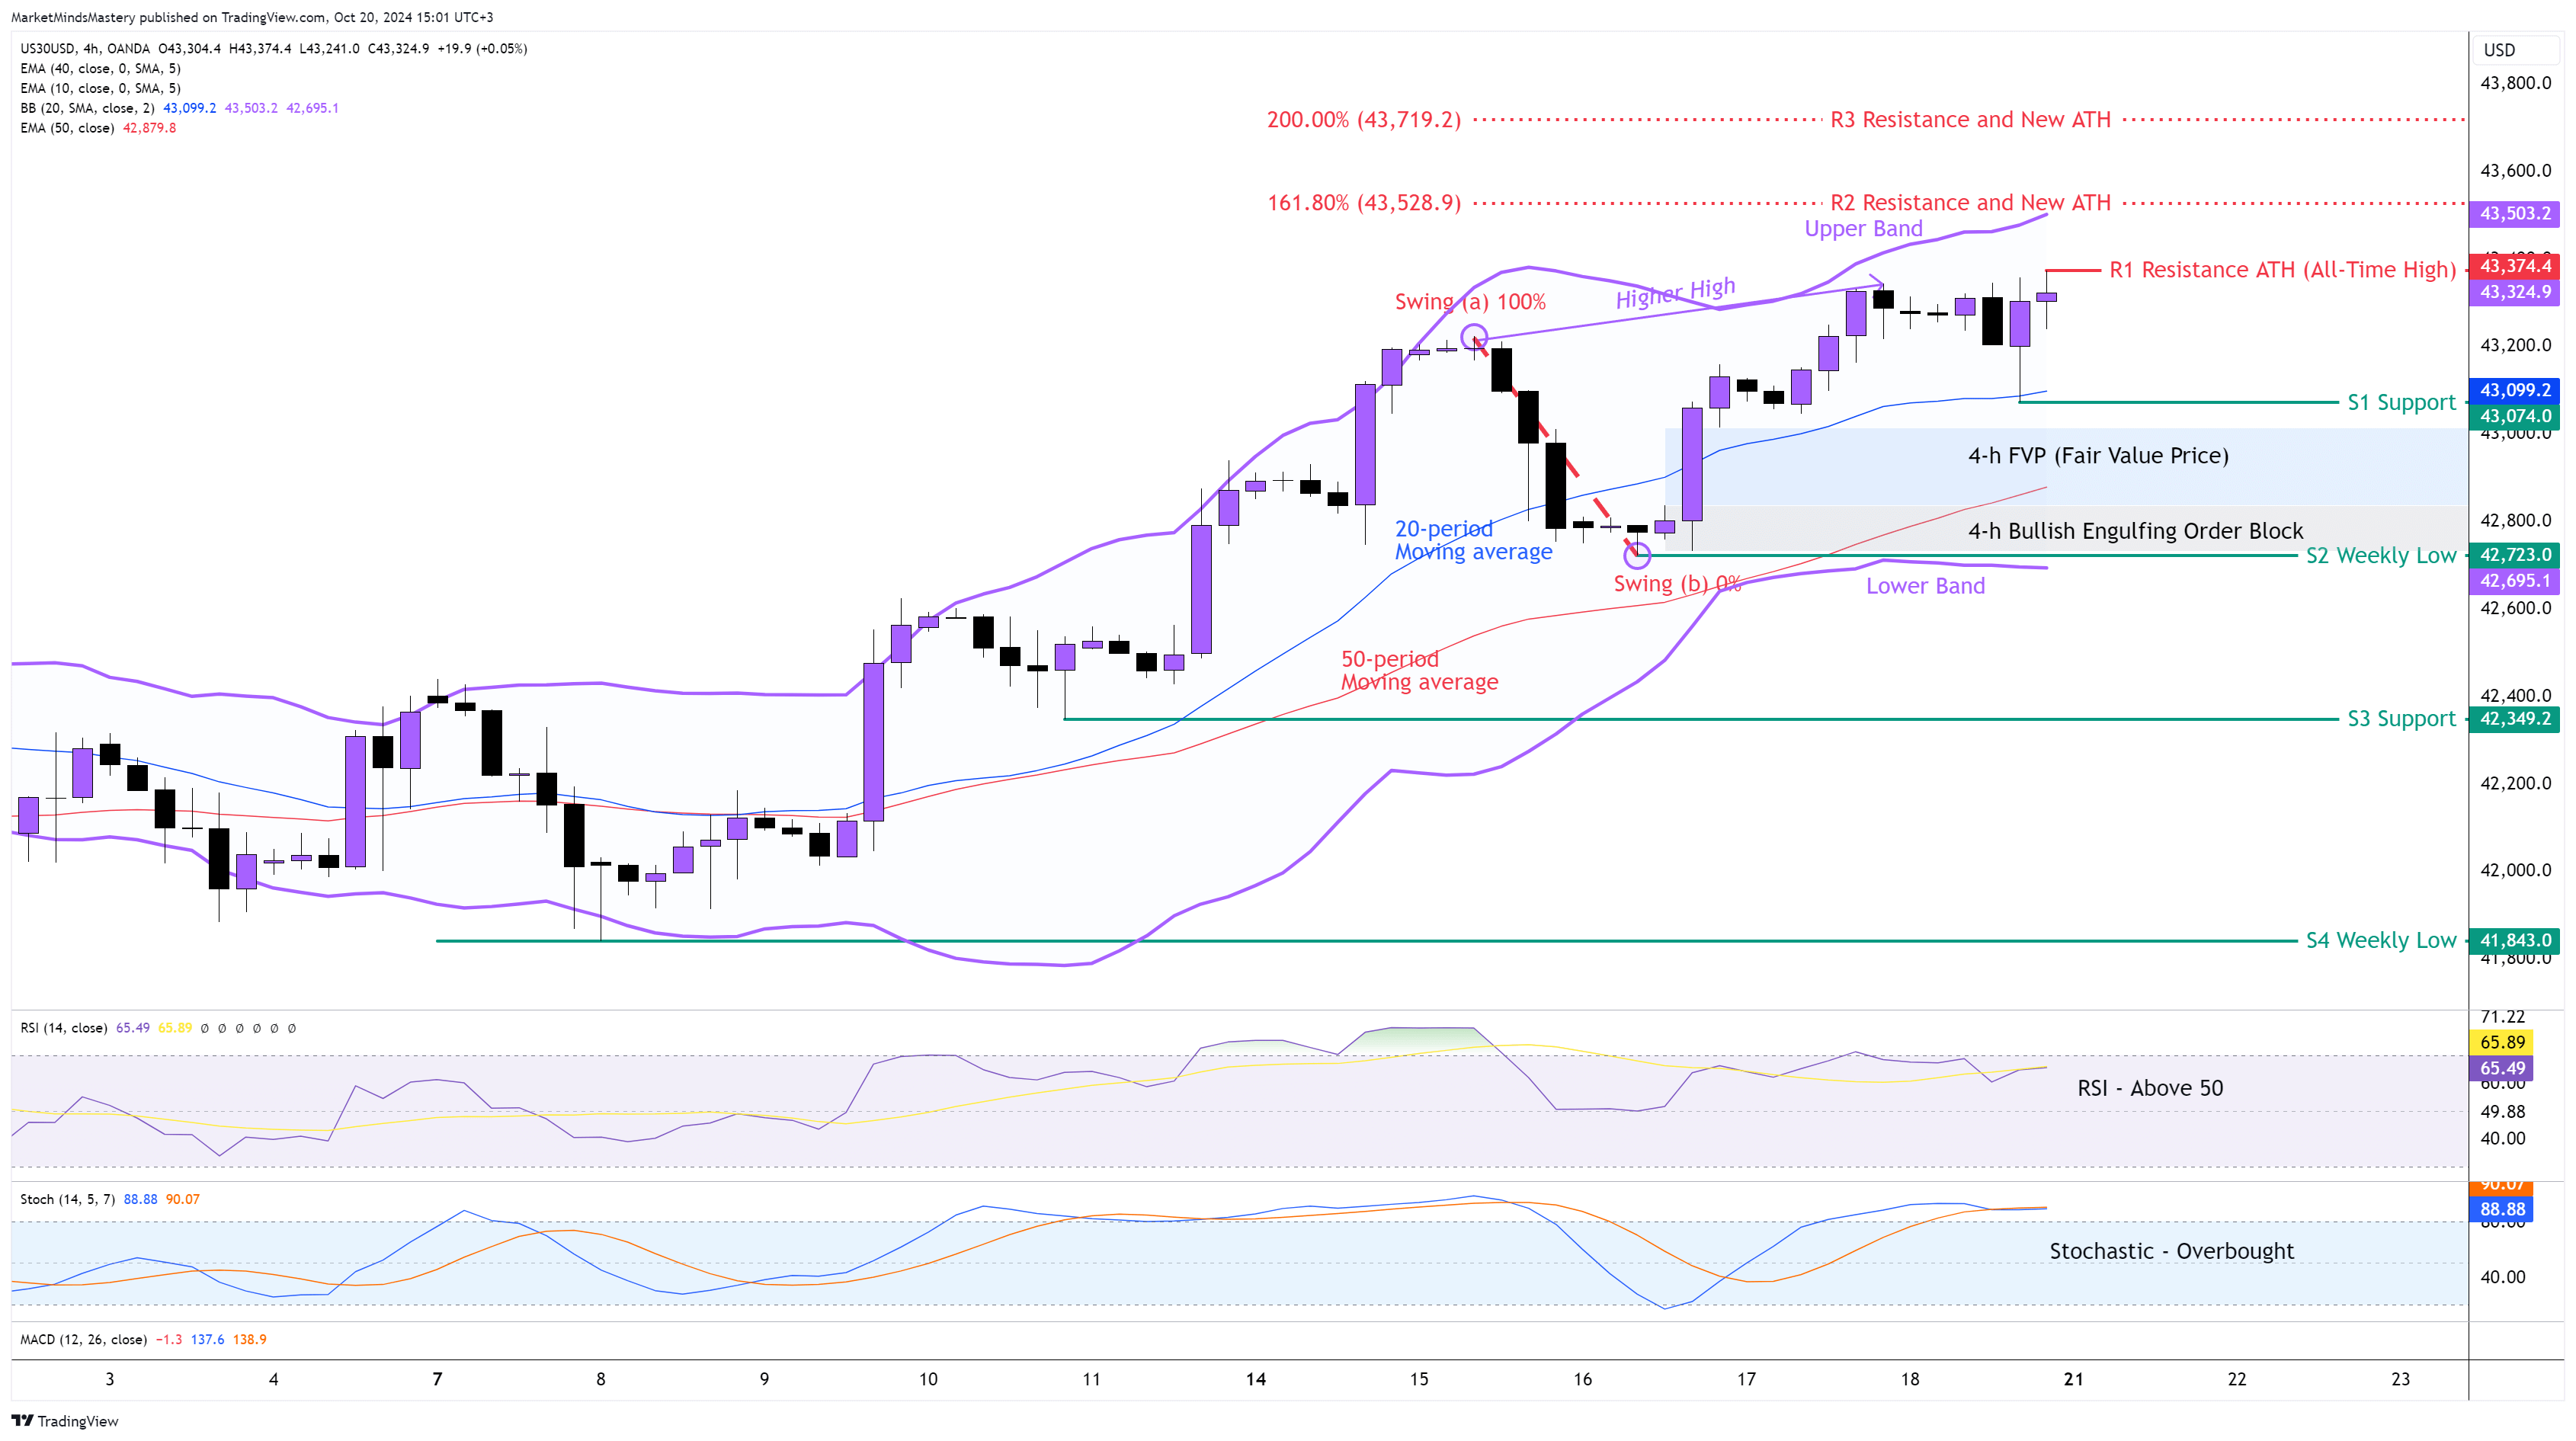
Following the previous week’s Market Outlook, the US30 price moved upwards, as we explained, due to the weekly Bullish Engulfing Price Action. The 4-hour chart maintained its higher high and higher low formation, forcing the US Indicie to register a New ATH (All-Time high). Using the Bollinger Bands indicator, the price is above the centre line, which is the 20-period moving average. The Lower Band expanded downwards, meaning that the market is in a bullish momentum. The RSI is above its middle line of 50, and this has bullish implications. The Stochastic is above its upper boundary of 80, and the Oscillator is in an Overbought condition.
Additionally, the %K Line (Blue) crossed above the %D Line (Orange). Last Friday, the price closed near its ATH price. Hence, if the price continues moving upwards, the first resistance area, R1, will be the ATH at $43374. If the price surpasses the R1 and keeps moving upwards, the next resistance area, R2, will be $43528, which is the 161.8% Fibonacci, and it can become the new ATH. If the price penetrates the R2 and keeps increasing, the next potential ATH will be at $43719, which is the 200% Fibonacci Extension measuring the swing from point (a) until point (b), as we showed on the chart.
On the other hand, if the price is rejected and moves downward, the first support area, S1, will be $43074. If the price penetrates the S1 and keeps moving lower, the next support area, S2, will be the previous week’s low, around $42723. This is a key level of support as it consists of the Lower Band, the 50-period moving average, and the 4-h Bullish Engulfing Order Block created last Wednesday during the New York trading session. If the price penetrates the S2 and keeps moving downwards, the next support area, S3, will be approximately $42349.
GER 30 (DAX Futures), 4H
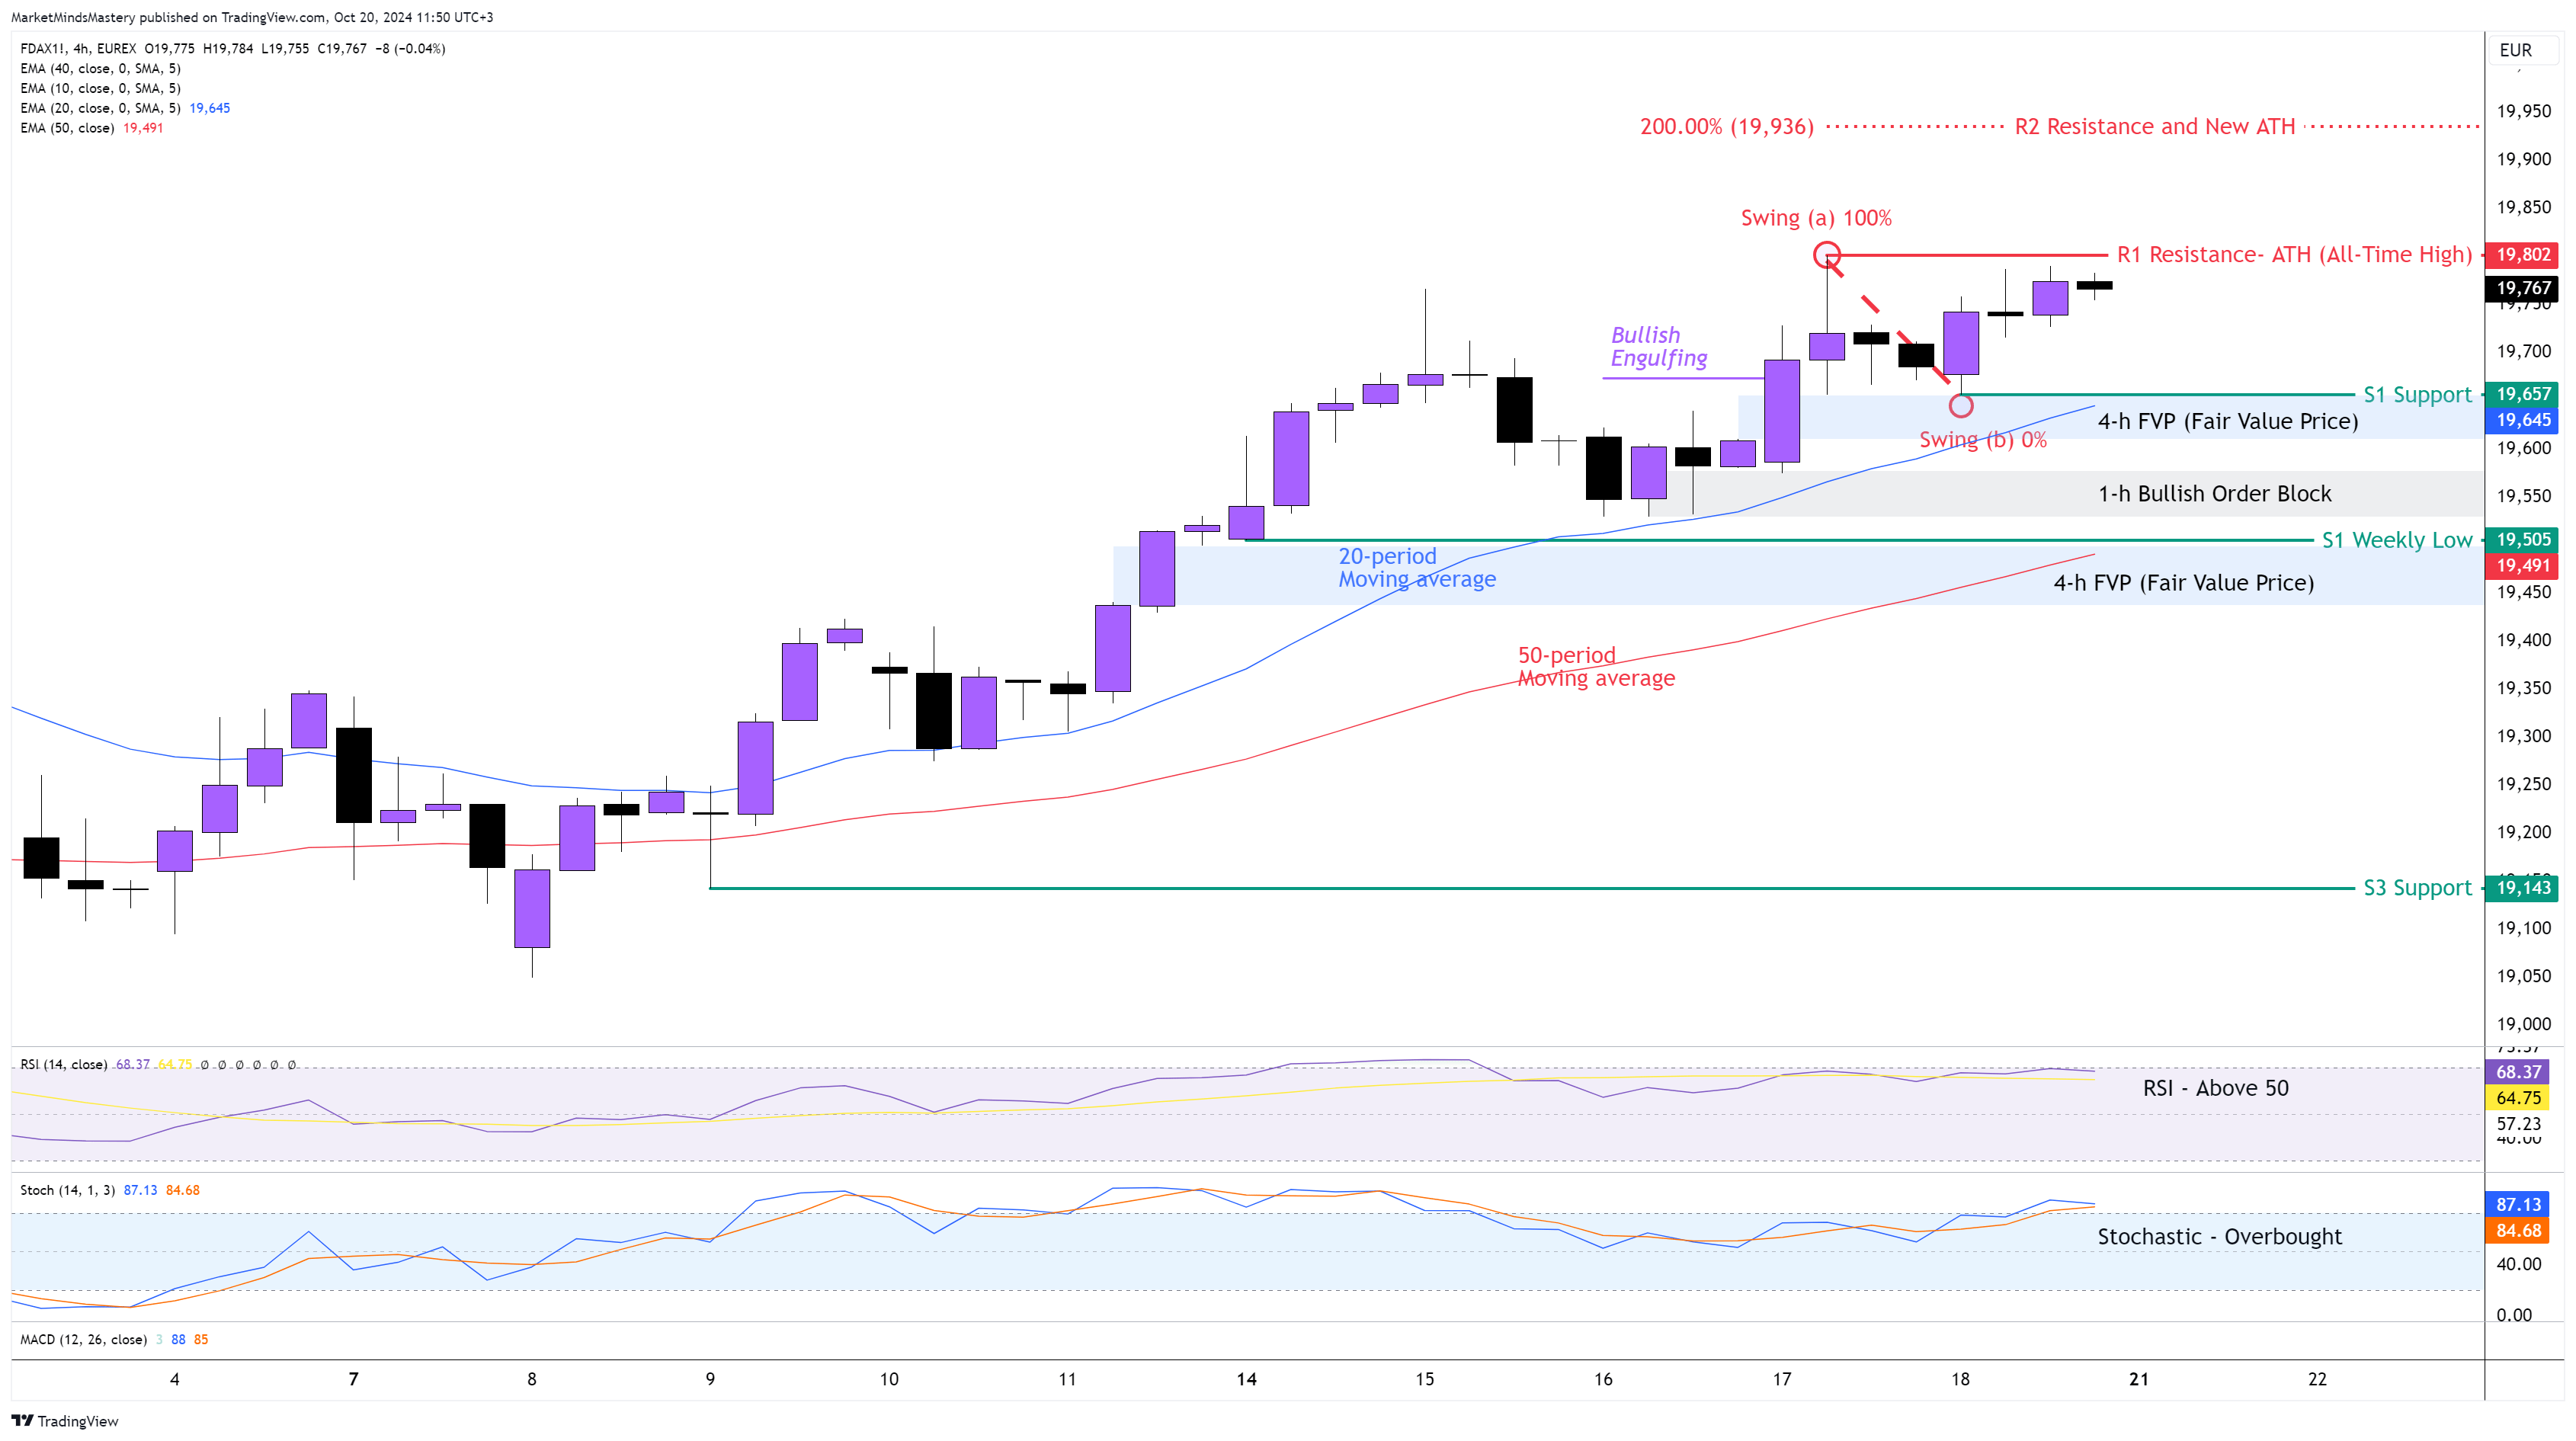
The Bullish Marubozu candlestick created on the weekly chart last week revealed the strength of the European Indicie. After a few weeks of consolidation, the price created a bullish breakout, and last week, the price registered a new ATH at 19802. On the 4-hour chart, the price moved upwards with a series of higher highs and higher lows. The 20-period is above the 50-period moving average, and this has bullish implications. The RSI is above its middle line of 50, and this is bullish. The Stochastic Oscillator is in its Overbought condition, and this is also bullish. Last Thursday, the price created an FVP (Fair Value Price) around 19600 and last Wednesday, a Bullish Order Block around 19550. Starting Monday, if the price continues moving upwards, the first resistance area, R1, will be the ATH at 19802. If the price penetrates the R1 and keeps moving upwards, the next resistance area, R2, will be the 19936, which is the 200% Fibonacci Extension measuring the swing from point (a) until the swing at point (b), as shown on the chart.
Conversely, if the price is rejected and moves downwards, the first support area, S1, will be at 19657. If the price penetrates the S1 and keeps moving downwards, the next support area, S2, will be at 19505, which is the previous week’s low. This is considered a key level of support as, at the same price area, there is a Bullish Order Block, an FVP (Fair Value Price) that was created last week, and the 50-period moving average.