Last week, the markets expected a fundamentally weak US Dollar as per the Consensus on the CPI. However, the actual report showed a solidly improved number than forecasted. The market participants appreciate the US Dollar. The RBNZ (Reserve Bank of New Zealand) cut its interest rates from 5.25% to 4.75%. Additionally, the Retail Sales in the Eurozone and Germany were reported to be less than forecasted in previous reports, which made the EURUSD and the NZDUSD among the most promising currency pairs traded last week.
This week, the market is expected to experience an increased amount of volatility on most trading days, and tradable opportunities are expected. In many cases, the fundamental part and the technical analysis, as we will see on the charts below, can offer high-probability setups.
On Monday, volatility during the Asian and London trading sessions is expected to be as usual, as there will be no significant events that can affect the current market trends. The liquidity during the Asian trading session is expected to be low because the Japanese Banks will be closed in observance of Health-Sports Day. Usually, Mondays are short days in the News. During the New York trading session, the banks in Canada will be closed due to Thanksgiving, and the banks in the US will be closed in observance of Colombus Day. Hence, the liquidity and volatility are expected to be minimal, and day traders need to be aware that when liquidity dries up, the spreads usually get widened.
On Tuesday, during the Asian trading session, there won't be any significant news events. Moving into the London trading session, they will announce the Claimant Count Change in the UK. The consensus estimates that approximately 3400 fewer people will claim jobless benefits from the government. The previous report shows that 23700 people claimed jobless benefits, and this time, they expected only 20300. Additionally, they will announce the Unemployment Rate in the UK. The forecast shows an unchanged rate of 4.1%. The Sterling will become very volatile during the announcements. Any weak report could continue the downtrend on the GBPUSD currency pair. The next event will be the Euro Zone ZEW Economic Sentiment Index. The forecast shows an increase from 9.3 to 16.9.
Additionally, Germany will report the German ZEW Economic Sentiment Index. As per the consensus, it is also expected to increase from 3.6 to 10.2. These events will directly affect the Euro, but their impact is not significant in developing a trend reversal in the markets.
The market’s participants' attention will be on the next significant event, the CPI (Consumer Price Index) in Canada. The forecast estimates an increase in the CPI this time, as the last five months' reports were mostly negative. This time, the CPI is expected to increase from 2.0% to 2.1%. If the actual confirms the forecast and simultaneously if the markets follow through, the USDCAD can weaken. As the currency pair approaches a key level of resistance of around 1.39000, this event can add some downward momentum to the price charts. The last event for the day will be the Empire State Manufacturing Index in the US. The consensus estimates a decrease from 11.5 to 3.4.
We are approaching the middle of the trading week. On Wednesday, New Zealand will announce its quarterly CPI (Consumer Price Index). The forecast estimates an increase from 0.3% to 0.7%. The Kiwi is expected to experience high volatility around the actual report. If the actual forecast is confirmed, it can help the Zew Zeland Dollar gain some strength across the currency board. Moving into the European and London trading session, in the UK, they will report their CPI (Consumer Price Index). The forecast this time estimates a significant decrease in the number, and from 2.2%, it is expected to drop to 1.9%. If the actual report confirms the forecast and, at the same time, the market follows through, we expect a weak Sterling. During the New York trading session, there won't be any significant news events. Therefore, the volatility is expected to be noticeable only around the Equities Market open. The day will end with the speech of the European Central Bank’s President Legarde.
On Thursday, the markets will be very active starting early in the morning from the Asian and Sydney trading sessions. In Japan, they will report the Trade Balance and the consensus estimates an increase from -0.60 T to -0.49 T. This can positively impact the Japanese Yen. Usually, this is different from the type of event that usually changes the market trends in the Japanese Yen currency pairs. The next significant event will be the change in the Unemployment Rate in Australia. It will be the only major event that directly affects the Australian Dollar this week. The consensus estimates an unchanged 4.2% of Australian Unemployment. At the same time, still in Australia, they will report the Employment Change. The forecast estimates a drop from 47.5K to 25.2 K. As both the Employment Change and the Unemployment Rate are highly correlated, the combination of both can dictate the weakness or strength of the Aussie afterwards. As the Aussie gained some strength last week, a positive outcome today can help it to advance more against other currency pairs like AUDCAD, EURAUD and GBPAUD.
The most important event for the Euro today will be the Interest Rate decision. Last month, the ECB cut the rates in the Eurozone, and this month, they are about to continue. The forecast estimates a rate cut from 3.65% to 3.4%. If this happens and at the same time if the market follows through, we will witness a weak Euro across the currency board. Less than an hour later, the ECB Press Conference will take place. The next significant event for the day will be the Retail Sales in the US. The forecast estimates an increase in the number this time. From 0.1% to rise to 0.3%. If the US dollar gains strength after this event and, at the same time, the Euro becomes a weak currency, the EURUSD may become the main currency pair that traders will try to find selling trading opportunities for. The day will finish with the Monetary Policy Report Hearing in the UK.
On Friday, the markets will become active in the early morning as Japan will report its CPI (Consumer Price Index) during the Asian trading session. The forecast estimates a significant decrease from 2.85 to 2.3%. This can weaken the Japanese yen and offer an advantage to Sterling and the US dollar against the Yen. The next significant event will be the Retail Sales in the UK, and as per the consensus, the Sterling is expected to experience weakness as the current number of 1.0% is expected to drop to 0.3%. The trading day and the trading week will end with the Building Permits in the US. The consensus estimates a drop from 1.48M to 1.45M, which means that fewer New Residential Building permits were issued in the US a month ago.
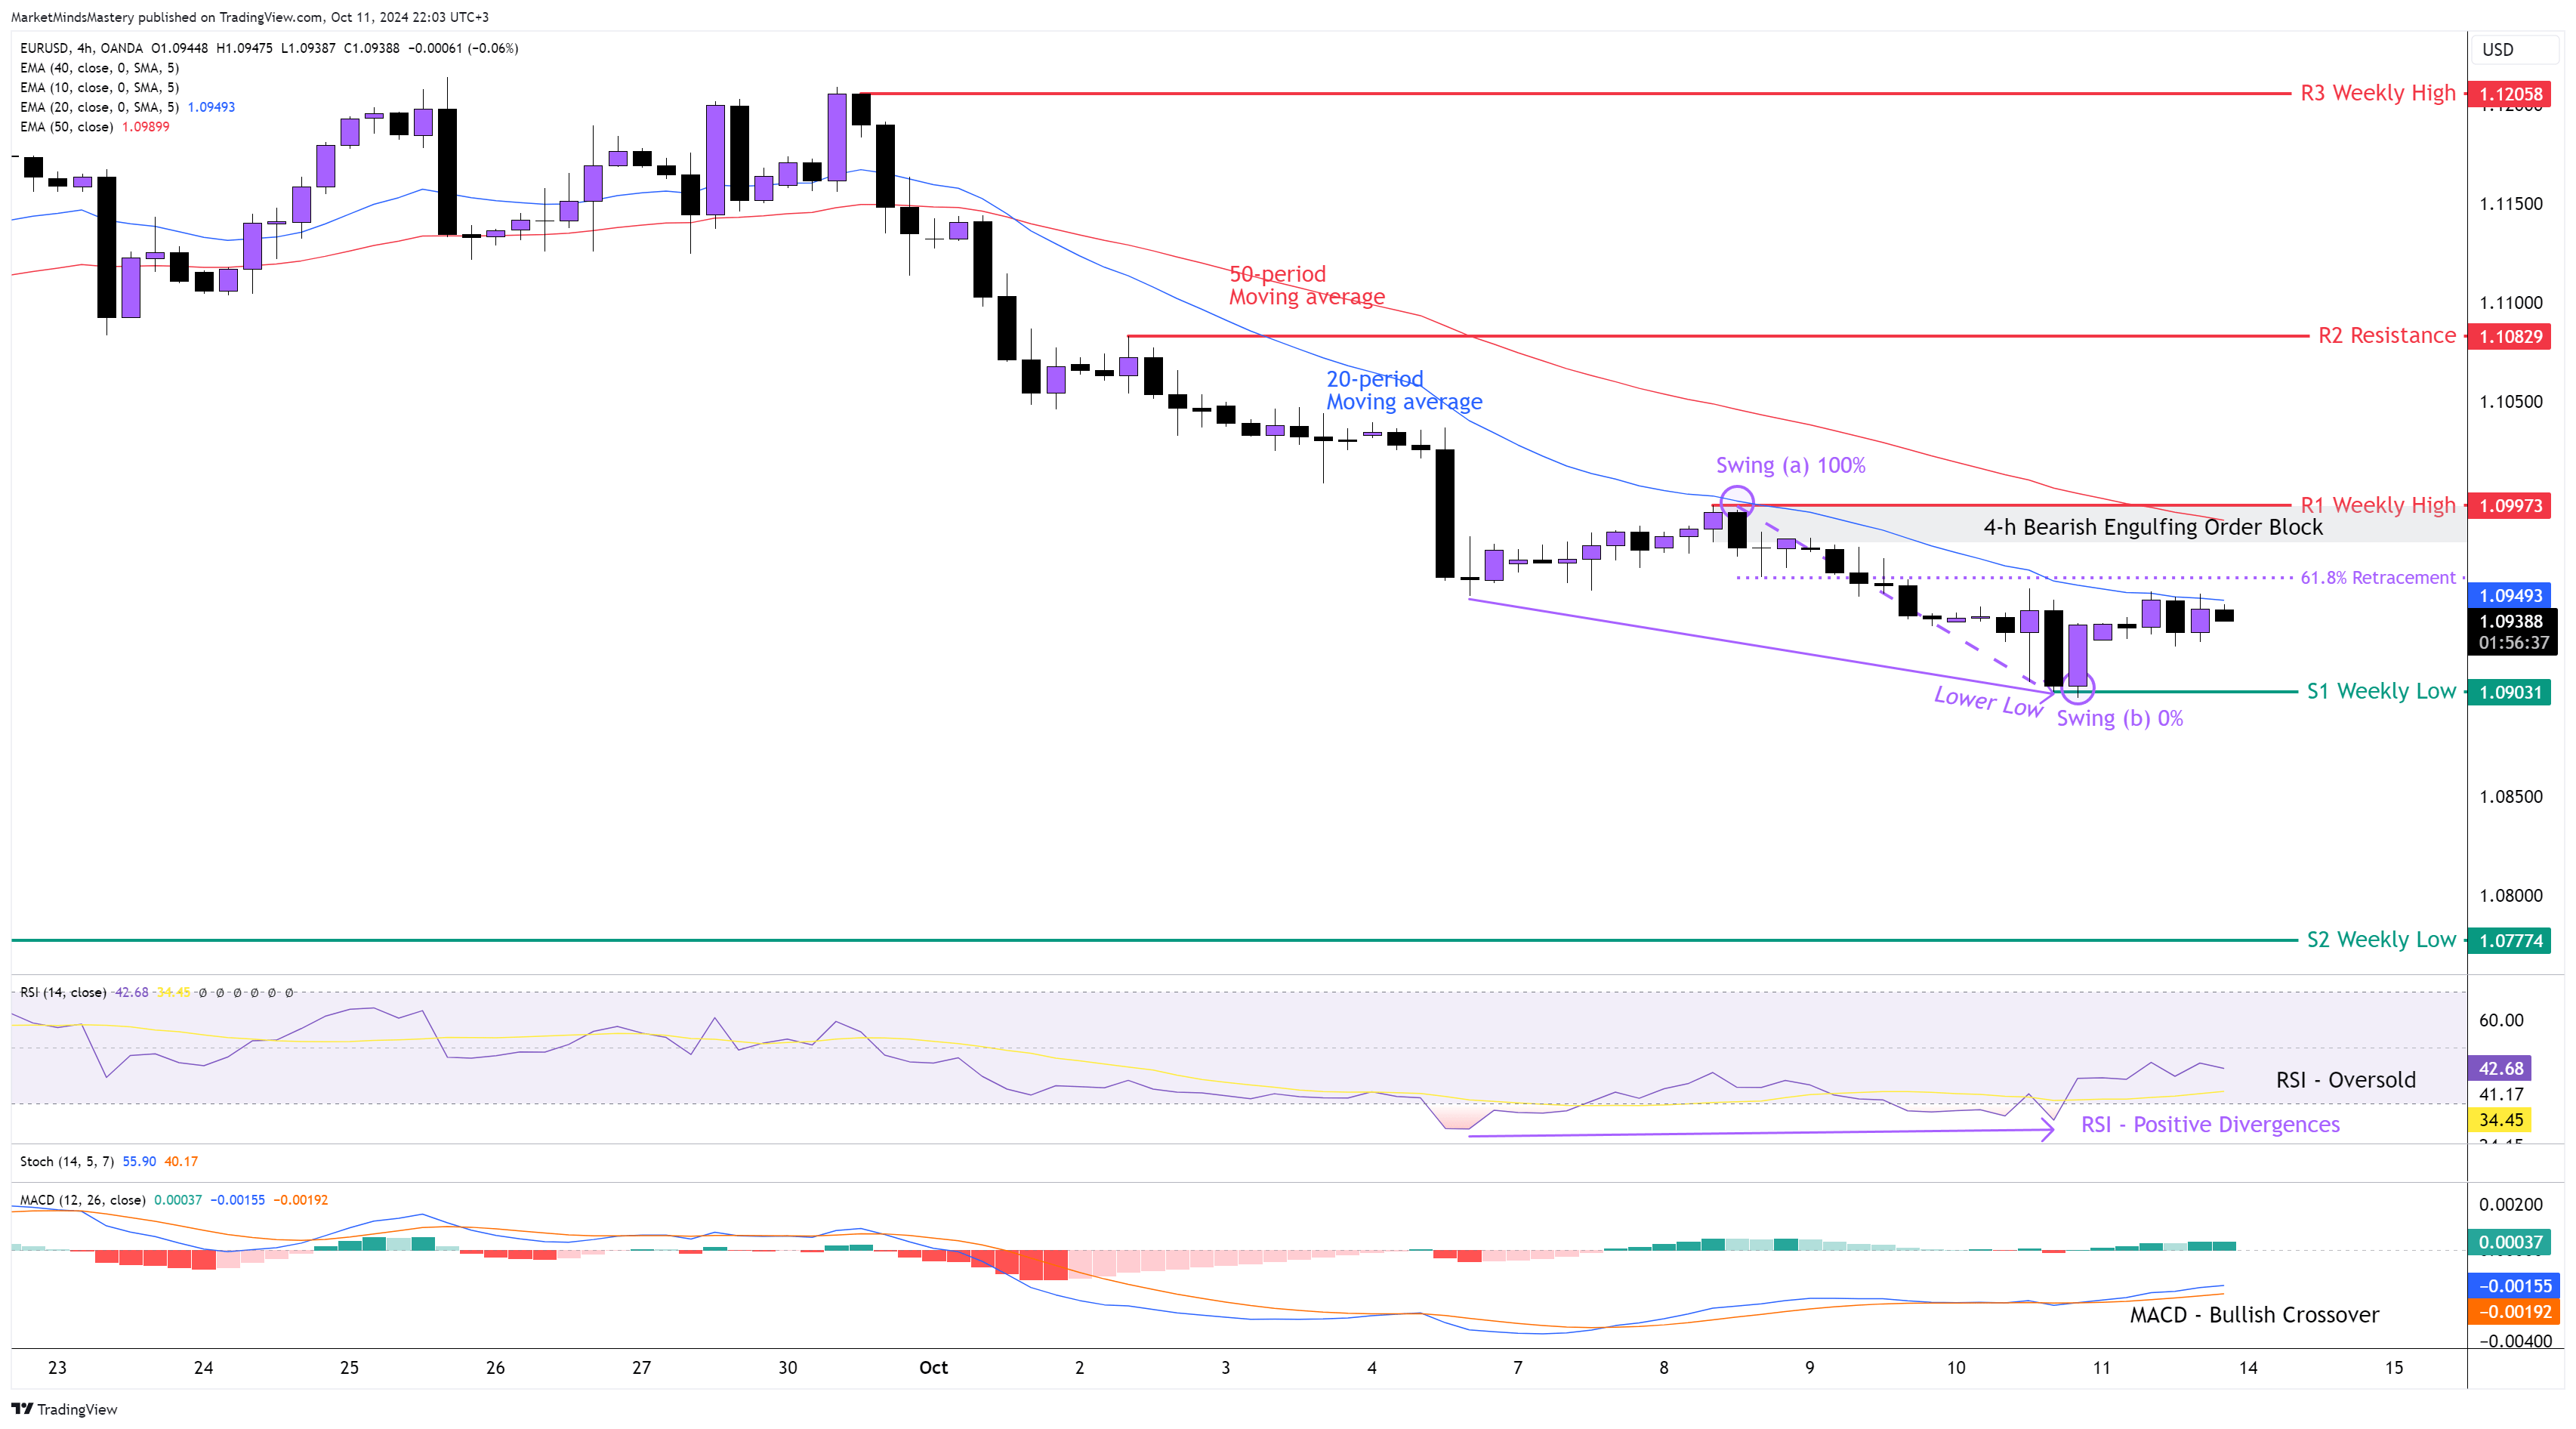
EUR USD 4H

Following the previous week’s Market Outlook, the price of the EURSUD kept making lower highs and lower lows on the weekly chart. The price action has the shape of a spinning candlestick formation. The positive CPI in the US and the negative Retail Sales in the Eurozone kept the price continuing its downtrend. As the 20-period is below the 50-period, and the price keeps its lower high and lower low deformation, the downtrend is valid. Last Thursday, the price made a low at point (b), but at the same time, the RSI created a higher low while the Oscillator was in its Oversold condition, below 30. The fact that the MACD created a Bullish Crossover while the MACD Line (Blue) and the Signal Line (Orange) are both below the zero line indicates that the price will start a retracement phase. In this case, if the price moves upwards, the first resistance area will be around the 61.8% Fibonacci level, which coexists with the 20-period moving average around 1.09600. If the price penetrates the 1.09600 and keeps moving upwards, the first key level of resistance, R1, will be the previous week’s high, around 1.09973. If the price surpasses R1 and moves upwards, the market structure will change, and the downtrend will end. In this case, the next resistance area, R2, will be around 1.10829.
On the other hand, if the price continues its downtrend, which means it will continue to decline, the first support area, S1, will be around 1.09031, the previous week’s low. If the price penetrates S1 and keeps moving lower, the next support area, S2, will be around 1.07774, an older weekly low level.
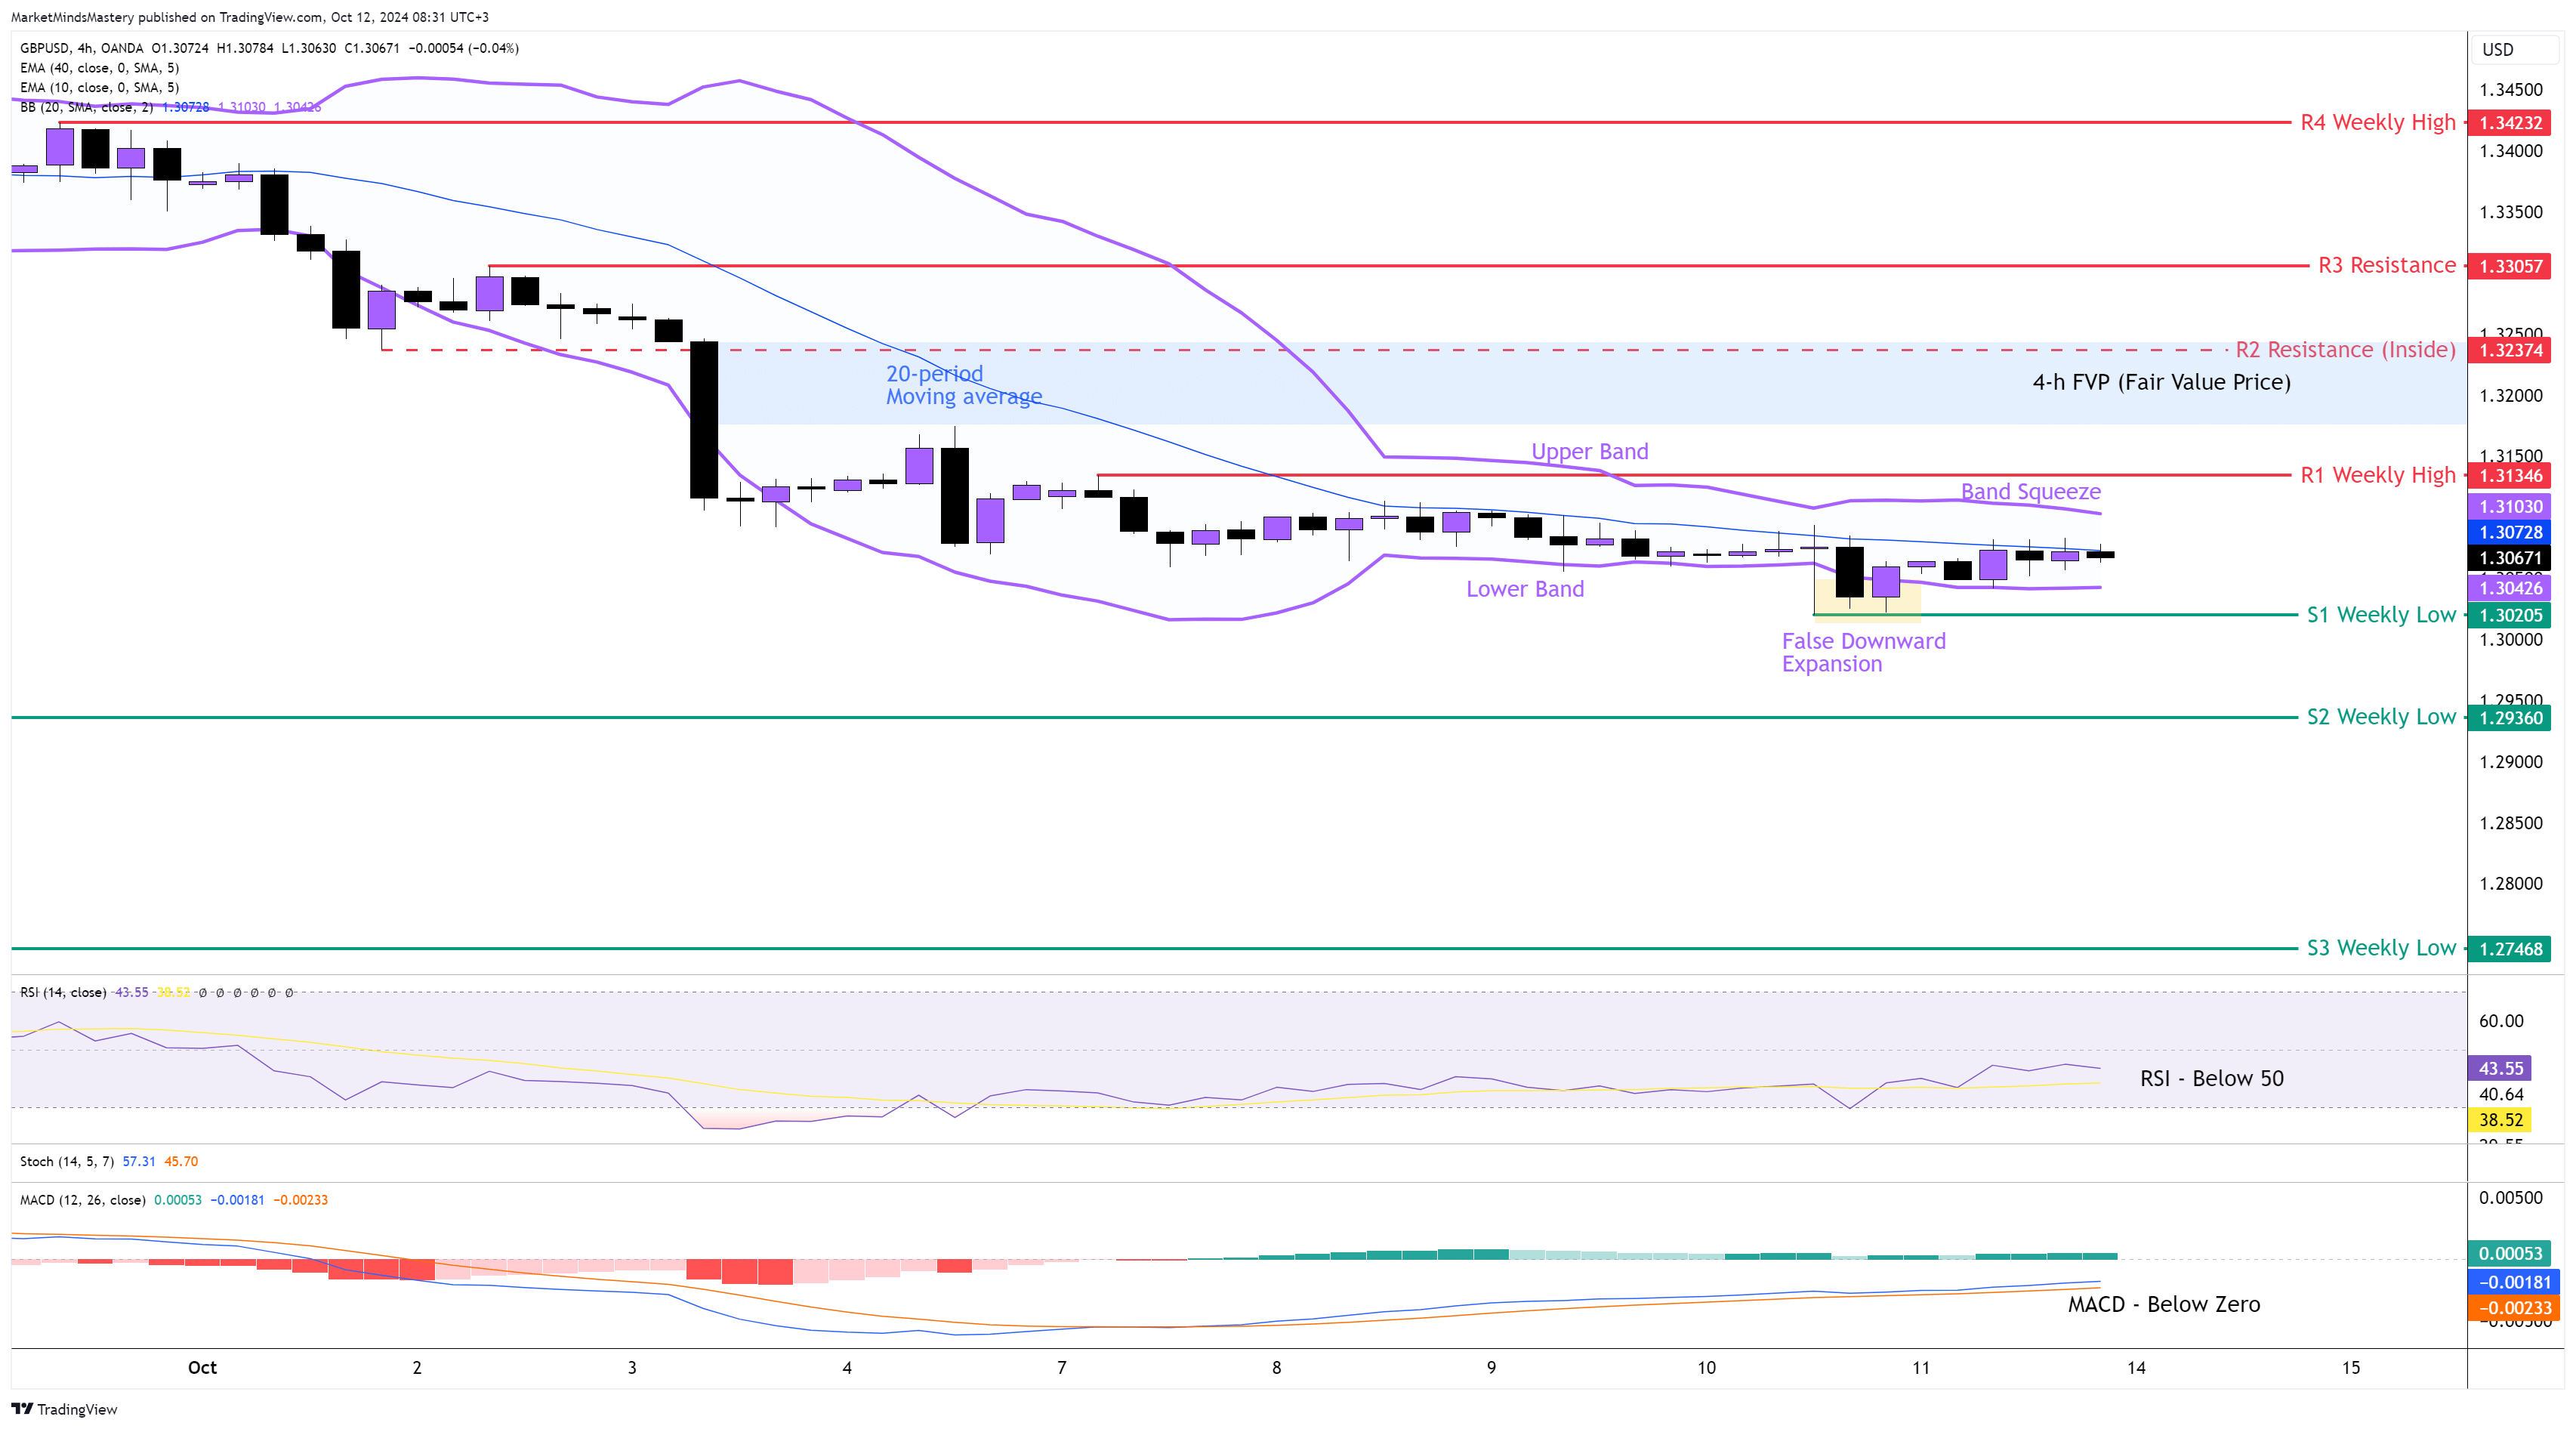
GBP USD 4H
Last Monday, the price of the GBPUSD was rejected at around 1.31300, which was the Bearish Engulfing Order Block area. It then moved downwards until it reached the S1 weekly support we pointed out in the chart in last week’s Market Outlook. Hence, the weekly candlestick’s body has a range of only 430 points(43 pips). This is an insignificant price move for this currency pair based on the ATR (Average True Range) indicator. On the 4-hour chart, the price remains within the boundaries of the Bollinger Band indicator. Last week, the Upper Band wasn’t touched as the price remained below the 20-period moving average, which is the middle of the Bollinger Band. The RSI is below its middle line of 50, indicating bearishness. The MACD is also below its zero line, which is bearish. Currently, the Bands are Squezze and a directional move to the upside, or the downside will be noticeable, and the volatility is expected to expand. Starting Monday, if the price keeps moving downwards, the first support area, S1, will be around 1.30205, which is the previous week’s low. If the price penetrates the S1 support and keeps lowering, the next support area, S2, will be around 1.29360.
On the other hand, if the price moves upwards, the first resistance area, R1, will be around 1.31346. If the price penetrates the R1 and keeps moving upwards, the next resistance area, R2, will be an Inside resistance of around 1.32374. In this area, an FVP (Fair Value Price) was created a few weeks ago, and it hasn’t been tested yet. Therefore, it can be used as an additional price resistance.
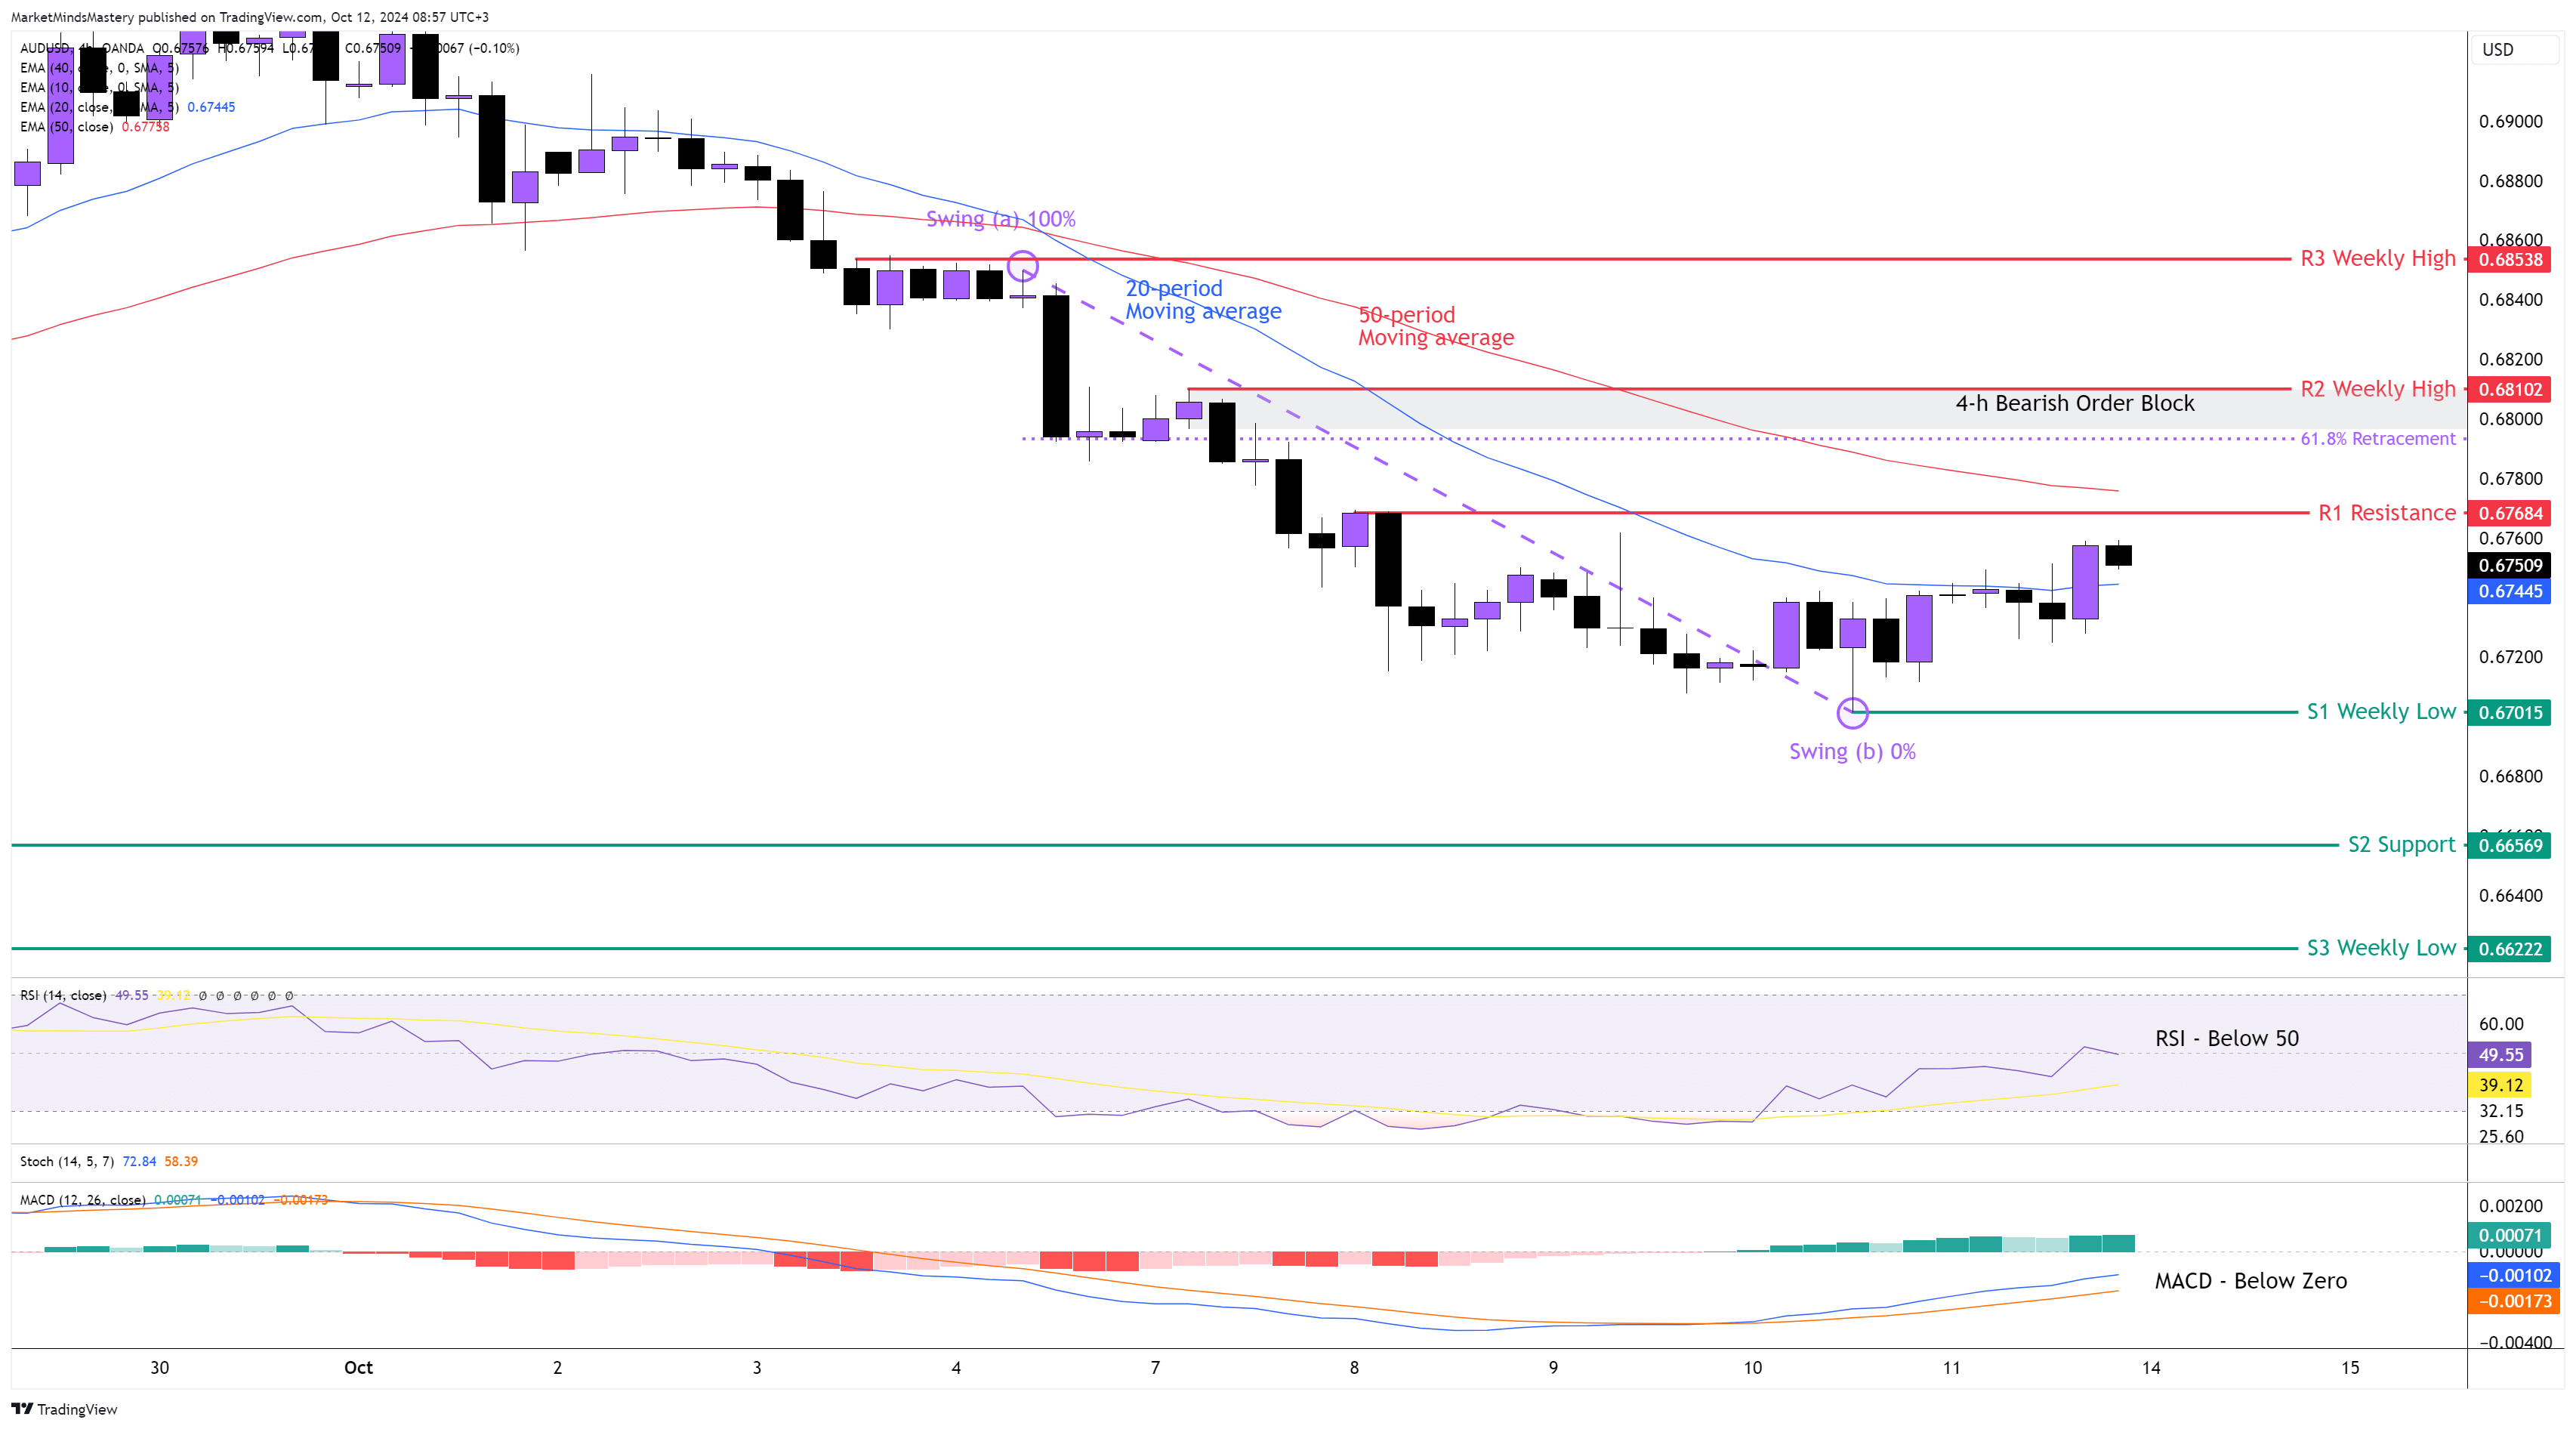
AUD USD 4H
The downtrend started at the beginning of October and continued last week as the US Dollar was gaining more strength across the currencies board. The weekly chart created a new lower high and lower low formation. On the 4-hour chart, the 20-period remains below the 50-period moving average, which is bearish. The RSI Oscillator is below the middle line of 50, which is also bearish. The MACD is below the zero line, indicating bearishness. The MACD’s Histogram is above its zero line, indicating that the price entered a retracement phase. Hence, if the price continues its retracement and keeps moving upwards, the first resistance area, R1, will be around 0.67684, which is approximately 200 points (20 pips) below the current price. If the price penetrates the R1 and keeps moving upwards, the next resistance area, R2, will be around 0.68102. This is a key level of resistance because it is the previous week’s high, it also created a Bearish Order Block last week and because the Fibonacci Golden Ratio of 61.8% measures the price move from the swing high at point (a) until the swing low at point (b) is around this price level.
Oppositely, if the price is rejected and moves downwards, the first support area, S1, will be around 0.67015, which is the previous week’s low. If the price surpasses the S1, the 4-hour chart’s downtrend will resume. Hence, if it continues moving downwards, the next support area, S2, will be approximately 0.66569. If the price penetrates the S2 and keeps lowering, the next support area, S3, will be at 0.66222, which is an older weekly low level.
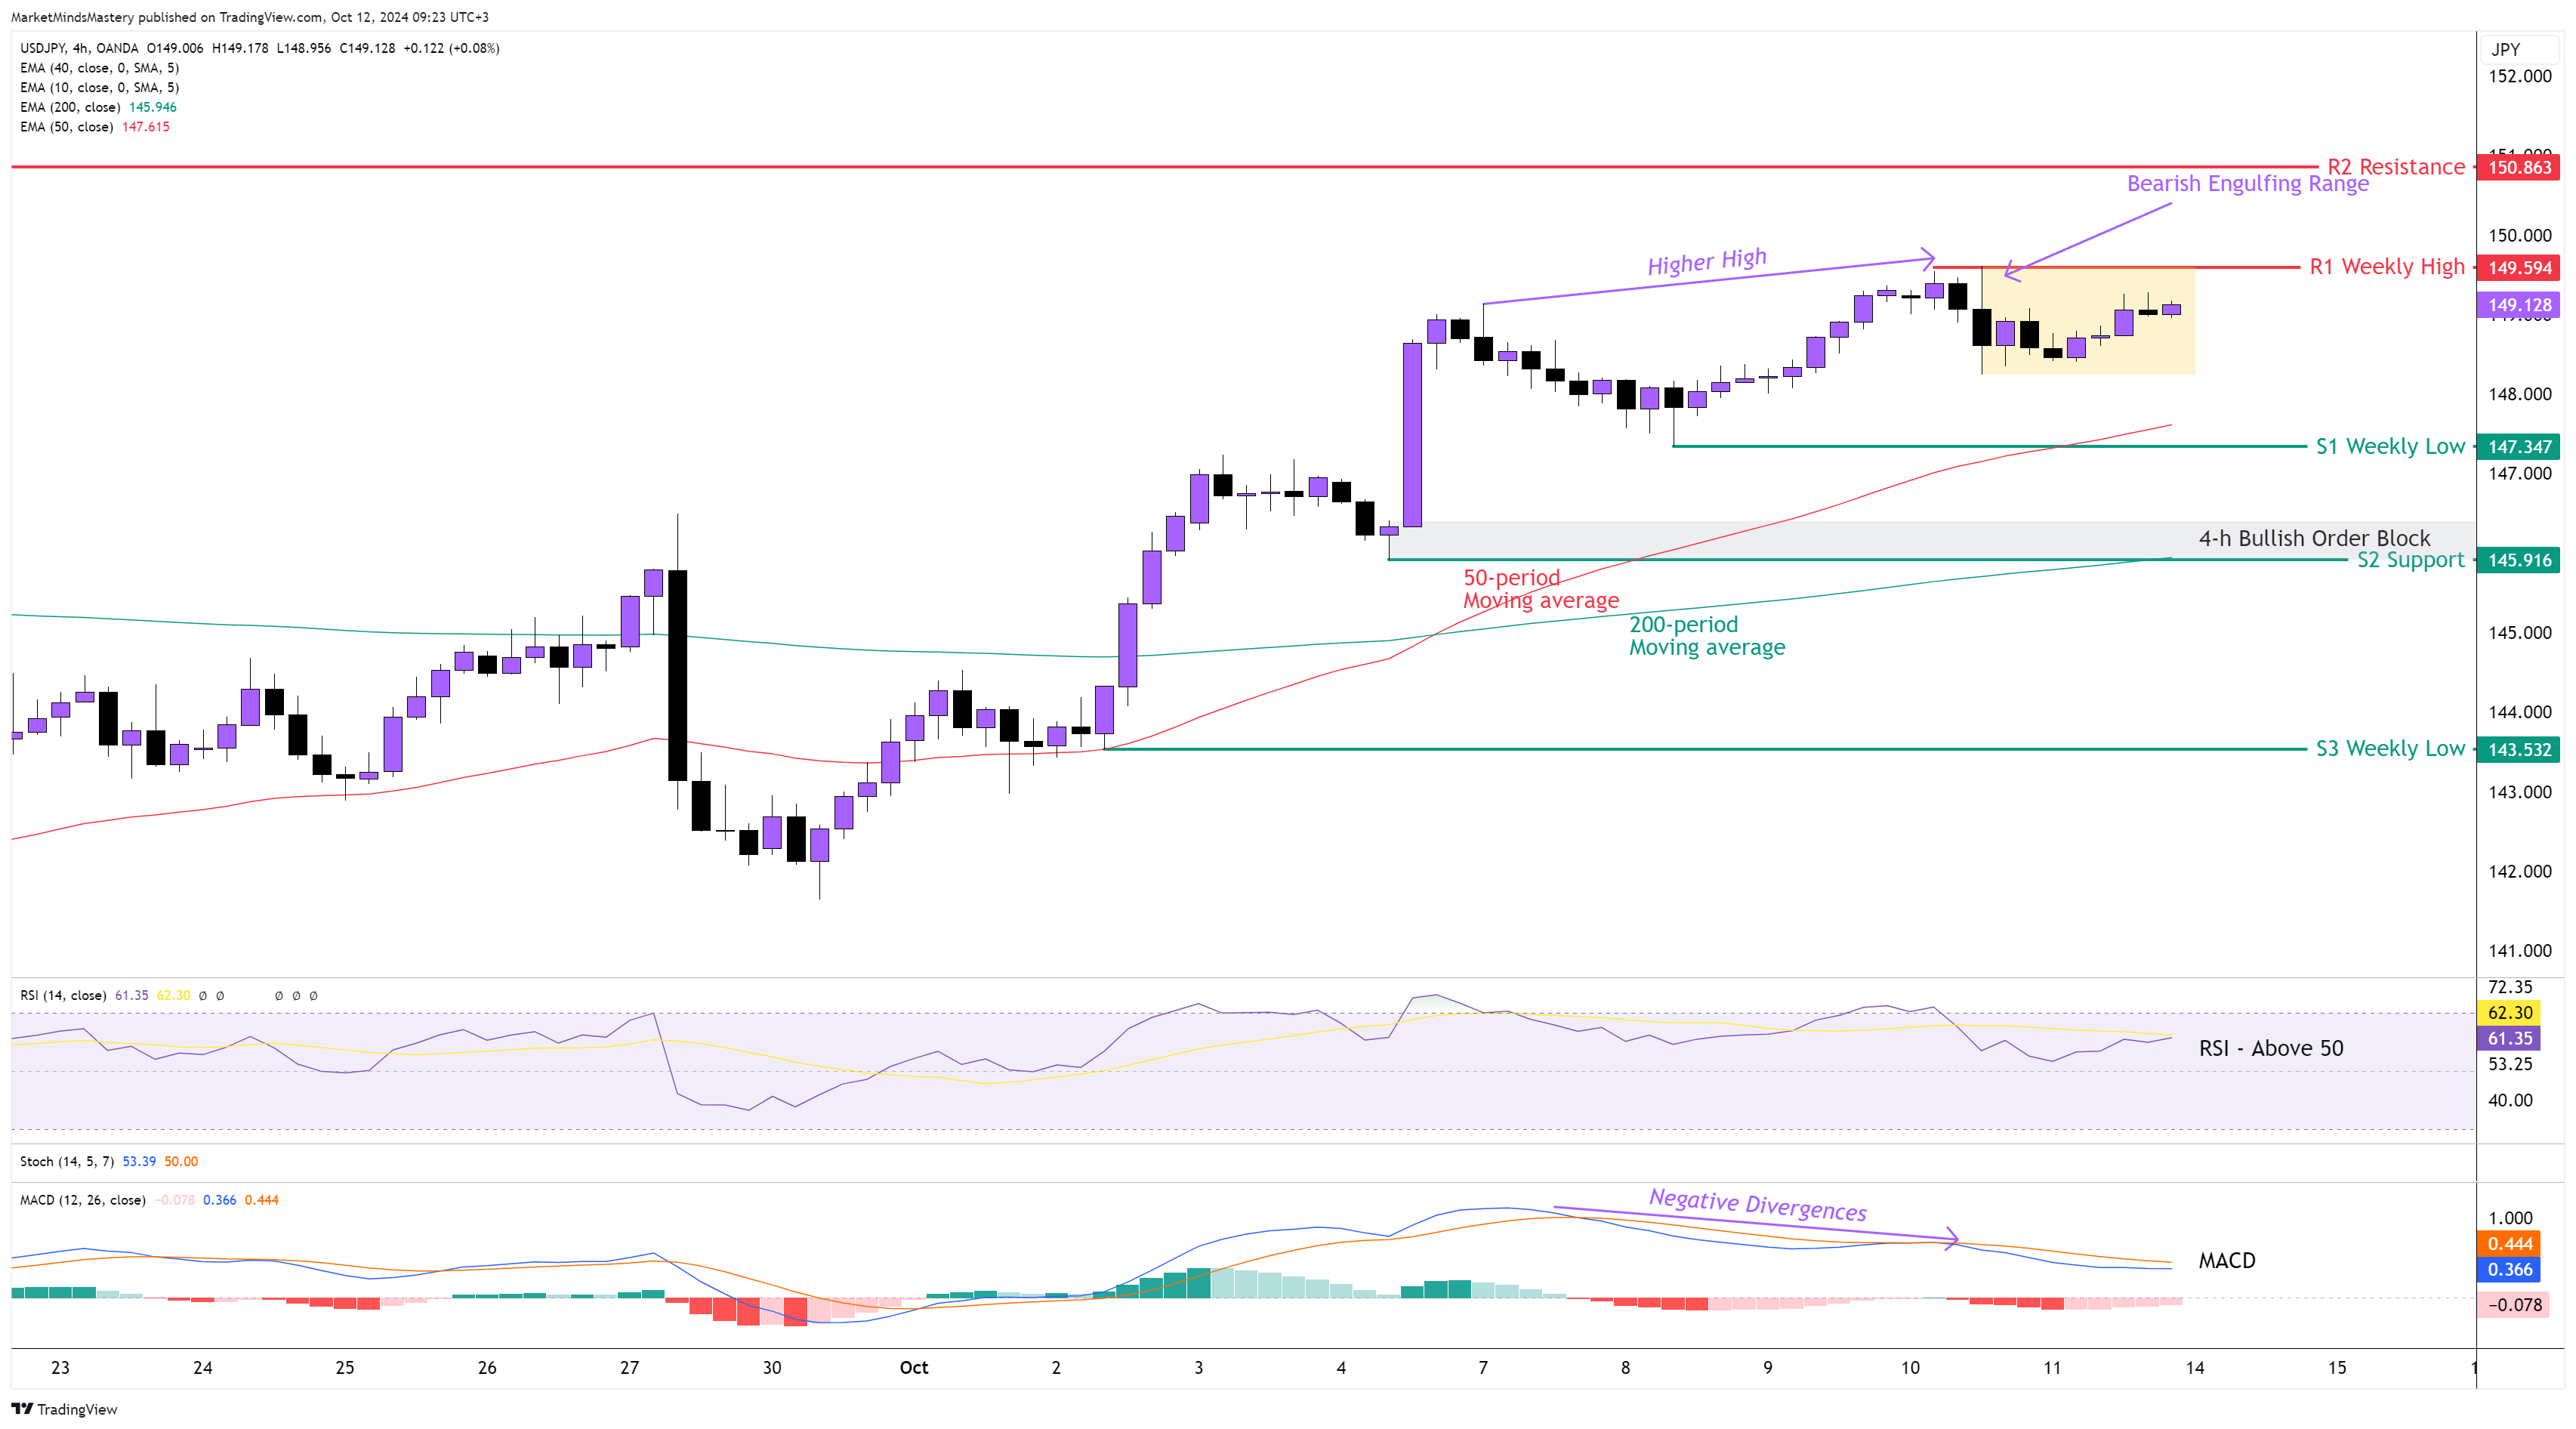
USD JPY 4H
Despite the Bullish Engulfing reversal candlestick created on the weekly chart a week ago, the price of the USDJPY didn't move upwards noticeably last week. The currency pair created a Bullish Hammer, but the candlestick failed to close above the 40-period weekly moving average. On the 4-hour chart, the 50-period moving average remains above the 200-period moving average, which is bullish. The price created a higher high formation last Thursday, but the MACD failed to follow through, and it printed Negative (or Bearish) Divergences. This first means that the price most likely will start a retracement phase. As shown in the chart above, the high and the low levels of the Bearish Engulfing created around 149.500, which served as a price range for two days, and the price remained within the Bearish Engulfing boundaries. The RSI is above 50, and this has bullish implications. Therefore, if the price continues to move upwards, the first resistance area, R1, will be approximately 149.590, which is the previous week’s high. If the price penetrates the R1 and keeps moving upwards, the next resistance area, R2, will be around 150.863.
Conversely, if the price is rejected and moves downwards, the first support area, S1, will be at 147.347, which is the previous week’s low. If the price surpasses the S1 support and keeps moving downward, the next support area, S2, will be around 145.916. This is a key level of support as it consists of a Bullish Order Block and the 200-period moving average.
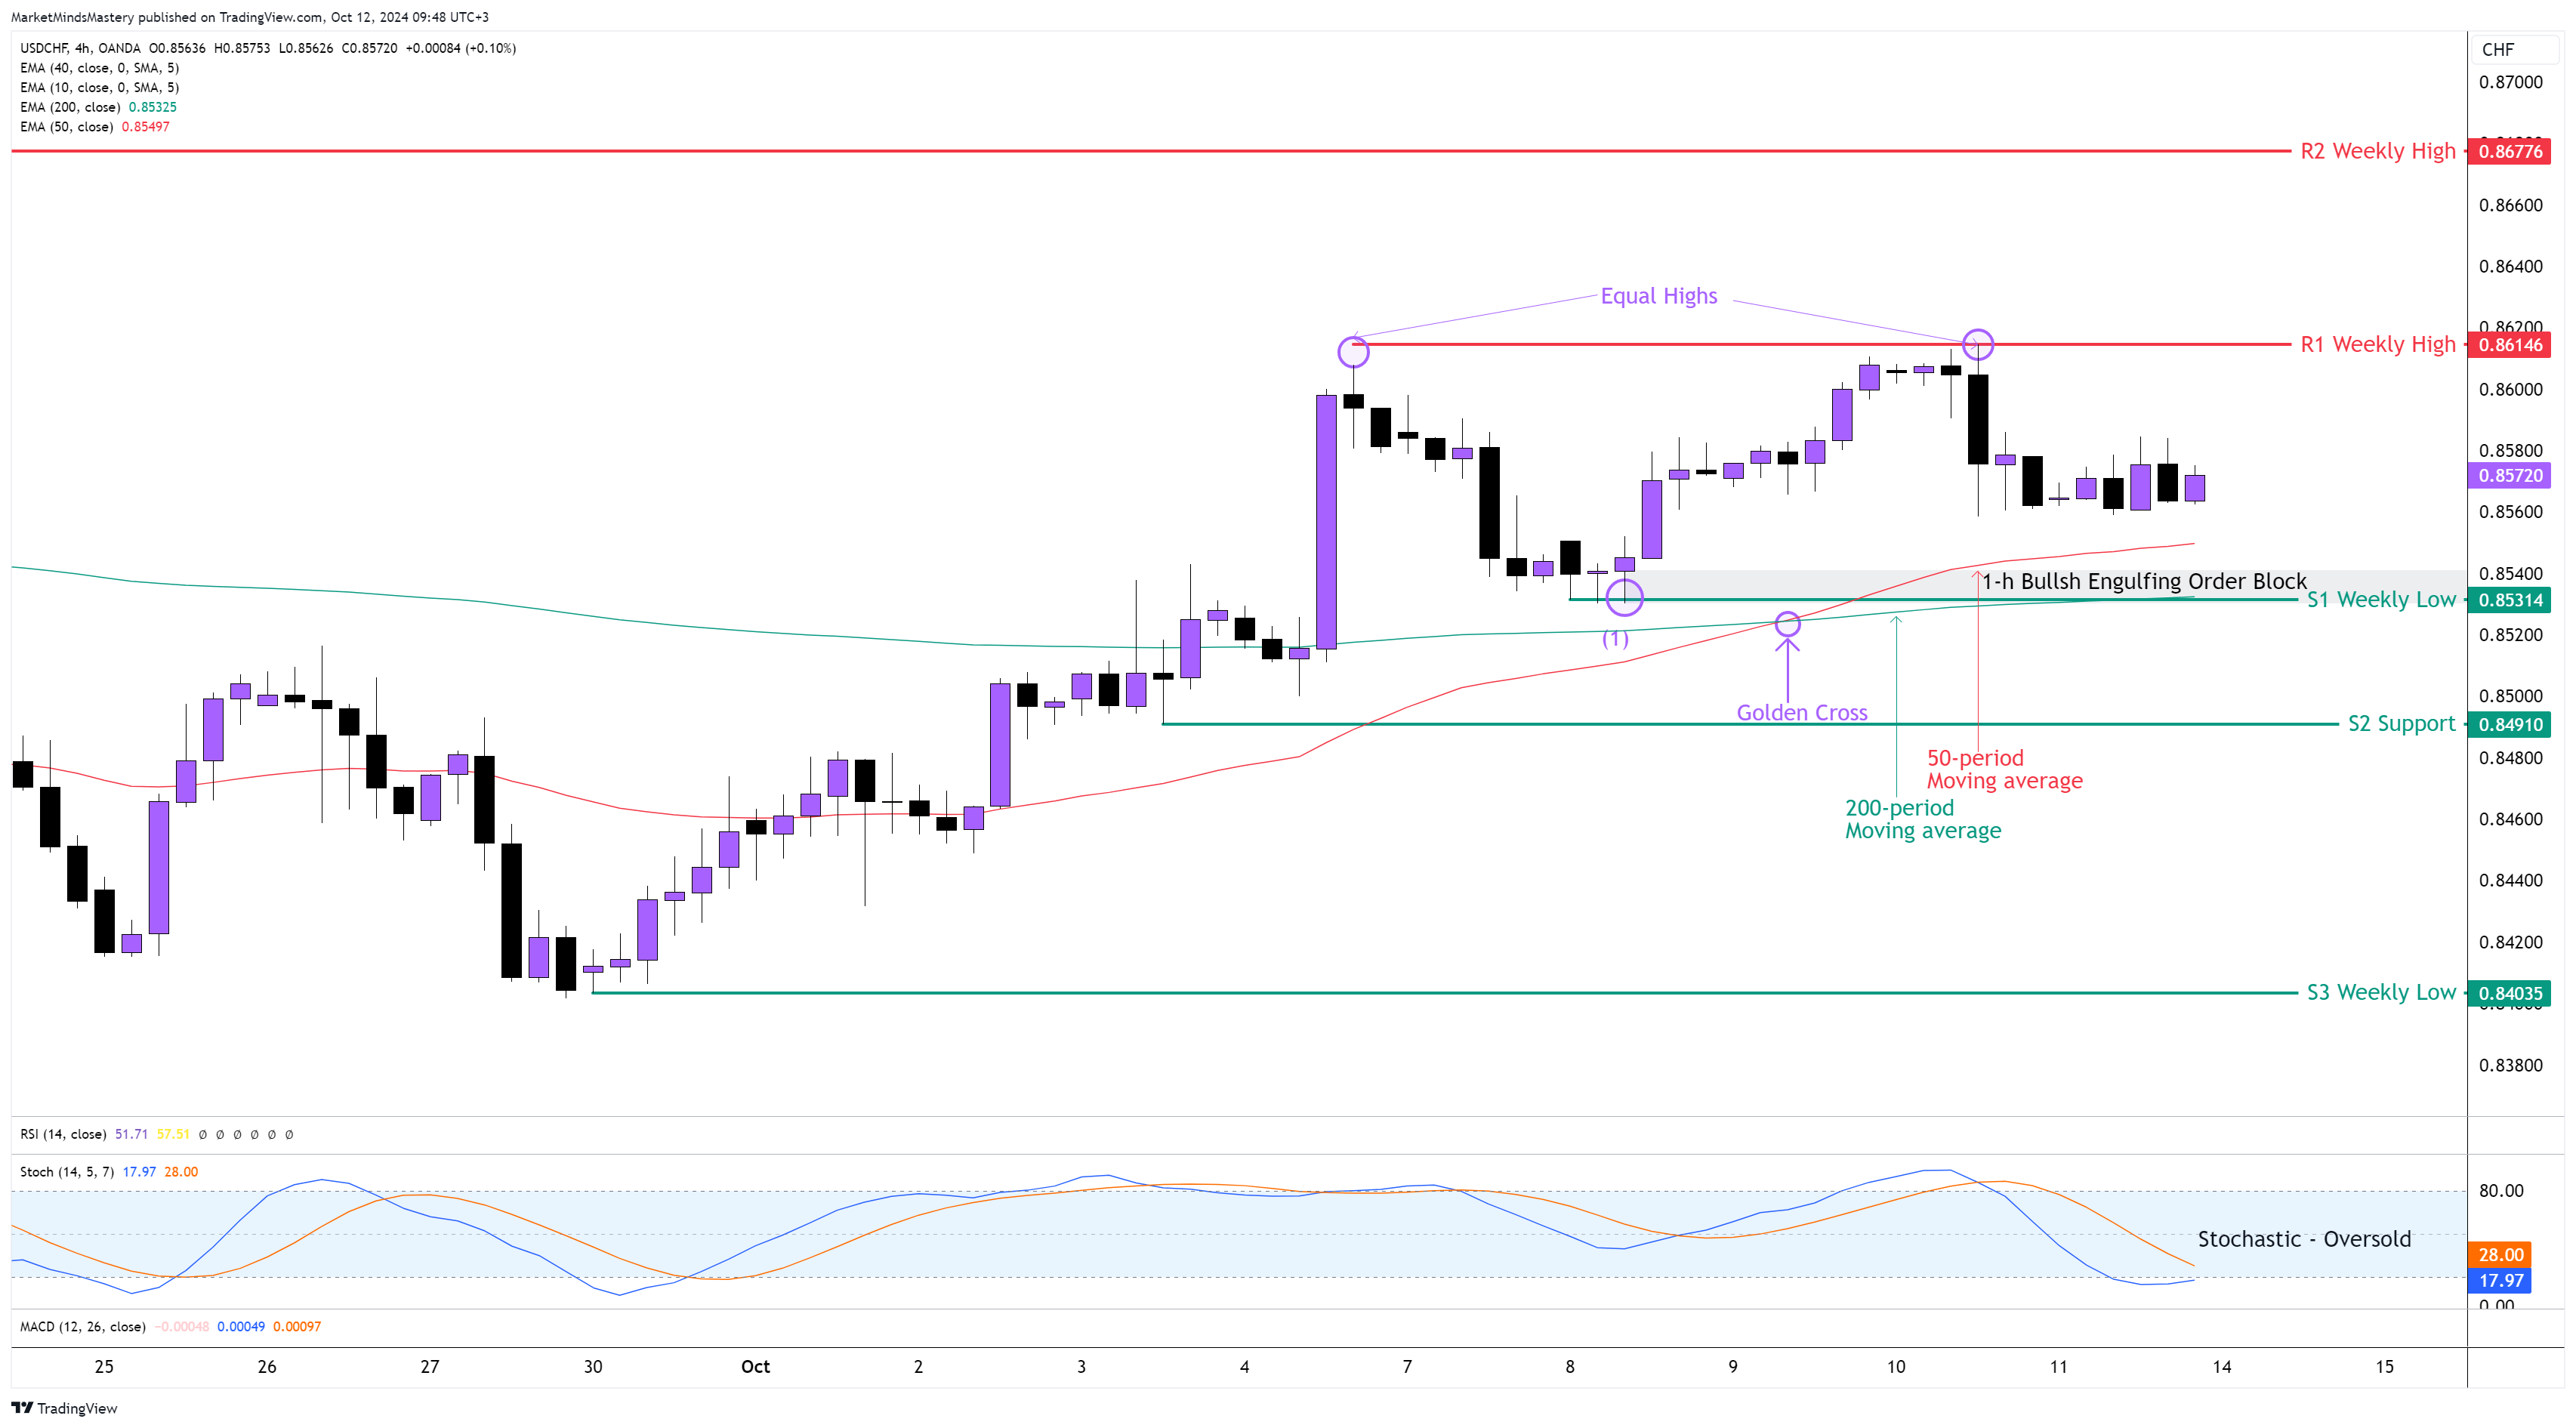
USD CHF 4H
Last week, the price failed to follow the Bullish momentum that started a few weeks ago, as did the price of the currency pair USDCHF. On the weekly chart, the price created a Bearish candlestick pattern with a small body range. On the 4-hour chart, the 50-period crossed above the 200-period moving average, known as the Golden Cross. The Stochastic Oscillator is in its Oversold Condition, and this has bearish implications. Last Thursday, the price created an Equal Hgh formation of around 0.86150. This can have two outcomes. It can end up as an Ascending Triangle continuation pattern, or it can create a Double Top Reversal pattern. Starting Monday, if the price moves upwards, the first resistance area, R1, will be the previous week’s high price level, around 0.86146. If the price penetrates the R1 and keeps moving upwards, the next resistance area, R2, will be at 0.86776, which is an older weekly high level.
On the other hand, if the price is rejected and moves downwards, the first support area, S1, will be approximately 0.85314, which is the previous week’s low. This price level is considered significant because a Bullish Engulfing Order Block was created last week, and it can act as an additional support factor for the price. If the price penetrates the S1 support, it will end the currency uptrend, and a Double Top Reversal Pattern will be confirmed. If the price continues to move downward, the next support area, S2, will be around 0.84910. If the price surpasses the S2 and keeps lowering, the next support area, S3, will be at 0.84035.
GBP JPY 4H
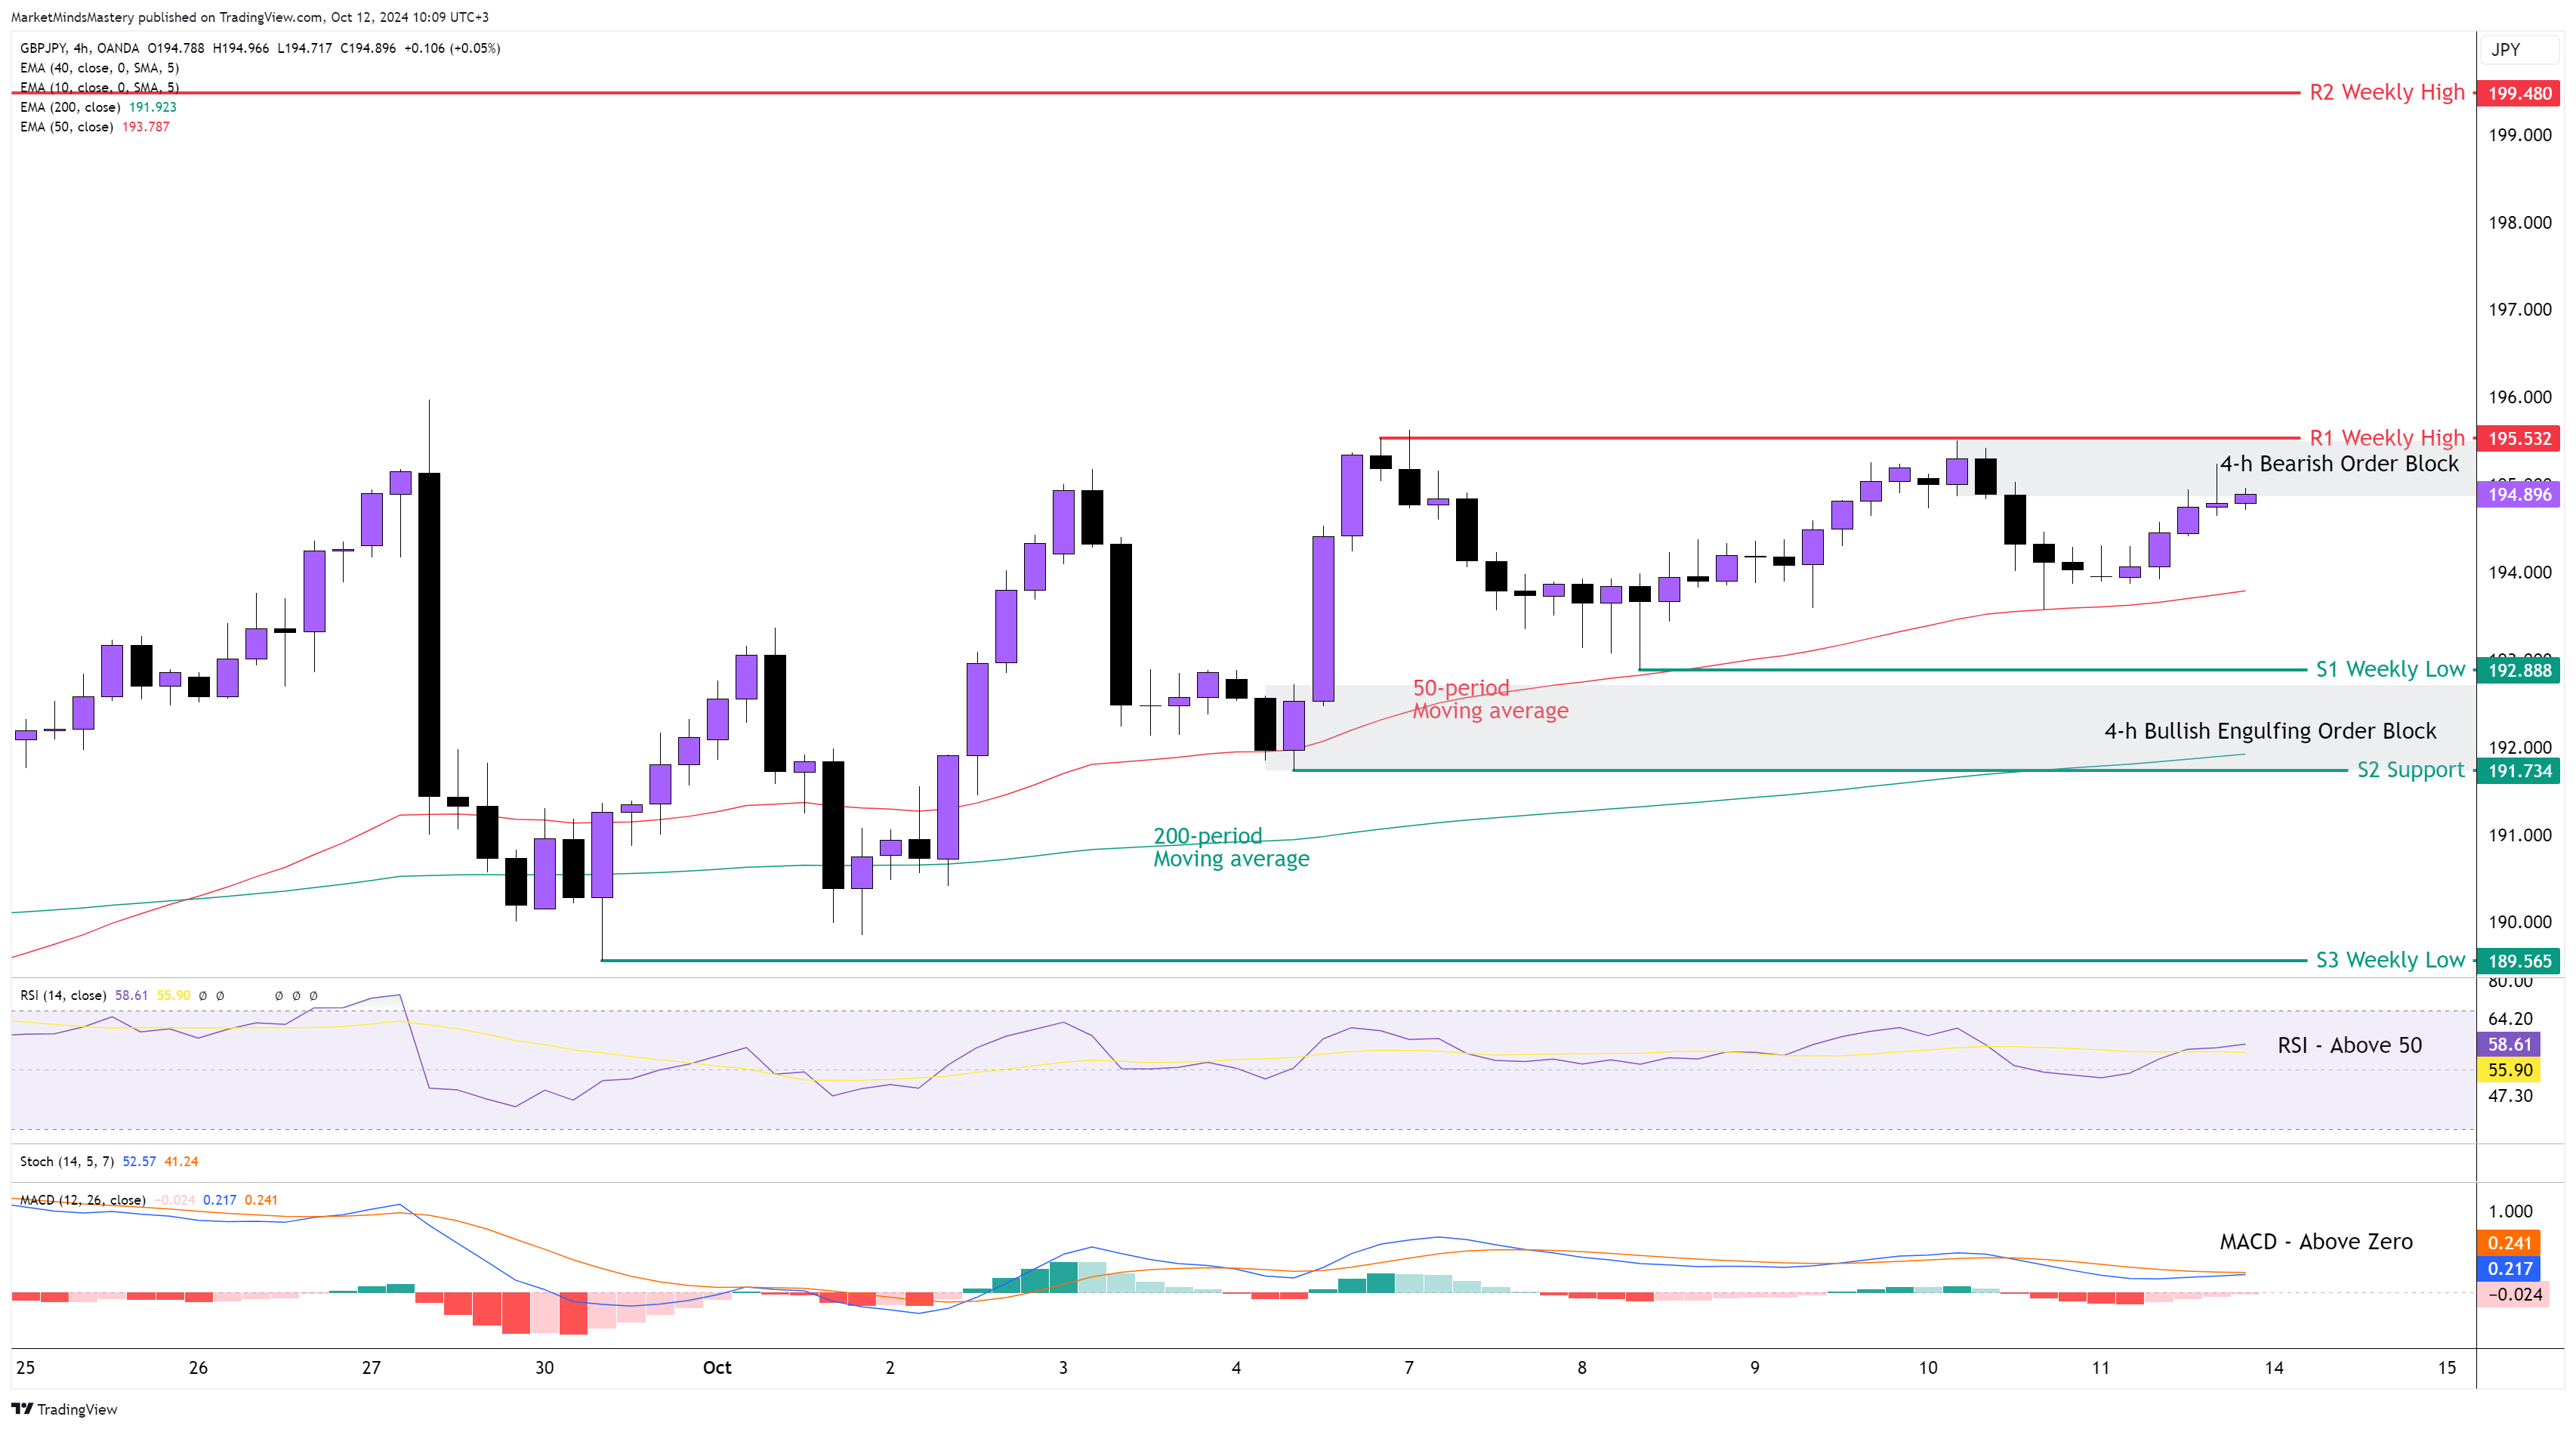
Although the price didn't create a directional move last week, the price mitigated the FVP (Fair Value Price) we pointed out in last week’s Market Outlook. Then, it bounced off and moved upwards, offering a high probability of tradable opportunities for traders. The weekly chart ended with a Hanging Man candlestick pattern, which is considered a reversal price action when found in residential areas. On the 4-hour chart, the 50-period is above the 200-period moving average, and this has bullish implications. The RSI Oscillator is above its middle line of 50, and this is bullish. The MACD is above zero, which is bullish. The price maintains its higher low formation, but it doesn’t make higher highs. Currently, the price is around the Bearish Order Block that was created last Friday. Therefore, if the price is rejected and moves downwards, the first support area, S1, will be around 192.888, which is the previous week’s low. If the price surpasses the S1 and keeps moving downwards, the next support area, S2, will be at 191.734. This is considered a key level of support because the price coexists with the Bullish Engulfing Order Block created a few weeks ago and the 200-period moving average. If the price penetrates the S2 and keeps lowering, the next support area, S3, will be at 189.565, which is the previous week’s low. Oppositely, if the price moves upwards and penetrates the Bearish Order Block around 195.000, the first resistance area, R1, will be approximately 195.532, which is the previous week’s high. If the price penetrates the R1 and keeps moving upwards, the next resistance area, R2, will be around 199.480, which is an old weekly price level.
GOLD 4H
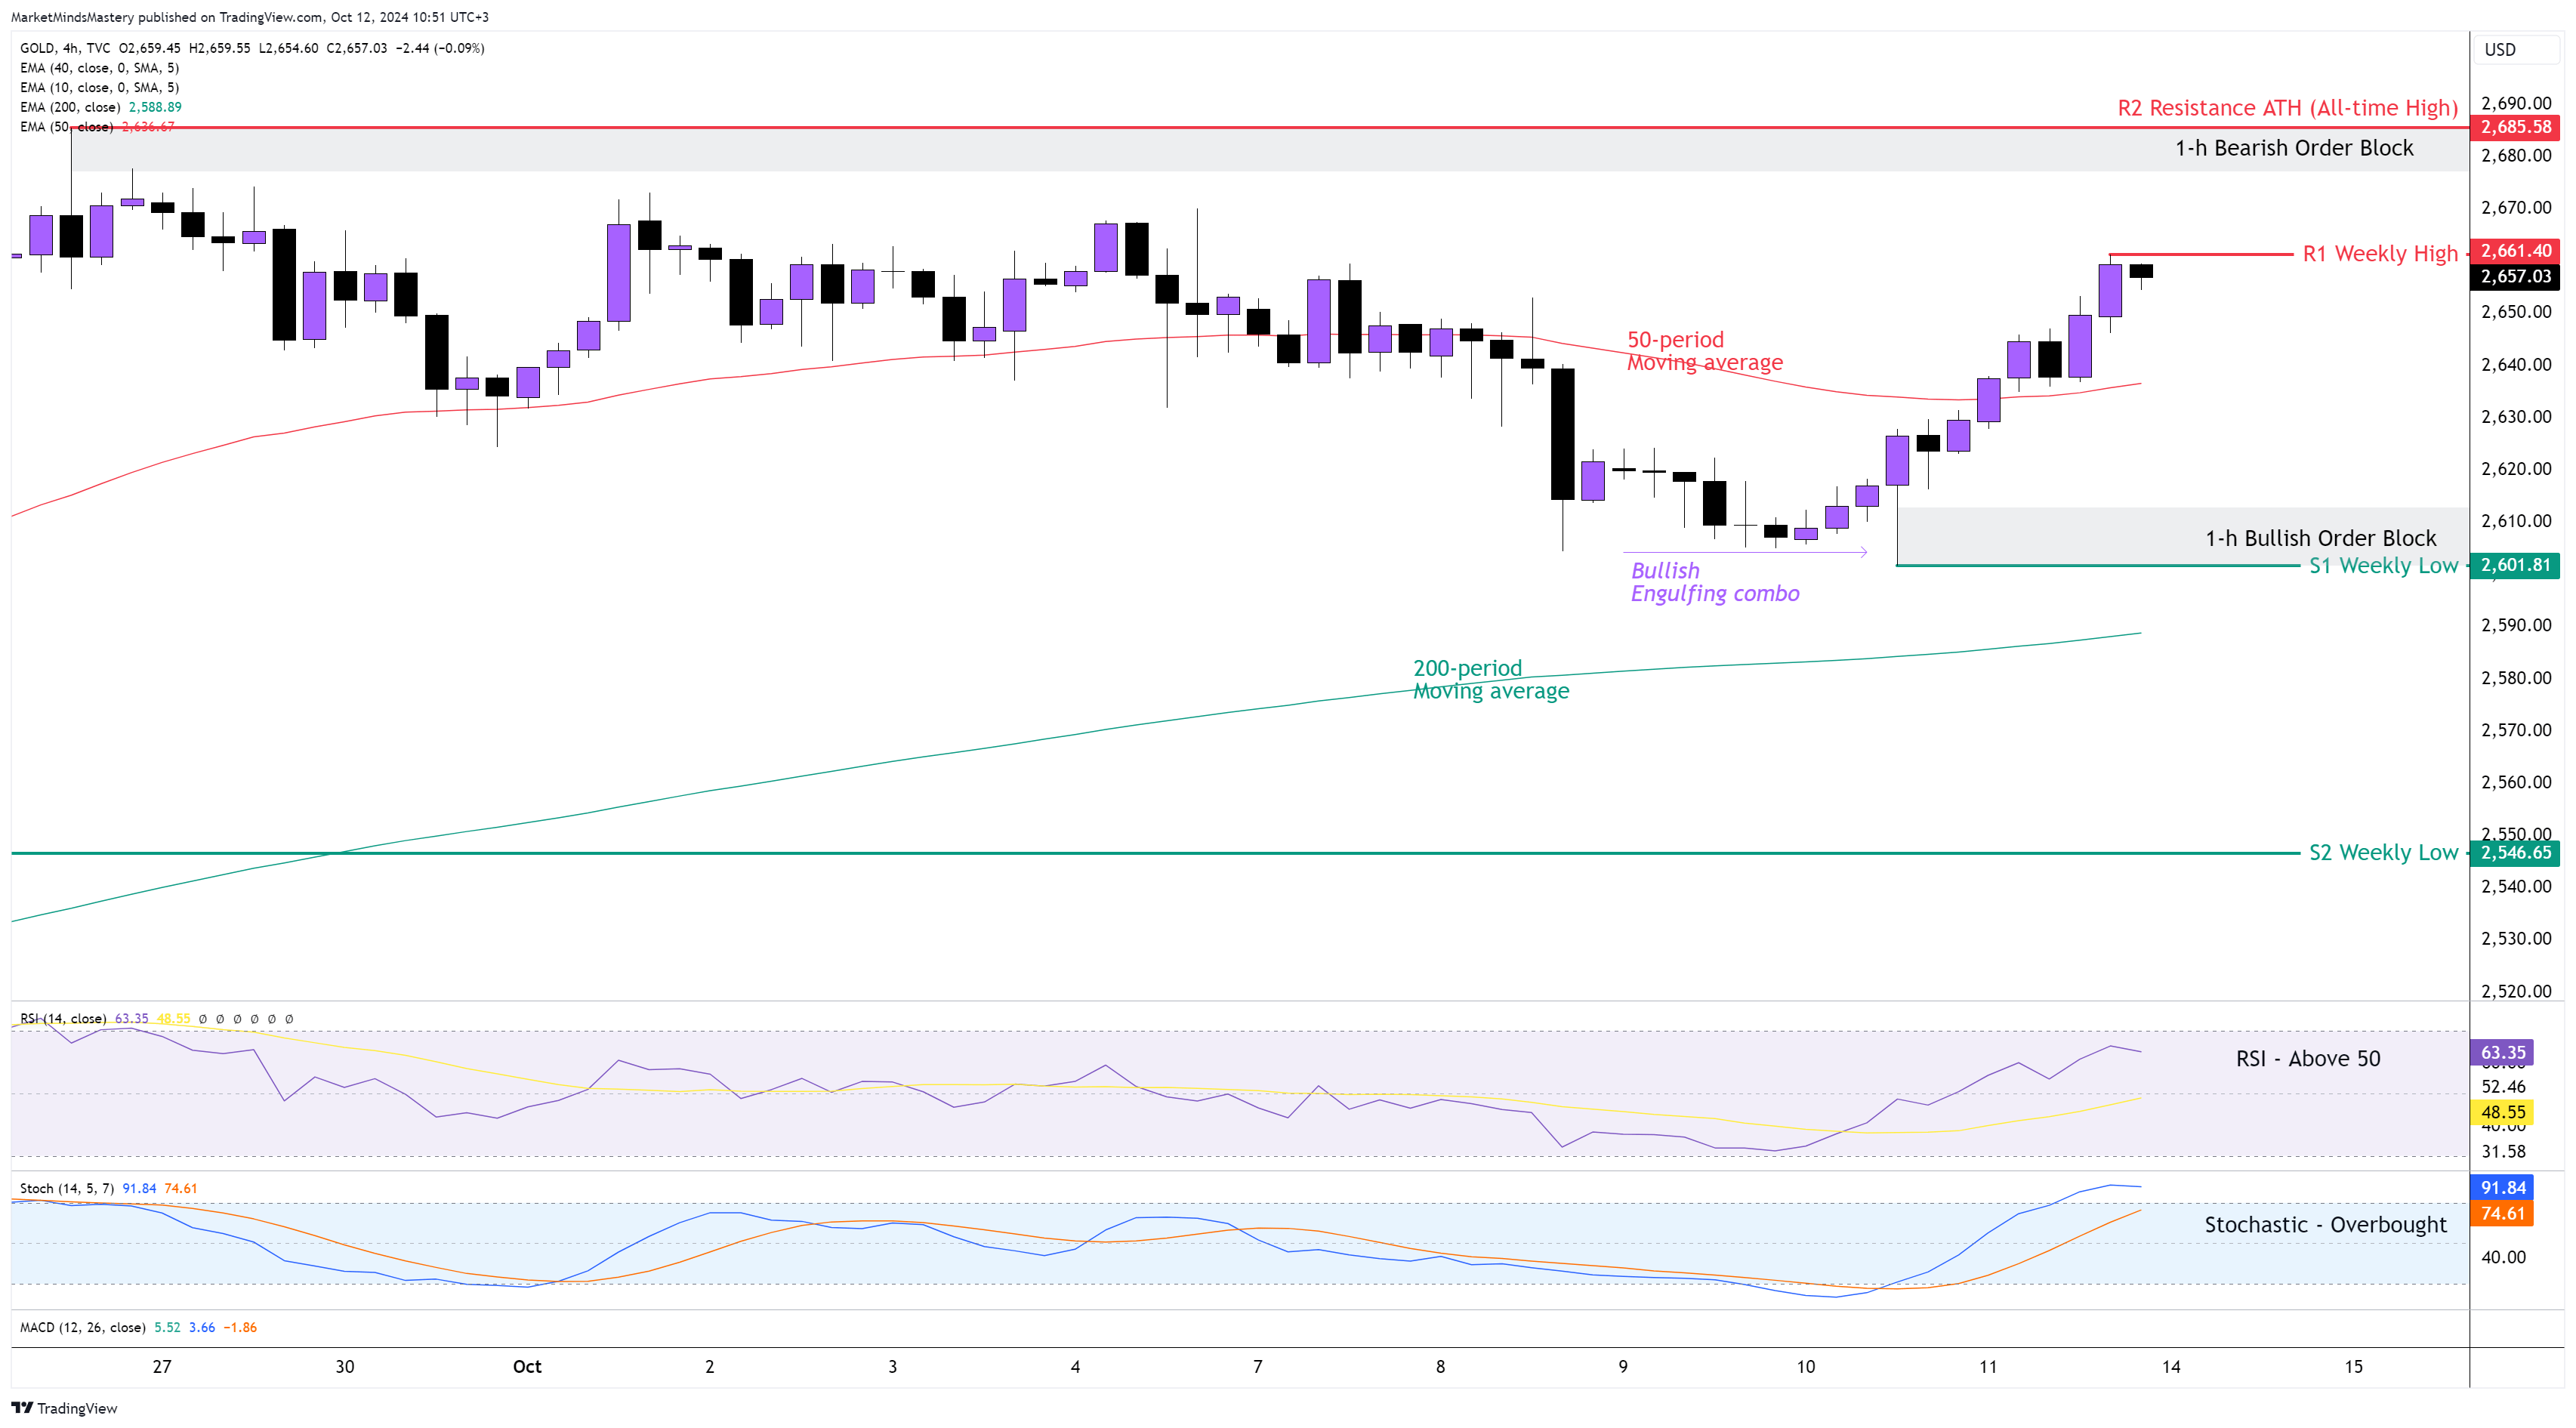
Last week, the price of GOLD moved below $2625, which is the low of the weekly candle we mentioned in last week’s market analysis. However, by the end of last week, the price rebounded, moved upwards, and closed as a Bullish Candle with a Long Lower Wick. This shows that the price of Gold wants to hover around its ATH (All-time high) for one more week. Analysing the 4-hour chart, the 50-period remains above the 200-period moving average, which is bullish. The RSI is above 50, indicating bullishness. The Stochastic Oscillator is in its Overbought Condition, and this has bullish implications. Based on the swing analysis and market structure, the price is trading within a long-term range that started three weeks ago. Currently, the price is above the 50-period moving average. Hence, if the price continues to move upwards, the first resistance area, R1, will be the previous week’s high, around $2661. If the price penetrates the R1 and keeps moving upwards, the next resistance area, R2, will be the ATH (All-Time High), approximately $2685. At this price level, a Bearish Order Block was created three weeks ago on the 1-hour chart. As it hasn’t been tested yet, if the price surpasses it, it will likely do so with a noticeable amount of volatility.
Conversely, if the price is rejected and moves downwards, the first support area, S1, will be around $2601, the previous week’s low. A Bullish Engulfing with a Long Lower Wick created a Bullish Order Block around this level last week. Therefore, it is considered a significant level of support. If the price penetrates S1, a downtrend can start. If the price keeps decreasing afterwards, the next support area, S2, will be an old weekly low level at $2546.
USOIL 4H
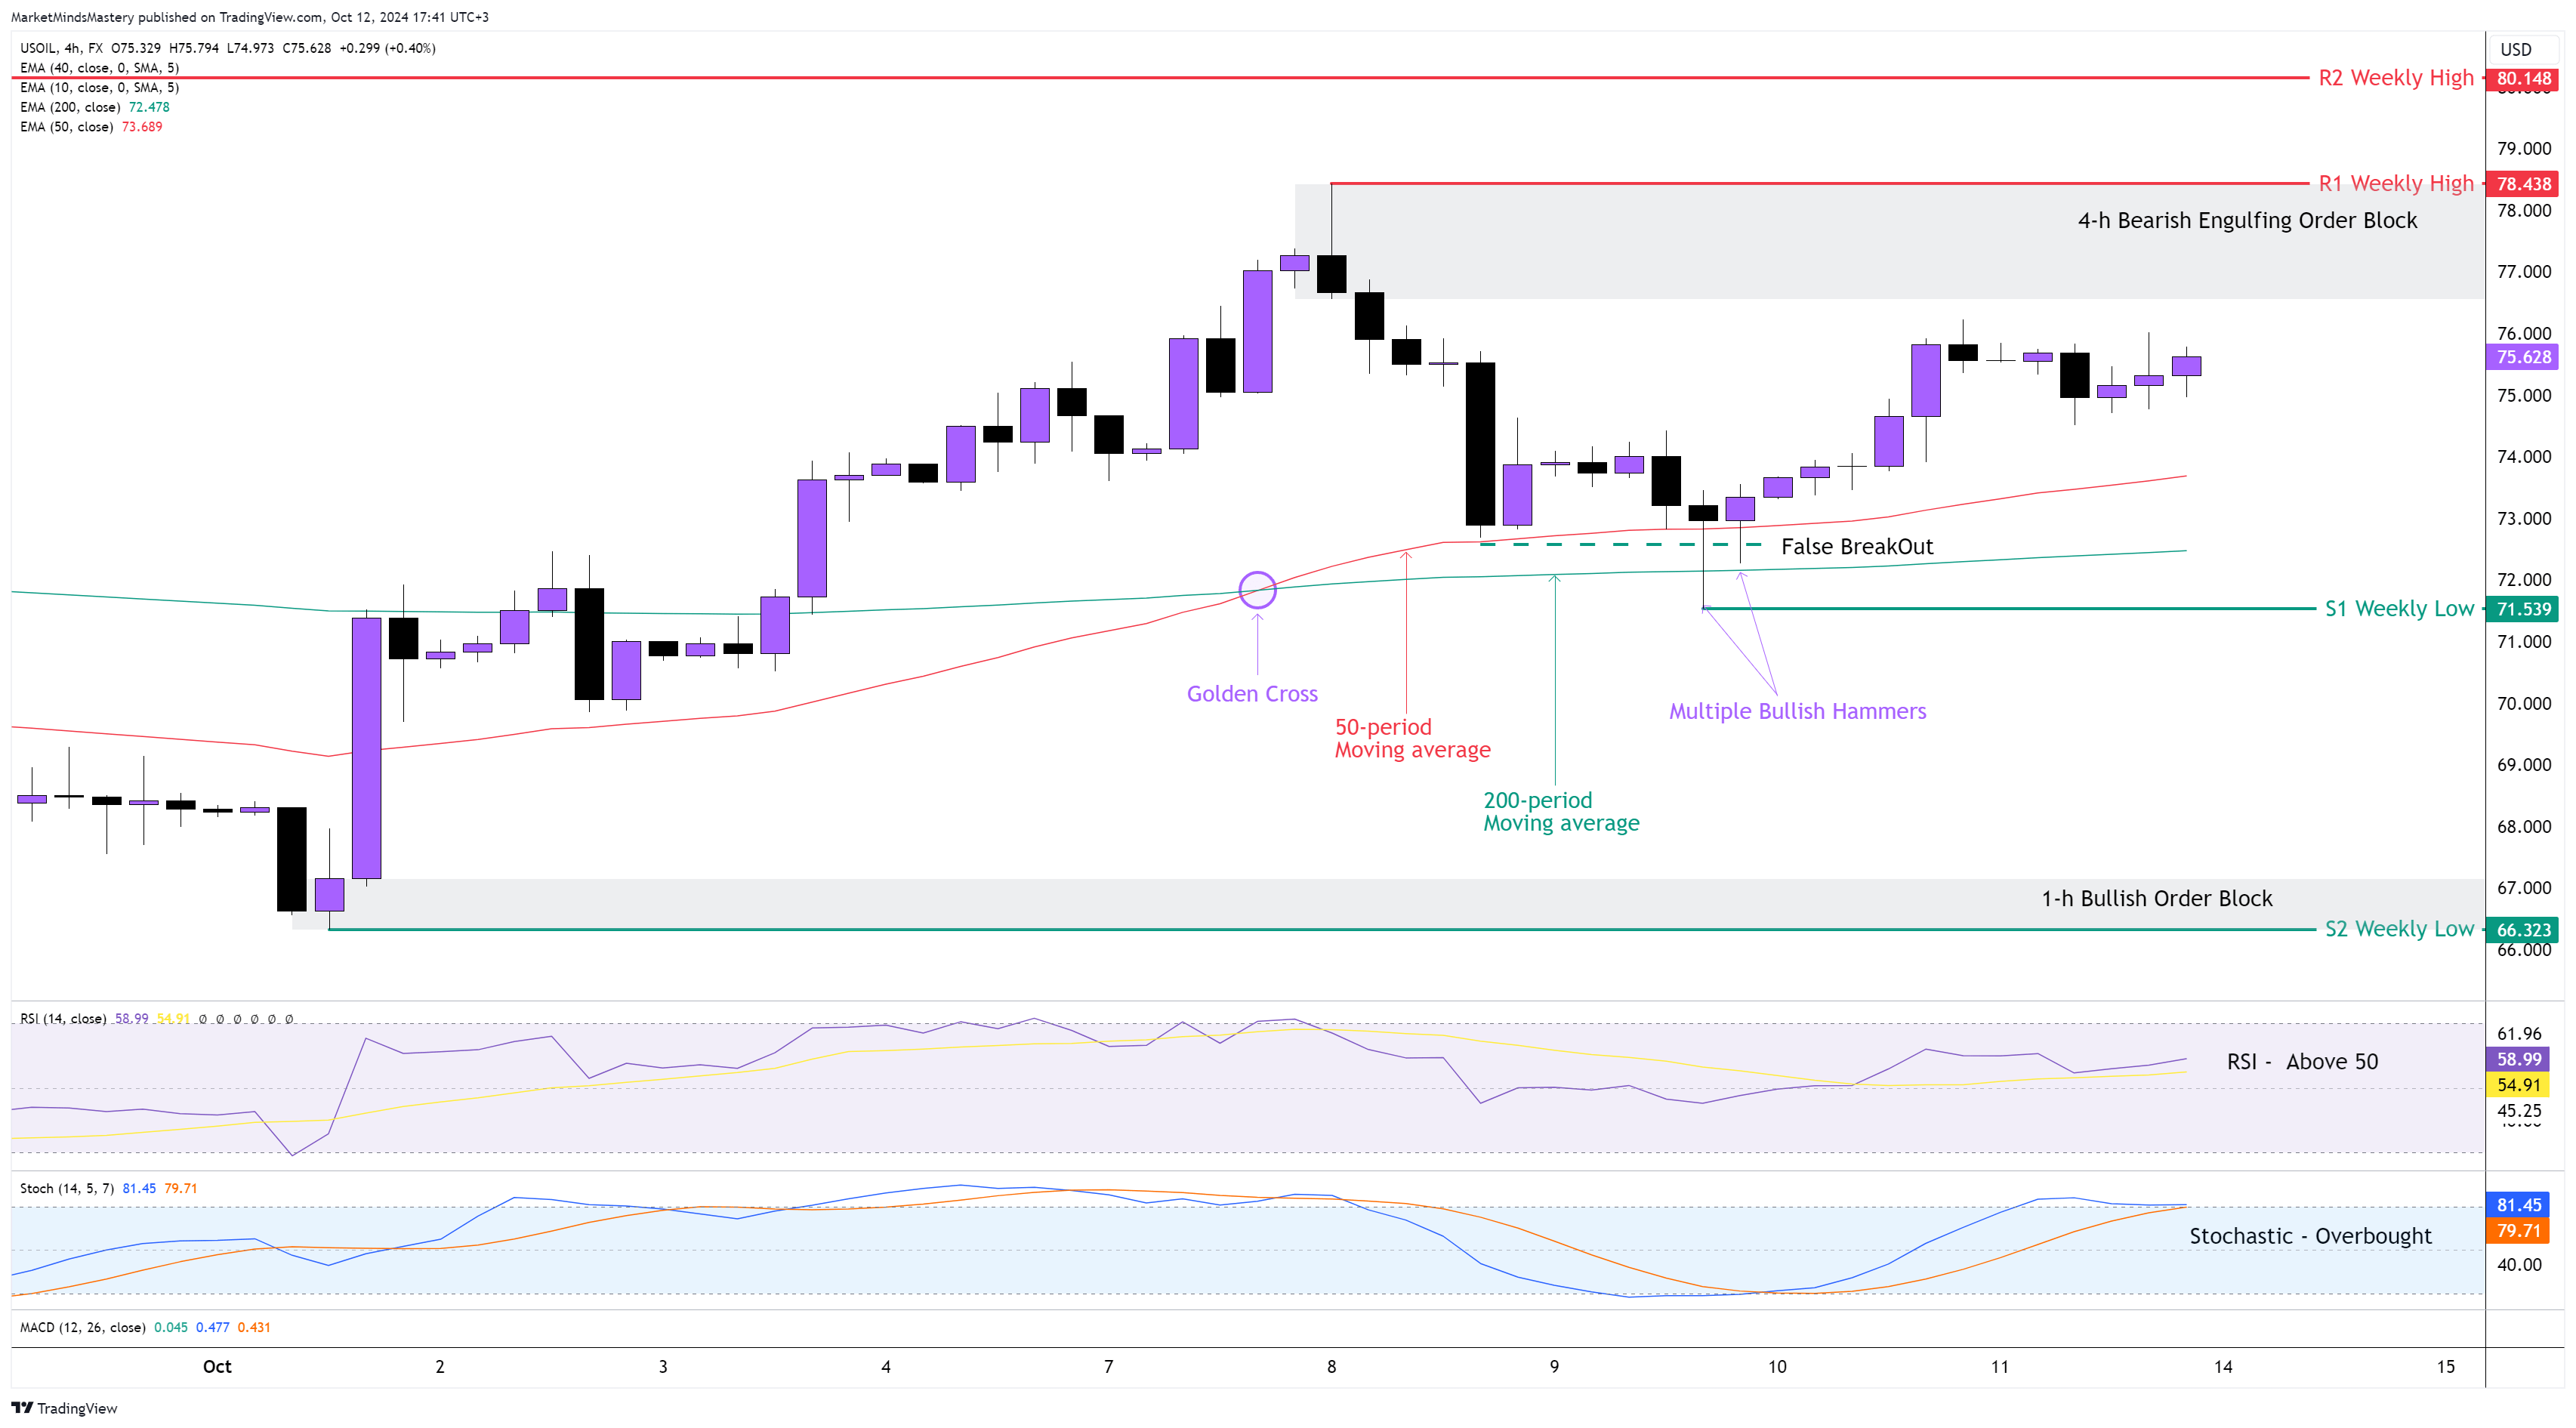
Last Wednesday, the price tested the Bullish Engulfing Order Block at around $71, as we pointed out on the chart, bounced off and moved upwards. The price on the weekly chart ended as a Spinning Top around weekly resistance and also rejected the 40-period weekly moving average (not shown on the chart). On the 4-hour chart, the 50-period moving average crossed above the 200-period known as the Golden Cross. The RSI is above 50, indicating bullishness. The Stochastic Oscillator is at its overbought condition, which is bullish. Currently, the price is above the 50-period moving average, and this is also bullish. Hence, starting Monday, if the price continues moving upward, the first resistance area, R1, will be around $78.43. At this price level last Tuesday, the price created a Bearish Engulfing Order Block, which can provide additional resistance for the price. If the price penetrates the R1 and keeps increasing, the next resistance area, R2, will be at $80.14, an old weekly level.
Conversely, if the price is rejected and moves downward, the first support area, S1, will be approximately $71.53, which is the previous week’s low. If the price penetrates S1, the market most likely will start a downtrend. If this happens and the price keeps moving downwards, the next support area, S2, will be around $66.32, which is an older weekly level. A few weeks ago, a 1-h Bullish Order Block was created, but it hasn’t been tested yet.
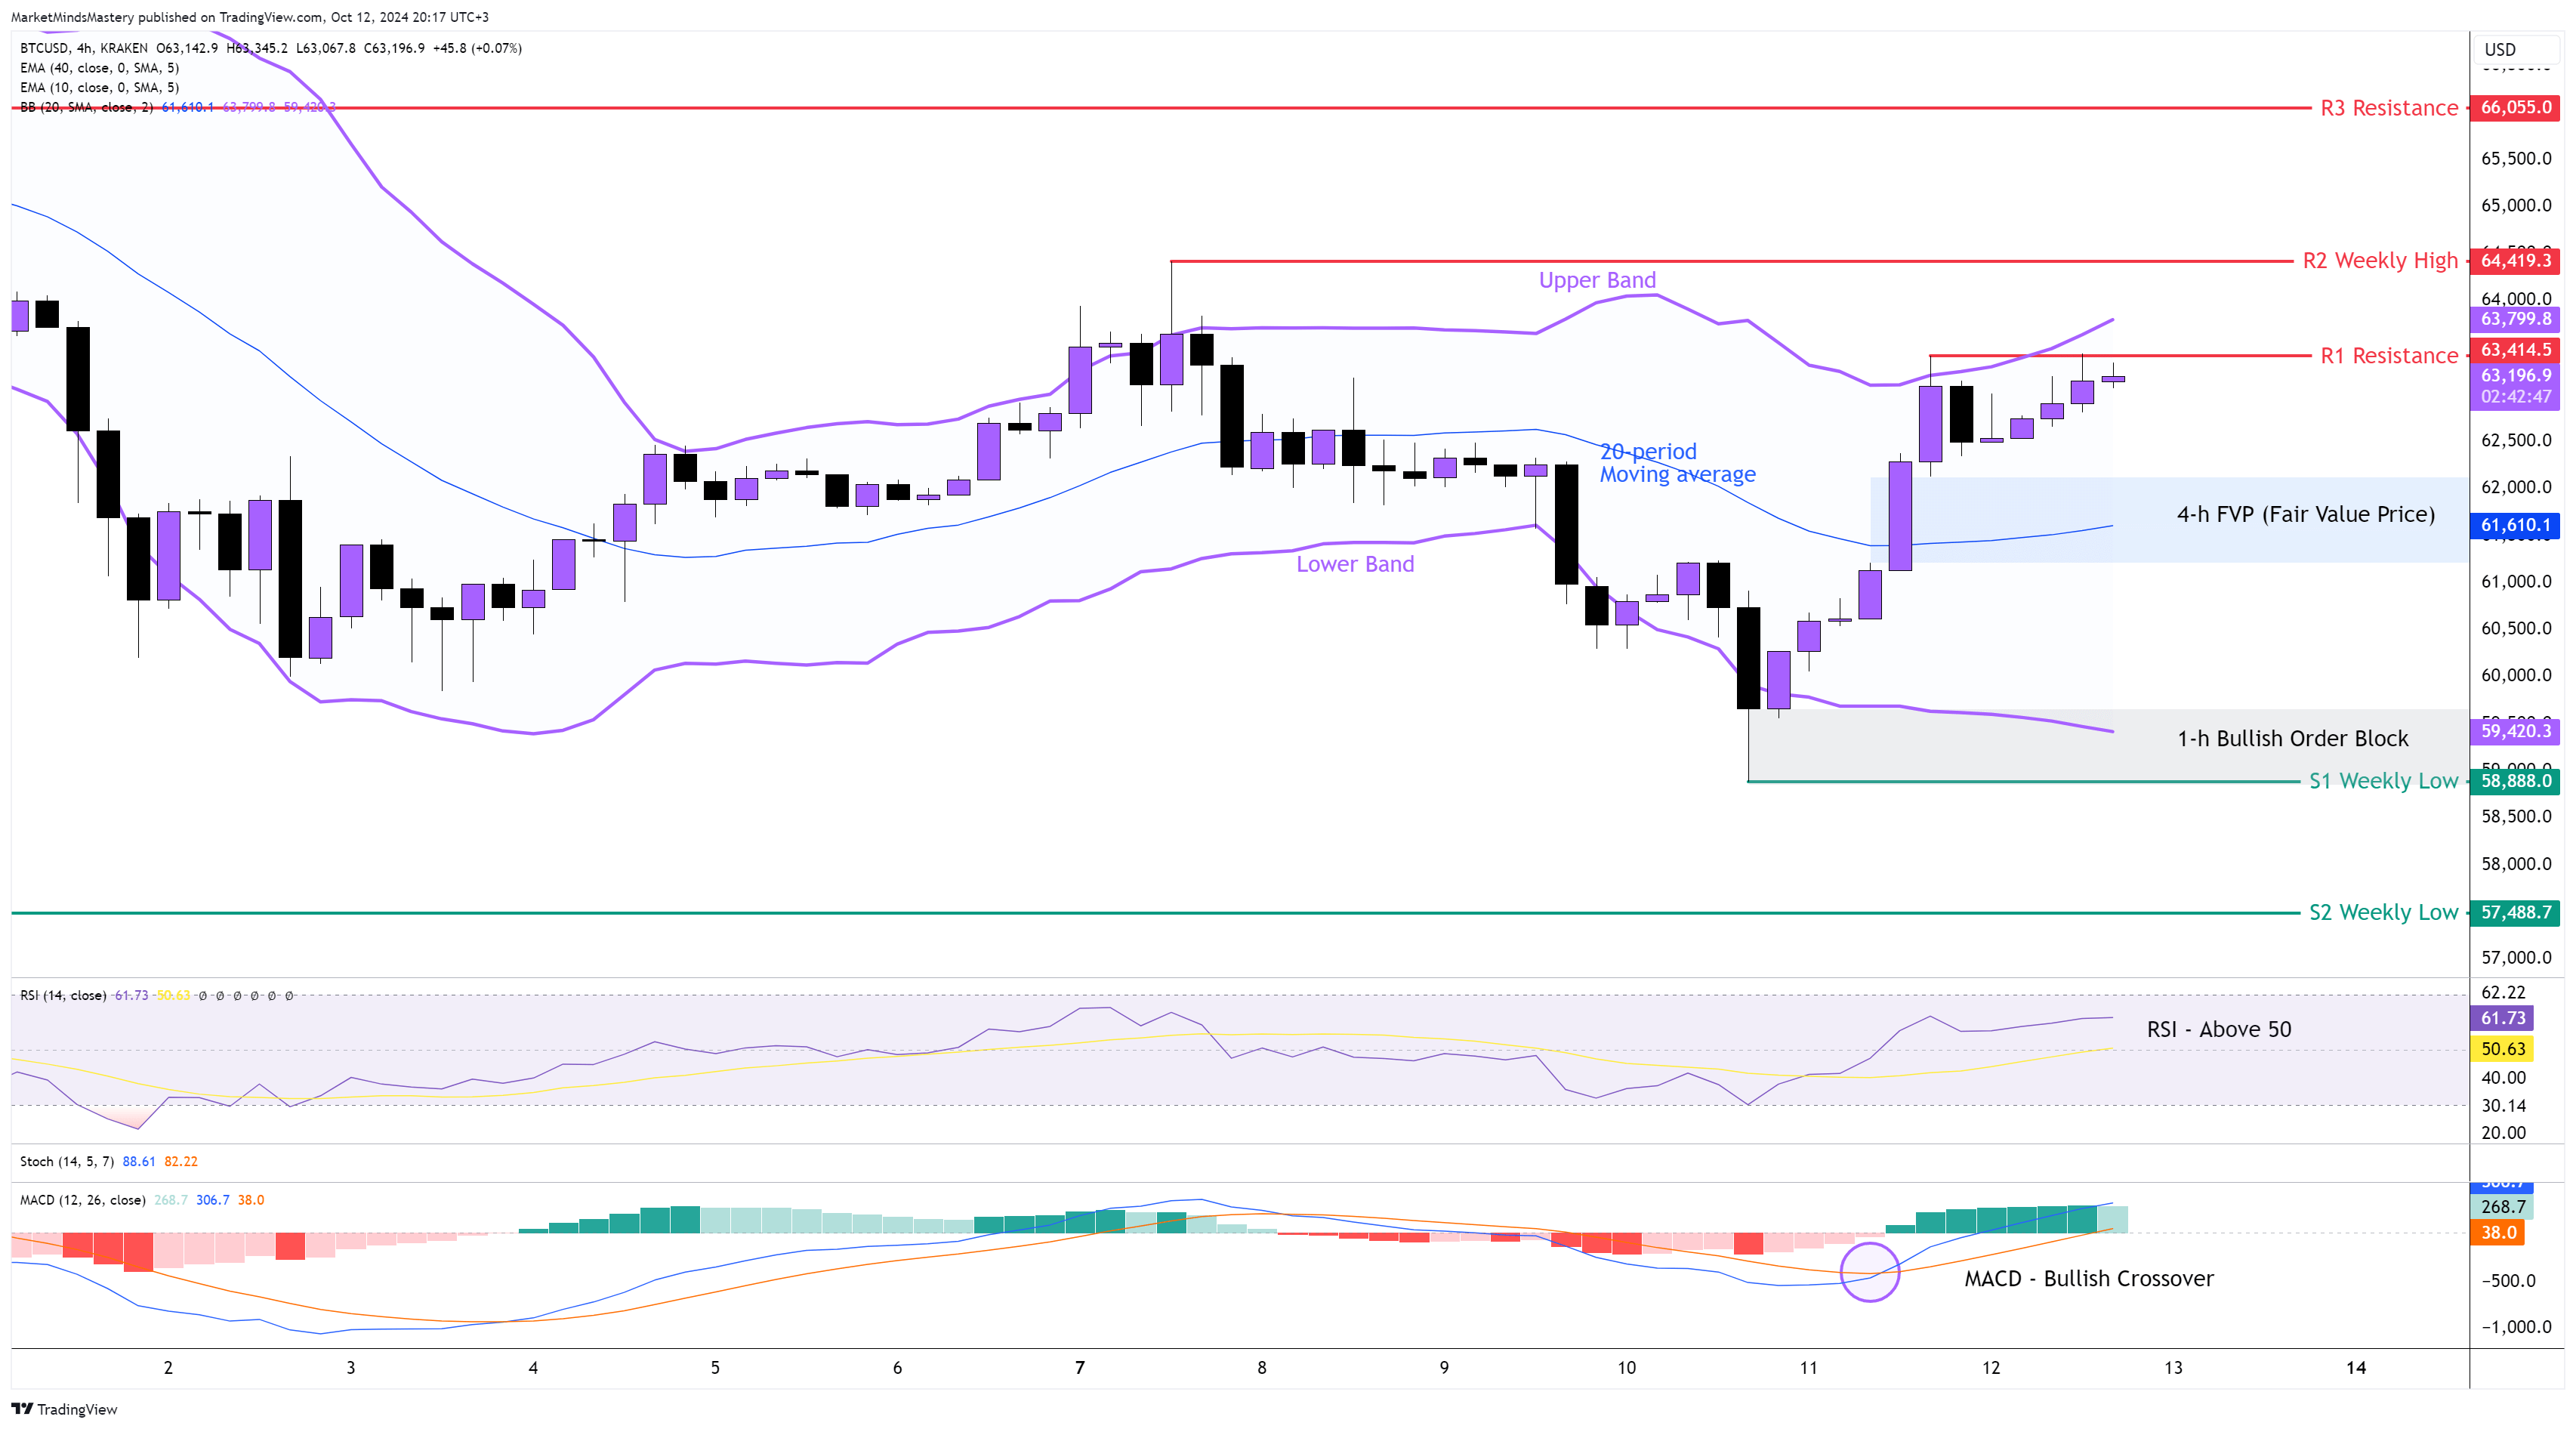
BTC USD 4H
Following the previous week’s Market Analysis, the price of BTCUSD tested the FVP (Fair Value Price) area at around $64000. It then was rejected and moved downwards, reaching $59000. The weekly price action ended as a Long-Legged Doji candle. Therefore, based on the 4-hour chart and the Swing Analysis, the price moved sideways last week. The RSI is slightly above its middle line of 50, which has bullish implications. The MACD created a Bullish Crossover as the MACD Line (Blue) crossed above the Signal Line (Orange) while both lines were below the zero line. The MACD’s Histogram is increasing, indicating that the price is rising. Currently, the price is above the 20-period moving average, and it is close to the Upper Band of the Bollinger Band indicator. Therefore, if the price keeps moving upwards, the first resistance area R1 will be around $63414. If the price penetrates the R1 and keeps moving upwards, the next resistance area, R2, will be around $64419, which is the previous week’s high. If the price penetrates the R2 resistance and keeps increasing, then the next resistance area, R3, will be at $66000.
On the other hand, if the price moves downwards, it will enter into the FVP (Fair Value Price) around $61600. If the FVP rejects the price and keeps declining, the first support area, S1, will be at $58888, which is the previous week’s low. At this price level, last Thursday, a Bullish Order Block was created, and it can become an additional support for the price. If the price penetrates the S1 and keeps moving downwards, the next key level of support, S2, will be the $57488.
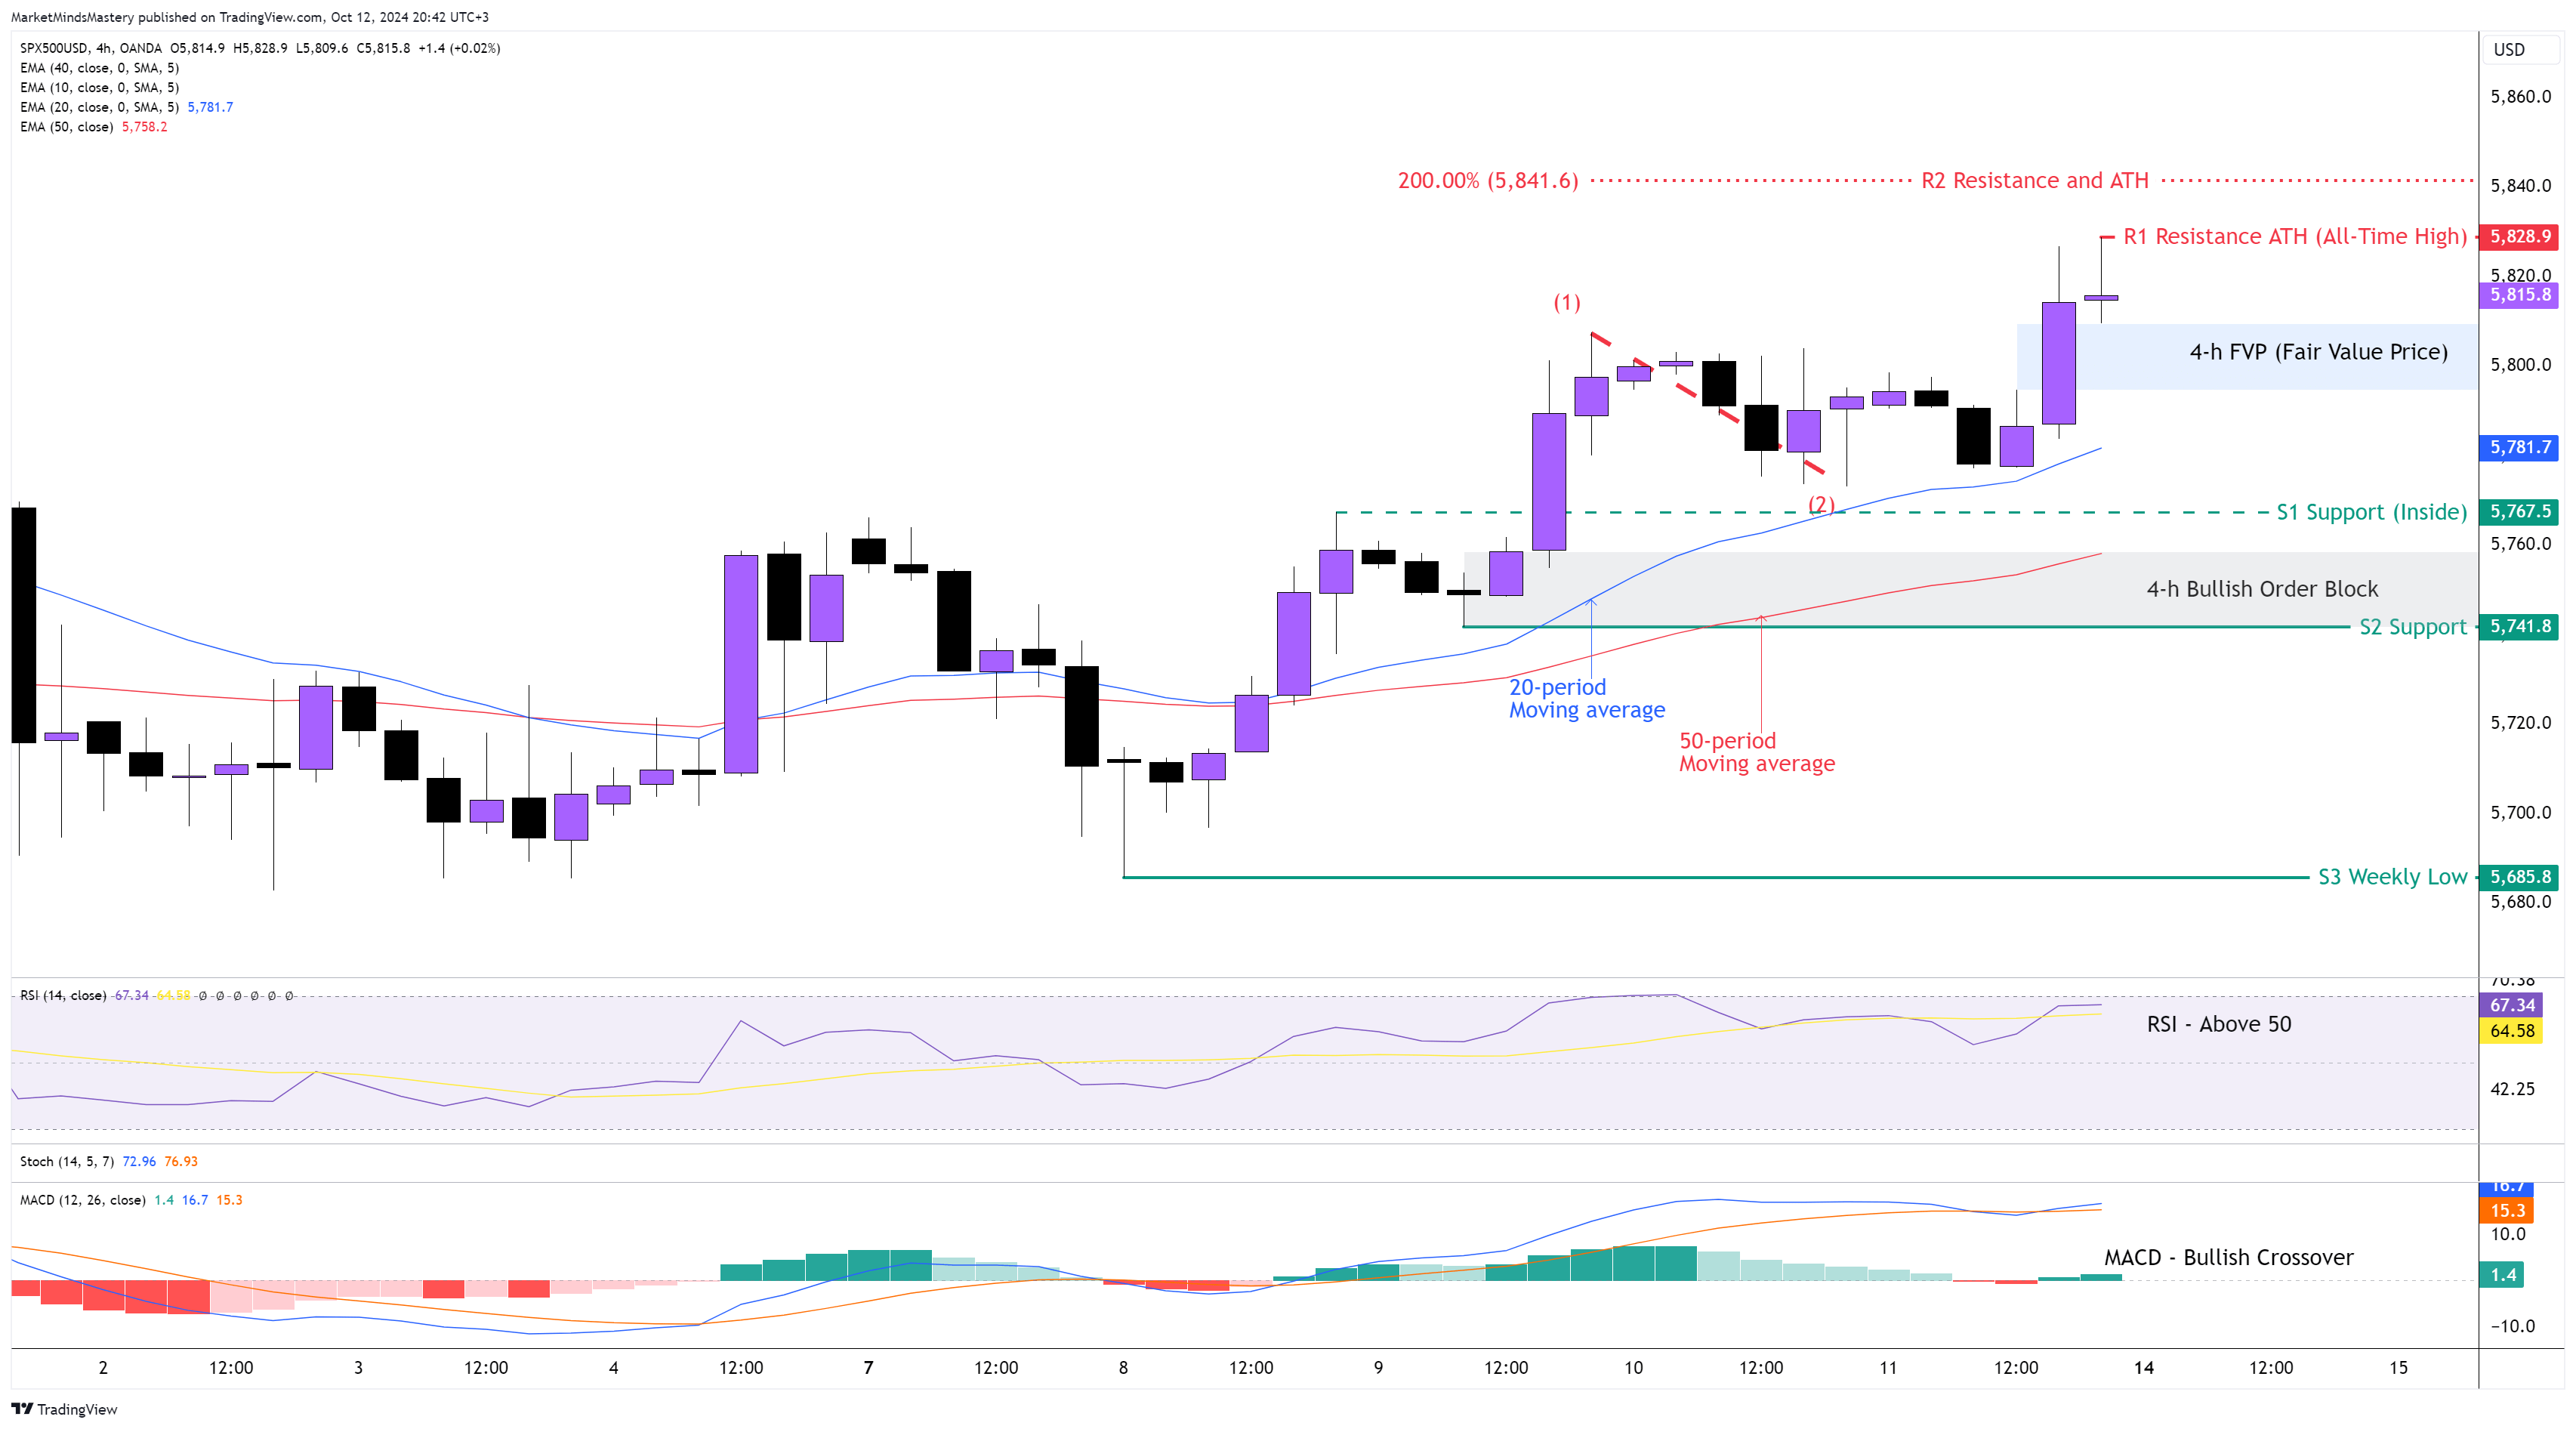
SP 500 4H
Last week, the price created a new ATH (All-time High) around $5830, which was the 200% Fibonacci Extension we pointed out in the previous week’s Market Analysis. That caused the MACD Line (Blue) to cross above the Signal Line (Orange) of the MACD indicator, which indicates bullishness. Simultaneously, the RSI Oscillator remained above its middle line of 50, which also has bullish implications. Currently, the price is above the 20-period moving average, which is also bullish. Last Wednesday, the price created a Bullish Order Block of around $5750 and last Friday, it created an FVP (Fair Value Price) of around $5800.
Starting Monday, if the price keeps moving upwards, the first resistance area will be around $5828, which is the ATH price and also the previous week’s high. If the price penetrates R1 and keeps moving upwards, the next resistance area, R2, will be at $5841. This is the 200% Fibonacci level measuring the swing from point (1) to point (2).
On the other hand, if the price is rejected and moves downward, the first support area, S1, will be an Inside support around $5767. In case the price penetrates the S1 and keeps lowering, the next support area, S2, will be at $5741. If the price surpasses the S2 and keeps moving downwards, the next support area, S3, will be the previous week’s low, around $5685.
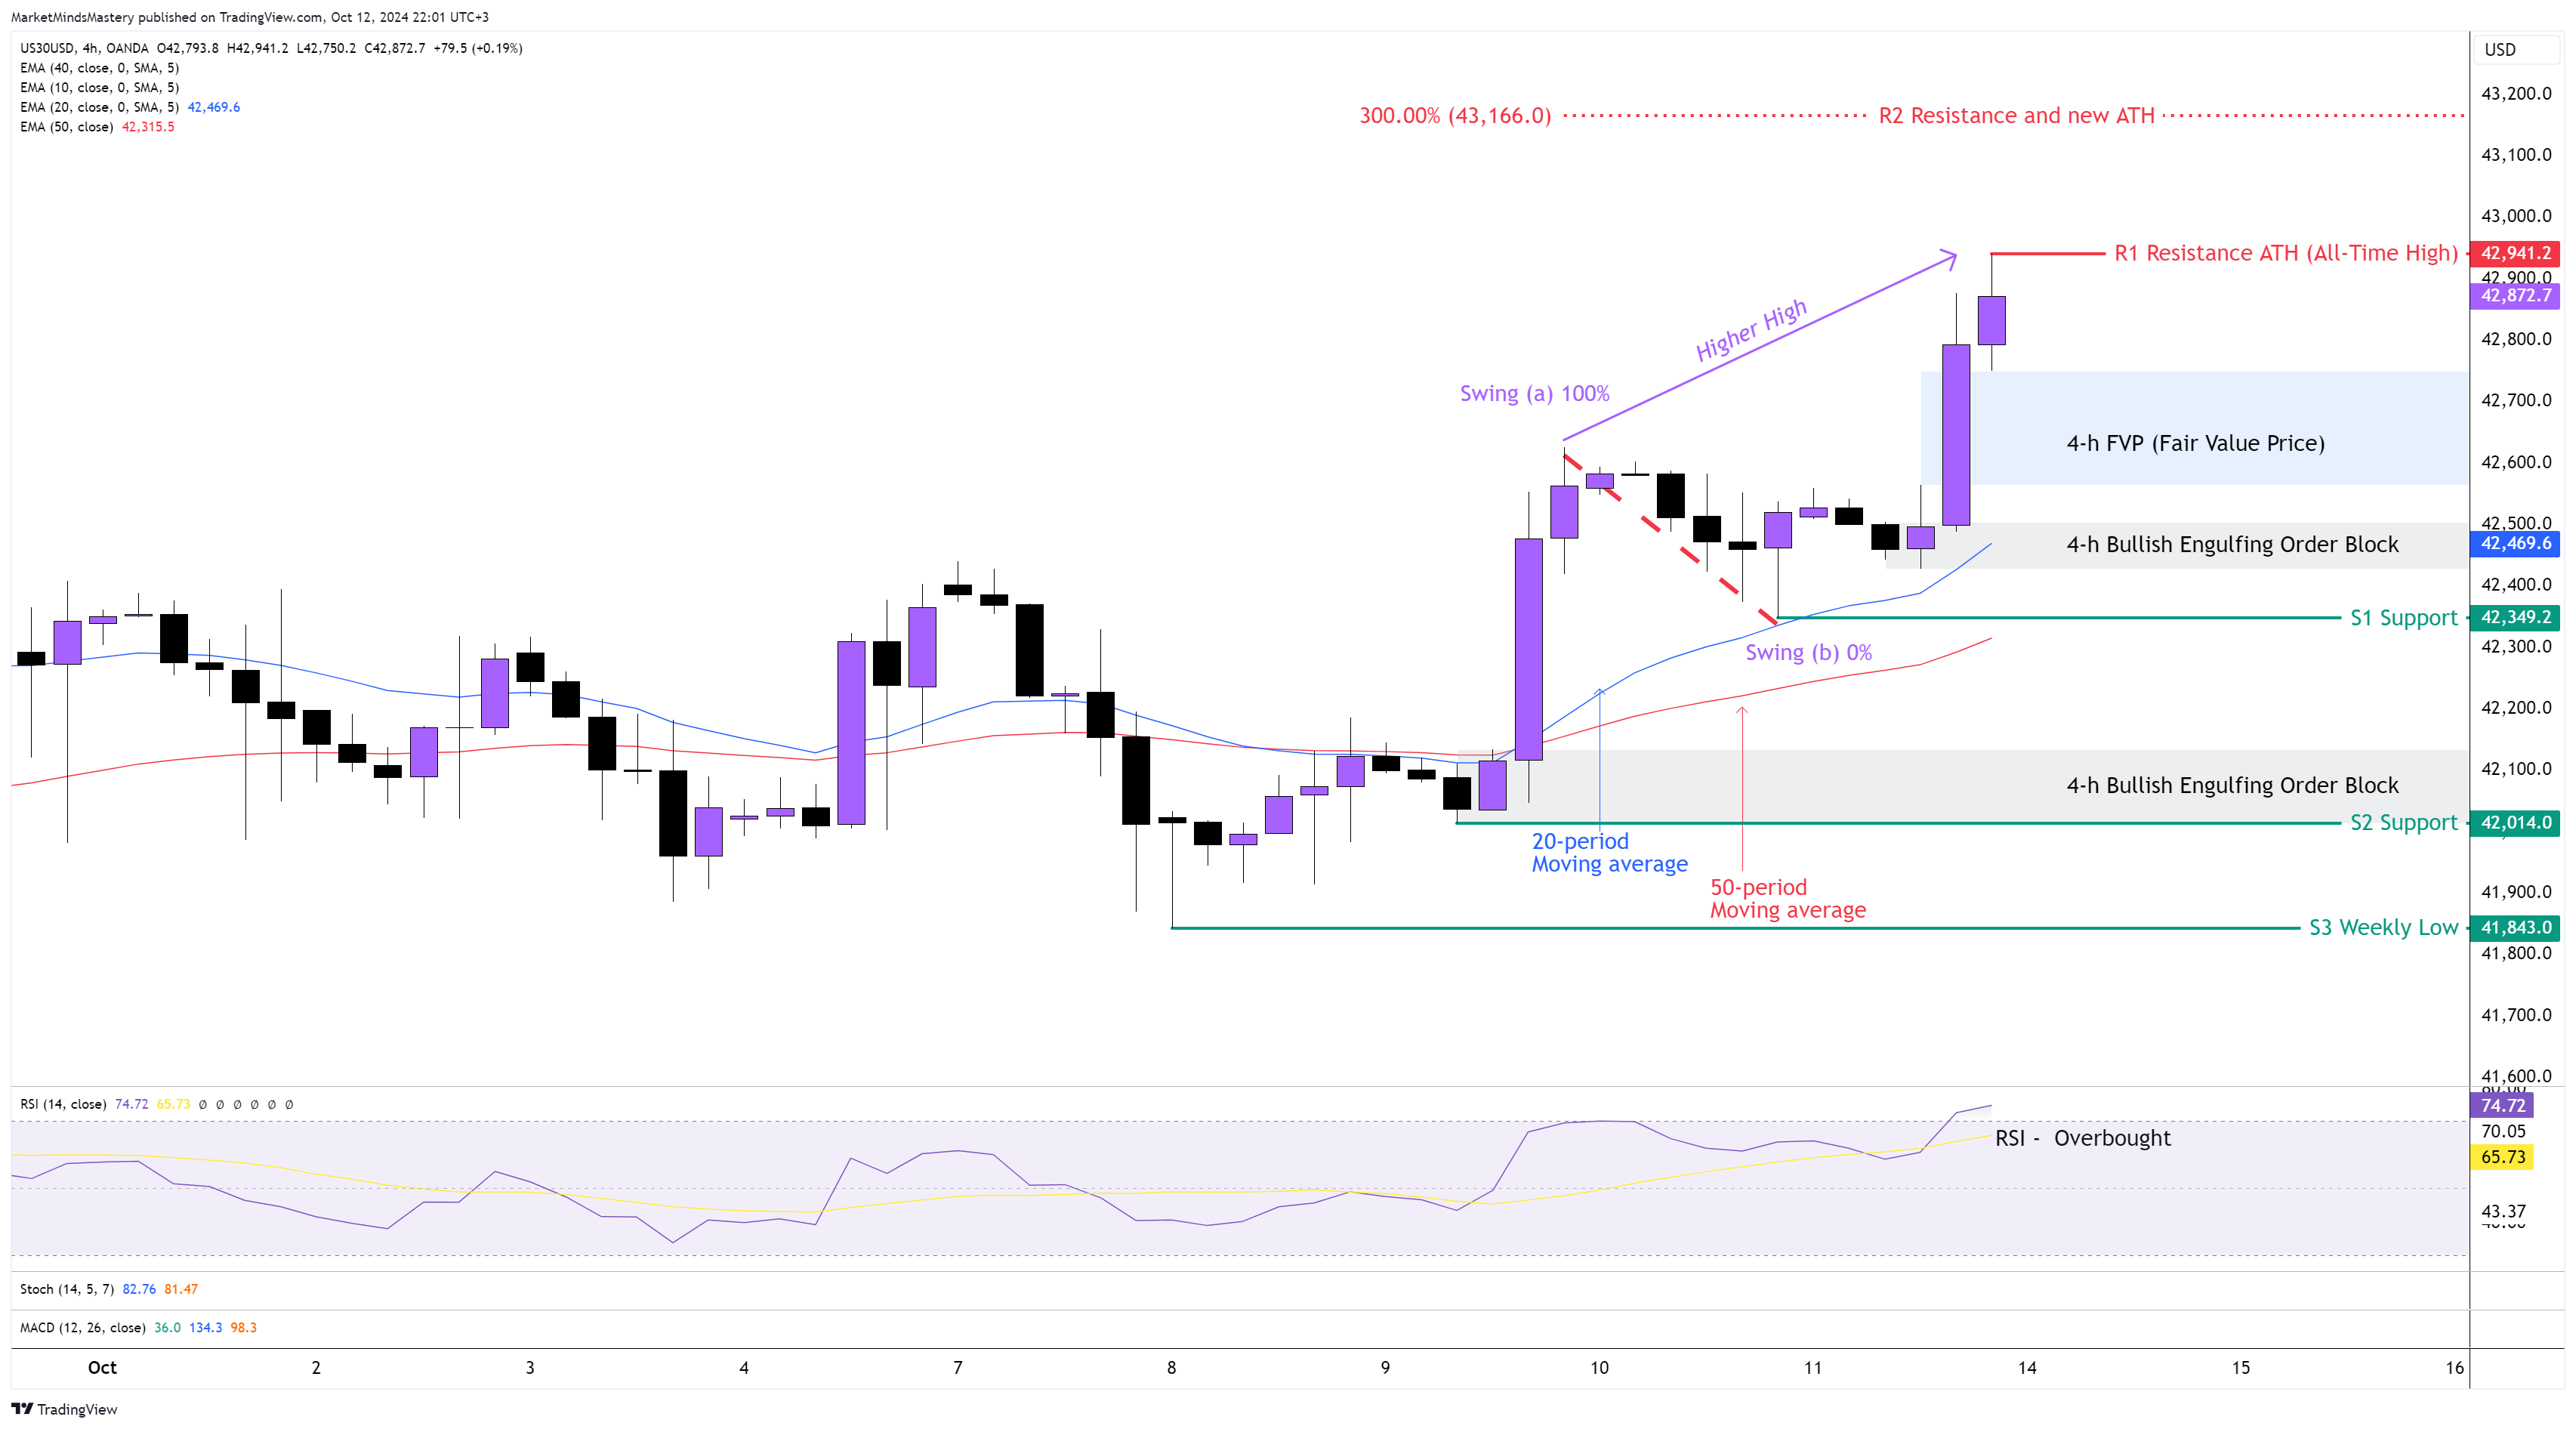
US 30, 4H
The momentum built up in the US30 last week was evident, and the volatility last Wednesday and last Friday was noticeable during the New York Trading Session. The price action on the weekly chart ended as a Bullish Engulfing, and the price created a new ATH (All-time High). Therefore, the RSI Oscillator entered into its Overbought condition, which has bullish implications. The 20-period is above the 50-period moving average, and this is also bullish. Last Friday, the price created a new higher high formation and also, around $42600, it created an FVP (Fair Value Price), which hasn’t been mitigated yet. Starting Monday, if the price is rejected and moves downwards, the first support area, S1, will be around $42349. Slidly above the S1, last Friday, the price created a Bullish Engulfing Order Block, which can become an additional support factor for the price. If the price penetrates the S1 and keeps moving downwards, the next support area, S2, will be around $42000. This is a key level of support as it coexists with a 4-hour Bullish Engulfing Order Block, which was created last Wednesday. In case the price penetrates the S2 and keeps lowering, the next support area, S3, will be at $41843, which is the previous week’s low.
On the contrary, if the price continues moving upwards, the first resistance area, R1, will be at $42941, which is the ATH. If the price penetrates the R1 and keeps moving upwards, the next resistance area, R2, will be around $43166. This is the 300% Fibonacci level measuring the swing from point (a) to point (b).
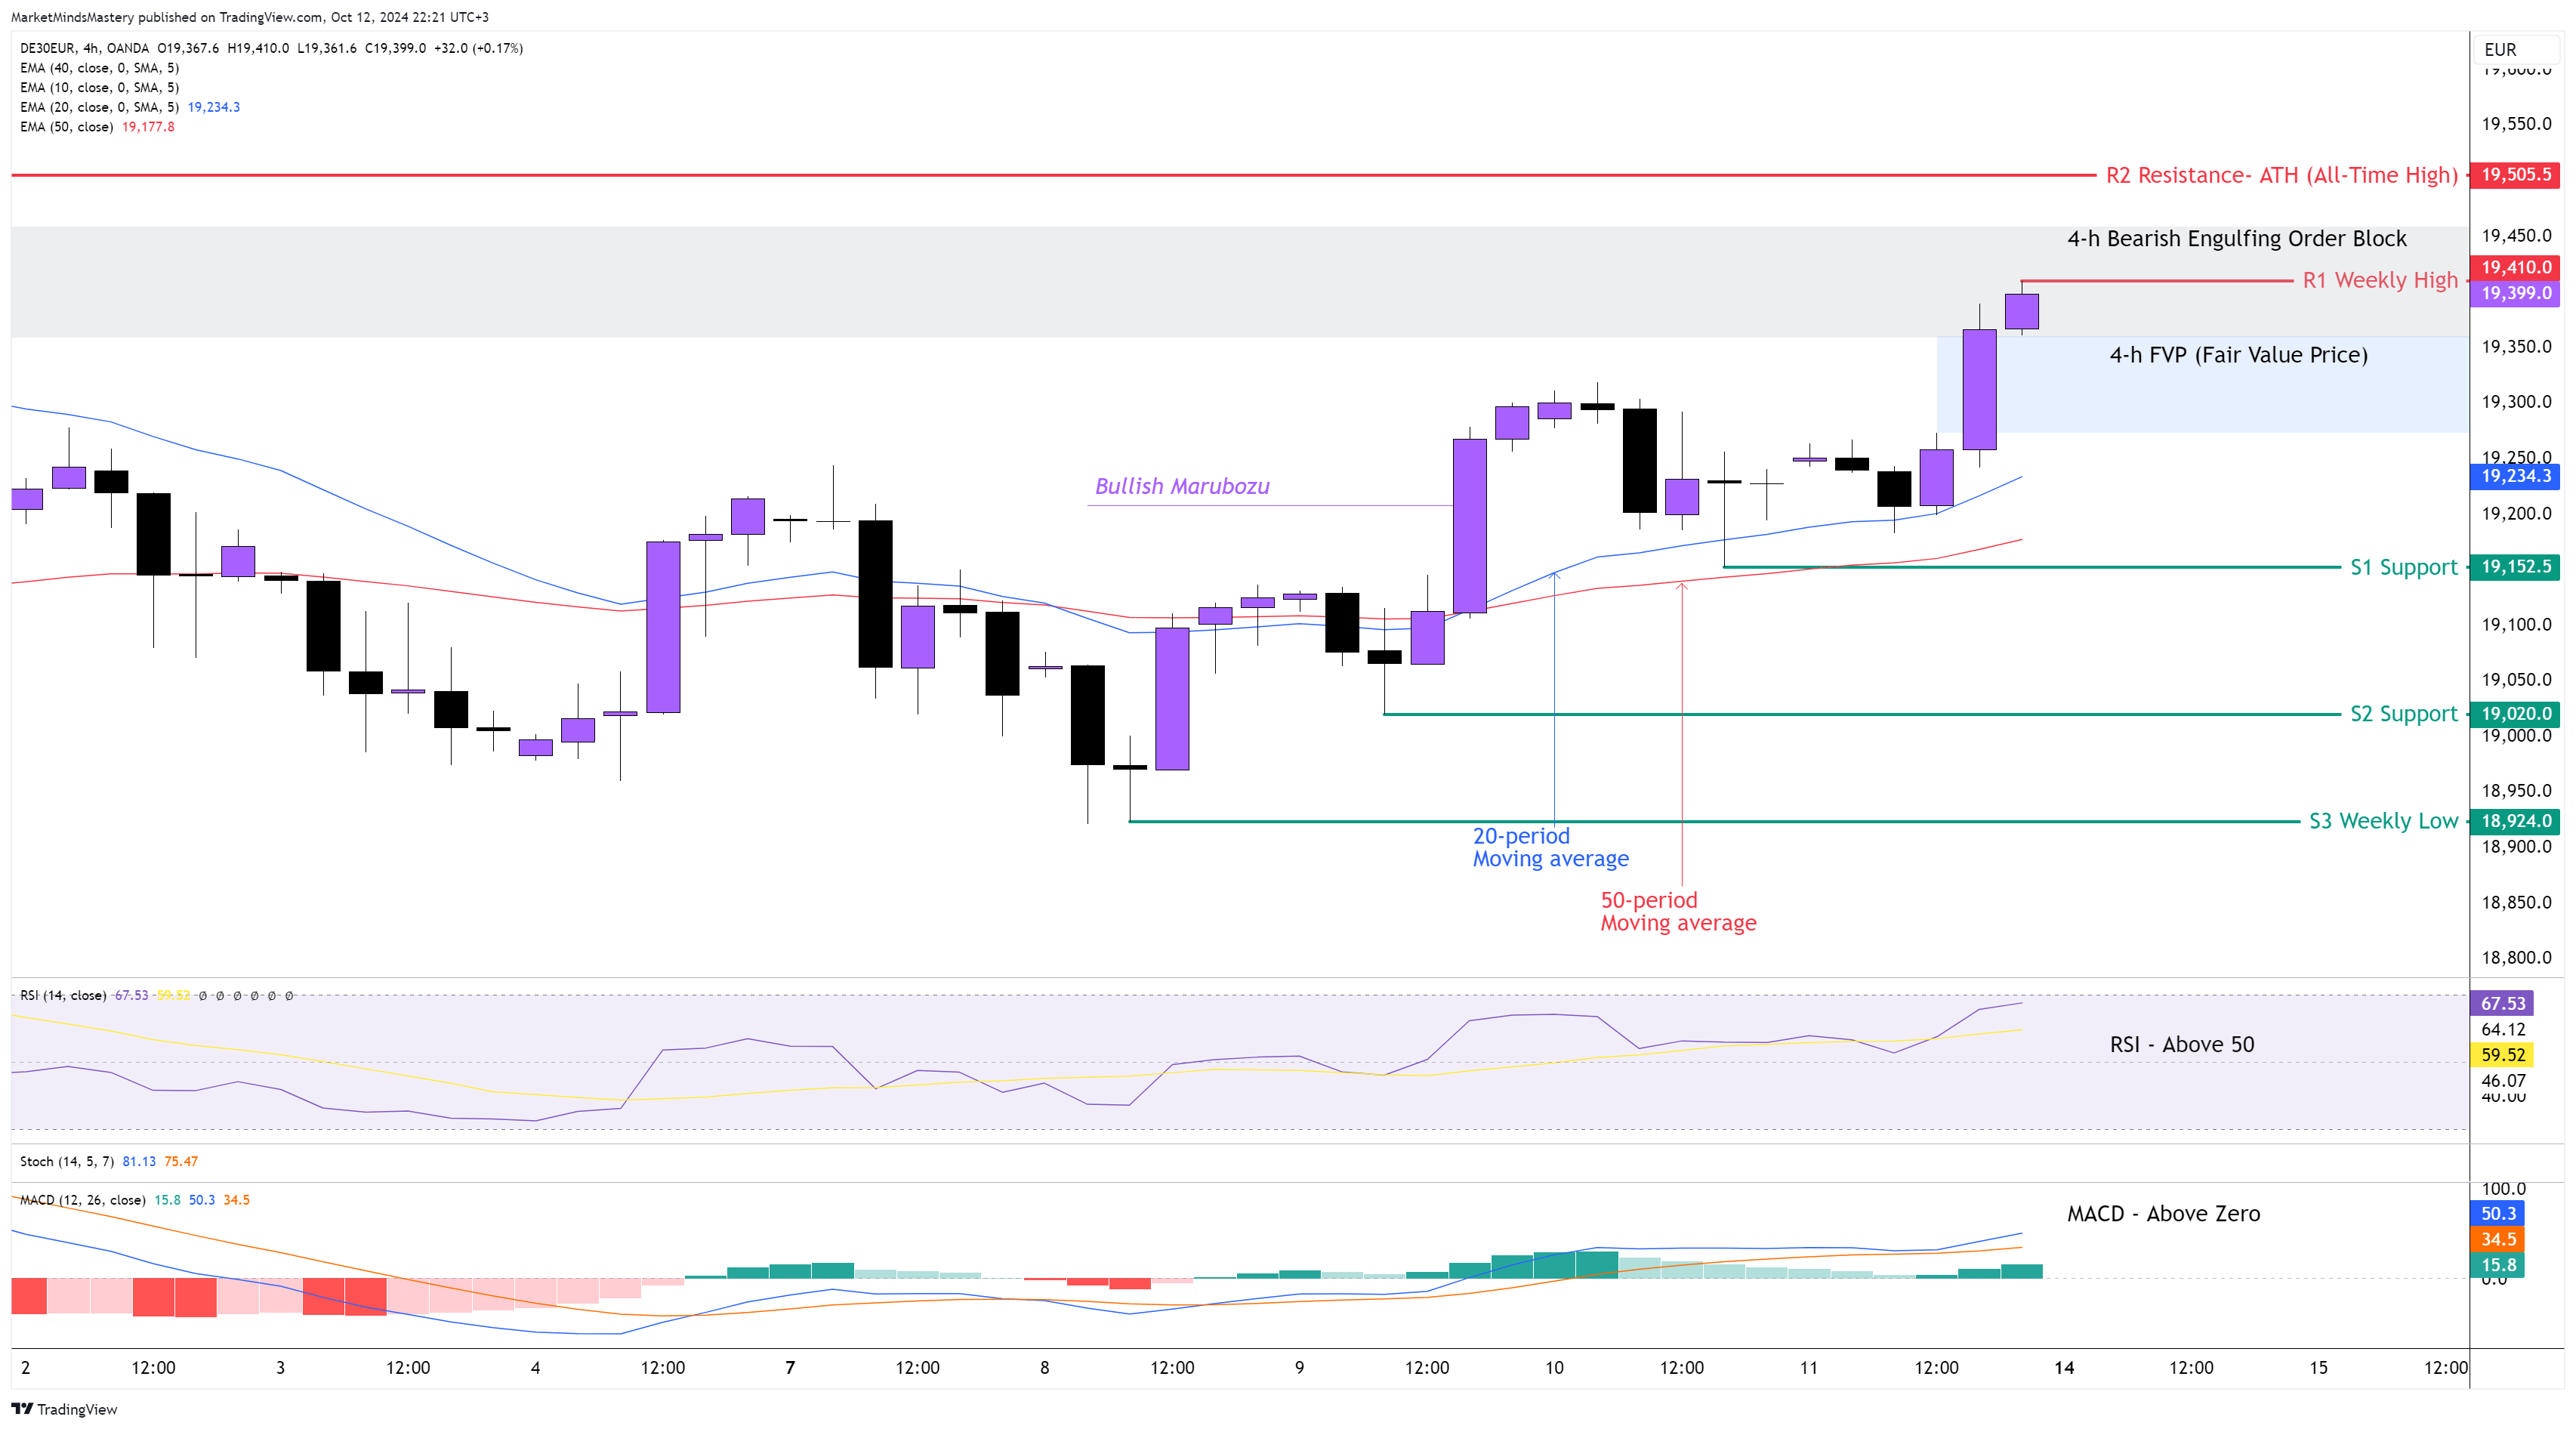
GER 30, 4H
Last week, the European indices successfully tested all the price levels we mentioned in the previous week’s Market Outlook. Last Thursday, the price created a higher high formation around 19300 with a Bullish Marubozu candlestick pattern. That bullish momentum held until the end of last week, creating a Bullish candle with a Long Lower Wick on the weekly chart. On the 4-hour chart, the 20-period is above the 50-period moving average, which has bullish implications. The RSI is above its middle line of 50, and this is bullish. The MACD is above the zero line, and this has bullish implications. The MACD’s Histogram is rising, indicating the price is moving upwards. Currently, the price is above the 20-period moving average, and it is within the Bearish Engulfing Order Block area of around 19400. Therefore, if the price is rejected from this area and moves downwards, the first support area, S1, will be around 19152. In case the price penetrates the S1 and keeps moving downwards, the next support area, S2, will be approximately 19020. If the price surpasses the S2 and keeps lowering, the next support area, S3, will be at 18924, which is the previous week’s low.
Conversely, if the price maintains its upward momentum and keeps moving upwards, the first resistance area, R1, will be around 19410, which is the previous week’s high. If the price penetrates the R1 and keeps moving upwards, the next resistance area, R2, will be the ATH (All-time High) at 19505.