Although last week started with a weak US Dollar, by the end of the week, the situation had changed, and the US Dollar had become the dominant force in the major currency pairs. In the UK, the CPI (Consumer Price Index) remained at 3.5,% and the Unemployment rate remained at 4.4%. The most noticeable decline occurred in the AUDUSD currency pair once the Unemployment Rate in Australia increased to 4.1%. The ECB (European Central Bank) kept the Interest Rates the same at 4.24%, but the EURUSD decline was not at the same fast pace as the AUDUSD, nor the GBPUSD as it didn’t change the market structure as we'll see later on the charts.
Starting Monday, the only significant new event will be Retail Sales in Germany. The last Retail Sales report was -0.2%, and based on the forecast, this time, it is expected to increase to 0%. If the actual confirms the forecast and a positive number report, the markets are expected to favour the Euro. As there won't be any other significant news events today, the volatility throughout the trading hours is likely to be kept low.
On Tuesday, the markets are expected to trade as usual under normal volatility, as there will be no major news events during the Asian and London Trading Sessions. In these cases, the volatility is usually more intense during the overlapping trading sessions. The market participants will be waiting for the New York trading session, as in the US, they will report the Annual Total Existing Home Sales. The forecast shows a drop from 4.11 Million to 4 Million. If the actual report confirms the forecast, it means the consumers bought fewer houses this year compared to last year’s sales, and this is considered bearish (negative) for the US Dollar.
On the other hand, the Existing Home Sales Report for June (this is the monthly, not the annual) is estimated to report at -2.7%, which is much lower than the month before when it was -0.7%. This is a drop of 2%. This can also be negative for the US Dollar.
It's the middle of the week, and the market is expected to get busier from Wednesday onwards. Starting from the Asian trading session in Australia and Japan, the Manufacturing PMI, which is currently at 47.5 and 50, respectively, and the Services PMI, which is currency at 51 and 50, respectively and the composite PMI, which is currently at 50.6 in Australia and 49.7 in Japan, will be reported early morning. Usually, a number above 50 is considered favourable for the Australian Dollar and the Japanese Yen. Although these events are less likely to create any significant shift in the market momentum, they usually affect the market’s volatility during their announcement. Moving into the London trading session, the same events will be reported in Germany, and the Composite PMI, which is currently at 50, is expected to increase to 51.1, the Services PMI from 52.8 is expected to increase to 53, and the Manufacture PMI from 45.8 to increase to 46.1. Only thirty minutes later, the same three events, Composite, Manufacture and Services PMI, will be reported in the UK, and the forecast shows all three events to report above the benchmark 50. This can positively impact the Sterling, at least temporarily.
Despite these events, the markets will anticipate the BoC (Bank Of Canada) to report their Interest Rates. The current rates in Canada are 4.75%, and the forecast suggests that they will decrease by 4.5%. If the actual Interest Rates report is even less than the forecast, the Canadian dollar is expected to drop significantly. When the interest rates of any country are decreased, it is considered bearish for the currency as investors are not interested in keeping their money in the country and prefer to move it to other countries where they offer higher interest rates. As the primary trend on the USDCAD is upwards, a weak Canadian dollar can help the uptrend continue.
Next, in the US, they will report the Composite PMI, Manufacturing PMI, and Services PMI. All of them are currently above the benchmark 50, and they are expected to remain above it. As we explained earlier, these are not the most significant events they move the markets, but they have an “intraday impact”. The last event for the day will be the Total Annual New Home Sales in the US, and the forecast shows an increase of approximately 21K. This simply means that people in the US bought more new homes this year compared to the same month of the year before. Additionally, a significant improvement in the New Home Sales for June is expected as the forecast estimates an increase from -11.3% to 3.4%. If the actual reports confirm the forecast, the US Dollar is expected to be a dominant currency, at least during the New York trading session.
The first day of the G20 meetings will be on Thursday. This event is a two-day event.
Starting before the London trading session in Germany, the German IFO Business Climate Index is expected to increase by 0.4%, from 88.6 to 89. This is one of the leading indicators of the health of Germany’s economy. Next will be the Unemployment Claims in the US. The forest estimates a drop from 243K to 239 K. This will be an early indication of the unemployment rate and employment change, the two significant events next week. At the same time, in the US, the Durable Goods Order is expected to increase from 0.1% to 0.5%, and the GDP (Gross Domestic Products) from 1.4% to 1.9%. As all these three events will be reported at the same time, and if all, based on the given forecast, are reported as positive, it means the US Dollar will get strengthened, and it has a high probability of a strong US Dollar during the New York trading session. Events like these usually attract enormous attention from traders. If the US Dollar follows through with a positive news outcome, it is very likely to see declines in the EURSUD, GBPUSD and AUDUSD.
This trading week will end with Friday's significant news events. Starting from the Asian Trading Session, the CPI (Consumer Price Index) will be reported in Japan. The expectation is that the CPI will increase from 2.1% to 2.2%. Considering the latest strength of the Japanese Yen, as we see on the Price charts, if the JPY strengthen, a robust downward move on the JPYCAD is likely to be seen. As we explained earlier, if the BoC reduce the Interest Rates, it will be a good enough reason for some short-term weakness in the Loonie (Canadian dollar). The last significant event, not only for the day but also for the week, will be the Core PCE (Core Personal Consumption Expenditures) in the US. The forecast estimates an increase from 0.1% to 0.2%. Suppose the outcome confirms the forecast, and the market follows through at the same time. In that case, the strength of the US dollar can be the primary factor in the markets and the leading currency, considering that all the previous event’s actual outcomes will favour the USD.
EUR USD 4H

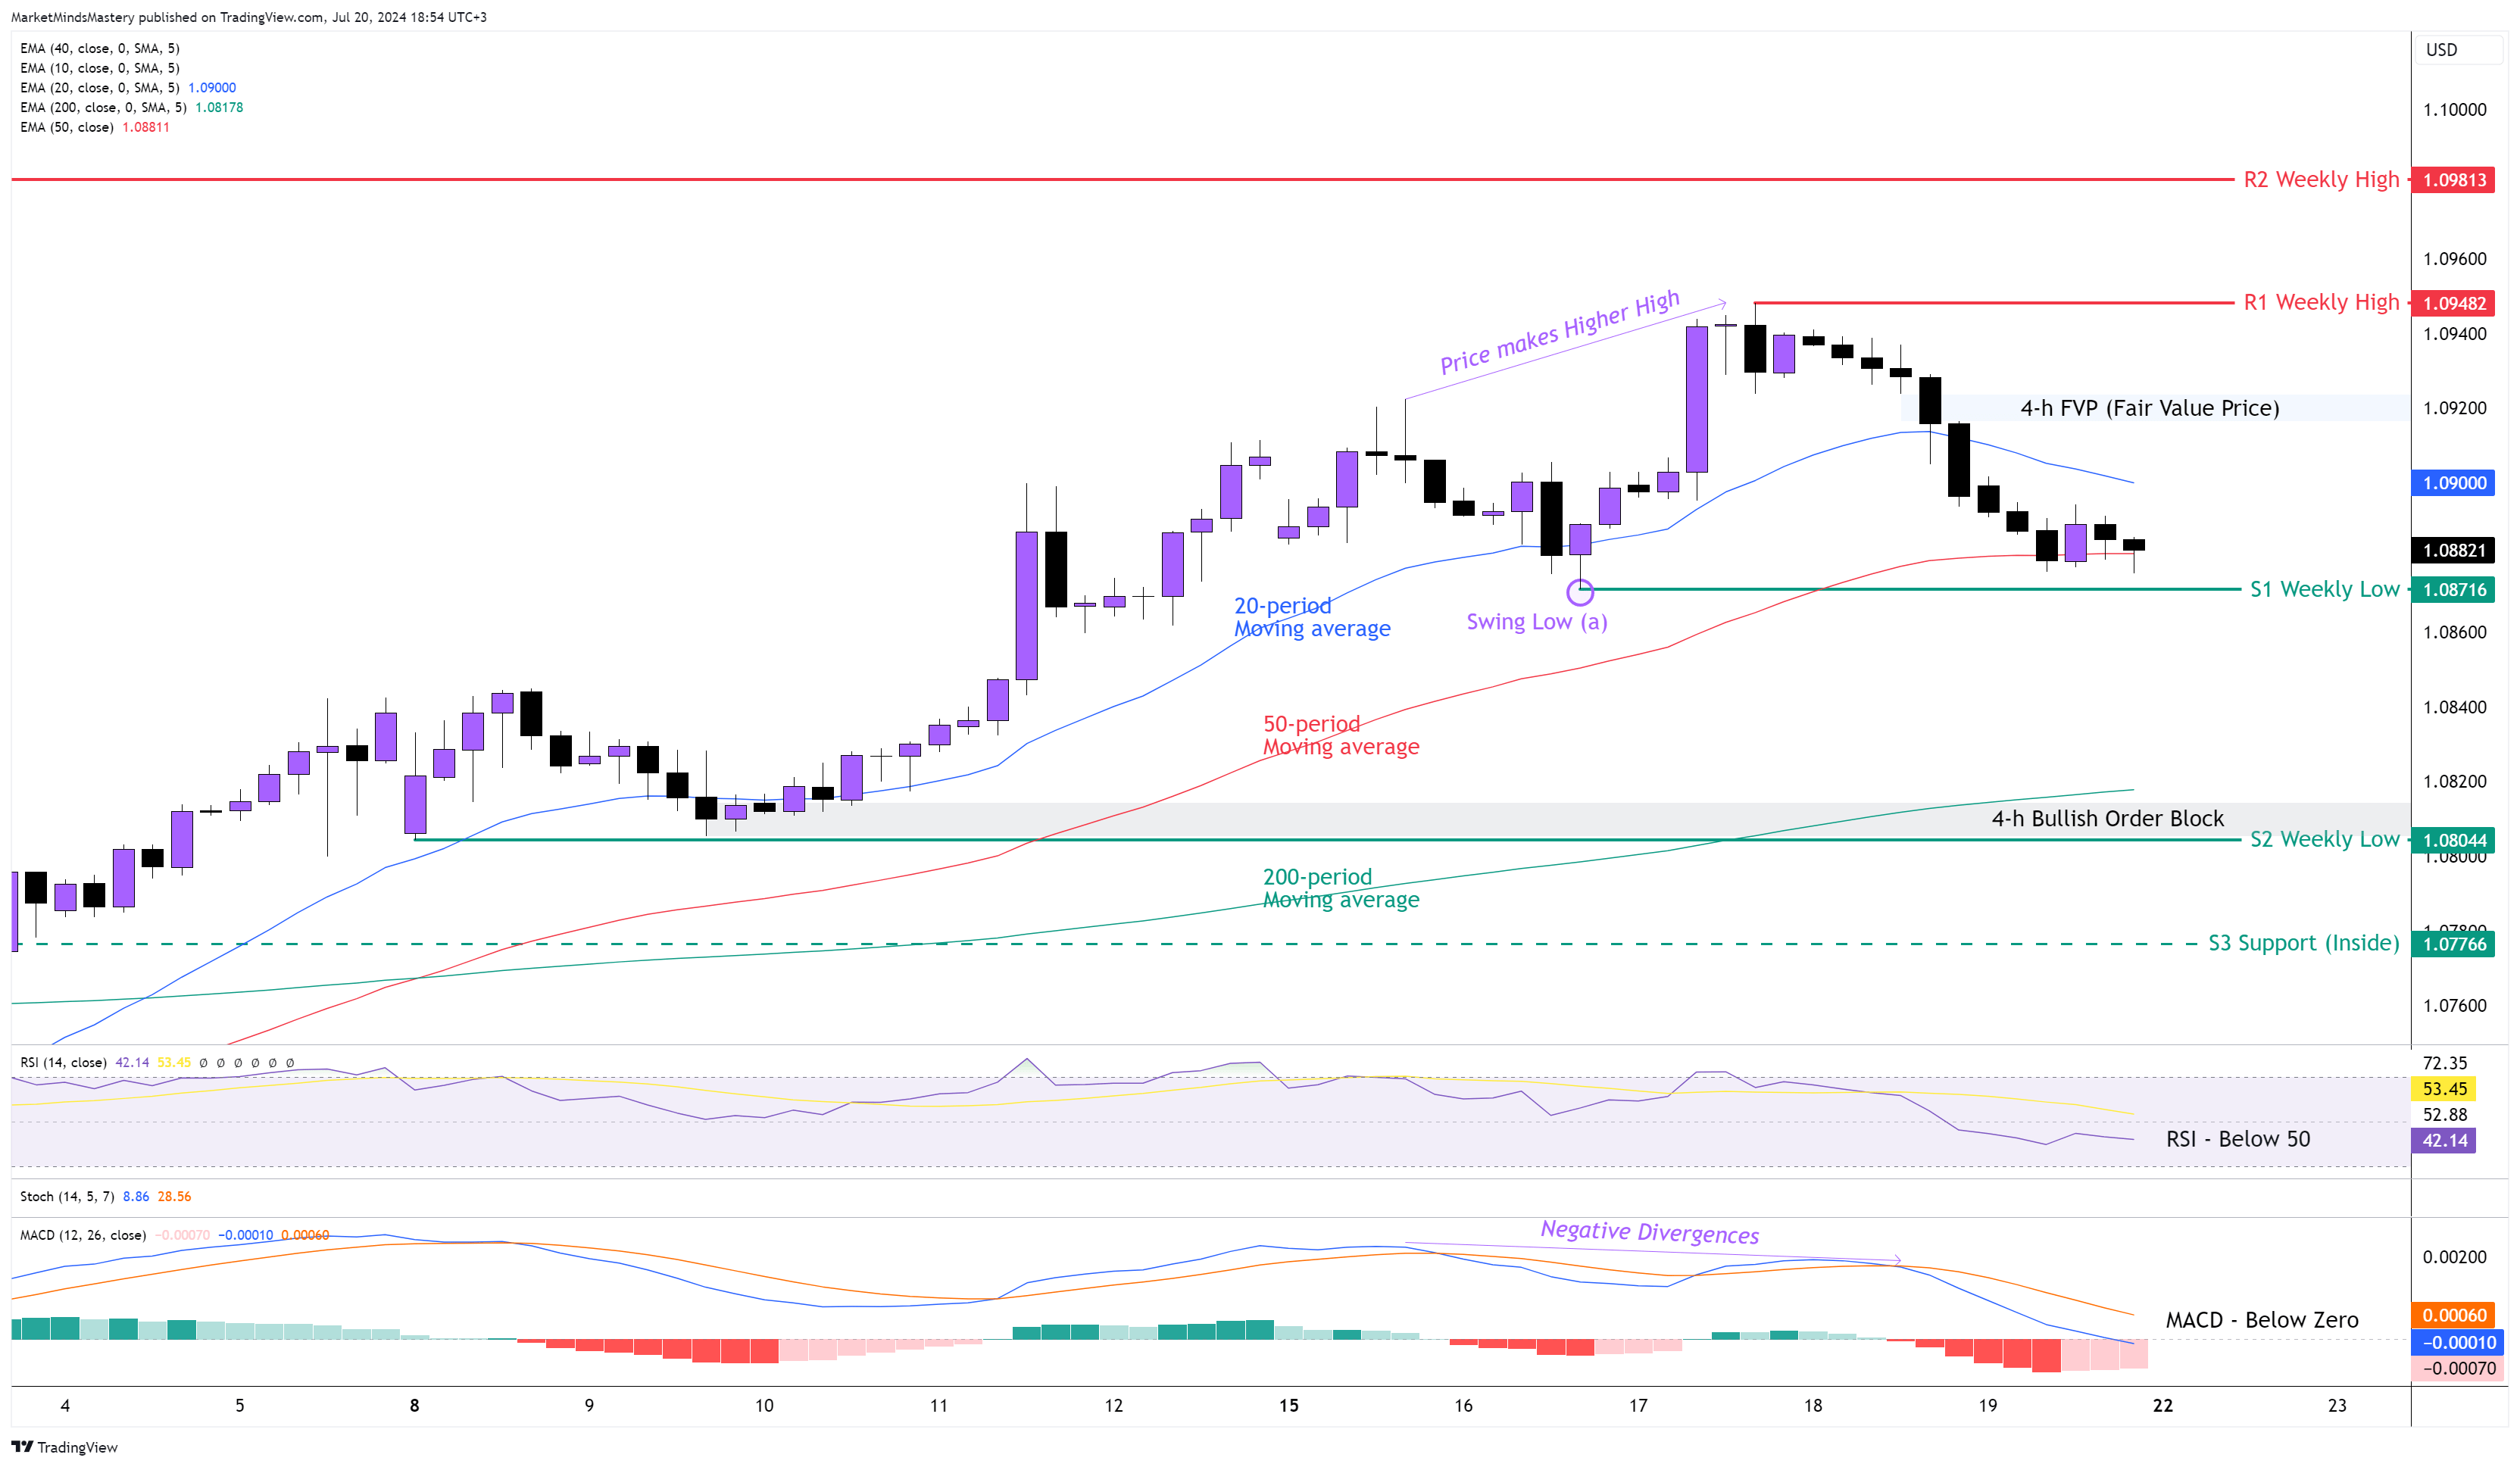
Following the previous market outlook, the price rejected the weekly resistance level and declined. The ECB decided to keep the interest rates unchanged at 4.25%, which helped the value of the EURUSD currency pair drop as the market participants and investors around the world interpreted this as a weakness for the Euro. Therefore, the weekly chart created a Bearish Gravestone Doji price action, and this has bearish implications. This means it can create a price correction, if not a reversal, to the currency pair. On the 4-hour chart, though, the price remains above the swing low at point (a), which means that the currency market structure of an uptrend is still valid. The 20-period is above the 50-period moving average, and this is bullish. Last Thursday, the price created an FVP (Fair Value Price) area after the IR report. The RSI is below 50, and this is bearish. The MACD didn’t follow the price Higher High formation, and instead, it created Negative Divergences A’ Class, which eventually set the price for a corrective phase. Currently, the MACD is below zero, and this has bearish implications.
Starting Monday, if the price penetrates the 50-period moving average, where it's actually resting now, the first support area, S1, will be the previous week’s low, around 1.08716. Although it is very close to the previous week’s candle close price, it is still a valid support area. In case the price breaks through the S1 and keeps moving downward, the next support area, S2, is approximately 650 points (65 pips) away, at 1.08044. This area formed a Bullish Order Block, which can act as additional support. Also, in this price level, the 200-period moving average can become a dynamic support level.
On the other hand, if the price moves upwards, the first resistance area, R1, will be the previous week’s high, approximately 1.09482. A further upward move will find the R2 resistance around 1.09813, which is an old weekly high.
GBP USD 4H
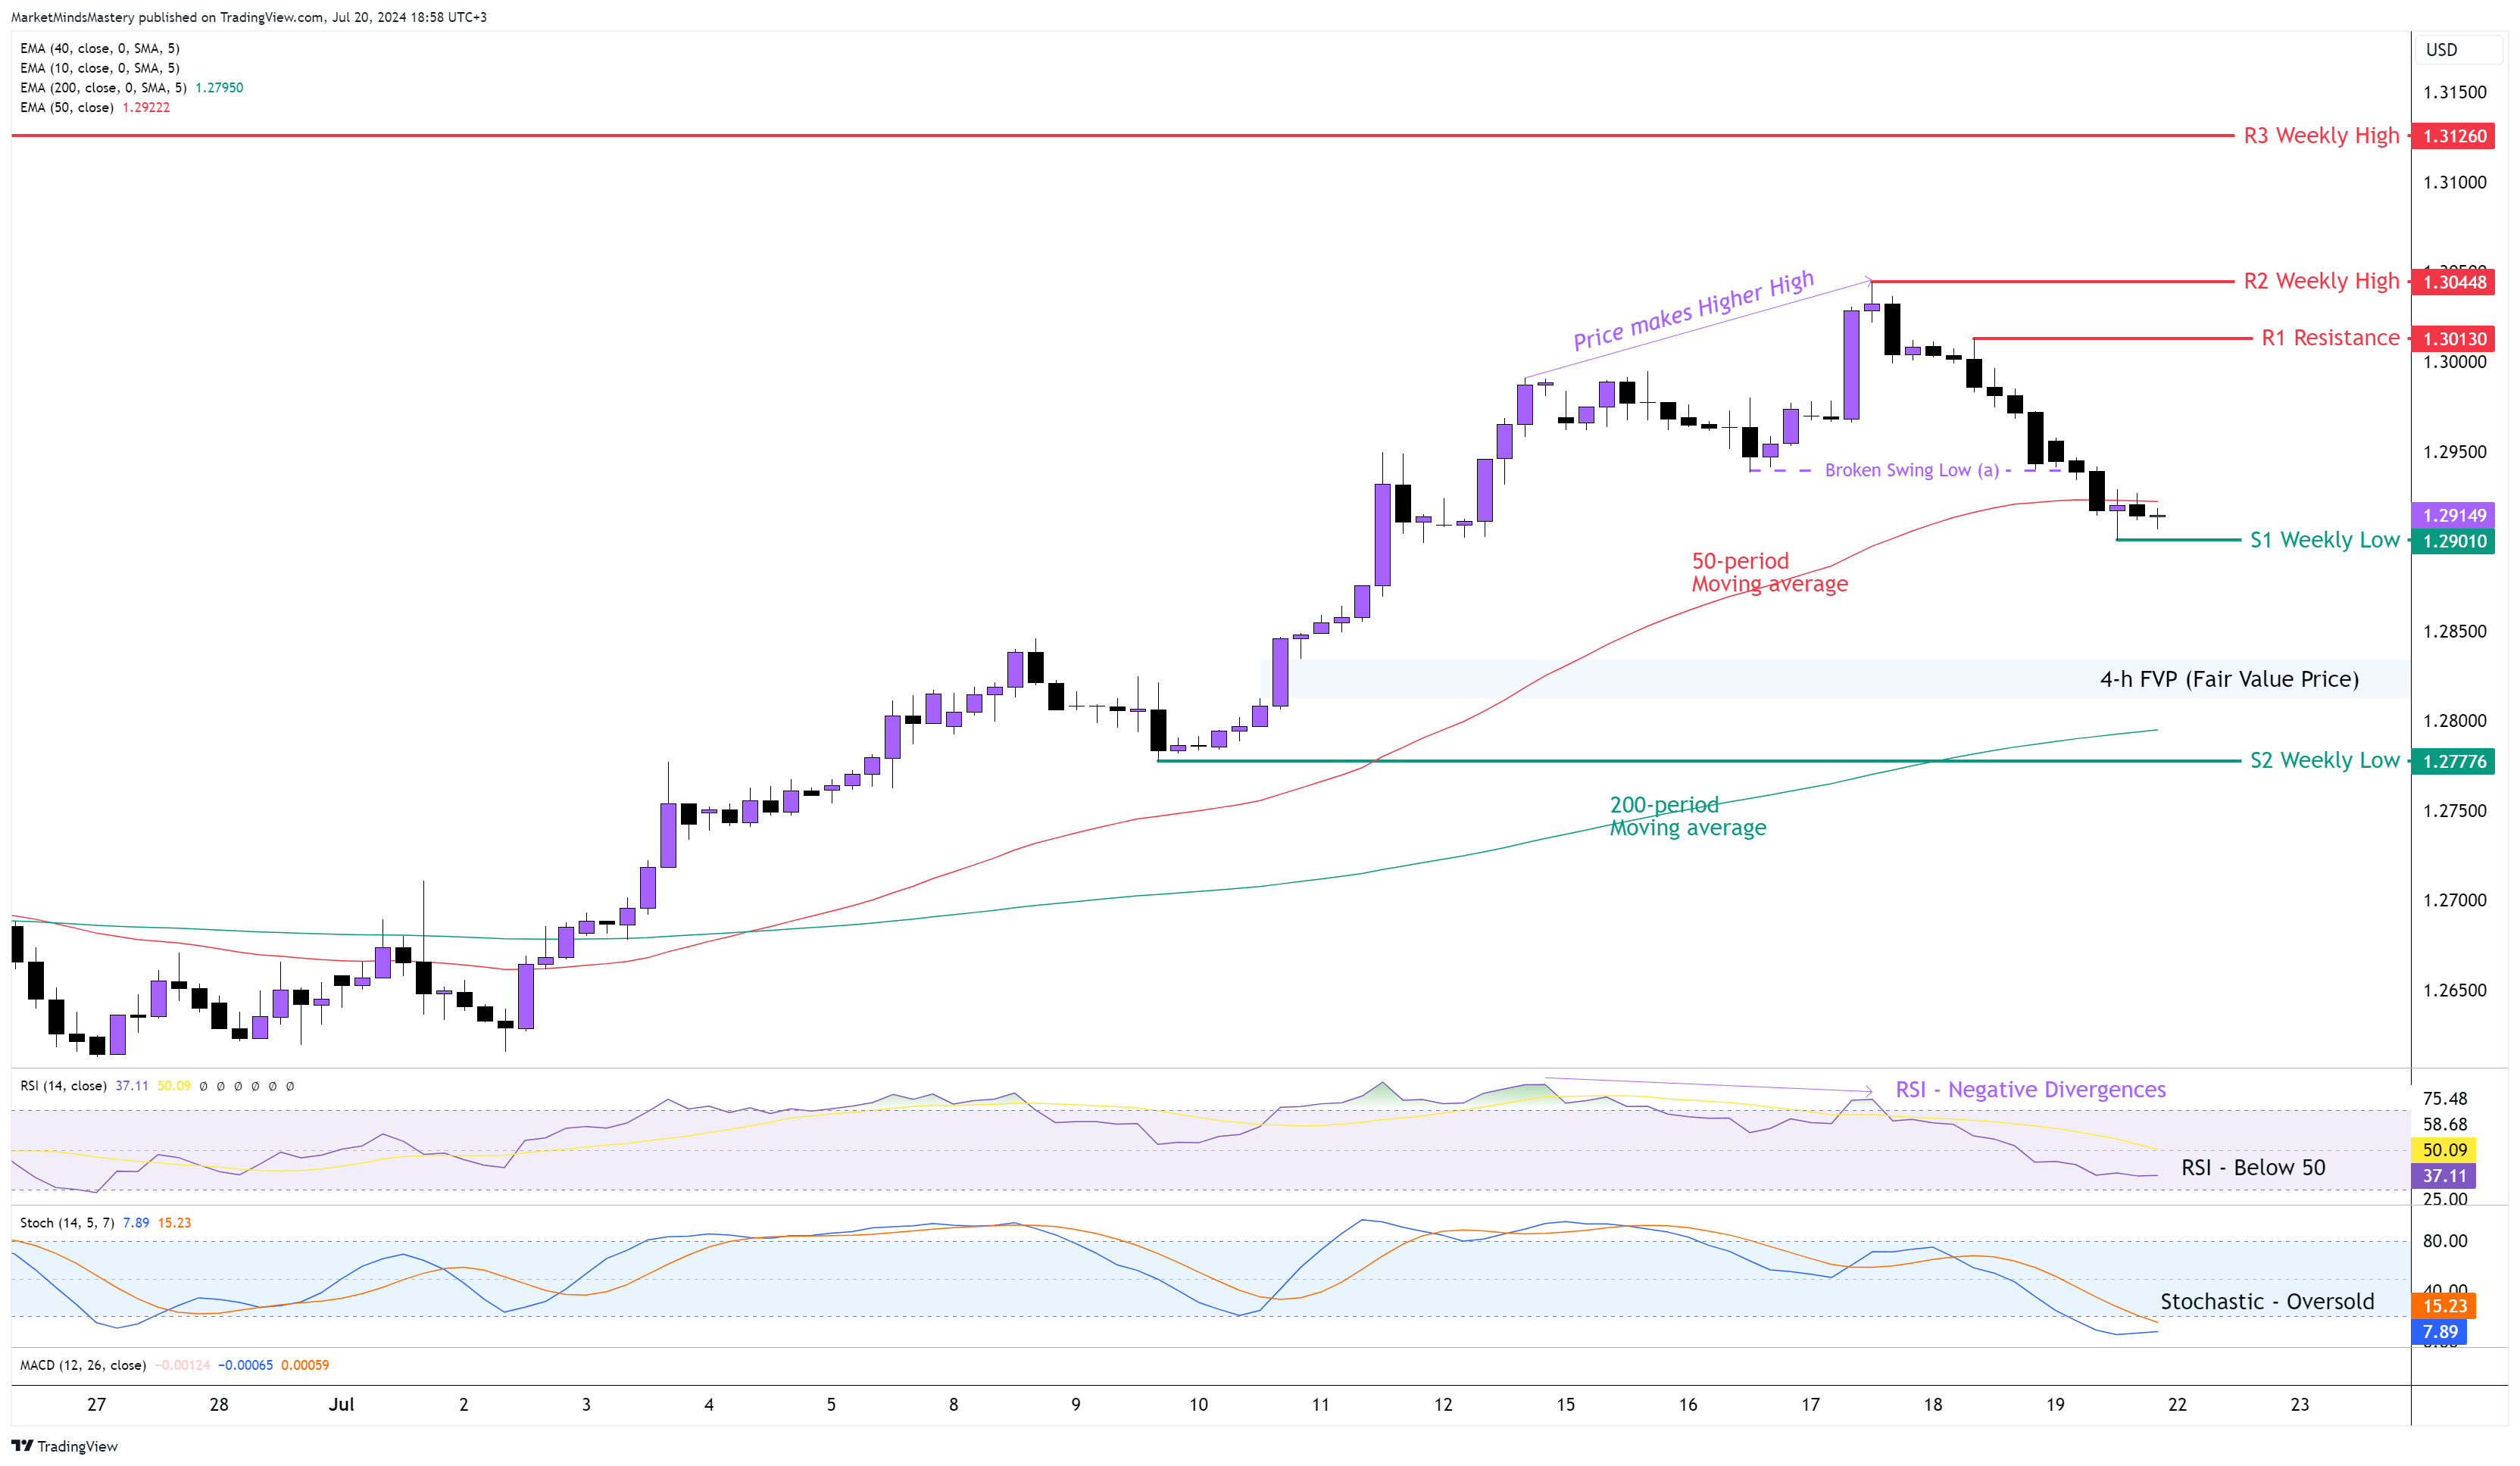
Last week, the trading activity ended with the price in the weekly chart created as a Shooting Star reversal candlestick pattern. As it is followed by two Bullish Marubozu candles on the weekly chart, this shooting starts Candlestick can have bearish implications, at least in the short term. On the 4-hour chart, the price made a higher high last Wednesday. Still, none of the OIscillators were able to confirm that upward momentum, and instead of making a new high, they created a lower high, which is the Negative Divergences A’ Class. Since then, the price
penetrated the swing low at point (a), ending the 4-hour uptrend. But, for a downtrend to develop, the price needs to make a lower high, not only a lower low. However, this doesn’t mean that the price can not resume the bullish uptrend in the higher time frame. This is the first time in two weeks that the price has closed below the 50-period moving average. However, the 50-period is above the 200-period, and this is bullish. The RSI is below 50, indicates the currency momentum is downward. The Stochastic Oscillator is in its Oversold condition, and this has bearish implications.
Starting Monday, if the price follows the weekly price action reversal and declines, the first support, S1, will be the previous week’s low, despite it being very close to the shooting star’s Friday close price. In case the price penetrates the S1 and keeps lowering, the price is likely to test the FVP (Fair Value Price). If it penetrates the FVP and keeps moving downwards, the next static support area, S2, will be another weekly low, around 1.27776. Conversely, if the price bounces off and moves upwards, the first resistance area, R1, will be around 1.30130. A further upward move will find the next resistance area, R2, which is the previous week’s high, approximately 1.30448.
AUD USD 4H
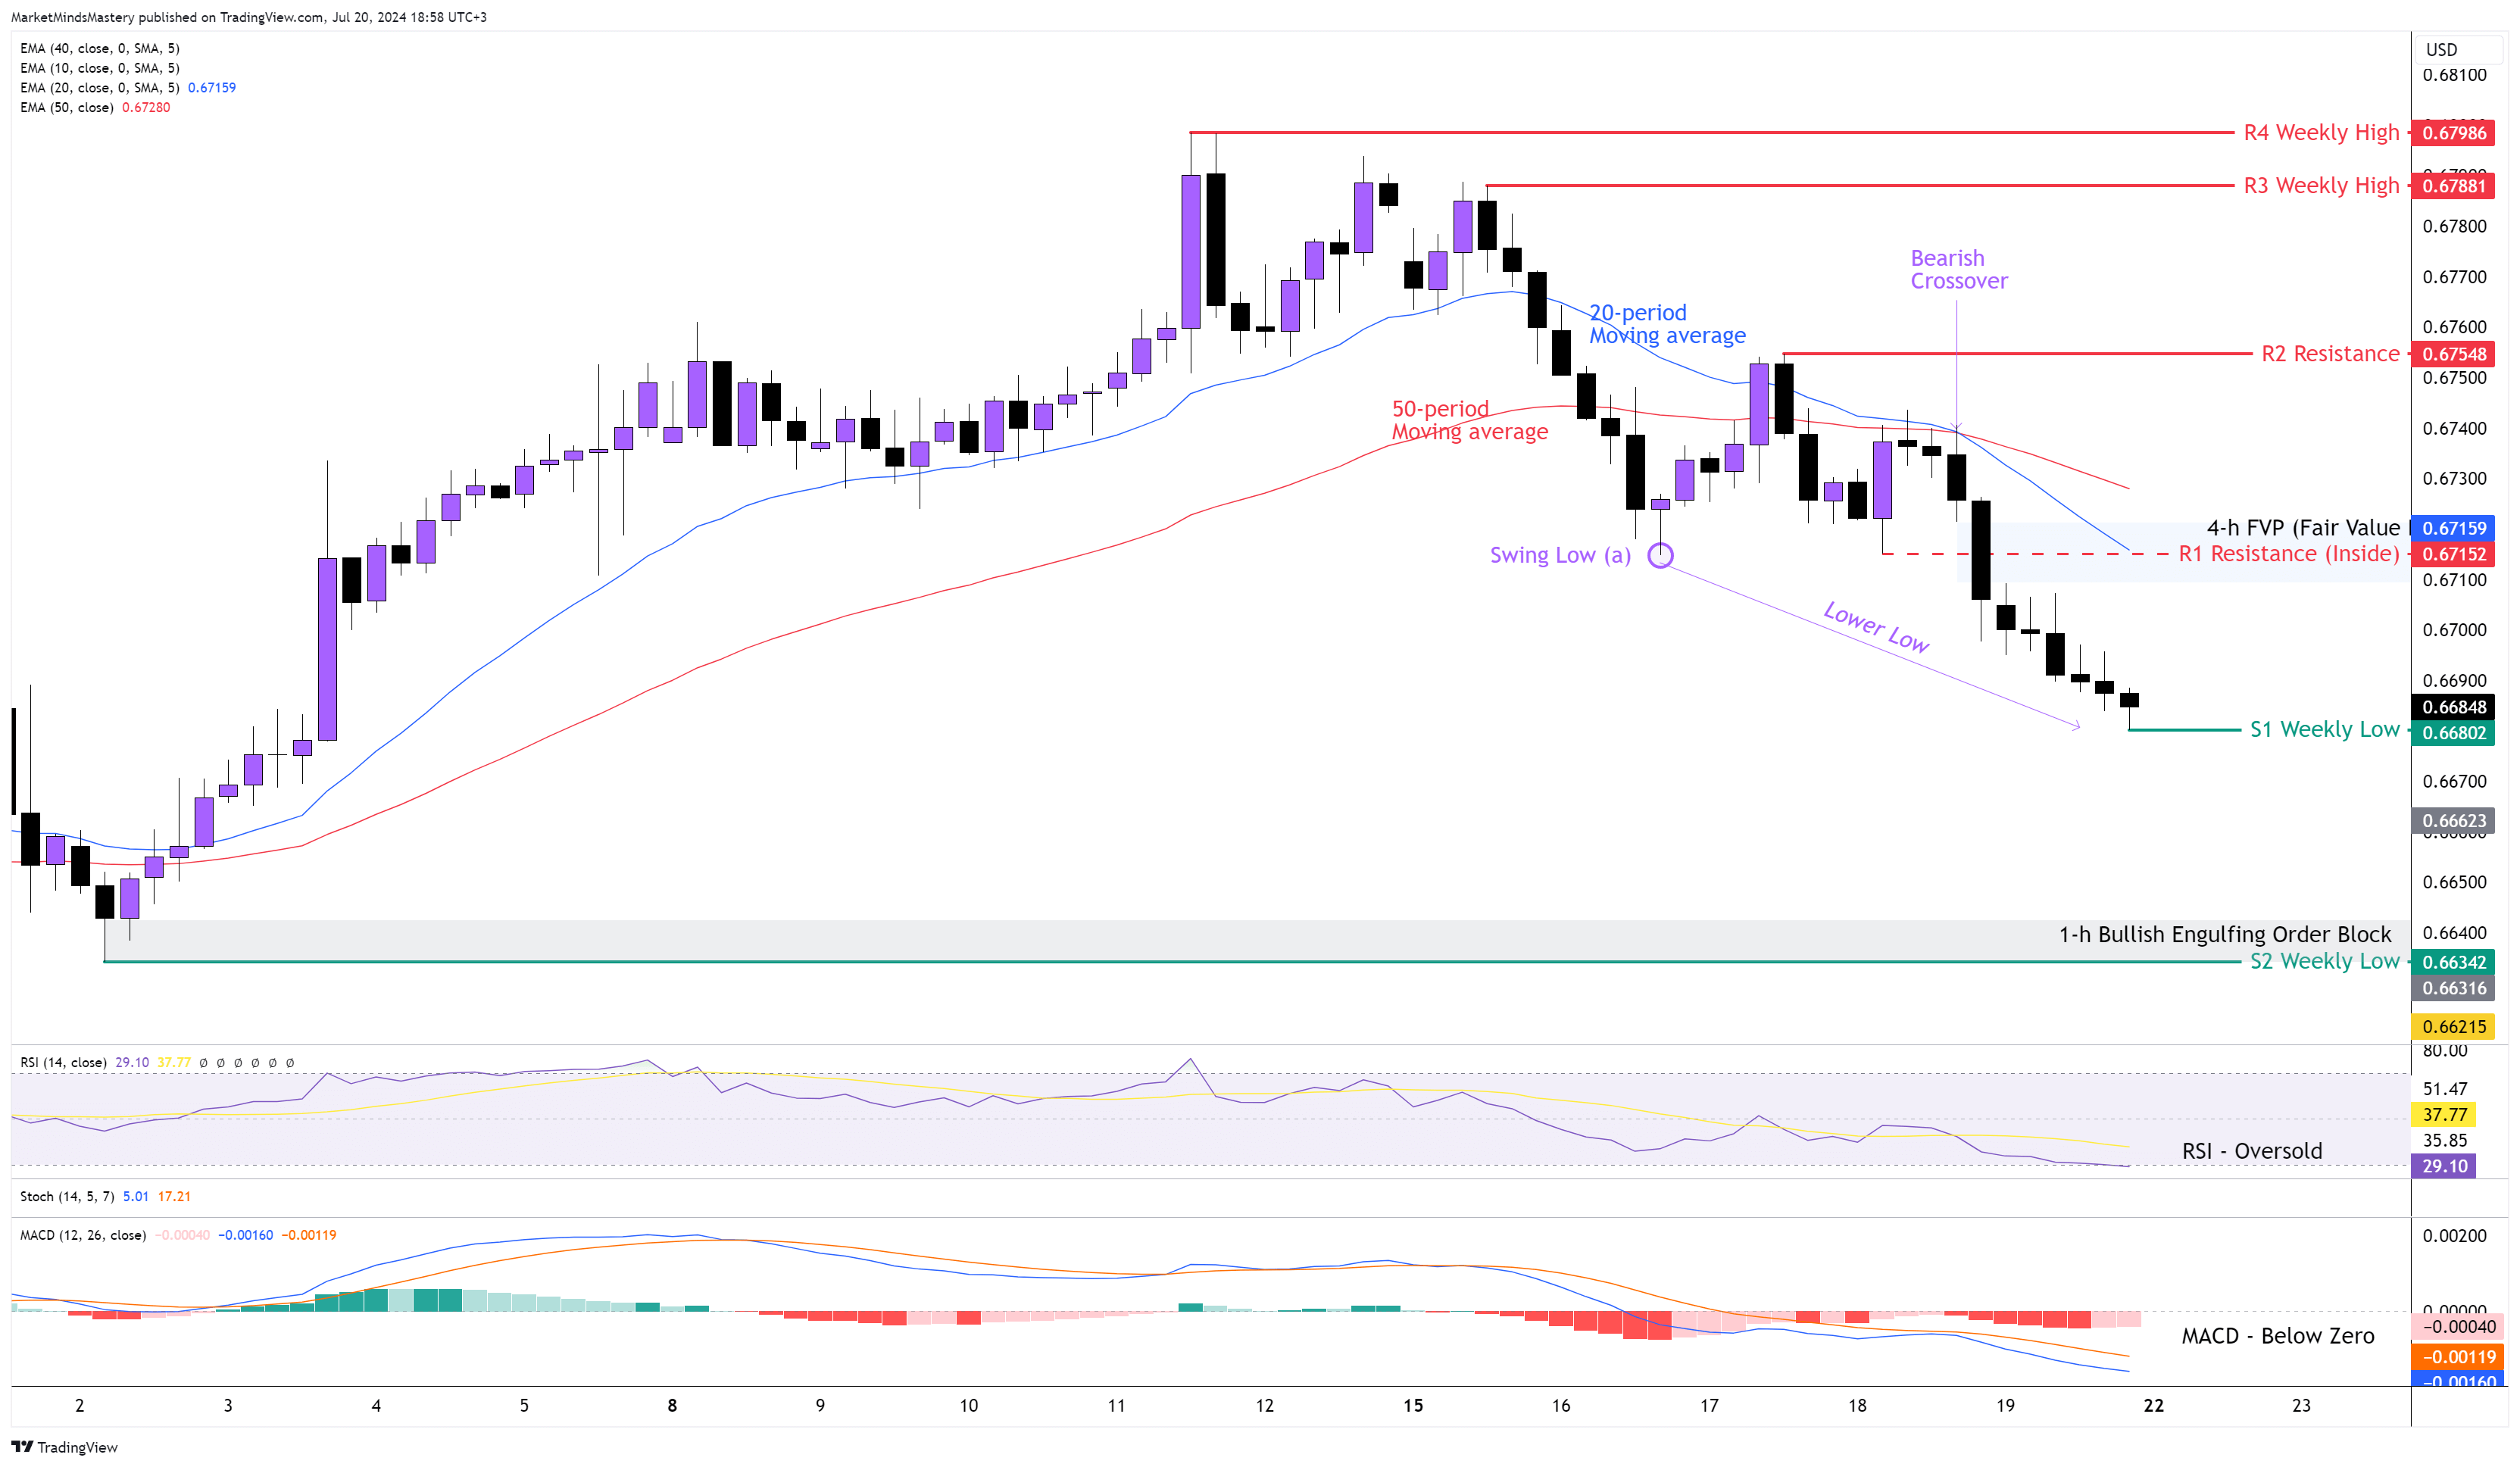
The Increase in the Unemployment Rate in Australia last Thursday was the catalyst for weakening the Australian dollar. The price has since broken below the previous swing low at (a), creating a long bearish candle on the weekly chart and a lower low and also a lower high on the 4-hour chart. It is important to mention that the primary trend (weekly trend) is up. The RSI is in an oversold condition, as shown on the chart above, and the MACD is below zero, with its Histogram showing bearish bars. Both indications have bearish implications for the AUDUSD currency pair. The 20-period and the 50-period moving averages created a Bearish Crossover, and this is also bearish. From Monday onwards, if the price keeps moving downwards to continue the 4-hour downtrend, the first support area, S1, will be the previous week’s low, around 0.66802. If the price penetrates the S1 and keeps lowering, the next support area, S2, will be another weekly low, approximately 0.66342. At this level, a Bullish Engulfing Order Block was formed at the beginning of July, and it hasn't been tested yet.
On the other hand, if the price moves upwards, the first resistance area, R1, will be the inside resistance of approximately 0.67152. At this level, the FVP (Fair Value Price) can be an additional factor to strengthen the R1 level. If the price manages to penetrate the R1 and go through, the next resistance area, R2, will be around 0.67548. If the price penetrates the R2 level, the market’s current downtrend will come to an end, and the weekly uptrend will resume. In this case, the next resistance area, R3, will be the previous week’s high, around 0.67881.
USD JPY 4H
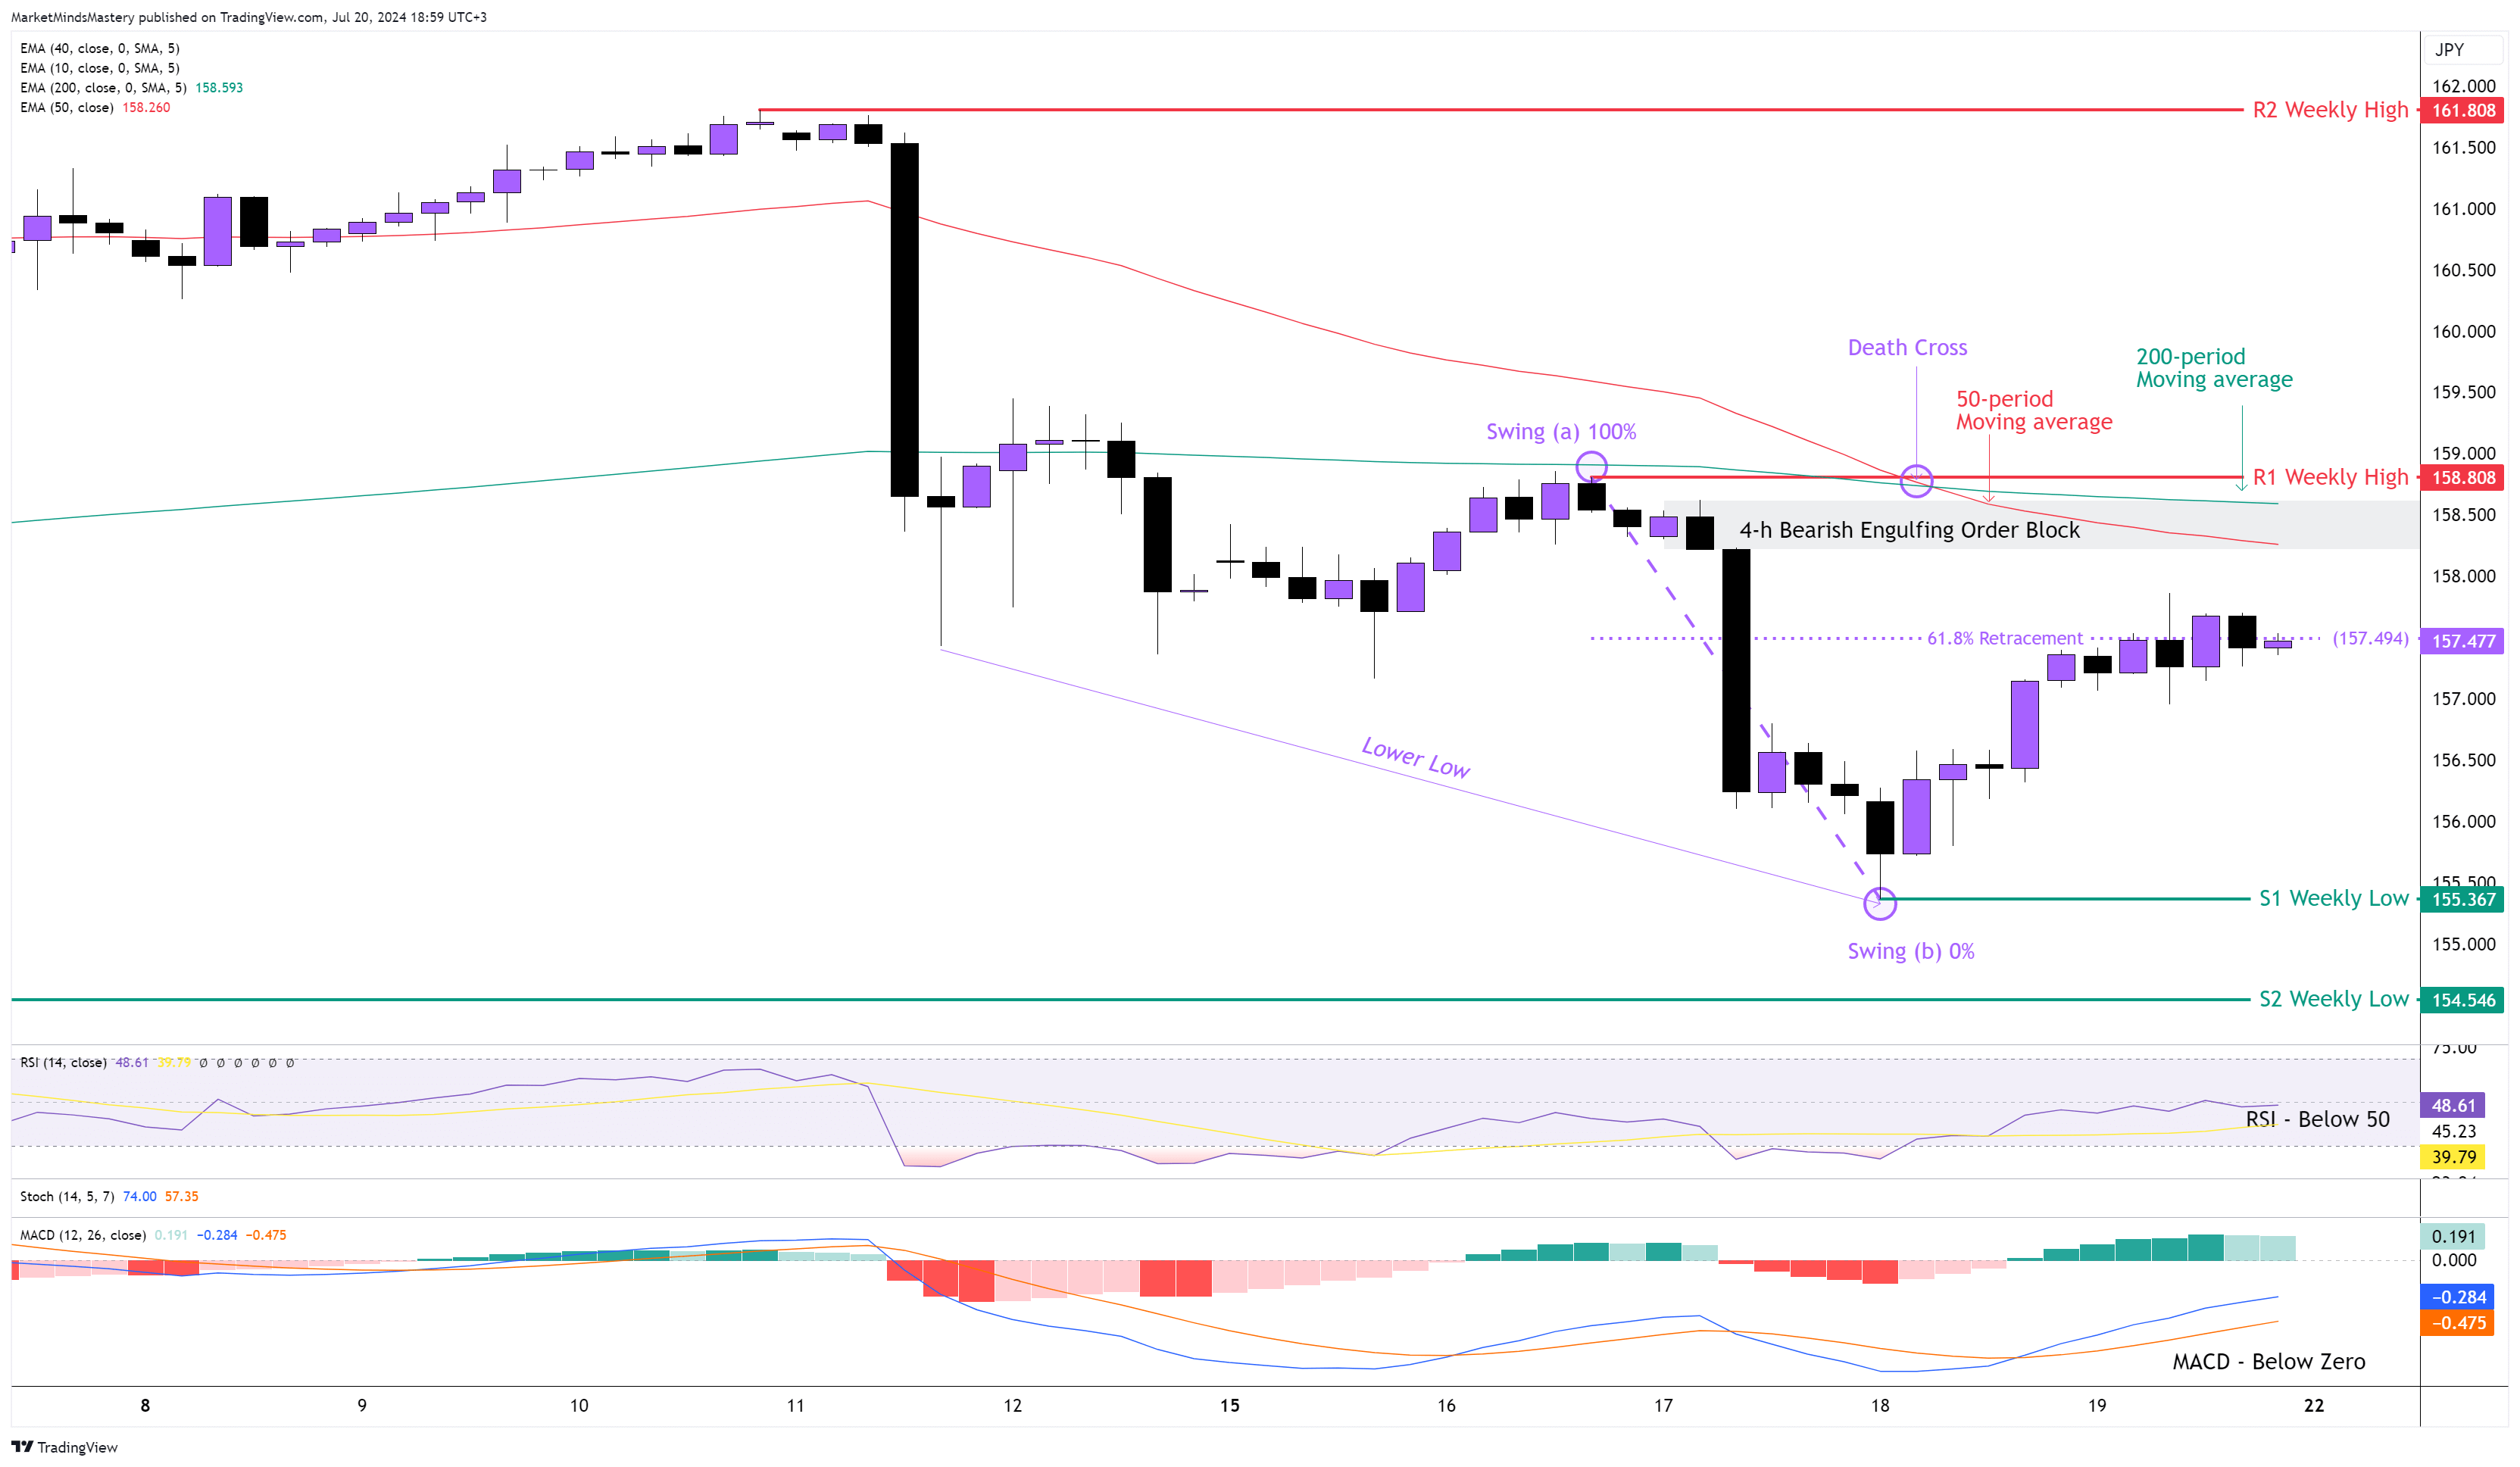
The US Dollar’s weakness continued last week, with the price making a new lower low and lower high last Wednesday. The week ended with the Long Wick candle on the weekly chart. This was the outcome based on the 4-hour price correction. For as long as the series of lower highs and lower lows keep in takt, the downtrend is still valid. On the 4-hour chart, the 50-period crossed below the 200-period and is called the “Death Cross”. The RSI Oscillator is below the middle line of 50, and this is bearish.
Additionally, the MACD is below its zero line and this is also bearish. Currently, the price is around the Golden Ratio of 61.8% Fibonacci. If the price finds resistance in this area and declines, it can move downwards until the previous week’s low, which is the S1 support, around 155.367. If the price penetrates the S1 and keeps lowering, then the next support area will be another weekly low, approximately 154.546. On the other hand, if the price continues to move upwards without finding resistance at 61.8%, then the first resistance area, R1, will be the previous week’s high, around 158.808. This price level is considered significant because it coexists with the 200-period moving average, and it can act as a dynamic resistance, along with the 4-H Bearish Engulfing Order Block that started the last impulsive price move. If the price doesn't stay below the R1, and if it penetrates it and keeps moving upwards, it will end the current downtrend, and the weekly primary uptrend will resume. In this case, the next resistance area, R2, will be very close to the ATH (All-time High), around 161.808.
USD CHF 4H
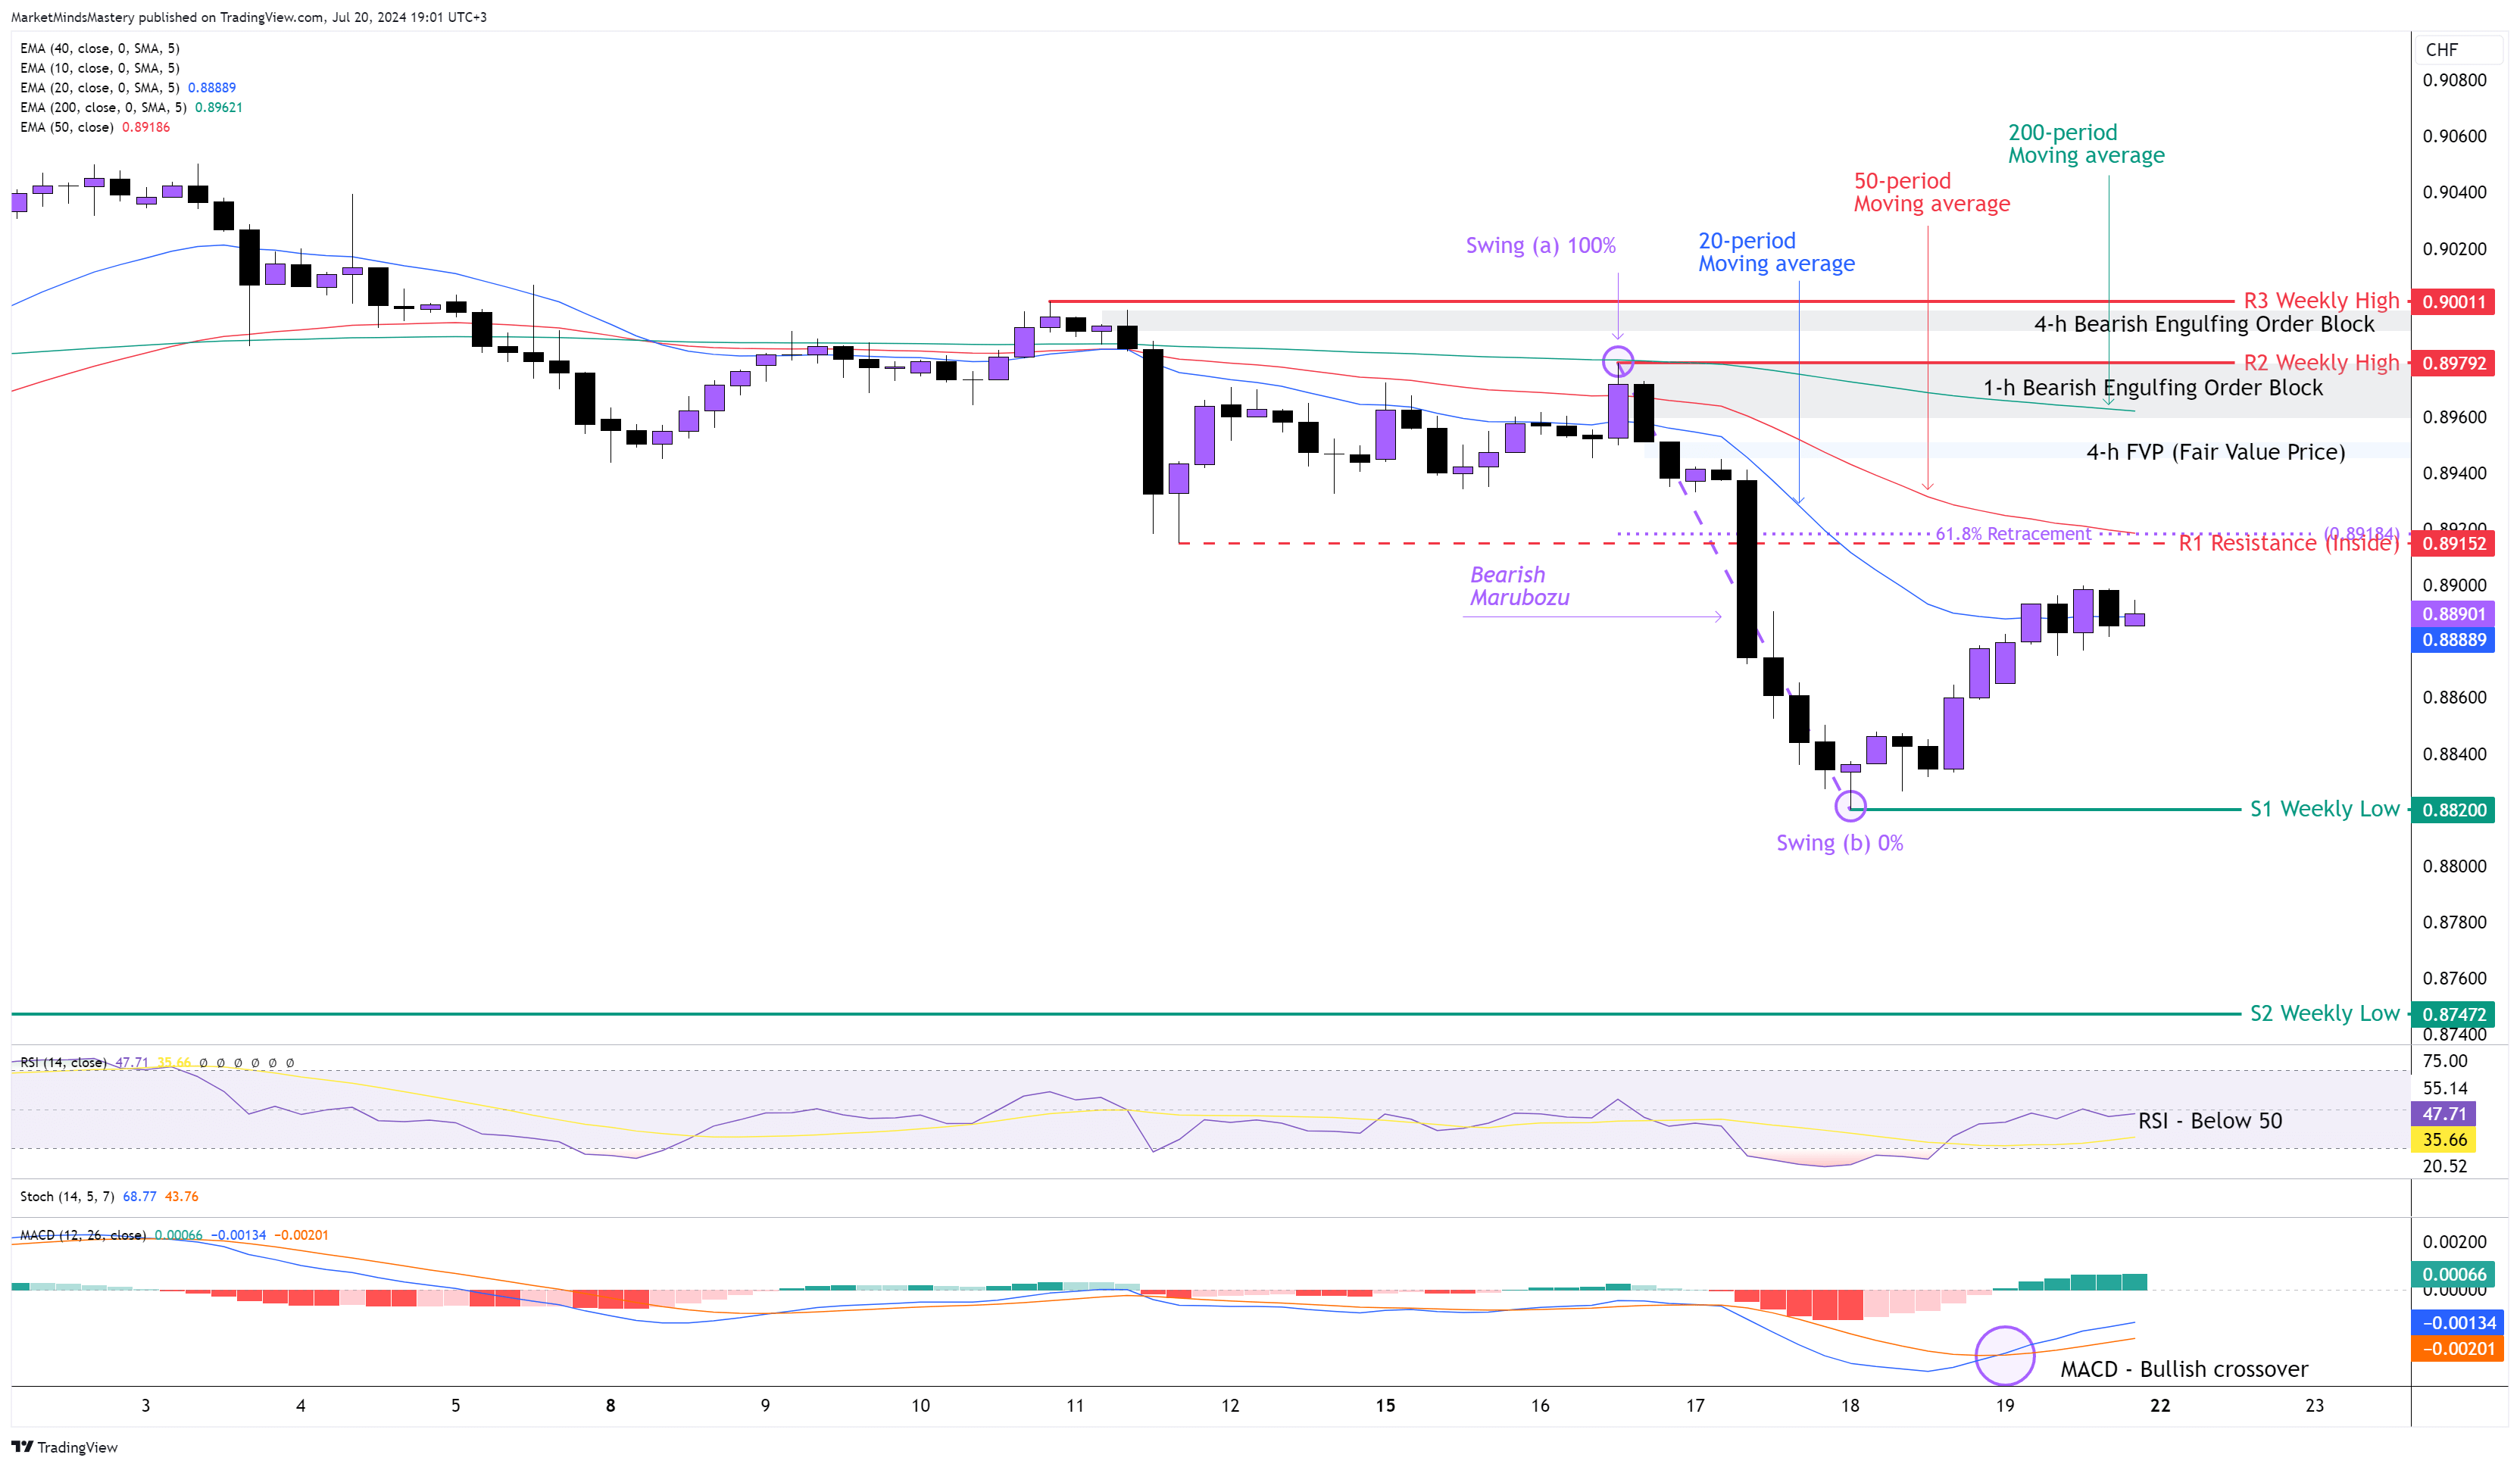
Following the downward move that started at the beginning of July, the price of the USDCHF created a new lower low and lower high last Wednesday after the Bearish Marubozu candle broke the previous week’s low, as we had pointed out on the chart. The price declined until the area we pointed on the previous week’s market outlook as a Bearish Engulfing Order Block, and then it bounced off and moved upwards until the 20-period moving average.
The 20-period moving average is below the 50-period moving average, and the 50-period is below the 200-period, indicating that the market is in a strong downtrend. The RSI is below 50, and this has bearish implications. Even though the MACD is below zero and bearish, the MACD line (blue) crossed above the Signal line (orange), indicating that the price is in a corrective phase.
Starting Monday, if the price moves upward, the first resistance area, R1, will be the inside Resistance around 0.8915. This price level coexists with the Fibonacci retracement of 61.8% and the 50-period moving average, which can act as a dynamic resistance. In case the price penetrates the R1 and keeps moving upwards, the next resistance area, R2, will be around 0.8979. At this level, the price will meet a Bearish Engulfing Order Block and the 200-period moving average. Conversely, if the price is rejected and moves downwards, the first support area, S1, will be the previous week’s low, around 0.88200. If the price breaks the S1 support and keeps dropping lower, the next support area, S2, will be another weekly low, approximately 0.8747.
GBP JPY 4H
The price of the GBPJPY kept declining last week following the price correction in the weekly chart. As the series of lower highs and lower lows continues on the 4-hour chart, the trend is considered a downtrend. The 20-period crossed below the 50-period moving average, and this has bearish implications. The 4-h Bearish Engulfing created the last impulsive downward move, leaving behind a well-defined Order Block. The RSI Oscillator is below 50 and this indicates a downward momentum. However, the MACD, despite being below the zero line, the MACD line (blue) crossed above the Signal line (Orange), and this is considered a bullish crossover, and it can force the price to start a corrective phase. From Monday onwards, if the price remains below the 20-period moving average and keeps moving downwards, the first support area, S1, will be the previous week’s low, around 202. If the downtrend continues, it means that the S1 will be penetrated, and the price will keep moving downwards. In this case, the next support area, S2, will be an older weekly low, approximately 201.13.
Conversely, if the price finds support, bounces off and moves upwards, the first resistance area, R1, will be around 204.23. At this price level, there is the Fibonacci retracement of 61.8%, the 20-period moving average, and it can act as a dynamic resistance in the market, as well as the FVP (Fair Value Price). All these can attract primarily sell orders in the market. If the price penetrates the R1 and keeps moving upward, the next resistance area, R2, will be the previous week’s high, around 205.78. This is also an equally significant price level because of the Order Block formed last week.
GOLD 4H
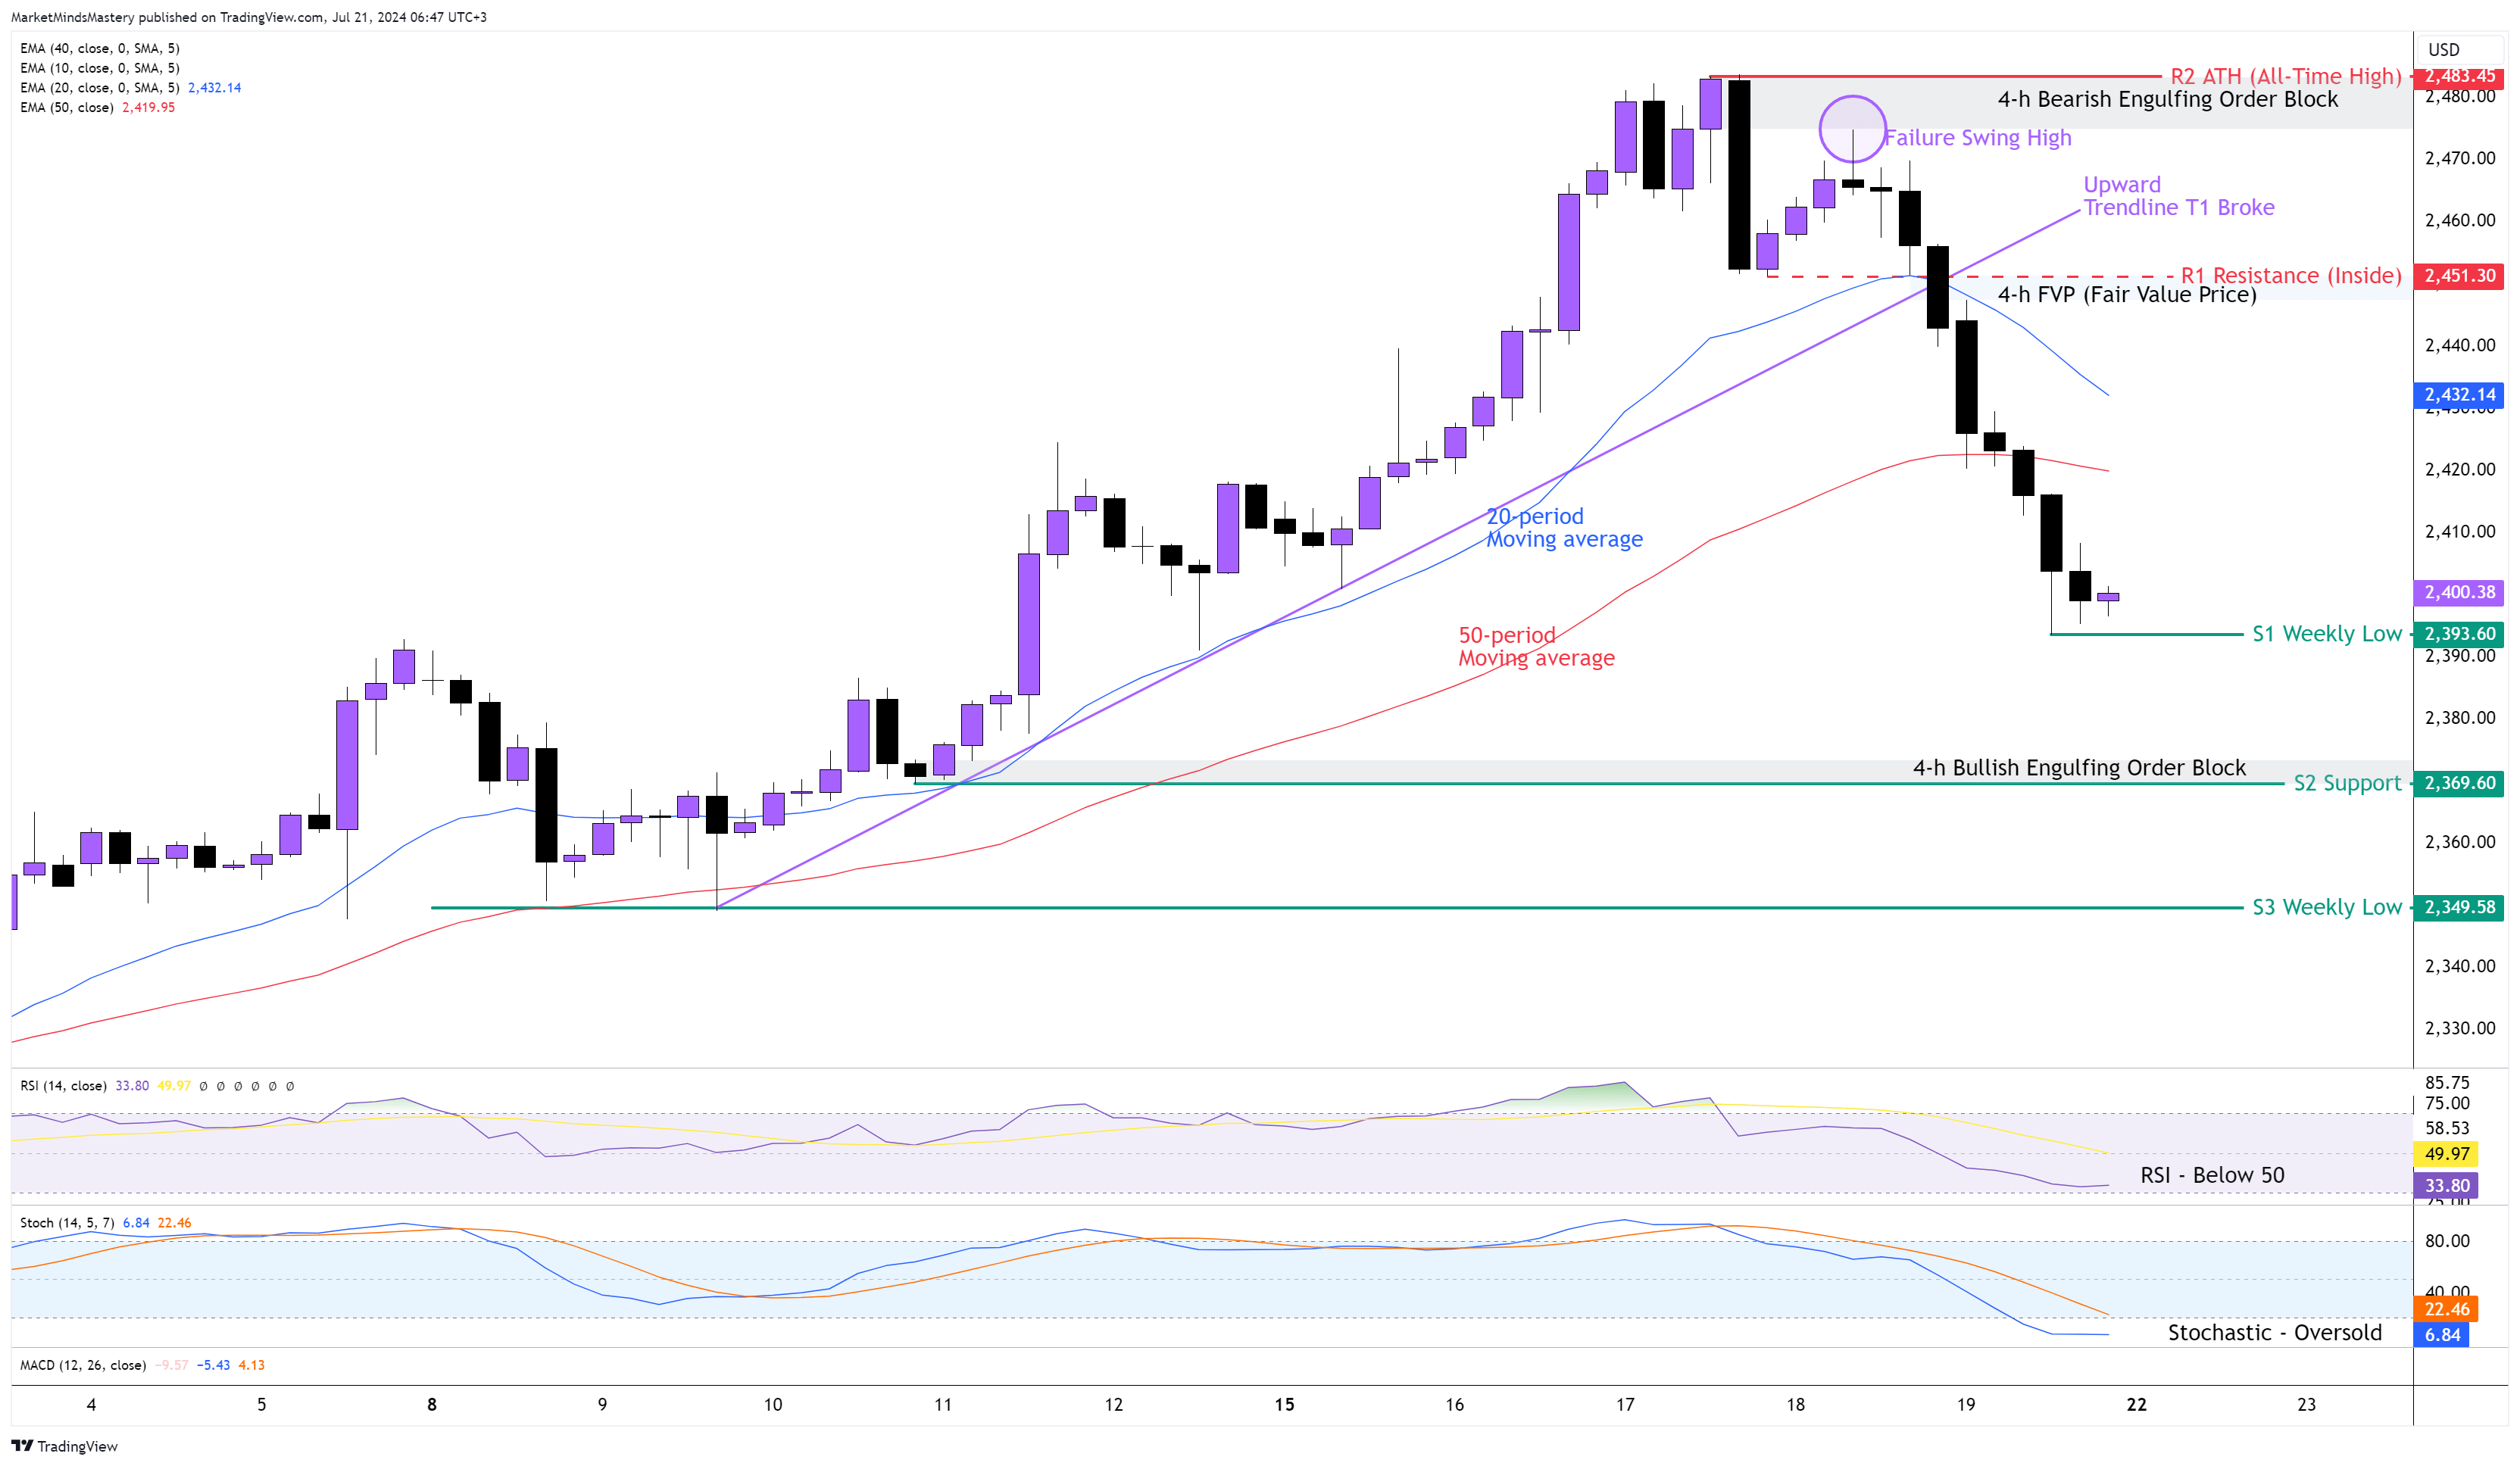
Following the previous week’s upward move, the price of Gold on the weekly chart created a new ATH (all-time high) last Wednesday at $2483, and by last Friday, it had dropped around $80. The weekly chart shows a Shooting Star candlestick, and the Stochastic Oscillator shows Negative Divergences. This is an indication that the price of the Gold might drop further. On the 4-hour chart, the price has declined since last Thursday, with only bearish candles printed on the chart. Based on the swing analysis, the Valid Upwards Trendline T1 broke because of the Failure Swing High, as shown on the chart. We marked the FVP (Fair Value Price), which is close to the broken point of the trendline, and it can act as an additional resistance factor. Although the pricer is already trading below the 20-period and the 50-period moving averages, they haven’t crossed yet to follow the downward price move. The RSI is below 50, and this is a bearish indication, and the Stochastic is in an Oversold condition, and it is also a bearish indication. Starting Monday, if the price keeps lowering, the first support area will be the previous week’s low, around $2393. If the price penetrates the S1 and declines further, the next support area, S2, will be around $2369. A Bullish Engulfing Order Block is sitting at the same level. A further downward move will find the next support area, S3, around $2349. Oppositely, if the price moves upwards, the first resistance, an R1, will be the Inside resistance around $2451. If the price penetrates the R1 and keeps moving upwards, then the next resistance area, R2, will be the ATH at $2483.
USOIL 4H
The USOIL market kept trading within the same range last week, with the weekly chart forming a Bearish Engulfing candle. As the market is in equilibrium and there is no defined trend, using the Bollinger Bands upper and lower bands will be ideal in these market conditions. Although the Bollinger Band is a trending indicator as the middle line represents the 20-period moving average, during the ranging market conditions, we focus more on the extreme bands. Last Friday, a Bearish Marubozu forced the price to decline and reach the Lower Band. The RSI is below 50, following the price as it drops lower. The Stochastic Oscillator created a Bearish Crossover during the middle of the previous week after a Bearish Engulfing with a Long Upper Wick. Since then, it has followed the price, hitting its overbought condition.
Starting Monday, if the price finds support at the lower band, bounces off and moves upwards, the first resistance area, R1, will be the previous week’s high around the Upper Band at $83.80. If the price penetrates the R1 and keeps increasing, then the next resistance area, R2, will be at a close distance, and it will reach another weekly high at $84.50. On the other hand, if the price follows the weekly price action momentum and keeps moving downwards, the first support area, S1, will be the previous week’s low, approximately at $80.24, where the current price is. If the price penetrates the S1 and keeps lowering, then the next support area, S2, will be $77.96.
BTC USD 4H
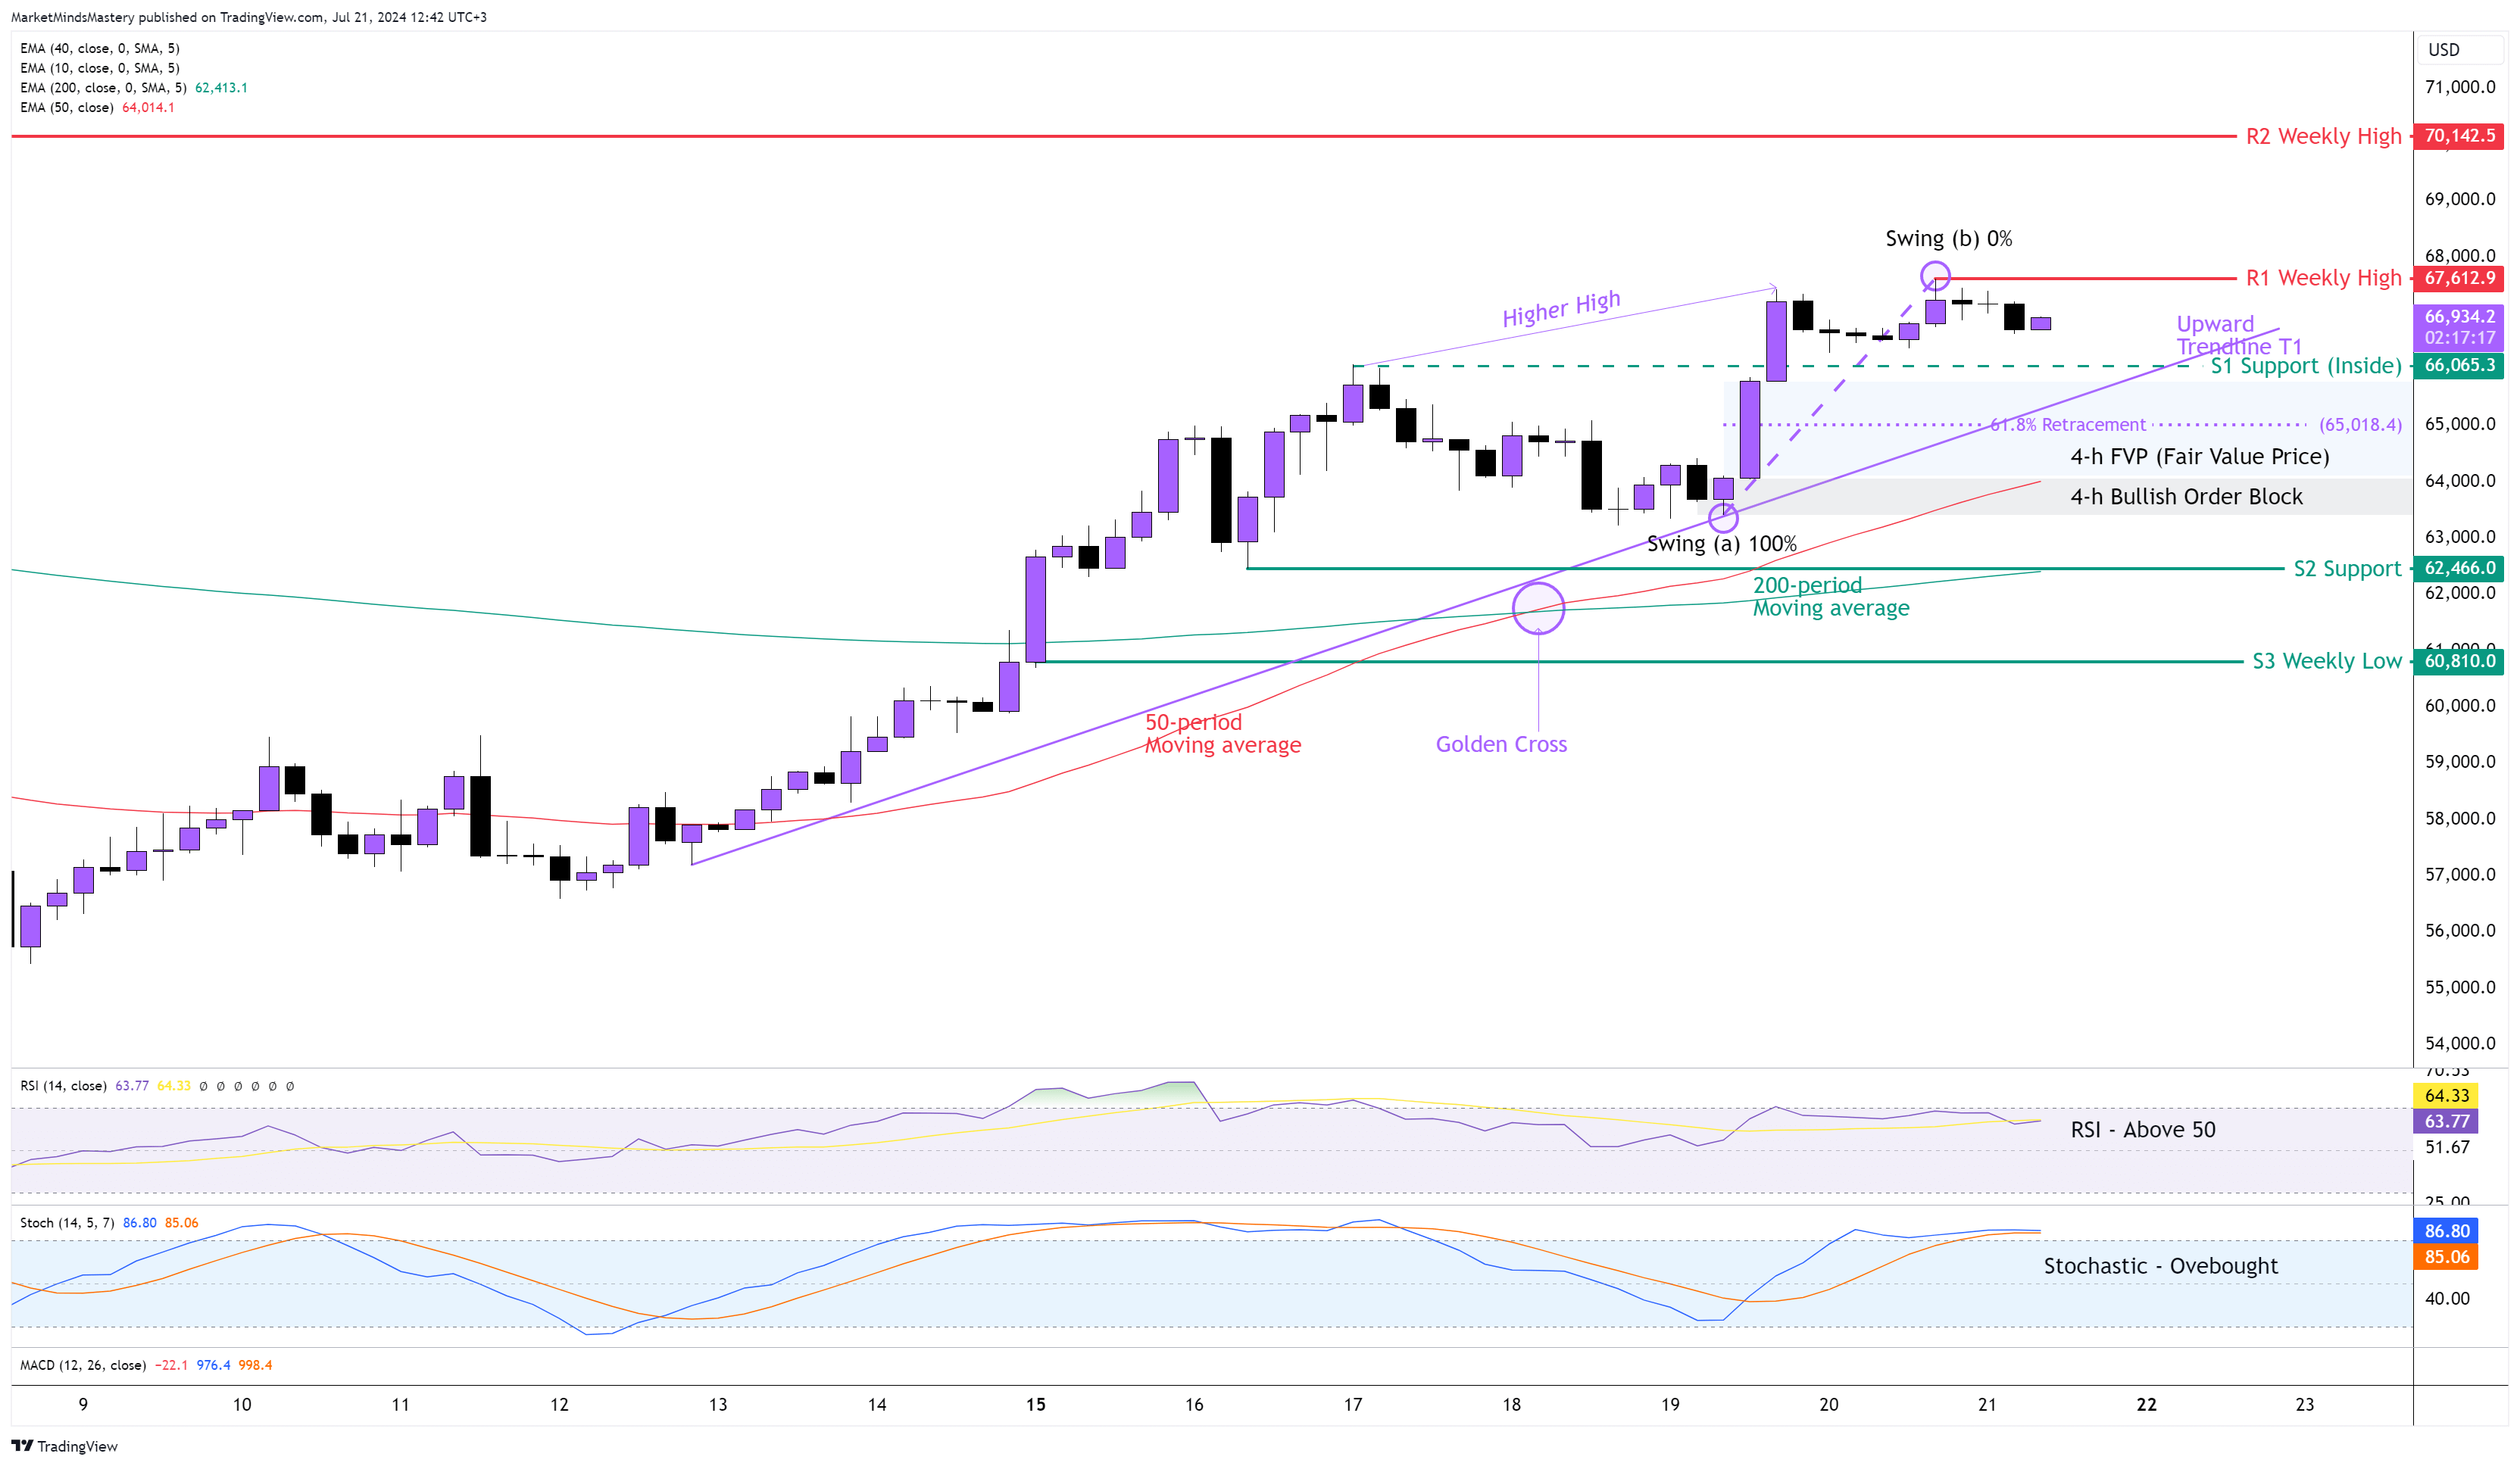
Following the previous week’s inside candle, the price found support on the 40-period weekly moving average (not shown on this chart), bounced off, and moved upwards, creating a bullish continuation candle. Consequently, on the 4-hour chart, the price created a new market structure with a series of higher highs and higher lows that define an uptrend. Currently, the price is above the Upward Trendline T1, and this is a bullish indication. Last Thursday, the 50-period crossed above the 200-period moving average, known as the “Golden Cross.”
The RSI Oscillator is above 50, which is a bullish indication. The Stochastic is in an Overbought condition, which is also a bullish indication. Starting Monday, if the price continues its upward move, the first resistance area, R1, will be the previous week’s high, approximately $67612. In case the price penetrates the R1 and keeps increasing, the next resistance area, R2, will be $70142.
On the Other hand, if the price is rejected and moves downwards, the first support area, S1, is an inside support around $66000. If the price manages to penetrate the S1 and move through this level, the next support, S2, will be around $62466. Between the S1 and S2 support levels, there is a Bullish Order Block, an FVP (Fair Value Price) and the Fibonacci 61.8%. These three factors can become solid support for the price, and penetration of all three will automatically indicate a price weakness to sustain a robust upward move. Therefore, the market structure will change, and a trend reversal may occur.
SP 500 4H
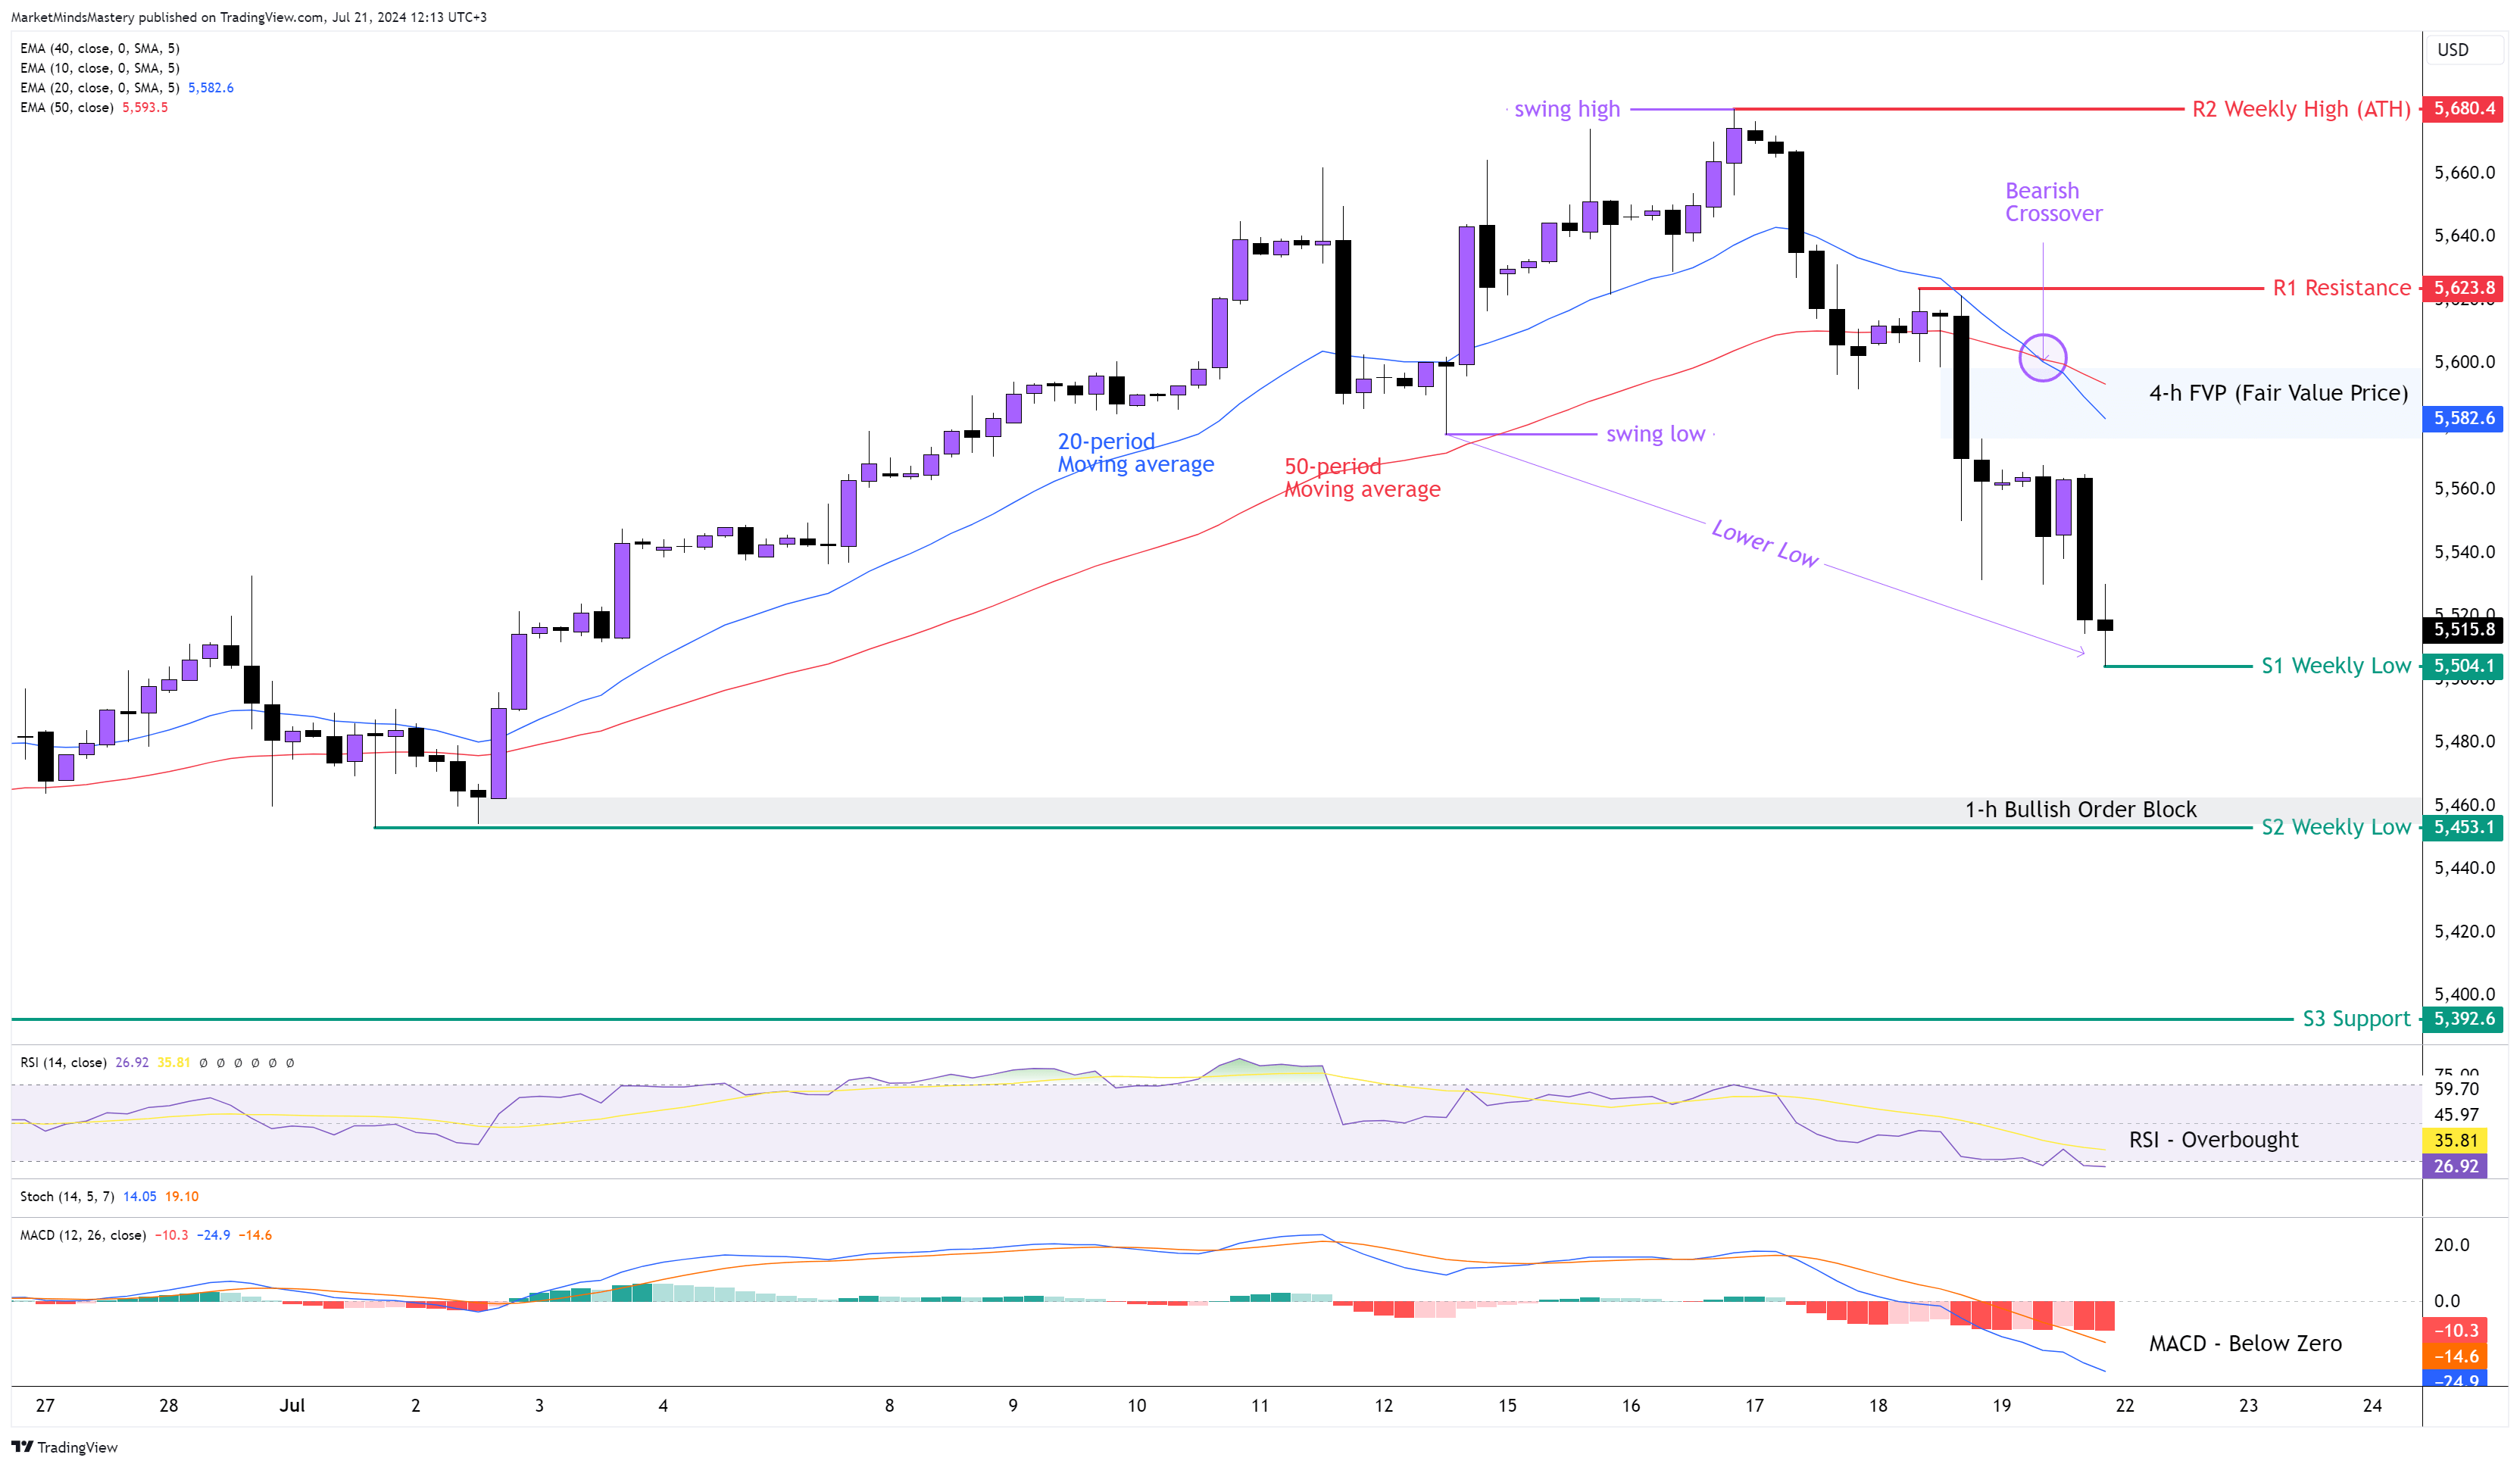
Following the Overbought RSI and, at the same time, the Negative Divergences, the price last Wednesday created a new ATH (All-time High) and then declined, creating a new market structure on the 4-hour chart. The week ended with a Bearish Engulfing Reversal on the weekly chart, which is an indication of a dynamic shift in the market momentum. On the 4-hour chart, the price made a lower low with the 20-period moving average crossing below the 50-period, following the price's downward move. The price on Thursday created an FVP (Fair Value Price), which is marked on the chart above. The RSI Oscillator became overbought as it is trading at around 26. The MACD is bearish as both the MACD line and the Signal Line are below zero.
Additionally, the Histogram shows a strong sell-off on the SP500. If, starting Monday, the downward momentum continues, the price is expected to keep lowering, and the first support area, S1, will be the previous week’s low, around $5500. It is a round number and will attract a lot of trading volume. If the S1 level penetrates and the price keeps moving downward, the next support area will be another weekly low, the S2, around $5453. In this case, the Bullish Order Block formed at the beginning of the month can act as a support factor.
On the other hand, if the price moves upwards, the first resistance area will be the R1, around $5623. Below this area is the FVP, which brings confluence in the market for additional resistance. If the price penetrates the R1 and keeps its upward move, the next resistance area, R2, will be the ATH, around $5680.
US 30 4H
Following the upward move on the US30 last week, the price made a new ATH (All-time High), but at the end of the week, it created a Shooting Star reversal candlestick pattern. This means that the sell orders overcame the buy orders, and the price declined. This is among the most reliable candlestick patterns in candlestick analysis once it is created after a well-defined uptrend. It is important to mention that the MACD on the weekly chart didn't follow the upward price move, and it didn't create a new high. Instead, it printed Negative Diverneces A’class. The 4-hour chart is in the corrective phase of the weekly chart. However, the chance of market structure and the first lower low formation indicated bearish pressure in the market. The MACD is still above zero but with a bearish crossover, as shown on the chart. The RSI Oscillator is below 50, hitting towards its oversold condition. The 50-period is above the 200-period moving average, and this is bullish. The moving averages are lagging indicators when they come to the beginning of a trend reversal.
Starting Monday, if the price keeps moving downwards, the first support area, S1, will be the previous week’s low, around $40000. This is one of the most significant levels on this chart, and it is a round number and, at the same time, a psychological number where traders are looking to become very active. As this level consists of the Fibonacci 61.8% and the FVP, it can attract a lot of trading activity. If the price penetrates the S1 and keeps moving lower, the next support area, S2, will be around $39664. A further downward move will find the S3 support, which is another weekly low, approximately $39189. On the other hand, if the price finds support, bounces off and moves upwards to resume the higher time frame’s uptrend, the first resistance area, R1, will be around $40750. A further upward move will find the next resistance level approximately at $41424, which is the previous week’s high and, at the same time, the ATH.
GER 30, 4H
Following the previous week’s market outlook, the price retraced as expected back to the area of confluence of the FVP, S1 support, and Fibonacci Golden ratio. However, the buy orders weren’t significantly more than the sell orders to lift the price upwards, and a Bearish Engulfing candle penetrated the Support and pushed the price to the next static level we had on the chart. This price move created a long, Bearish Marubozu candle on the weekly chart.
On the 4-hour chart, the 20-period crossed below the 50-period moving average, and this is called a Bearish Crossover. In the last few days of the previous week, the bearish candles were long and above their average ATR, which means there was a lot of trading volume that caused the price to drop, primarily due to selling orders.
The RSI oscillator is below 50, which indicates bearishness in the GER30. Also, the Stochastic Oscillator is currently in an Oversold condition, which is another bearish indication. Currently, there is no bullish corrosive on the Stochastic. The market is trading below a Valid Trendline, T1, and if this continues from Monday onwards, the first support area, S1, will be the previous week’s low, around 18185. If the price penetrates the S1 and moves further downwards, the next support areas, S2 and S3, will be 18038 and 17941 respectively.
Oppositely, if the price finds support, bounces off and moves upwards, the first resistance area, R1, will be around 18368. If the price penetrates the R1 resistance and moves upwards, the next resistance area, R2, will be around 18548. This R2 area around 18548 can be considered a significant area as a Bearish Engulfing Order Block formed there a while ago, and it hasn't been tested yet. If the price penetrates the R2 and keeps moving upward, it will create a new market structure. The next resistance area, R3, will be approximately 18758.