Last week, the major markets were driven primarily by the poor performance of the US Dollar. The Greenback lost significant value due to a CPI report that dropped almost by 1% less than last week’s forecast. So, currently, the CPI in the US is 3%. Additionally, a significant drop occurred in the Kiwi after the Reserve Bank of New Zealand reported unchanged Interest Rates at 5.5%. Both these events allowed the Euro and the Sterling to gain some upward momentum.
This week is expected to be a high volatile as the CPI (Consumer Price Index) reports will continue. Starting Monday, in China, the GDP (Gross Domestic Product) is expected to drop as per the forecast from 5.3% to 5.1%, Industrial production from 5.6% to 5%, and Retail Sales from 3.7% to 3.3%. These events will directly affect the Chinese Yuan, and the volatility during the Asian Trading Session is expected to pick up. Although we don’t trade the Chinese Yuan currency directly, we can get an overall estimation of China’s industrial and Consumer consumption health, which can be useful when we analyse countries that heavily import Goods directly from China. Only one hour before the London Trading Session kicks in, in Germany, they will report the Retail Sales for May. The forecast shows an increase from -0.2% to 0%. This means the volatility on the Euro will pick up at this time, and a number more positive than the forecast can set the Euro to gain significant momentum. The last significant event for Monday will be the Eurozone’s Industrial Output. As per the forecast, a continued drop from -3% to -3.9% is expected to be reported.
Tuesday's volatility during the Asian Trading Session is expected to be as usual, as there won’t be any significant news events. In the Eurozone, during the London Trading Session, the ECB Bank Lending Servey will report. Next, it's Canada’s turn to report its CPI (Consumer Price Index), and the consensus estimates a significant drop from 2.9% to 2.8%. However, a 0.1% deviation does not sound like a huge percentage. However, for this event, it is well enough to cause the currency a noticeable price drop. Traders usually should focus on the actual report rather than the forecast. A large deviation between the two can cause the price to move accordingly. The Canadian Dollar is hovering around 1.36, which is a significant price level for the Loonie, and a lower CPI report can cause the break of this level and the price to move to the next significant level, which is the 1.35, as per the price charts. The last significant event of the day will be the Retail Sales in the US. The consensus estimates a drop from 0.1% to 0%. In this case, if the actual confirms the forecast and if the market follows through, then a continuous weakness in the US Dollar is expected to be seen on the charts. That can lead to an upward continuation of the EURUSD, the GBPUSD, the AUDUSD and the rest of the four major currency pairs.
The markets are expected to have intense trading activity from early morning because, in New Zealand, they will report their CPI (Consumer Price Index). This will be the most important CPI report of the week as the consensus estimates a massive drop from 4% to 3.5%. Again, as with every other forecast, if the actual confirms this forecast and if the market drops even further, then a significant sell-off is expected to be seen on the price charts of all NZD currency pairs. As the upward momentum picked up on the EURNZD and the GBPNZD since last week, if the uptrend continues, then a further upward move is expected on both currency pairs. The situation will become more interesting during the London trading session as in the UK, they will report the CPI and the Core CPI. They both refer directly to the inflation measurement within the UK with the Core CPI, including alcohol and tobacco. As per the consensus, the CPI is expected to drop from 2% to 1.9% and the Core CPI from 3.5% to 3.4%. If the actual report confirms the forecast and the market follows through at the same time, the drop in the GBP will be obvious on the price charts. However, considering the overall strength of the GBP, this event can temporarily set the GBPUSD to a trend correction rather than a trend reversal. Only if the USD gains significant strength can it cause a rapid trend reversal of the currency pair.
Moving into Thursday’s news events, the Asian Trading Session is expected to be very volatile. In Australia, the Employment Change is expected to drop by almost 20,000, but the Unemployment Rate will remain at 4%. This will cause a significant fluctuation in the AUD, and if there is a reporting number other than 4%, the markets will react intensively. Next, it is the UK’s turn to report the Unemployment Rate. The forecast shows an unchanged number at 4.4%. Like in Australia’s dollar case, similar to the Sterling, as the forecast estimates an unchanged number, the markets will react intensively only if the actual report is different from the forecast.
The last significant event for the day will be during the New York Trading Session, and this won't be related to the USD directly but indirectly. The ECB (European Central Bank) will report its Interest Rates, and the forecast estimates that the ECB will keep the Eurozone’s Interest Rates at 4.25%. Usually, when Interest Rates remain the same, the currency loses value. On the price chart, we see noticeable price drops like what happened last week with the Kiwi when the RBNZ reported unchanged interest rates and the Kiwi depreciated. The same is expected with the Euro if the ECB keeps the rates unchanged and, at the same time if the market follows through. As the EURUSD approaches a significant monthly price level, it can act as a strong resistance area to at least set the EURUSD lower.
On Friday, in Japan, they will report the CPI and the forecast shows an increase from 2.8% to 2.9%. As you understand, the only positive forecast on the CPI reports this week is this one, which directly affects the Japanese Yen. Last week, as we pointed out in the USDJPY price chart analysis, our expectations to see a drop in the currency pair were met, and this week, if the US Dollar’s weakness continues until today and if the Japanese Yen gains some strength due to this event, then a continuing drop is expected to be seen on the USDJPY. Additionally, any other currency’s weakness can be matched with the Japanese Yen's strength, always considering a positive CPI and agreement by the market participants for a high probability trading opportunity. Next, the Retail Sales in the UK are expected to drop significantly from 2.9% to -0.6%. If the actual confirms the forecast and if the market follows through, then a noticeable drop in the Pound over the board will be seen. The last event for the day and this trading week will be the Retail Sales in Canada, and the consensus estimates a drop from 0.7% to -0.2%. If the actual report confirms this, we expect to see a weak Canadian Dollar during the New York Trading Session.
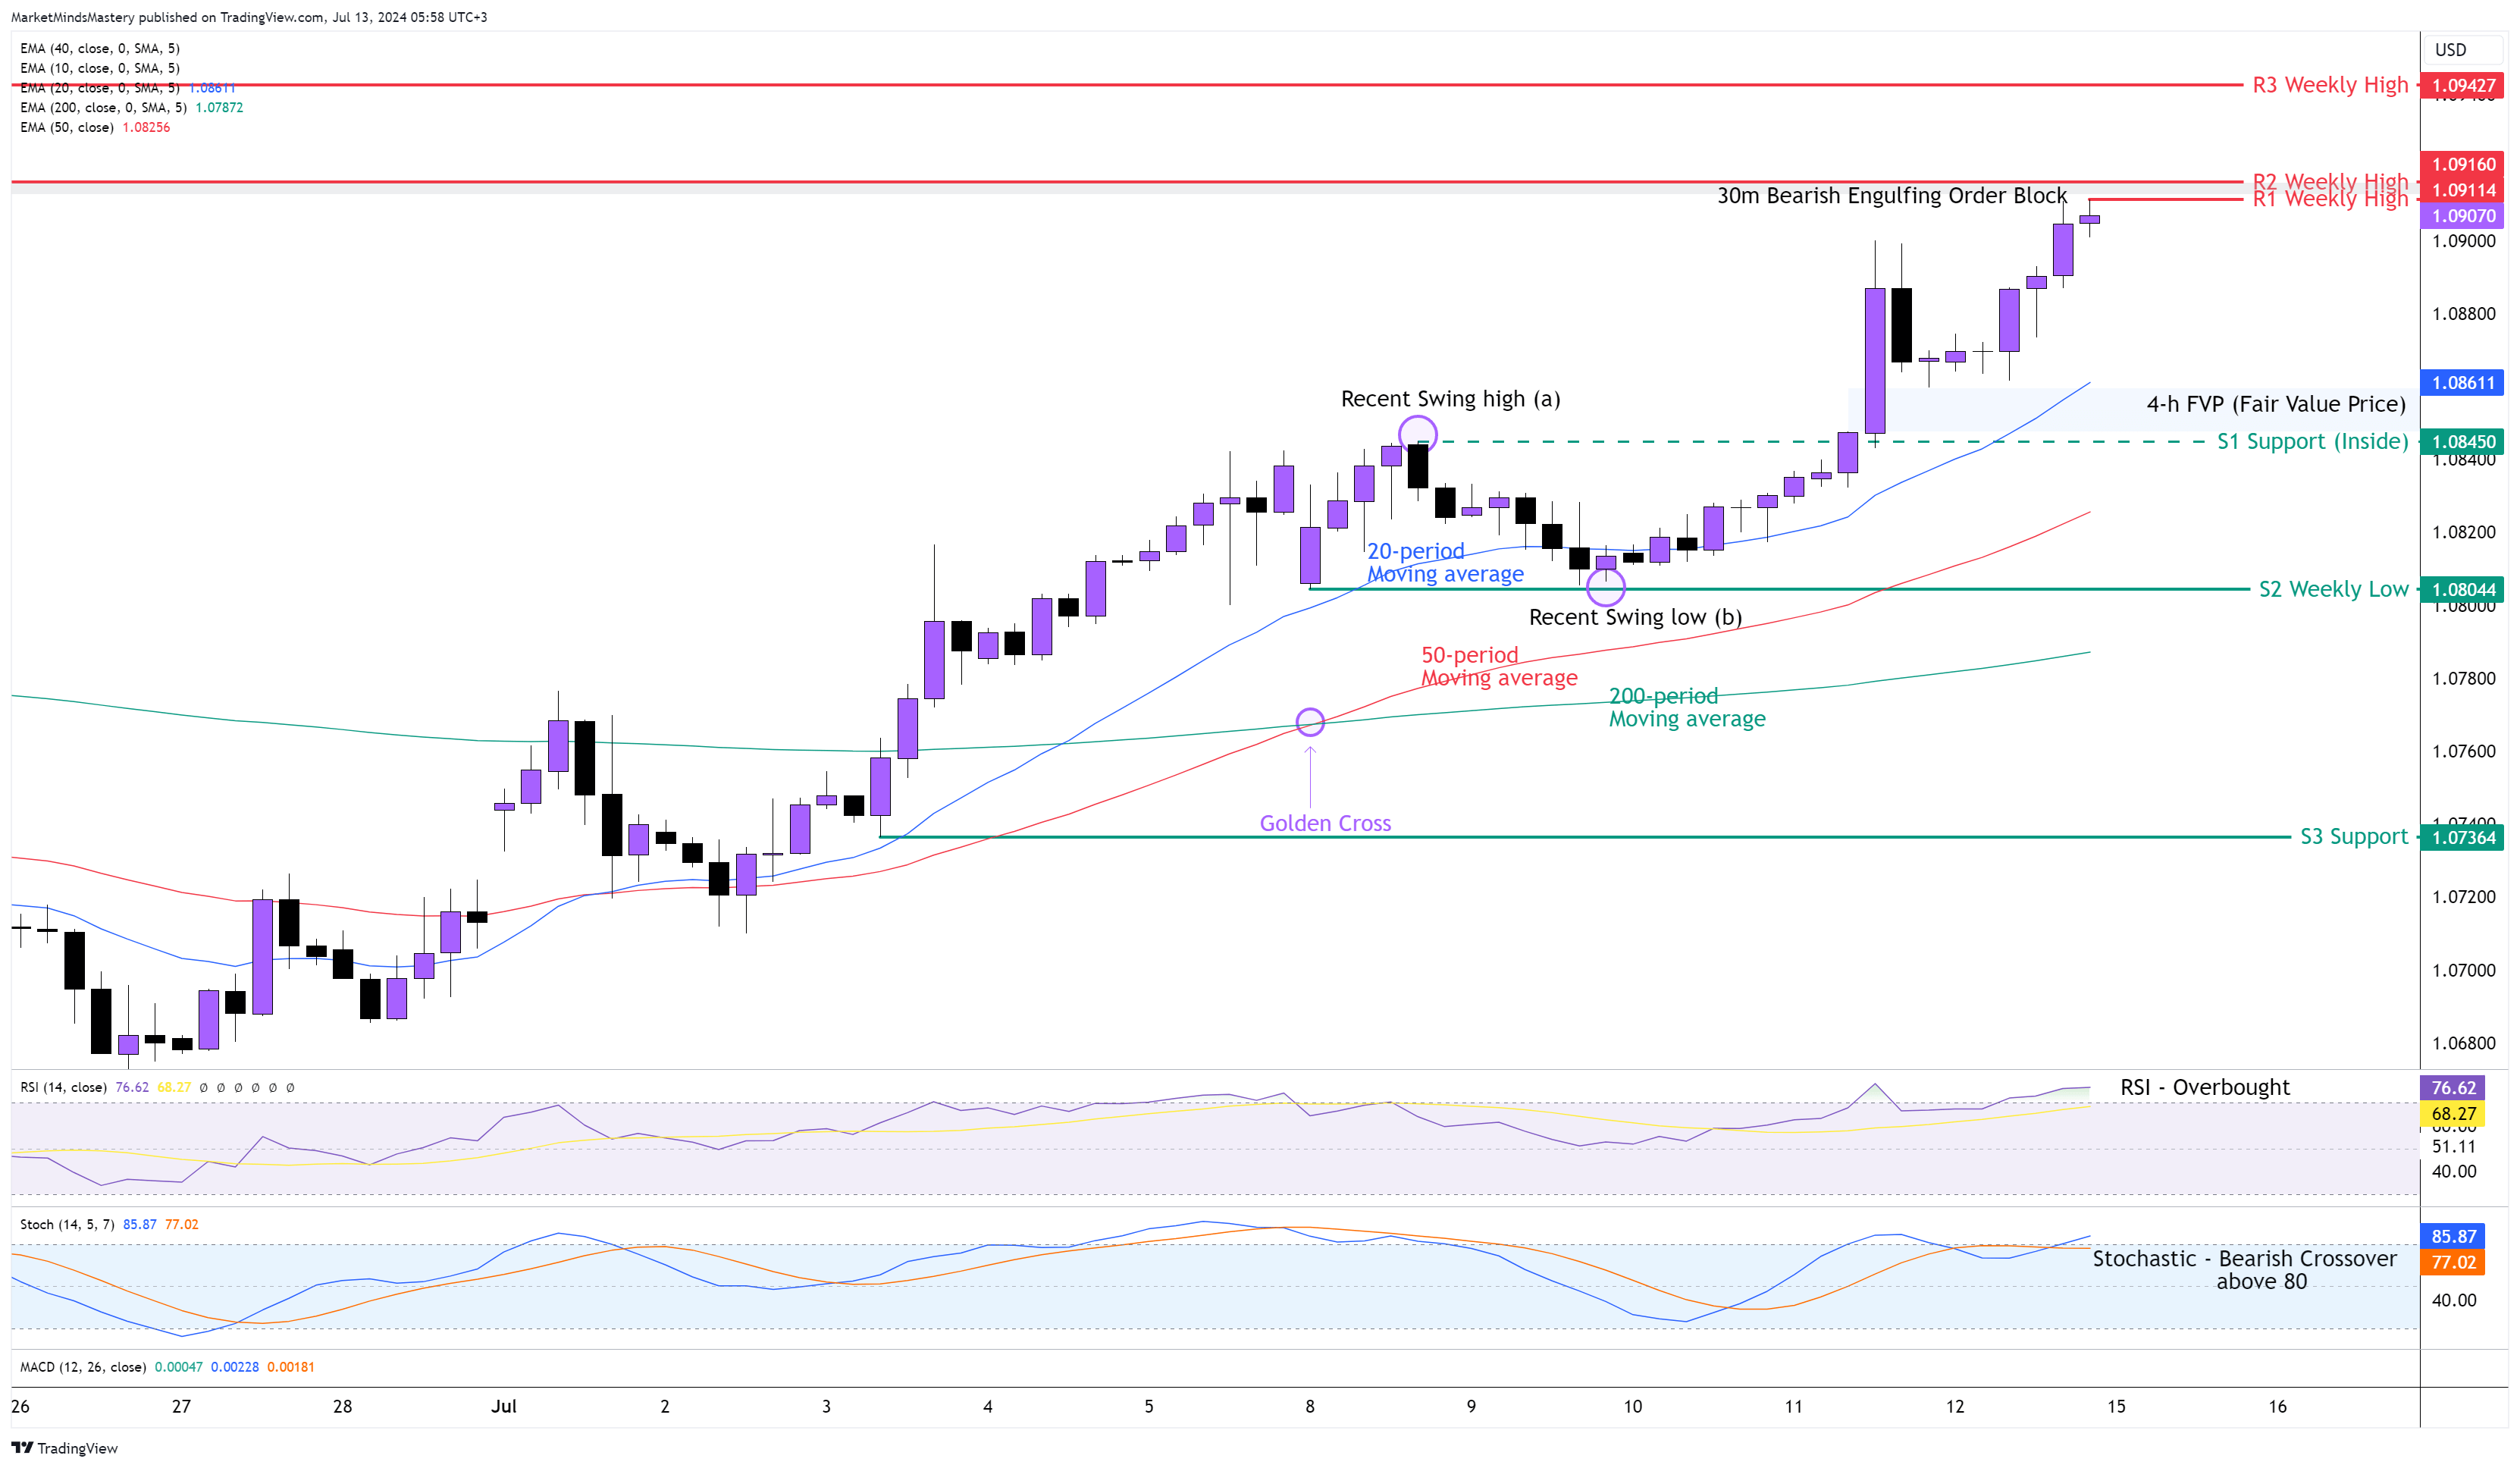
EUR USD 4H

The negative CPI in the US last week fueled the uptrend on the EURUSD, causing the price to remain above the fast 20-period moving average on the 4-hour chart. This explains the market’s strengths in a way that the price corrections are shallow. The weekly candle closed as a Bullish Marubozu, indicating a significant imbalance between buy and sell orders on the currency pair. On the 4-hour chart, since last Tuesday, the price didn't make any retracement. It kept rising, with the Bullish candles becoming larger and more in quantity. The 50-period now crossed above the 200-period moving average, creating the Golden Cross. The RSI Oscillator is at its peak above the 70, indicating a strong bullish upward move in the market.
Similarly, the Stochastic Oscillator reached its extreme area, and it showed a Bearish Crossover, which is an indication of potential price correction. The price, while rising last Thursday, left behind an FVP (Fair Value Price), which is still “unfilled”, and it is right above the broken swing high at point (a), which in this case is the S1 inside Support. As the price didn't make a swing high last Friday, it is not possible to use the Fibonacci Retracement to identify retracement levels. Therefore, if the price continues to move upwards, the first resistance area, R1, will be the previous week’s high, around 1.09114. Only 5 pips (50 points) above the R1 is the next resistance R2, around 1.0916. In case the price is rejected and moves downwards, the first support area, S1, will be the S1 support (inside) around 1.08450. It is above the FVP and around the 20-period dynamic moving average, making this price level significant. If the price penetrates the S1 and moves downwards, the next support area, S2, will be the previous week’s low, around 1.08044.
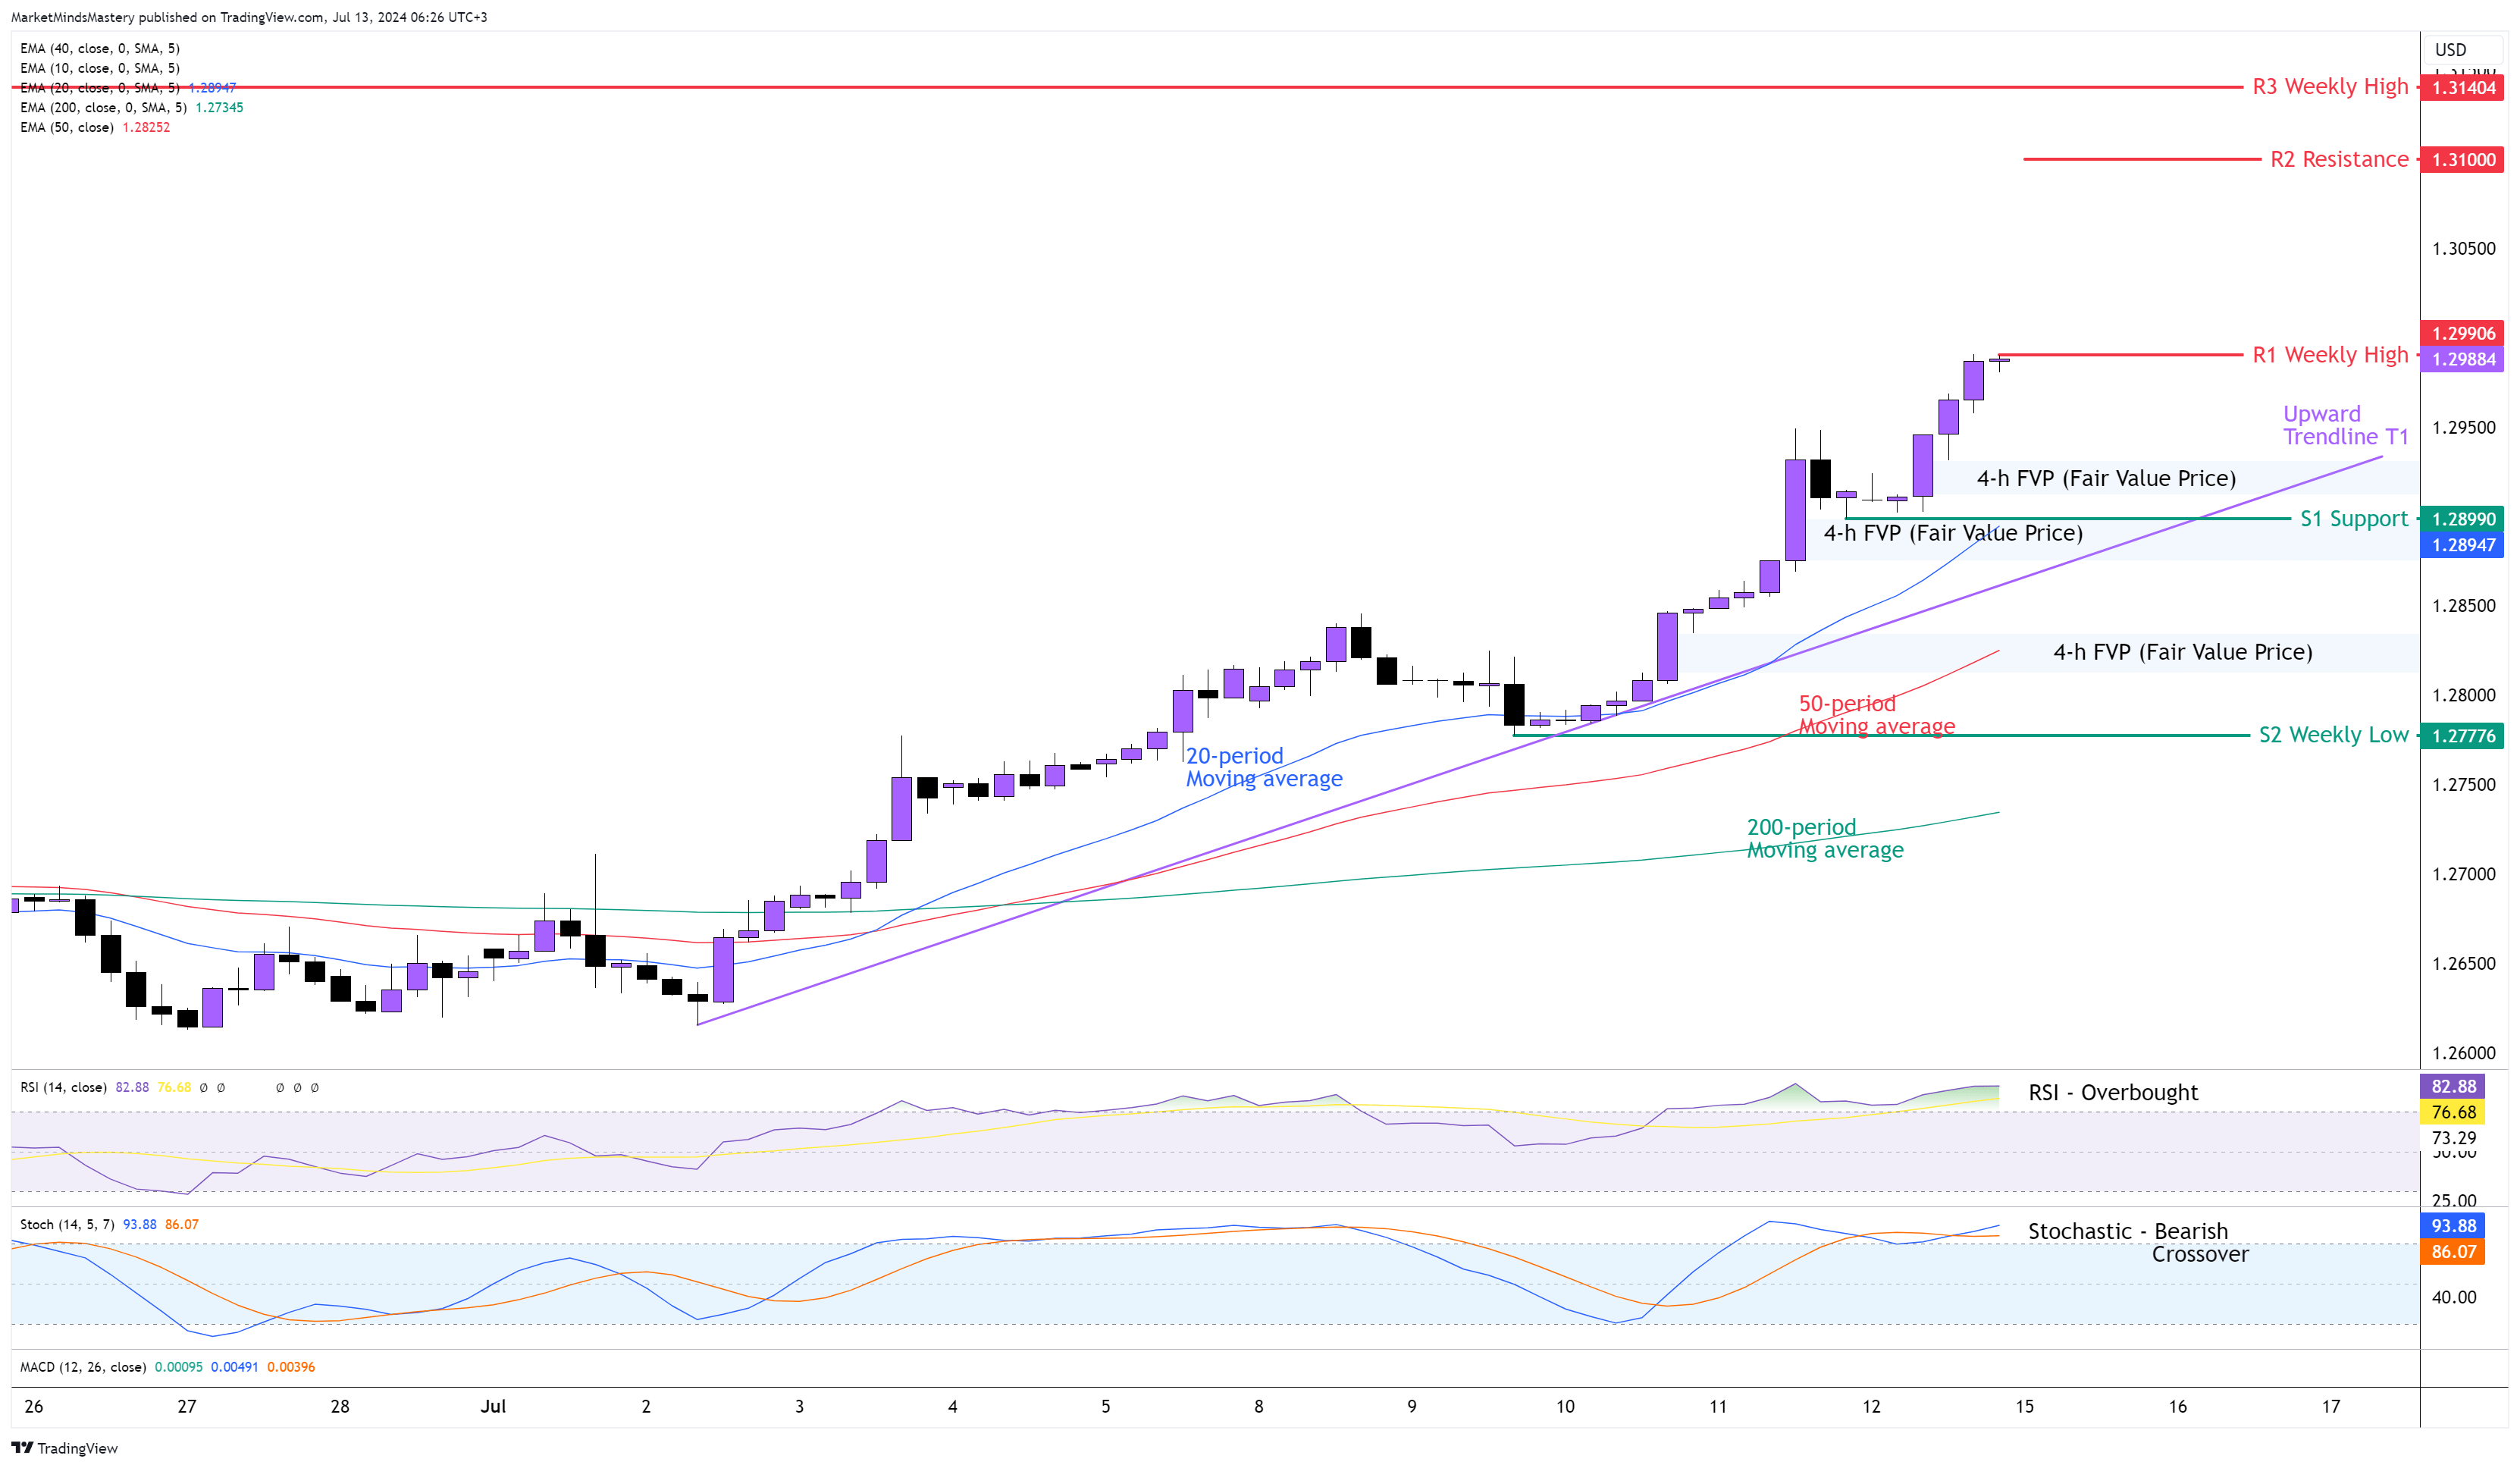
GBP USD 4H
Following the previous week’s market outlook, the Bullish Engulfing Candle on the weekly chart caused the price to move further upward last week.
Sterling was one of the strongest currencies overall last week. Considering the US Dollar’s weakness, the GBPUSD currency pair rallied, maintaining an uptrend with higher highs and higher lows on the 4-hour chart. The price is in a steep uptrend as it is far away from the Upwards Trendline T1. The 20-period moving average is above the 50-period moving average, and the 50-period is above the 200-period. This is a bullish indication.
Additionally, the RSI Oscillator has been in an overbought condition since the middle of last week. The Stochastic created a Bearish Crossover, which is above 80, which indicates that a price correction is possible. As the upward move was robust last week, the price left a lot of FVP (Fair Value Price) areas behind.
Starting Monday, if the price continues to move upwards, the first resistance area, R1, will be the previous week's high, approximately at the same price level as the weekly candle close, around 1.29906. If the price penetrates R1 and keeps moving upwards, the next resistance area, R2, will be the 1.31000 level. If the price penetrates the R1 and keeps moving upwards, the next resistance area, R3, will be an older weekly high of around 1.31404. Oppositely, if the price declines and moves lower, the first support area, S1, will be around 1.28990. This price level is between 2 FVP areas. If the price closes below the S1, it will cause a break of the upward Trendline T1, and this will signal the end of the current uptrend. Then, the next support area, S2, will be the previous week’s low, around 1.27776.
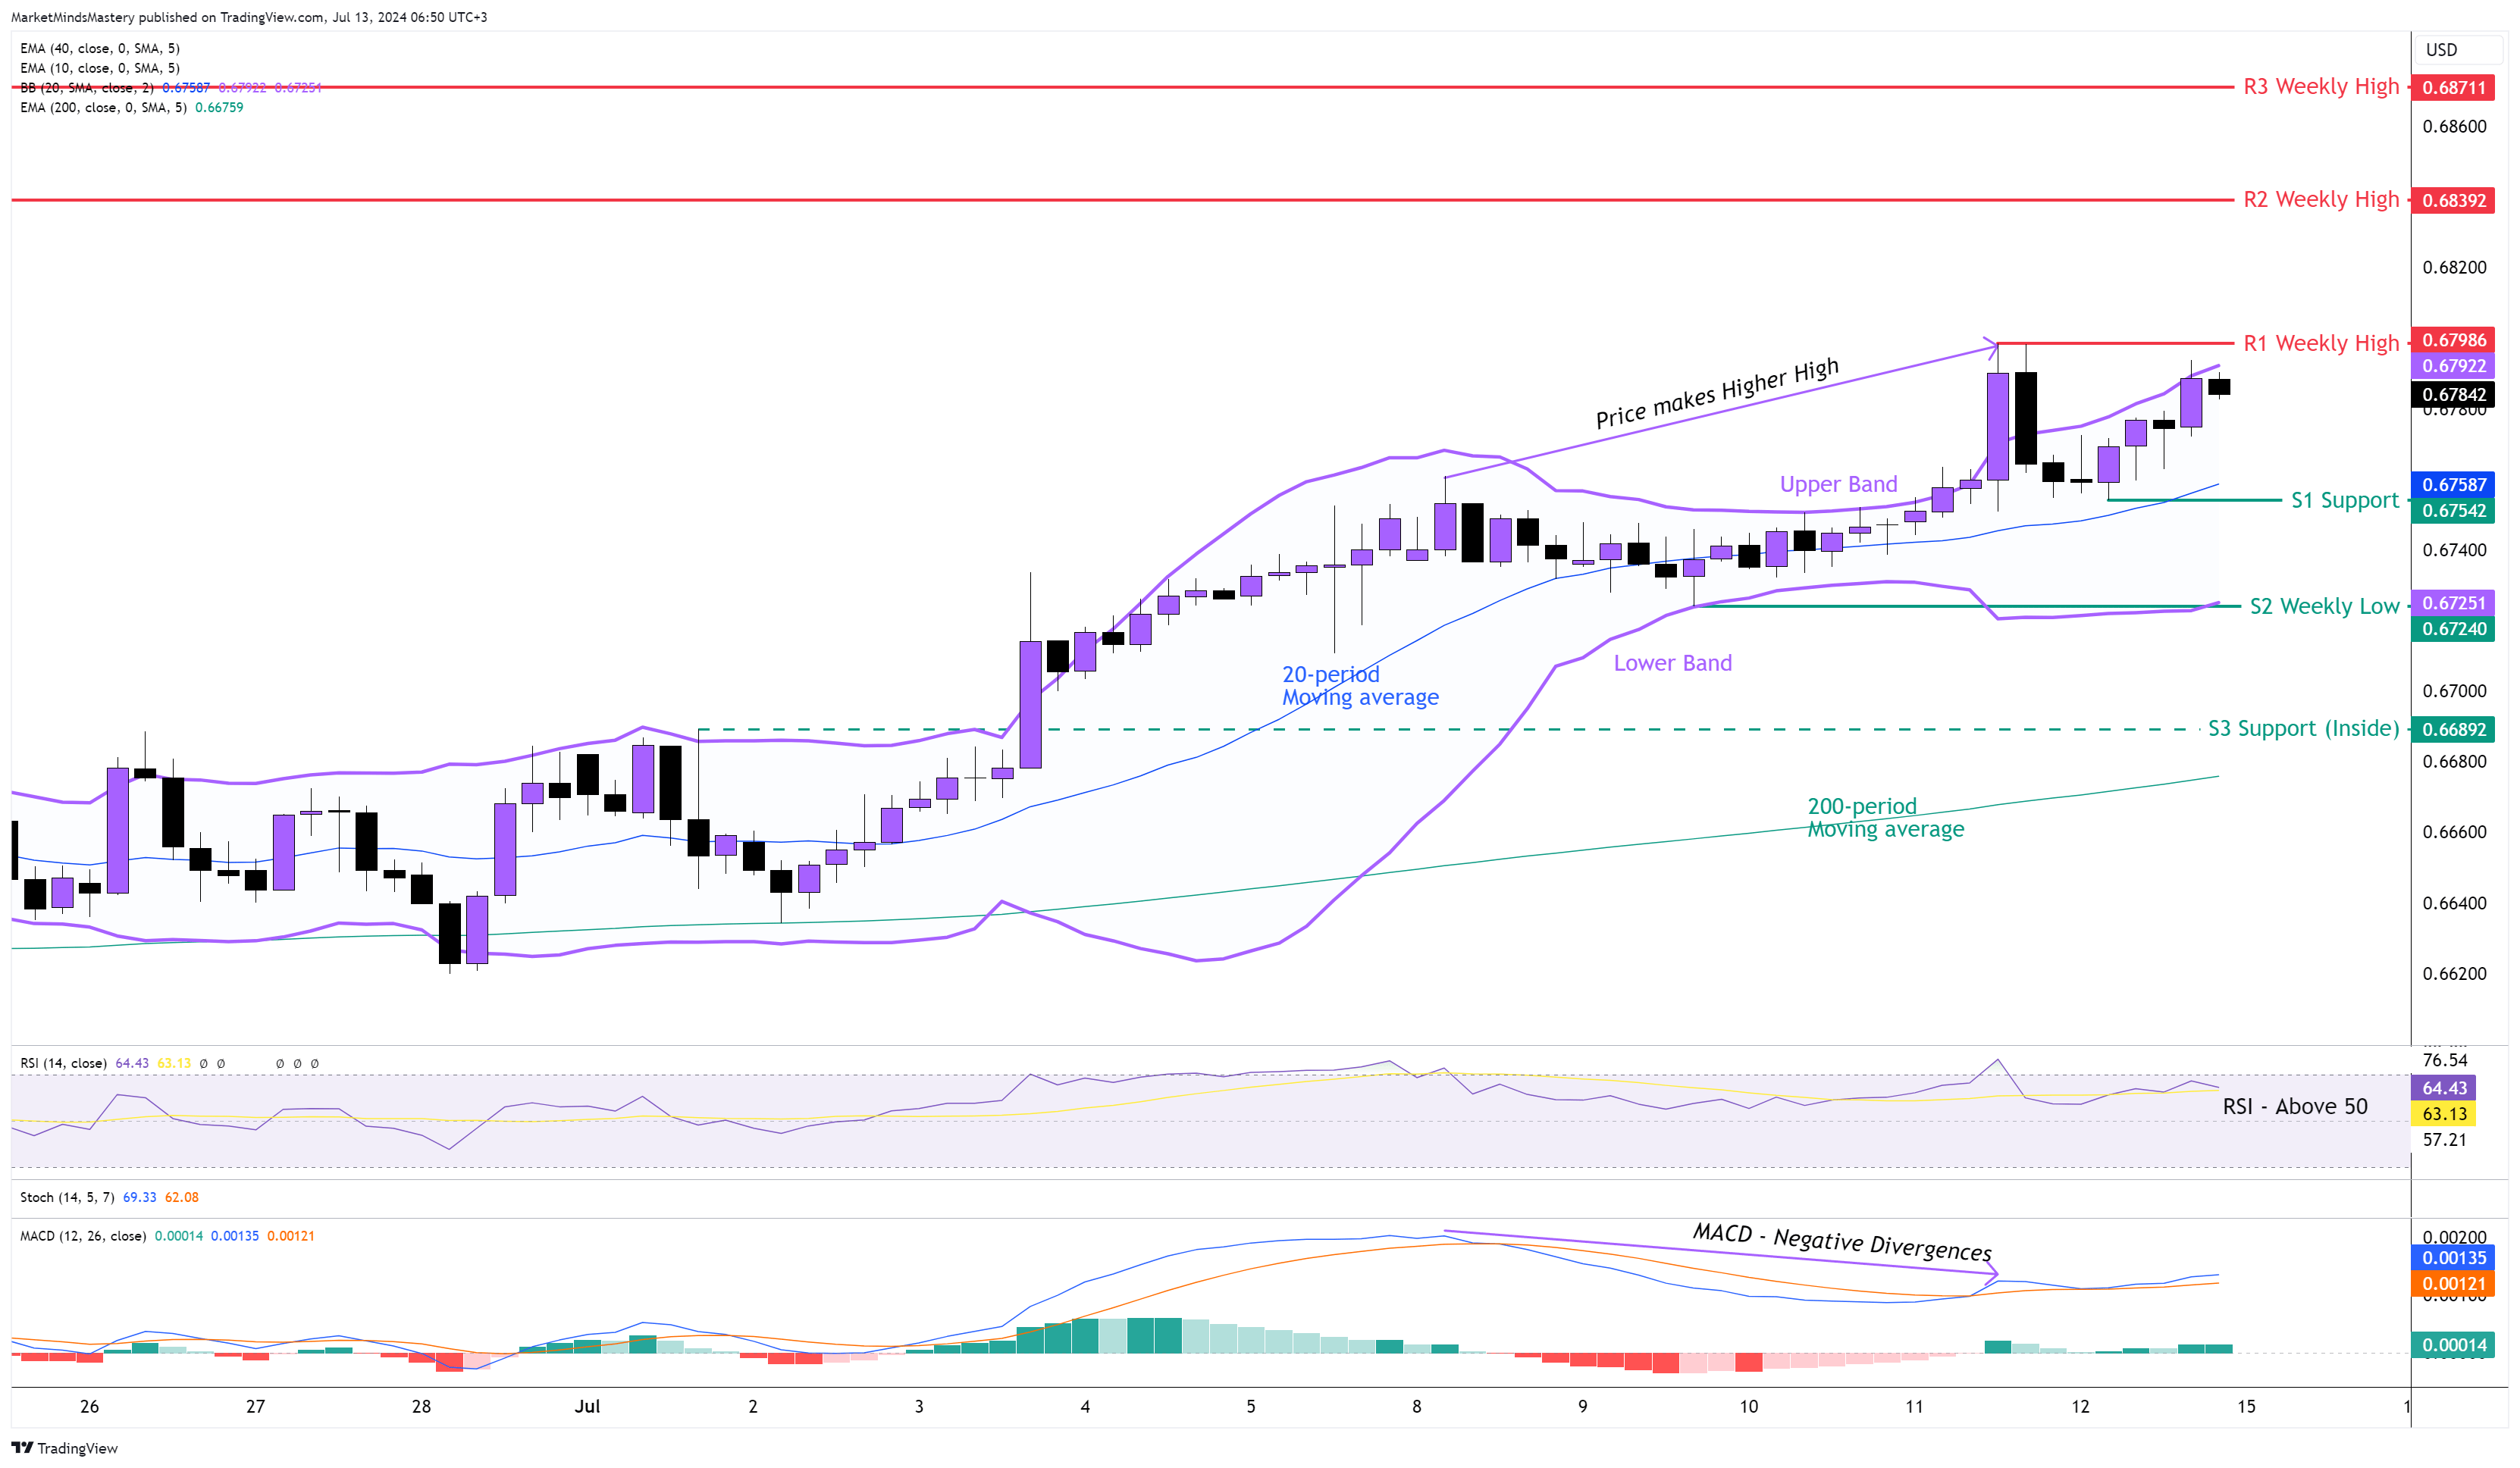
AUD USD 4H
Although the Australian dollar was not as strong as the EURUSD and the GBPUSD last week, the price broke and closed above the previous week’s high. The weekly candle didn't accumulate a significant amount of volume, but it was enough to create a higher high and higher low point on the 4-hour chart. Using the Bollinger Bands, the price has traded around the upper band since last Wednesday. Currently, the price is above the 20-period moving average, which is the middle line of the Bollinger band, and this is bullish. The RSI is above 50, which has bullish implications. The MACD printed Negative Divergences, which caused the price to enter into a corrective phase. If the price keeps trading around the Upper Band and moves upwards, the first Resistance area, R1, will be 0.67986, which is the previous week’s high. If it penetrates the R1 and keeps increasing, the next resistance area R2 will be 0.68392, which is an older weekly high. If the price moves above the R2 and keeps increasing, the R3 resistance will be 0.68711.
On the contrary, if the price declines and moves downwards, the first support area, S1, will be 0.67542, which is above the 20-period moving average. If the price penetrates the S1 and declines further, then the next support area, S2, will be the previous week’s low, around 0.67240, which is at the same price level as the dynamic Lower Band of the Bollinger Band indicator. A further downward move will find the next support, S3, approximately at 0.66892.
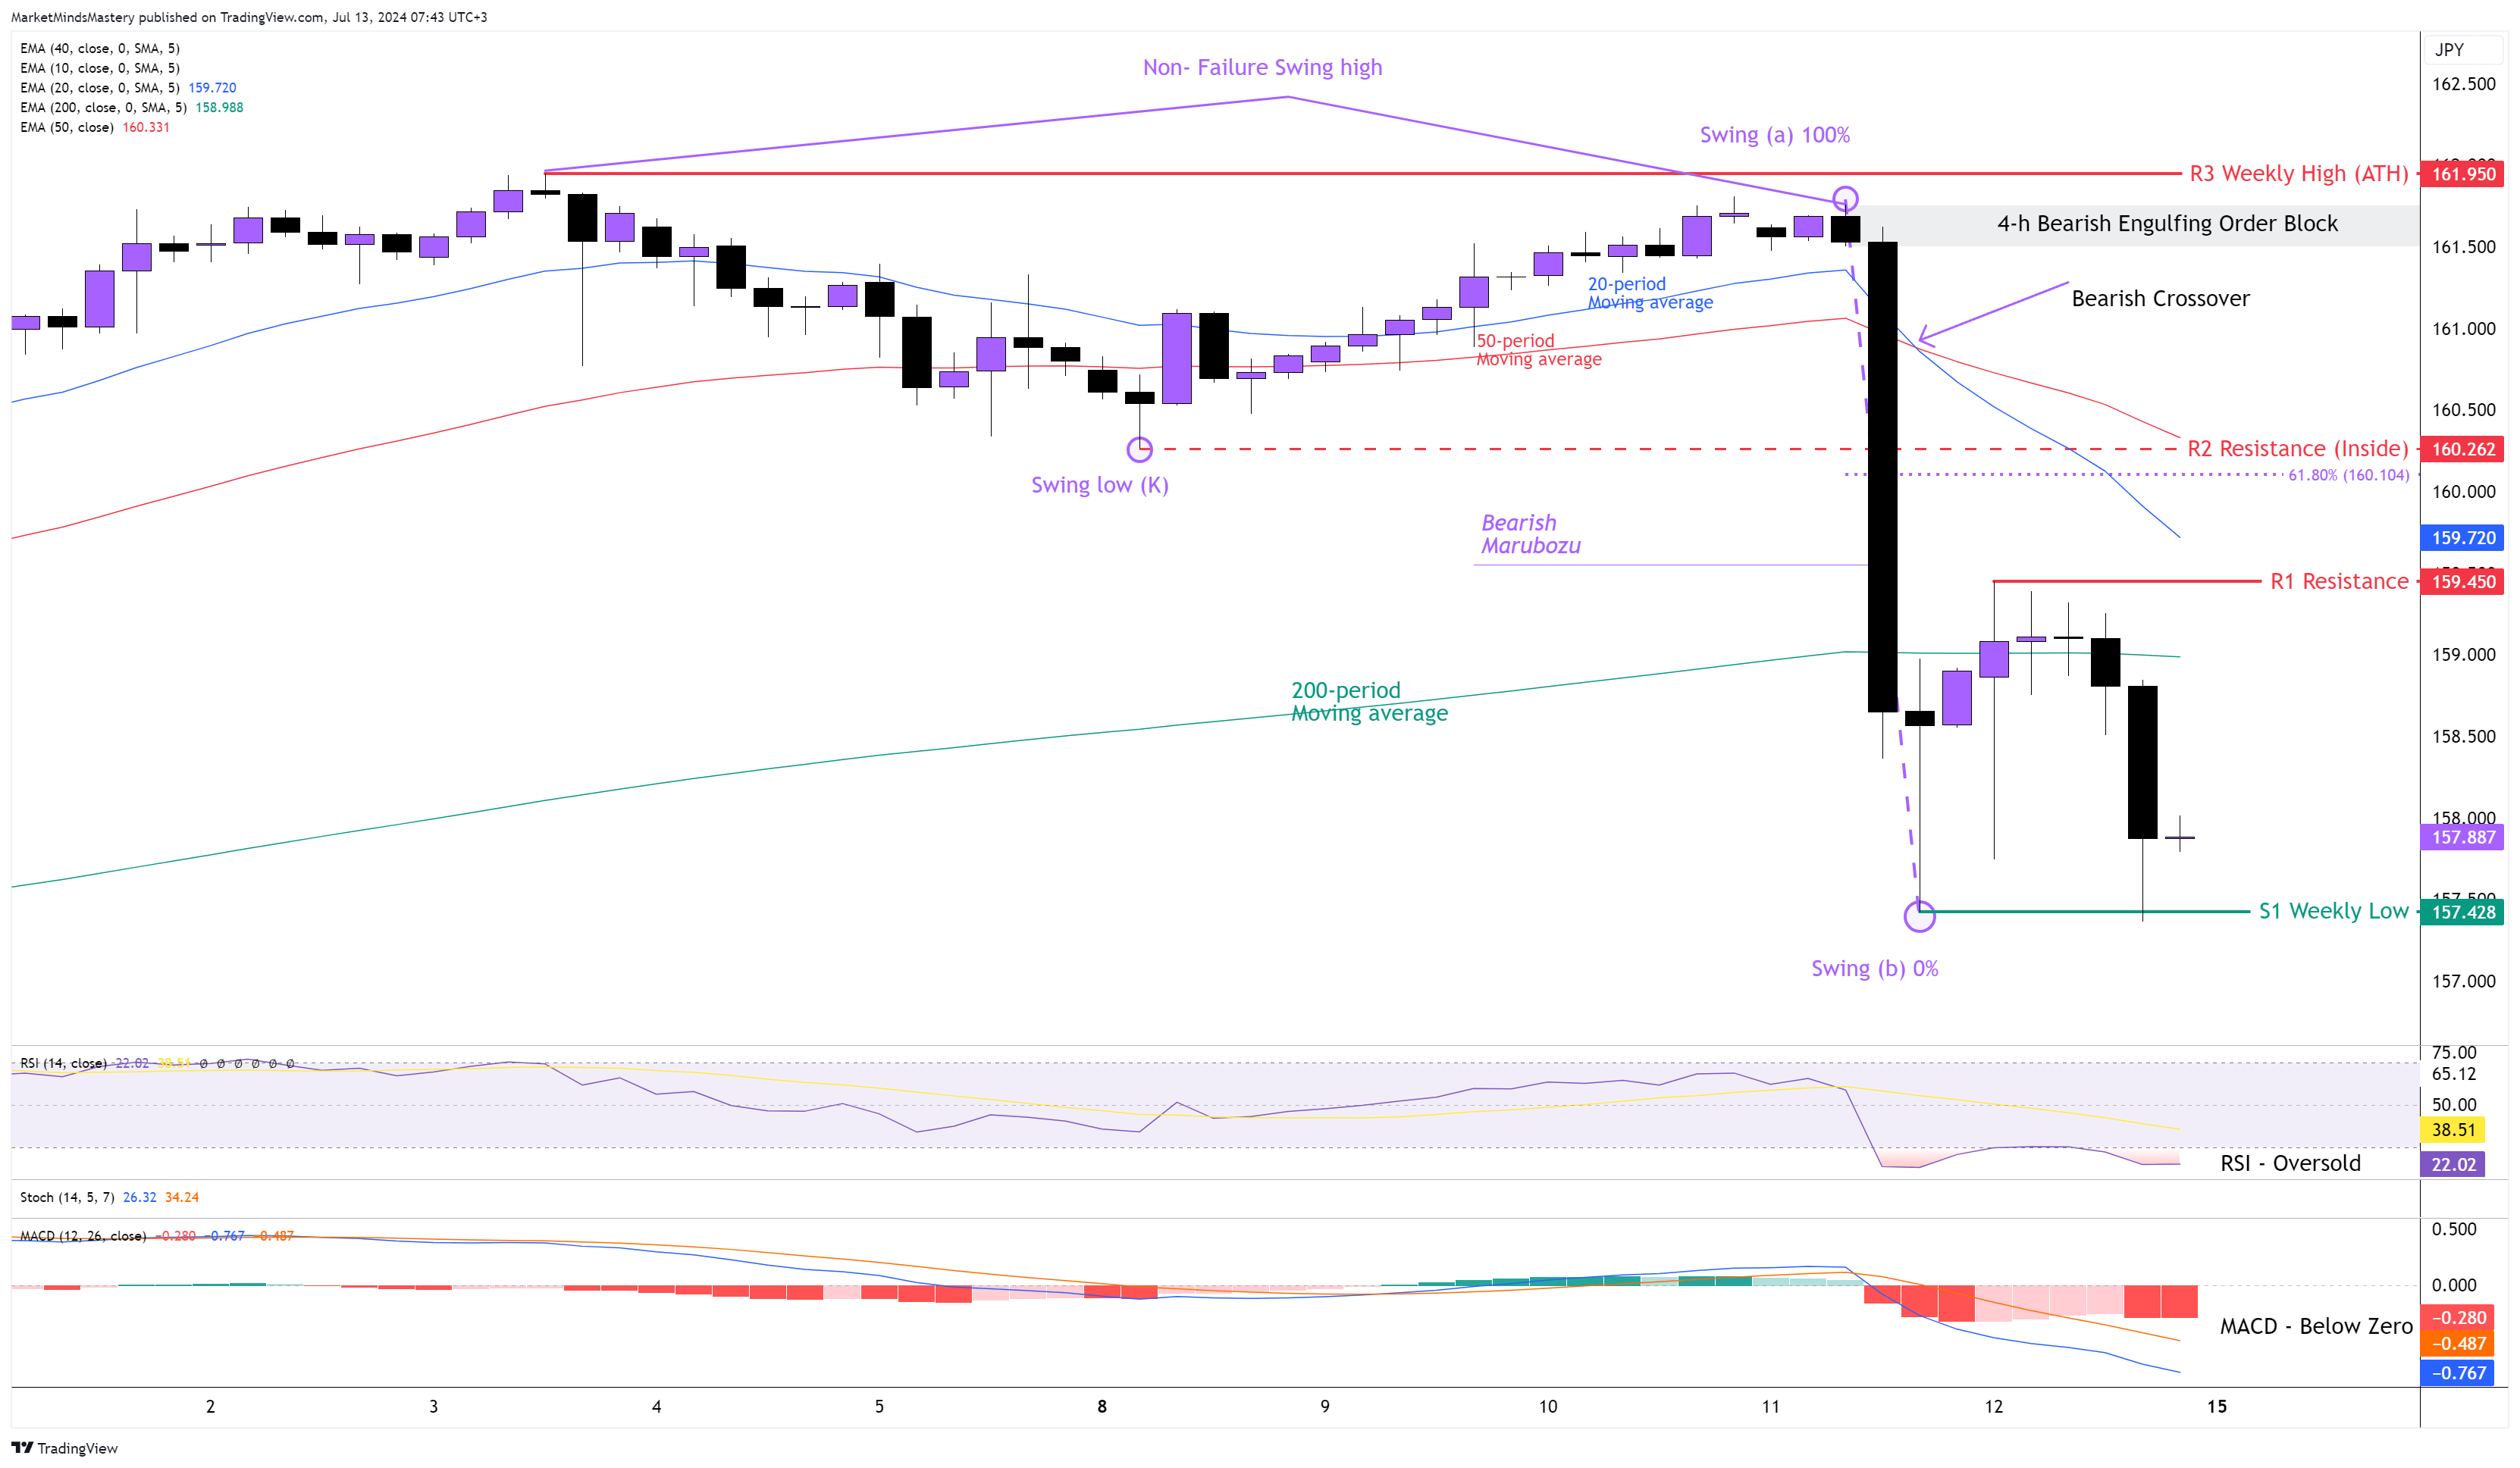
USD JPY 4H
Following last week’s market outlook, the doji candle on the weekly chart caused the price to decline by approximately 300 pips just during the CPI announcement in the US. The weekly chart is still in a strong uptrend, and last week’s price decline put the market into a corrective phase or retracement. On the 4-hour chart, the price created a Bearish Marubozu candle that penetrated the swing low at (K) and caused the Non-Failure Swing high at the ATH (All-Time High) around 162. Additionally, the same candlestick penetrated the 200-period moving average, and the price closed below it, and this indicates a strong downward move. The 20-period crossed below the 50-period moving average, which is bearish. The price made lower highs and lower lows formation, signifying the beginning of the downtrend on this 4-hour chart. The RSI is well under the 30 area, making the Oscillator oversold, and this has bearish implications. The MACD is below zero and has a declining histogram, as seen on the chart, which is also a bearish sign. Starting Monday, if the price keeps its downward move, the first support area, S1, will be around 157.428, which is the previous week’s low. If the 4-hour downtrend continues, the price must penetrate and close below the S1. If this happens, then the next support area will be the 155.720, which is an older weekly low price level.
On the other hand, if the price finds support, bounces off and moves upwards, the first resistance area, R1, will be around 159.450. If the price penetrates the R1 and moves upwards, the next resistance area, R2, will be 160.262, which is an inside resistance. This is a significant level as it aligns with the Fibonacci Golden Ratio of 61.8%.
USD CHF 4H
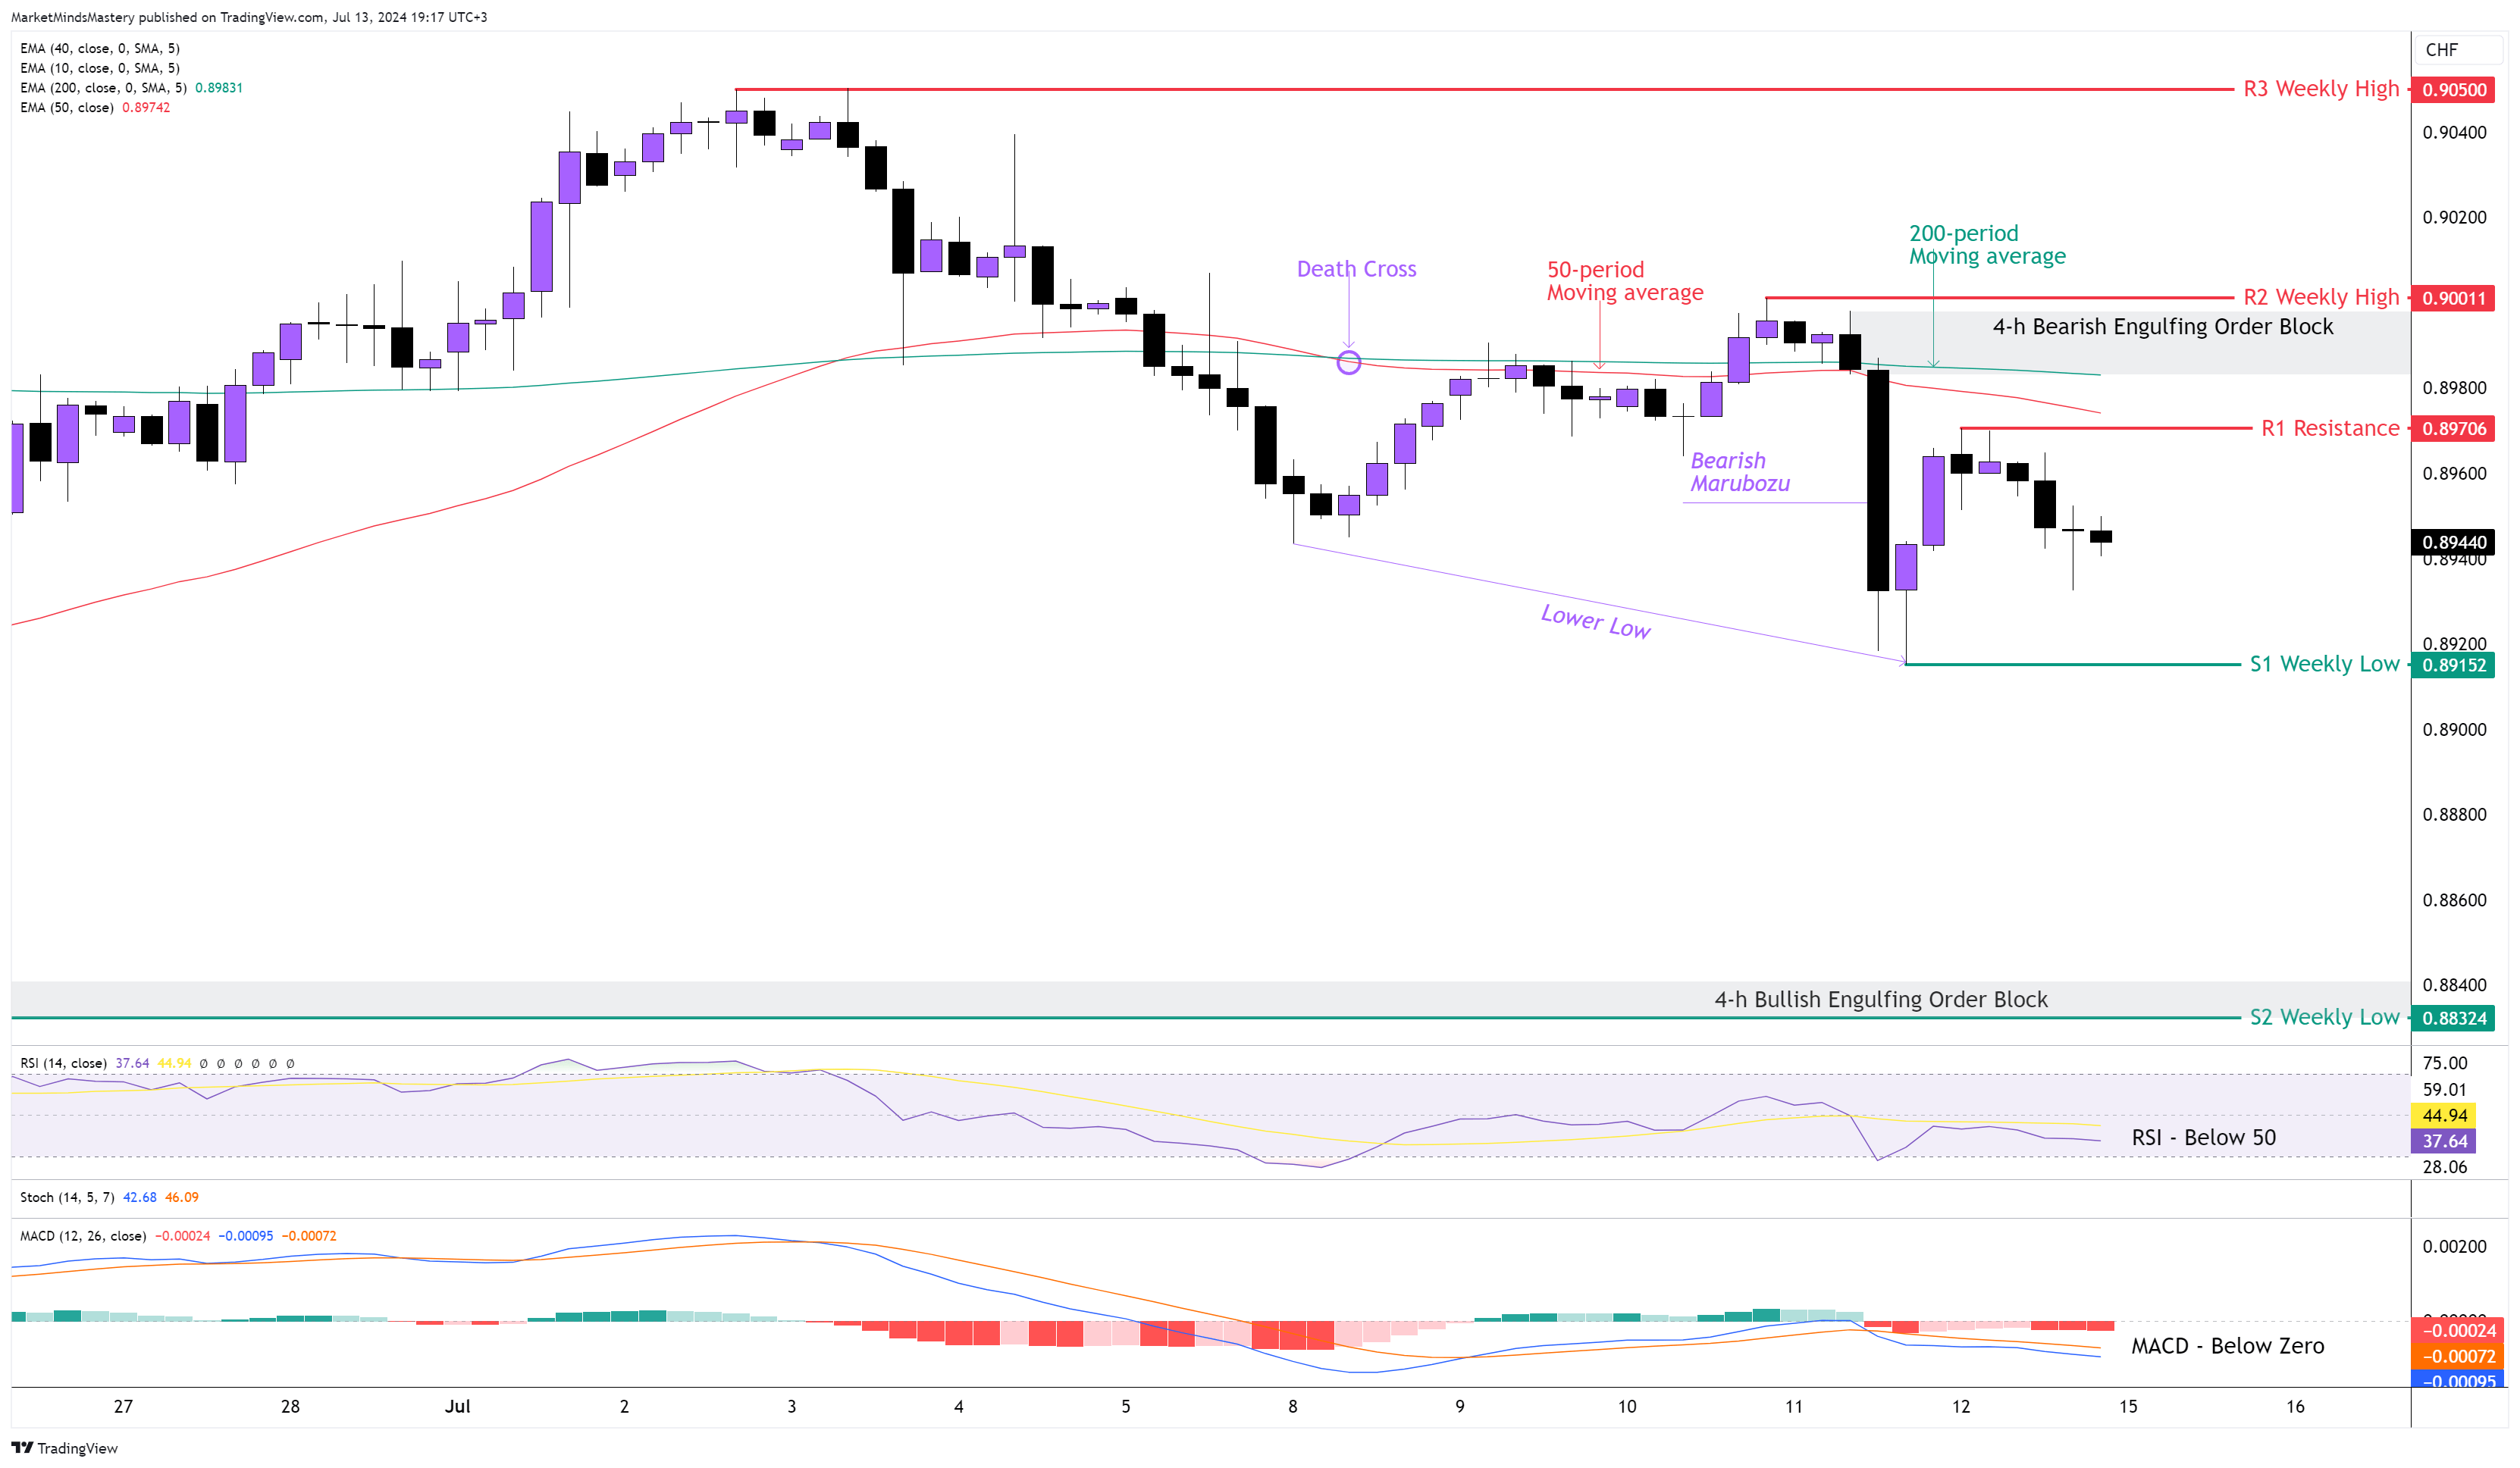
Following the previous week’s weekly outlook, the price kept the lower highs and lower lows formation. It continued its downward move as the macroeconomic part supported a weak US Dollar because of the US CPI report. The price moved all the way until the S2 weekly support entered the Bearish Engulfing Order Block, which we pointed at on the chart and bounced off. The 50-period crossed below the 200-period moving average, and this has bearish implications for this 4-hour timeframe. The Bearish Marubozu candle that caused the price drop last Thursday also created a new market structure of a lower low. The RSI remains below 50 and this has bearish implications. The MACD also remains below the zero line and this is also bearish. Starting Monday, if the price continues moving downwards, the first support area, S1, will be the previous week’s low, around 0.8915. If the price breaks below the S1 and keeps moving downwards, it means that the downtrend will continue, and the next support area, S2, will be around 0.8832, which is another weekly low. At this price level, a Bearish Engulfing Order Block form hasn’t been tested yet.
On the other hand, if the price bounces off and moves upwards, the first resistance area, R1, will be approximately 0.8970, and it will be below the 50-period and the 200-period moving averages. If the price manages to penetrate the R1 and moves above it, and the candlestick closes above it, it will find the next resistance area, R2, around 0.9000. This will be a significant price level as there is a recent Bearish Engulfing Order Block that caused the downward move last week. If the price moves above the R2, it will change the market structure and will invalidate the current market’s downtrend.
GBP JPY 4H
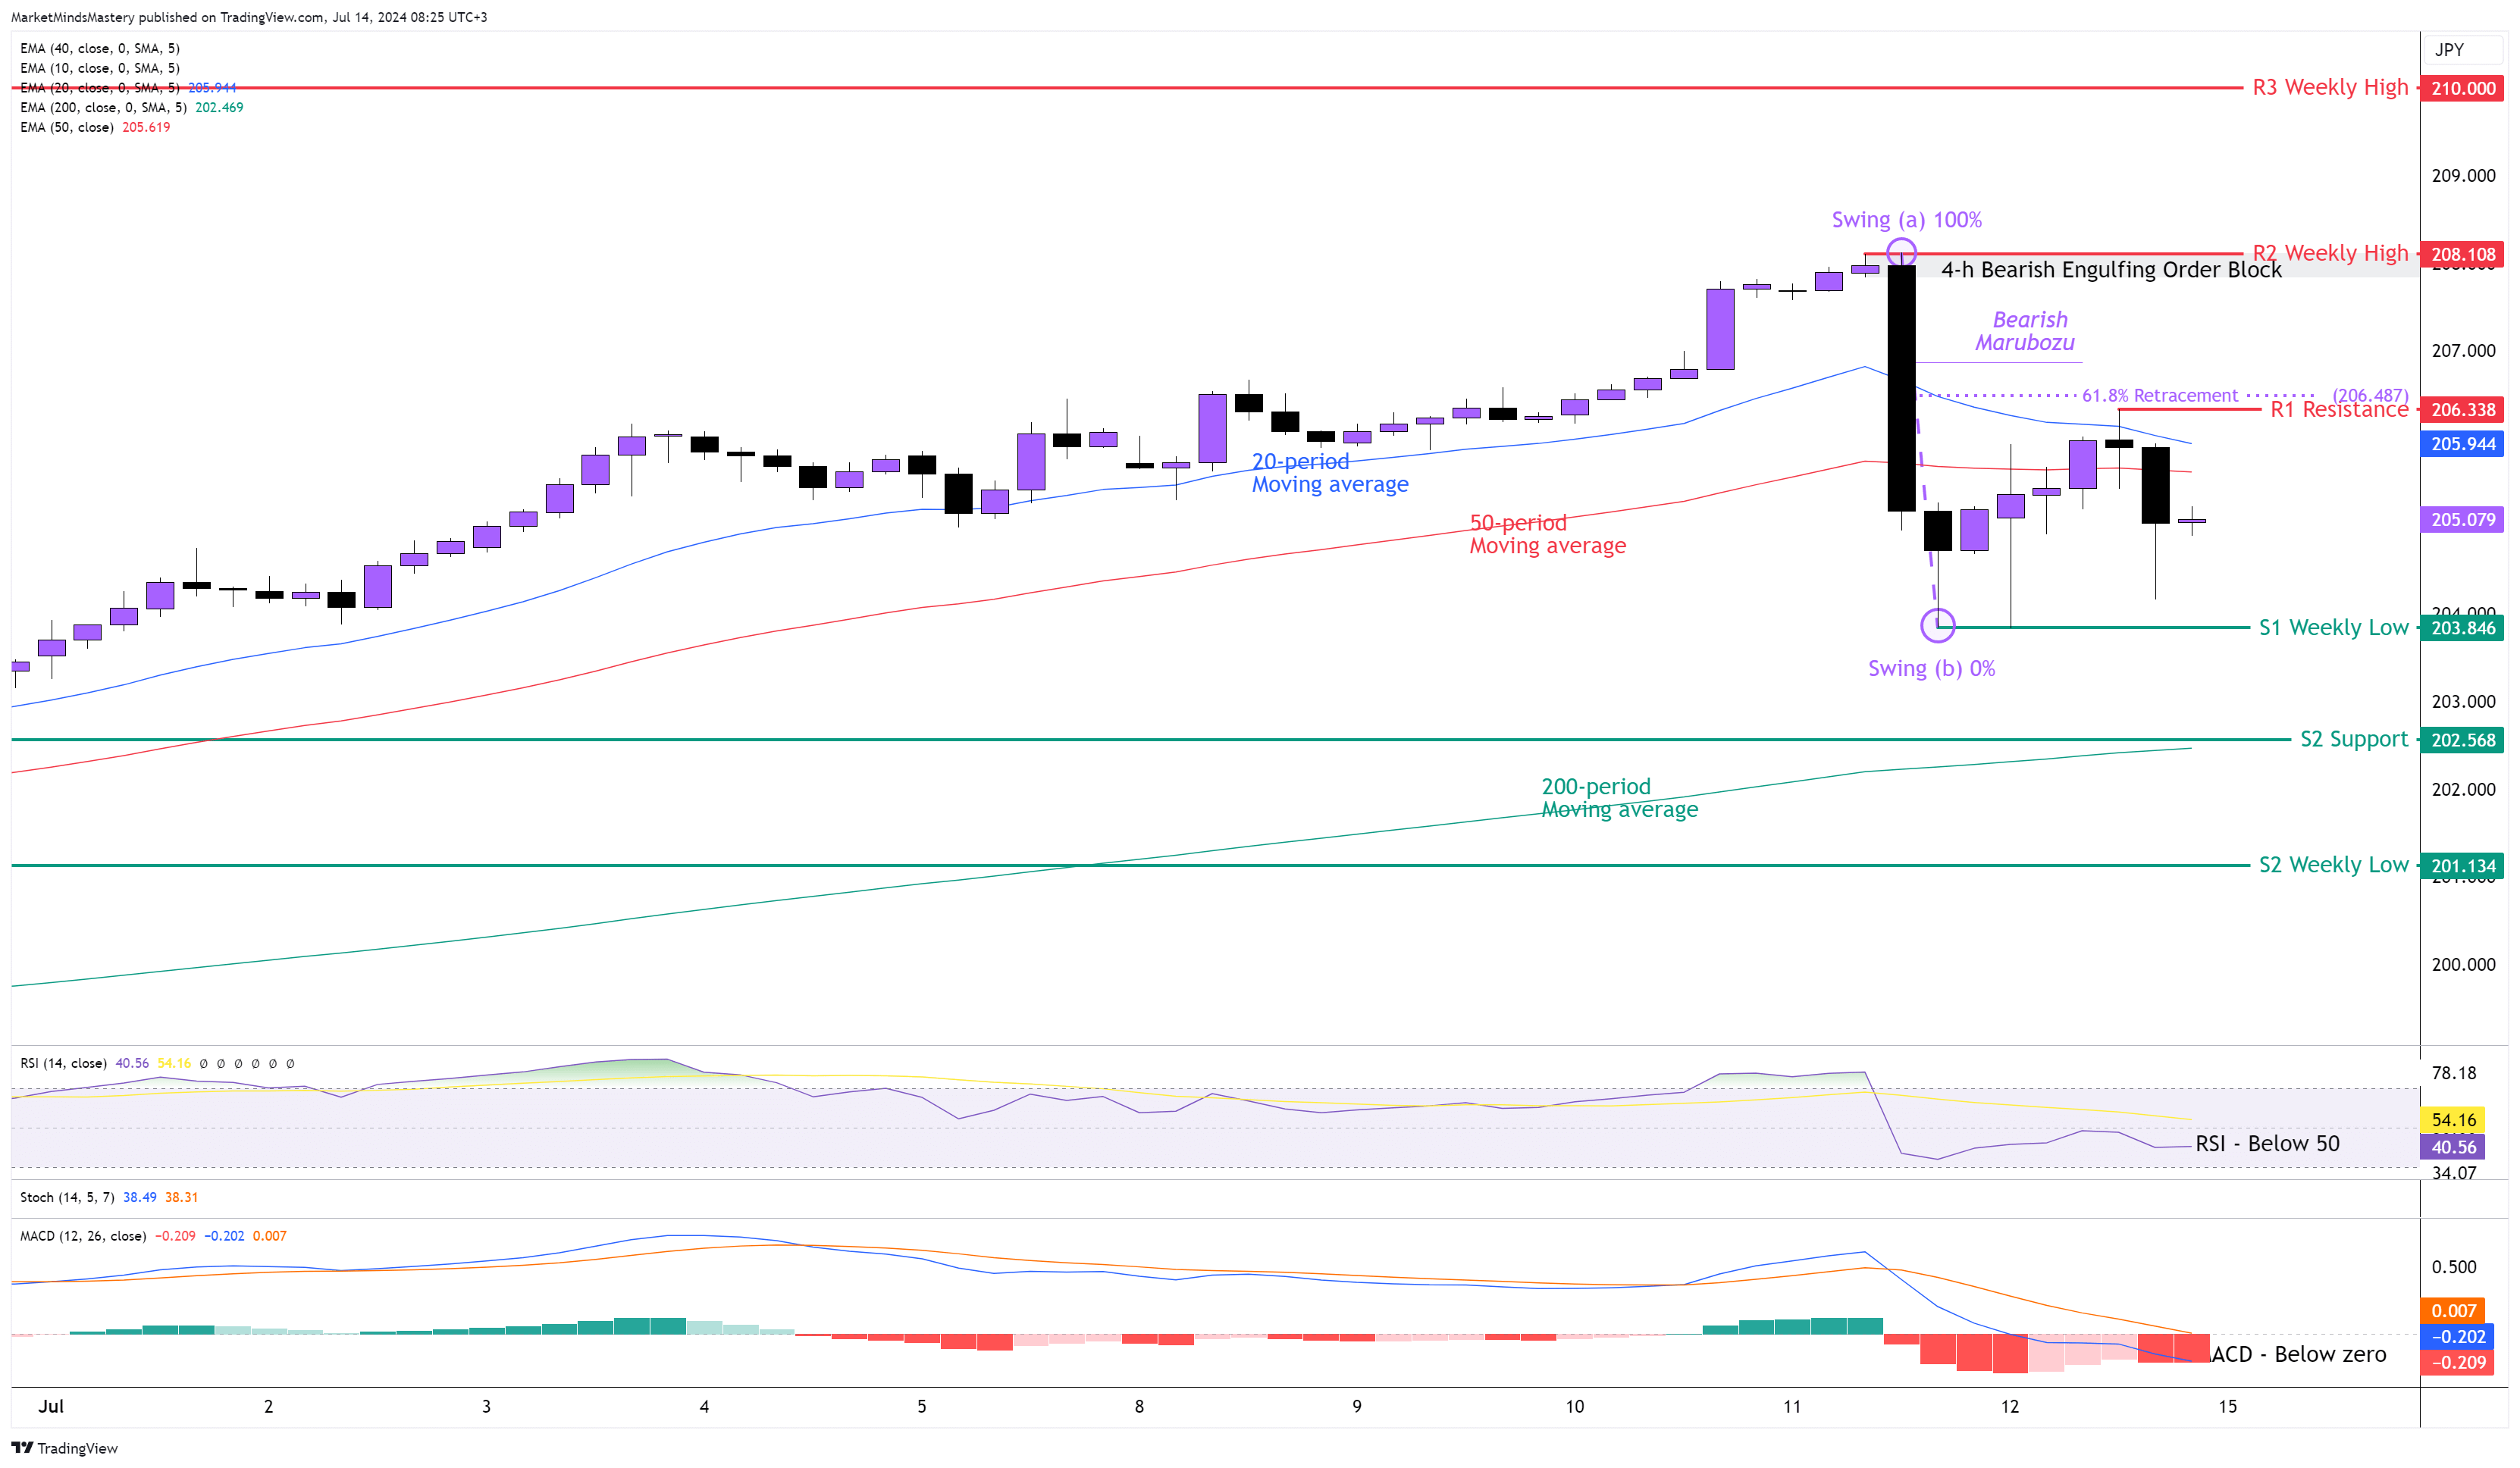
Following the previous week’s bullishness, the market kept rising, and the price continued to make higher highs and higher lows on the weekly chart. However, the Weekly candle ended as a Doji. As this happens after an extensive uptrend, this weekly price action pattern can set the market into a downward retracement phase. Prior to that, the 4-hour Negative Divergences, based on the previous week’s market outlook, forced the price to a corrective 4-hour phaser as expected. The Bearish Marubozu candle that was created last Thursday broke the market structure of the 4-hour chart. Based on the swing analysis, if the swing at point(b) penetrated, then a 4-hour downtrend would follow. The 20-period is still above the 50-period moving average, and this has bullish implications. However, the RSI is below zero, and this indicates a downward price momentum. The MACD and its Histogram are both below zero, and this is bearish. Last Friday, the price was rejected around the 20-period moving average and the 61.8% Fibonacci level and moved downwards. If it continues the downward move, the first support area, S1, will be the previous week’s low, around 203.846. If it penetrates the S1 and declines more, the next support area, S2, will be approximately 202.56. The 200-period moving average is around the same price level, and it can be an additional supporting factor to interrupt the price from moving lower. On the other hand, if the price resumes the primary uptrend, the first resistance area, R1, will be 206.338. If it penetrates the R1 and keeps increasing, then the next resistance, R2, will be the previous week’s high, around 208.108.
GOLD 4H
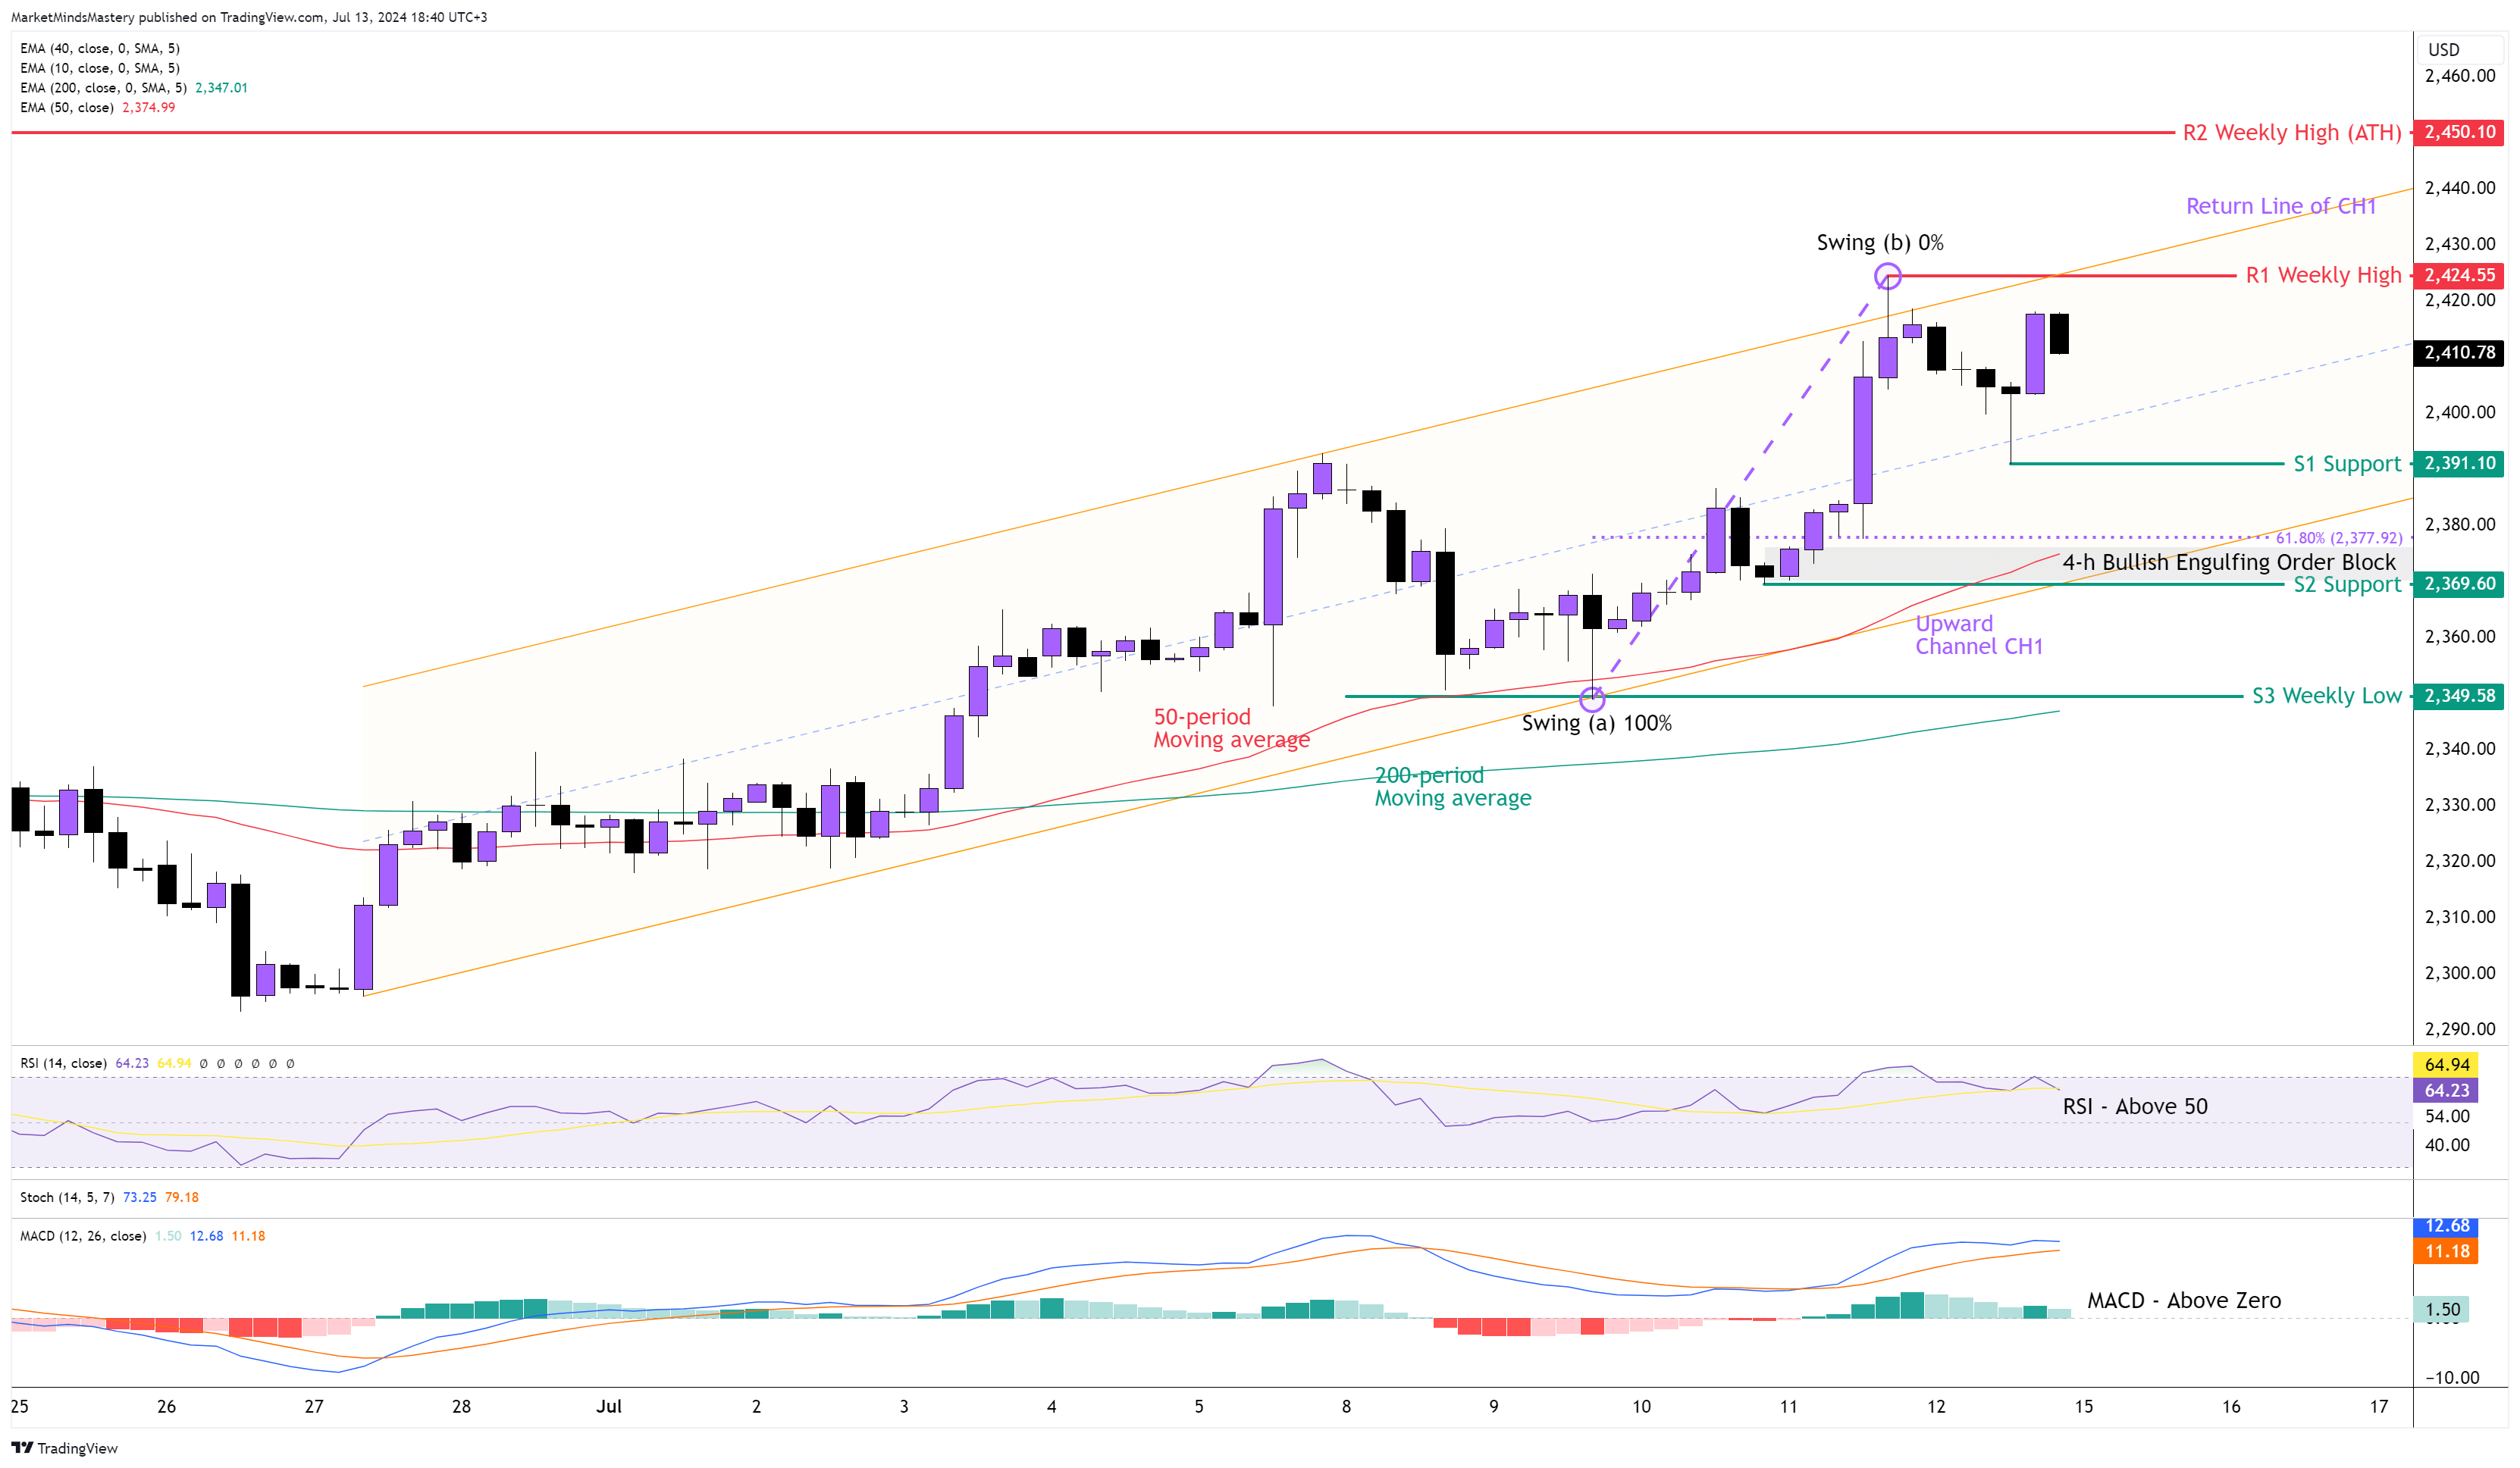
On the weekly chart, the price last week ended as a bullish candle with a long lower wick. The price approaches the ATH (All-Time High), which makes this week very promising for Gold. The price on the 4-hour chart makes higher highs and higher lows, indicating a strong uptrend. The 50-period is above the 200-period moving average, and this indicates bullishness. The price is currently moving within the Upward Channel CH1, and the current price approaches its return line, as shown in the chart. The RSI Oscillator is above 50 and very close to its Overbought area, which is a sign of market strength. The MACD is above the zero line, and this has bullish implications. If the price continues its upward move, the first resistance area, R1, will be the previous week’s high, around $2424. If the price penetrates the R1 and at the same time it closes above it, the next resistance area, R2, will be the ATH at $2450.
On the other hand, if the price declines and moves downwards, the first support area, S1, will be around $2391. Once the price penetrates the S1 and moves further downwards, the next support area, S2, will be approximately $2369. This is a significant level for the Gold because it consists of the swing low, which created the S2 support, the 50-period moving average, which can act as a dynamic support, the upwards trendline of the CH1 channel, the 61.8% Fibonacci retracement and the Bearish Engulfing Order Block. A further downward move will find the next support area, S3, at around $2349, which is the previous week’s lower price level.
USOIL 4H
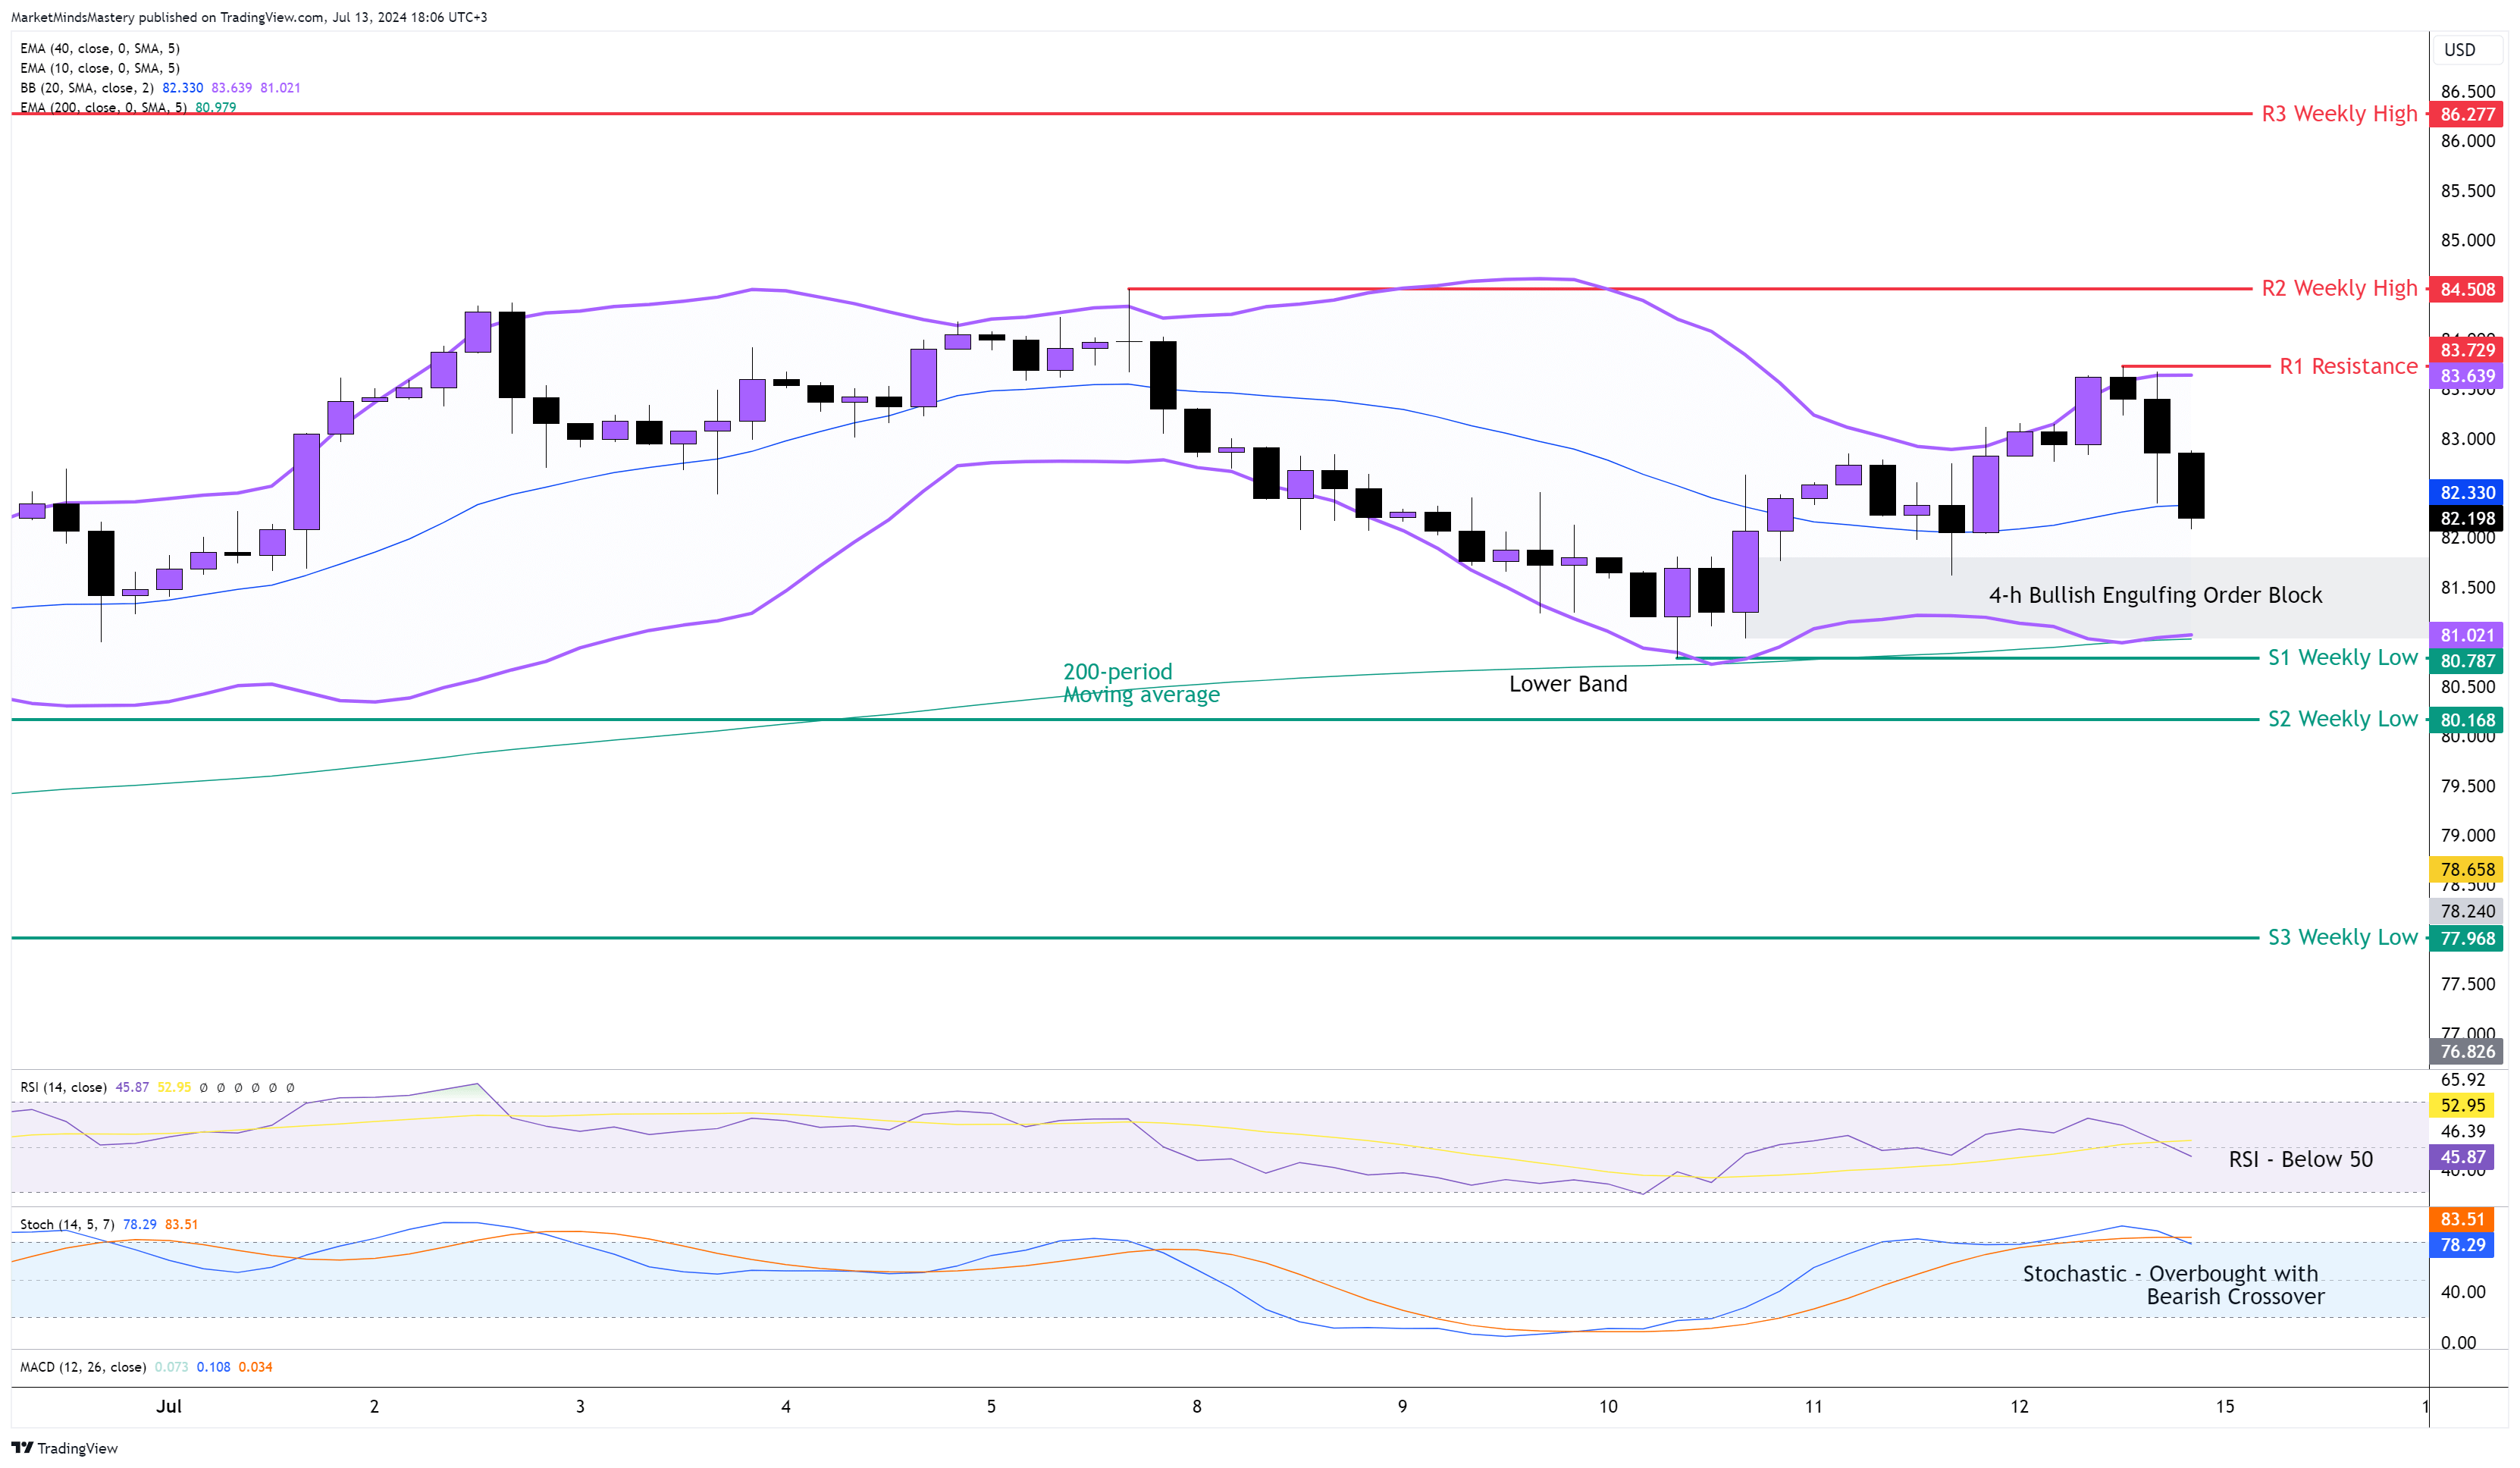
Following the successful series of higher highs and higher lows on the candles of the weekly chart, the price last week ended as a bearish candle, but it remained above the weekly moving averages. Although we do show the weekly chart on this market outlook, the weekly moving averages created a bullish crossover. On the 4-hour chart, the RSI is below 50, indicating bearishness. The Stochastic Oscillator created a Bearish Crossover after becoming Overbought, which has bearish implications. This action can cause the price to start in a corrective phase. Currently, the price is trading within the Upper and Lower bands of the Bollinger Band indicator. On Friday, the price closed below the middle slime of the Bollinger Band Indicator, which represents the 20-period moving average. If the price continues to move downwards, the first support is S1, which will be $80.78, which is the previous week’s low area. At this level, a Bullish Engulfing Order Block is formed, and it can serve as an adding supporting factor for the price. If the price closes below the S1 and keeps lowering, the next support area, S2, will be at an older weekly low of around $80.16.
On the other hand, if the price moves upwards, the first resistance area, R1, will be approximately $83.72. If the price penetrates the R1 and the candlelline closes above it, the next resistance area, R2, will be an old weekly high of around $84.50. A further upward move will set the price of the USOIL in an uptrend continuation.
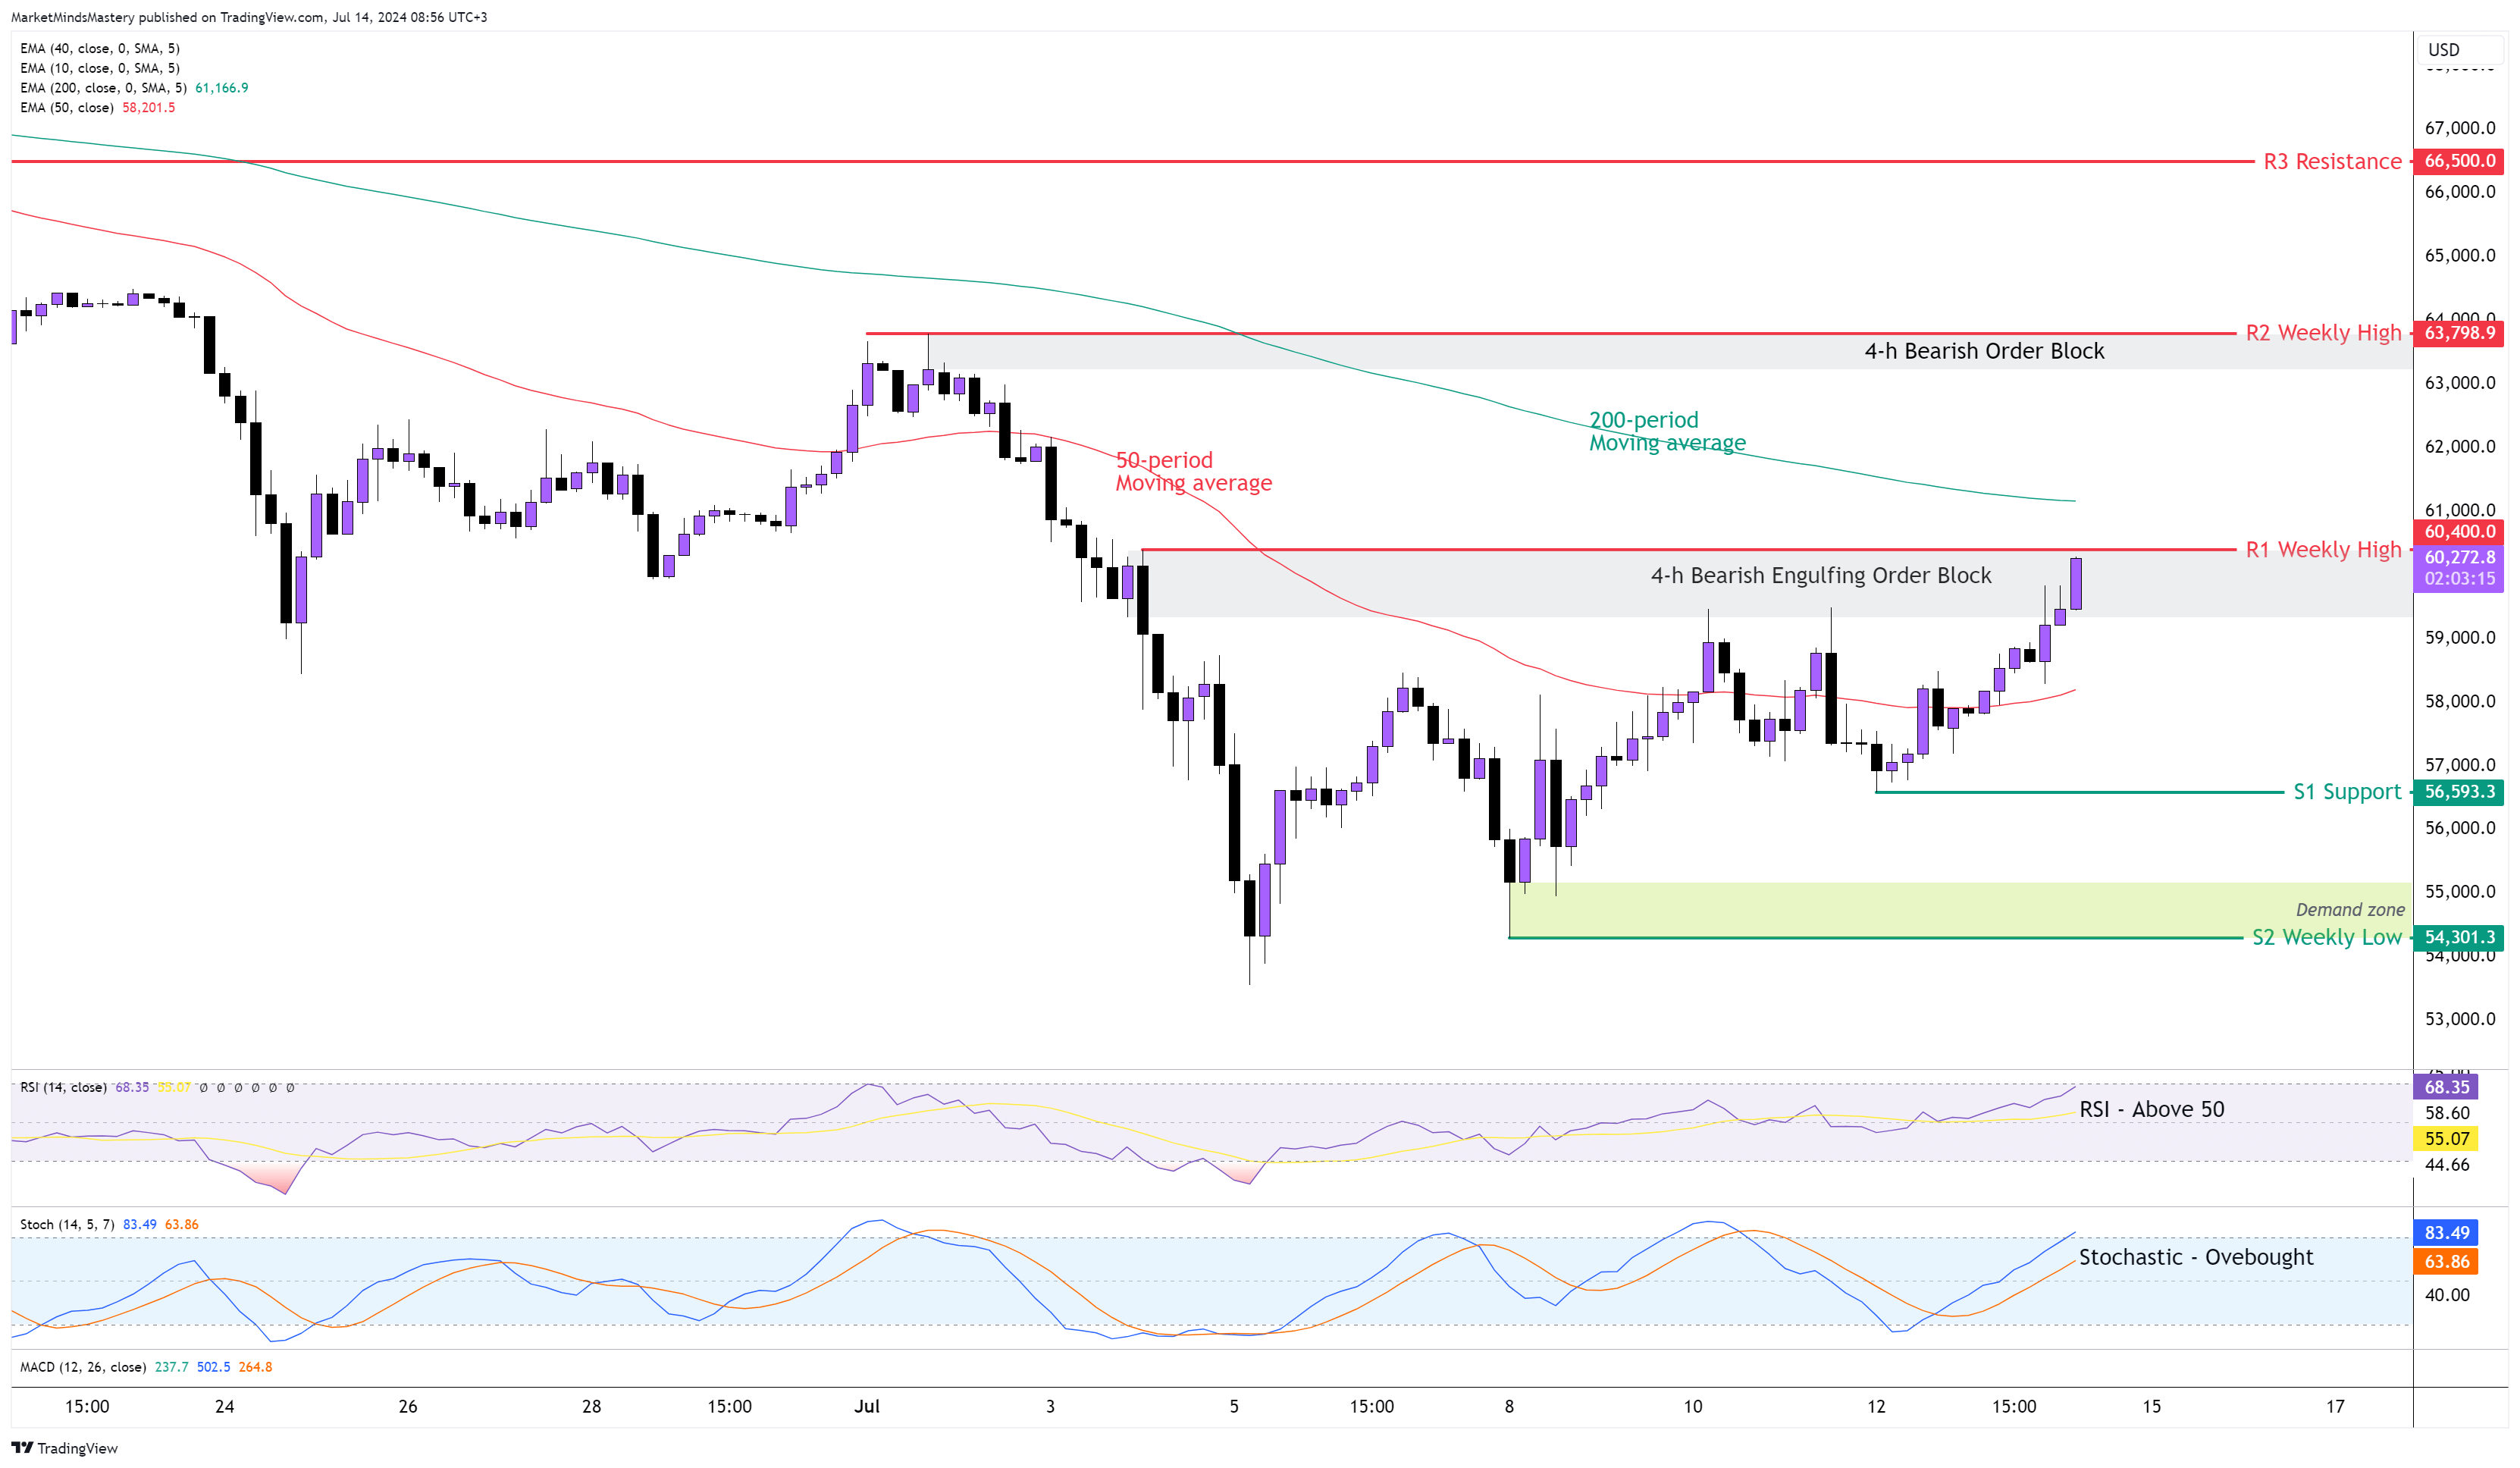
BTC USD 4H
Last week, the price didn’t make a lower low, and the weekly candle ended as an Inside candle. That happened around the 40-period weekly moving average, which acted as a support level.
Based on the swing analysis, the downtrend ended on the 4-hour chart as the price created a new market structure with higher highs and lower lows. Despite that, the 50-period moving average is still below the 200-period, and this has a bearish bias as it follows the intermediate downtrend. The RSI is above 50 as the Oscillator follows the short-term price momentum. The Stochastic Oscillator is in an Overbought condition, and this has bullish implications. Currently, the price is trading inside the 4-H Order Block, around the previous week’s high. If it penetrates the $60400, which is the previous high, and it shows as the R1 on the chart and moves upwards, the next resistance area, R2, will be an old weekly high of approximately $63800. A further upward move will find the next resistance, R3, around $66500.
On the other hand, if the price declines within the Order Block and moves downwards, it will find the first support area, S1, around $56593. If the price penetrates S1 and declines further, the next support area, S2, will be the previous week’s low, approximately $54300.
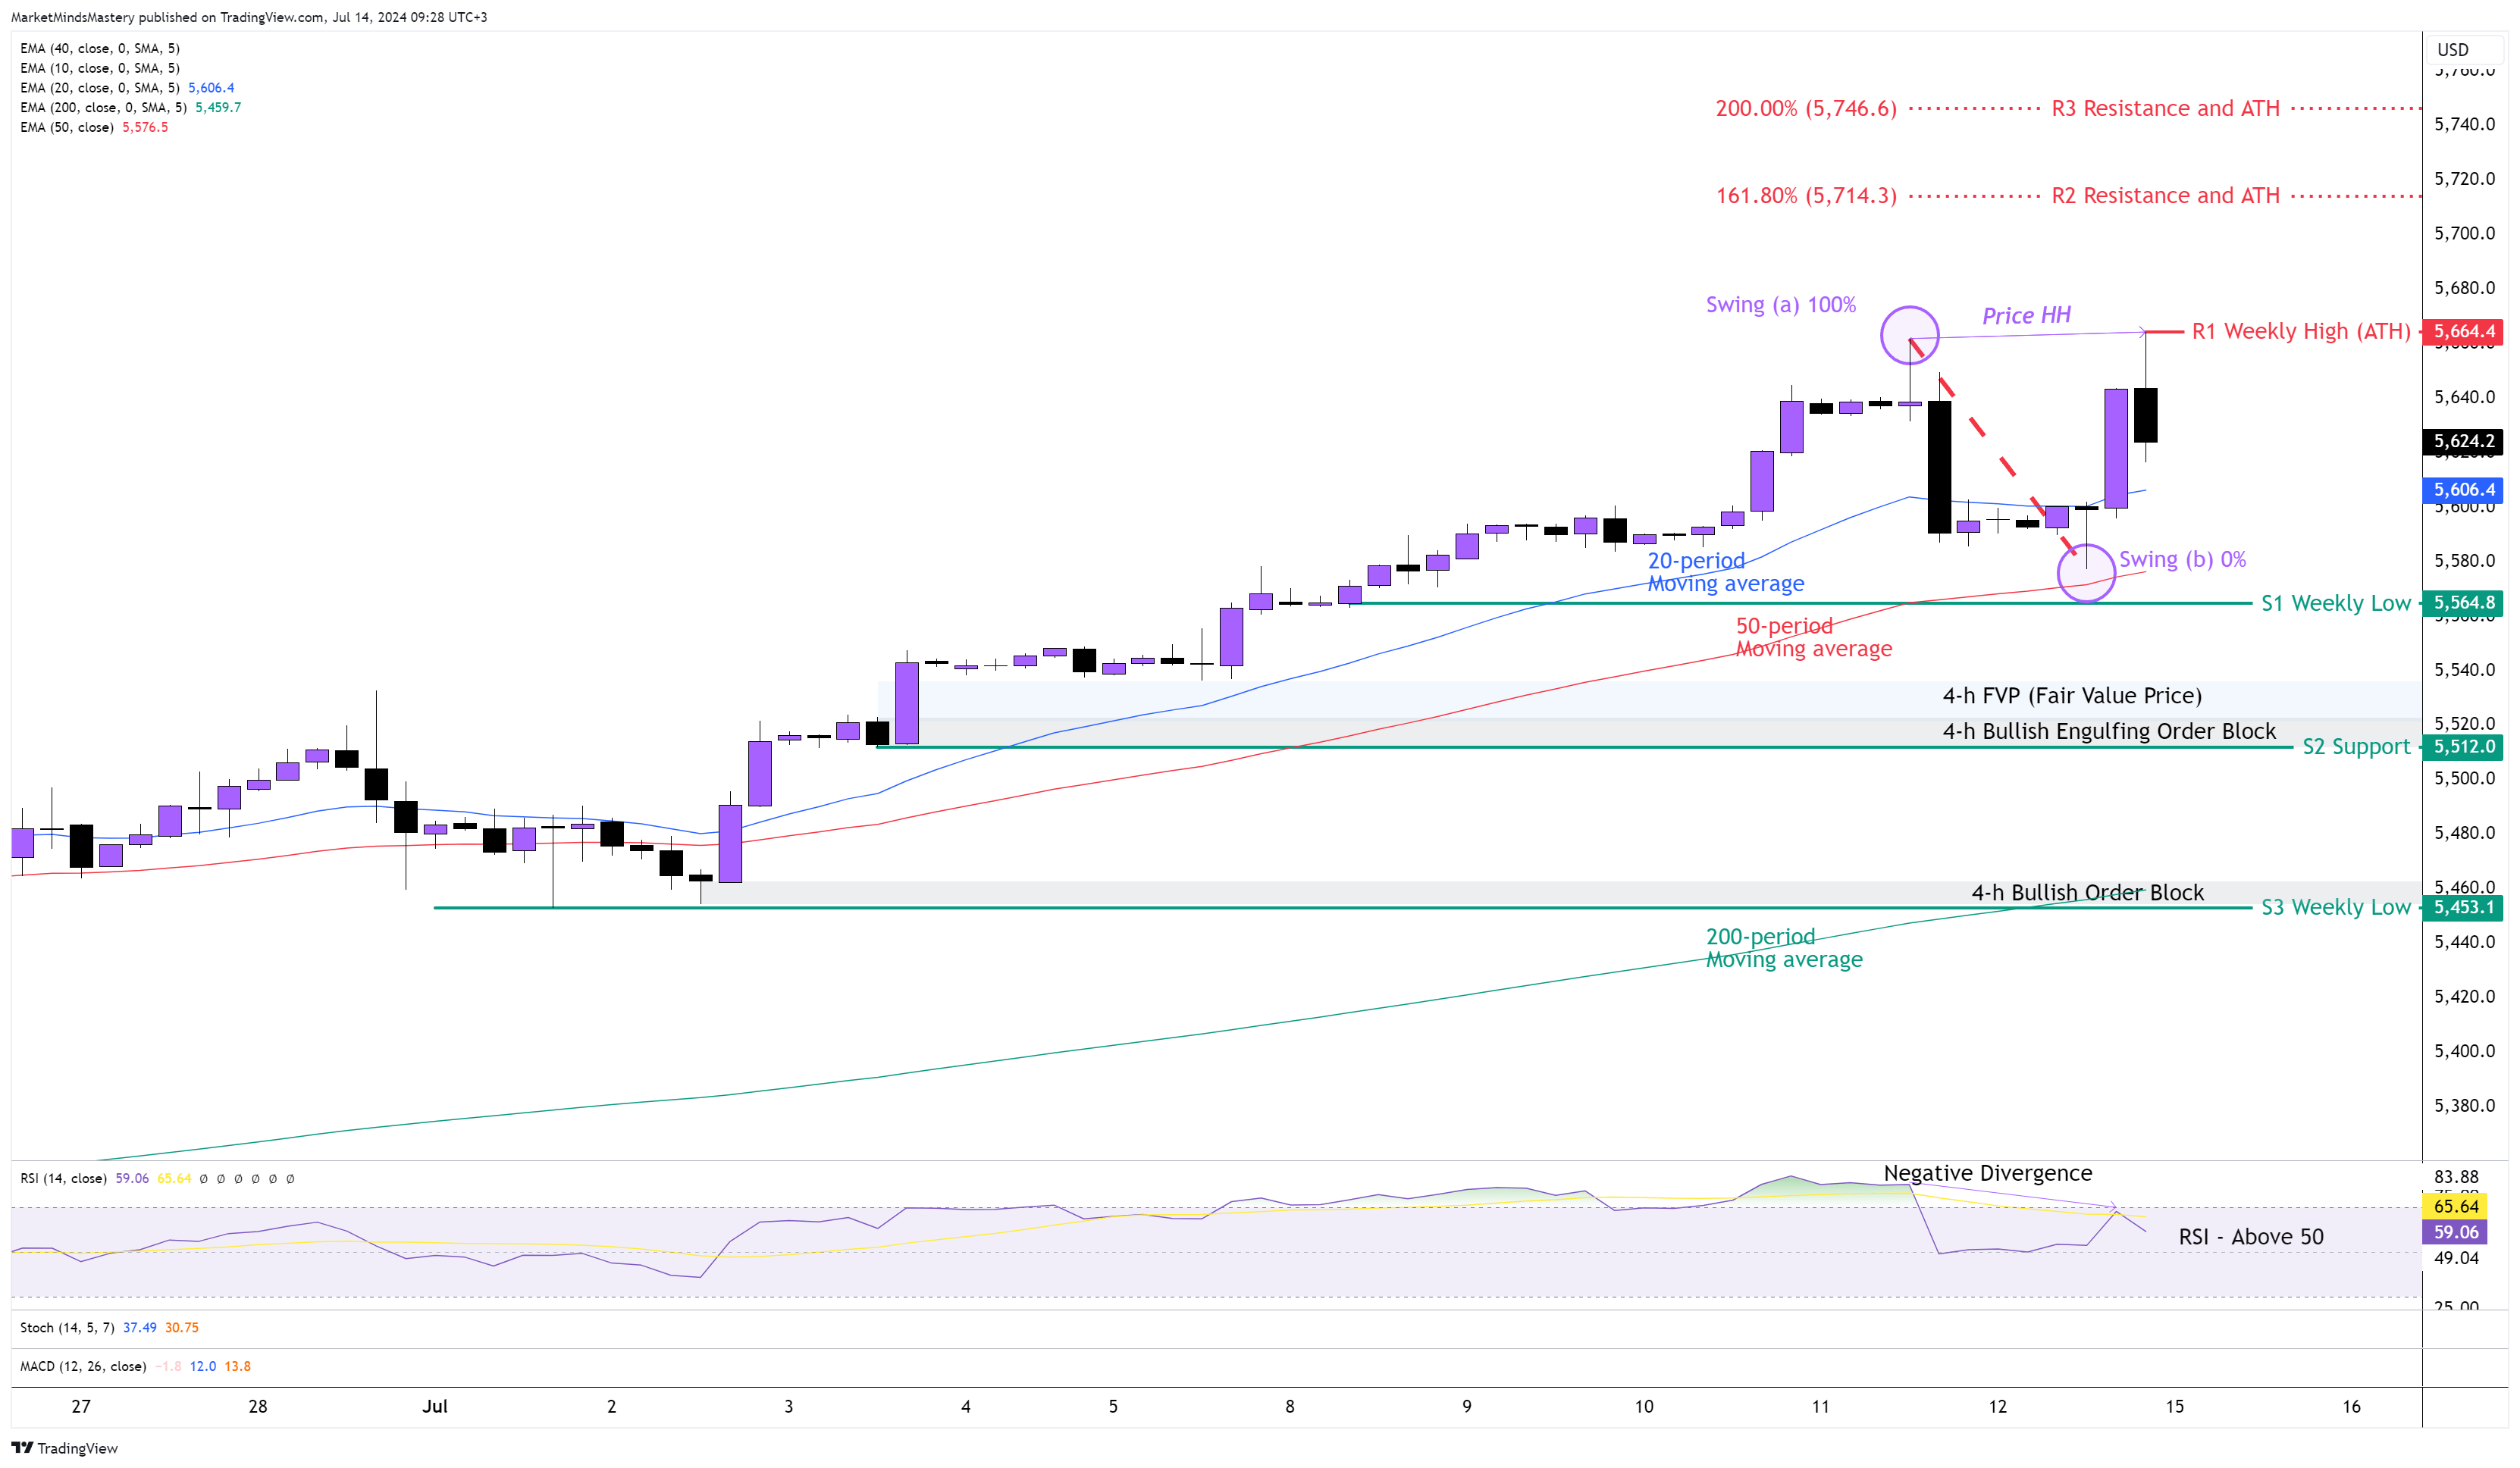
SP 500 4H
For another week, the SP500 created a new ATH (All-time High), and the weekly candle ended as a bullish candle close to the last weekly high. This shows strength in the SP500 market. As expected on the 4-hour chart, the price continued its upward move with new higher highs and higher lows. Despite that, last Friday the price made a higher high, but the RSI Oscillator was unable to follow, and it showed Negative Divergences. This action can cause the price to start a corrective phase, which means declining prices. The 20-period is still above the 50-period moving average, and this has bullish implications.
Additionally, both moving averages are above the slow 200-period moving average. Based on the swing analysis, the market structure is still an uptrend. Starting Monday, if the price follows the RSI’s Divergences and starts moving downwards, the first support area, S1, will be the previous week’s low, around $5564. If the price doesn't stay above the S1 and penetrates it, then the first thing that will happen is the 4-hour uptrend will end. The second thing is that the price can continue to move lower until it reaches the S2 support, around $5512. This price level is considered significant because there is an FVP (Fair Value Price) and a 4-h Bullish Engulfing Order Block around this level. Both can become important supporting factors to keep the price above the S2 support. In case the S2 breaks and the price declines further, the next support area, S3, will be the old week’s low round $5453.
On the other hand, if the price moves upwards, the first resistance area, R1, will be the previous week’s ATH around $5664. A further upward move will continue the existing uptrend and create a new ATH.
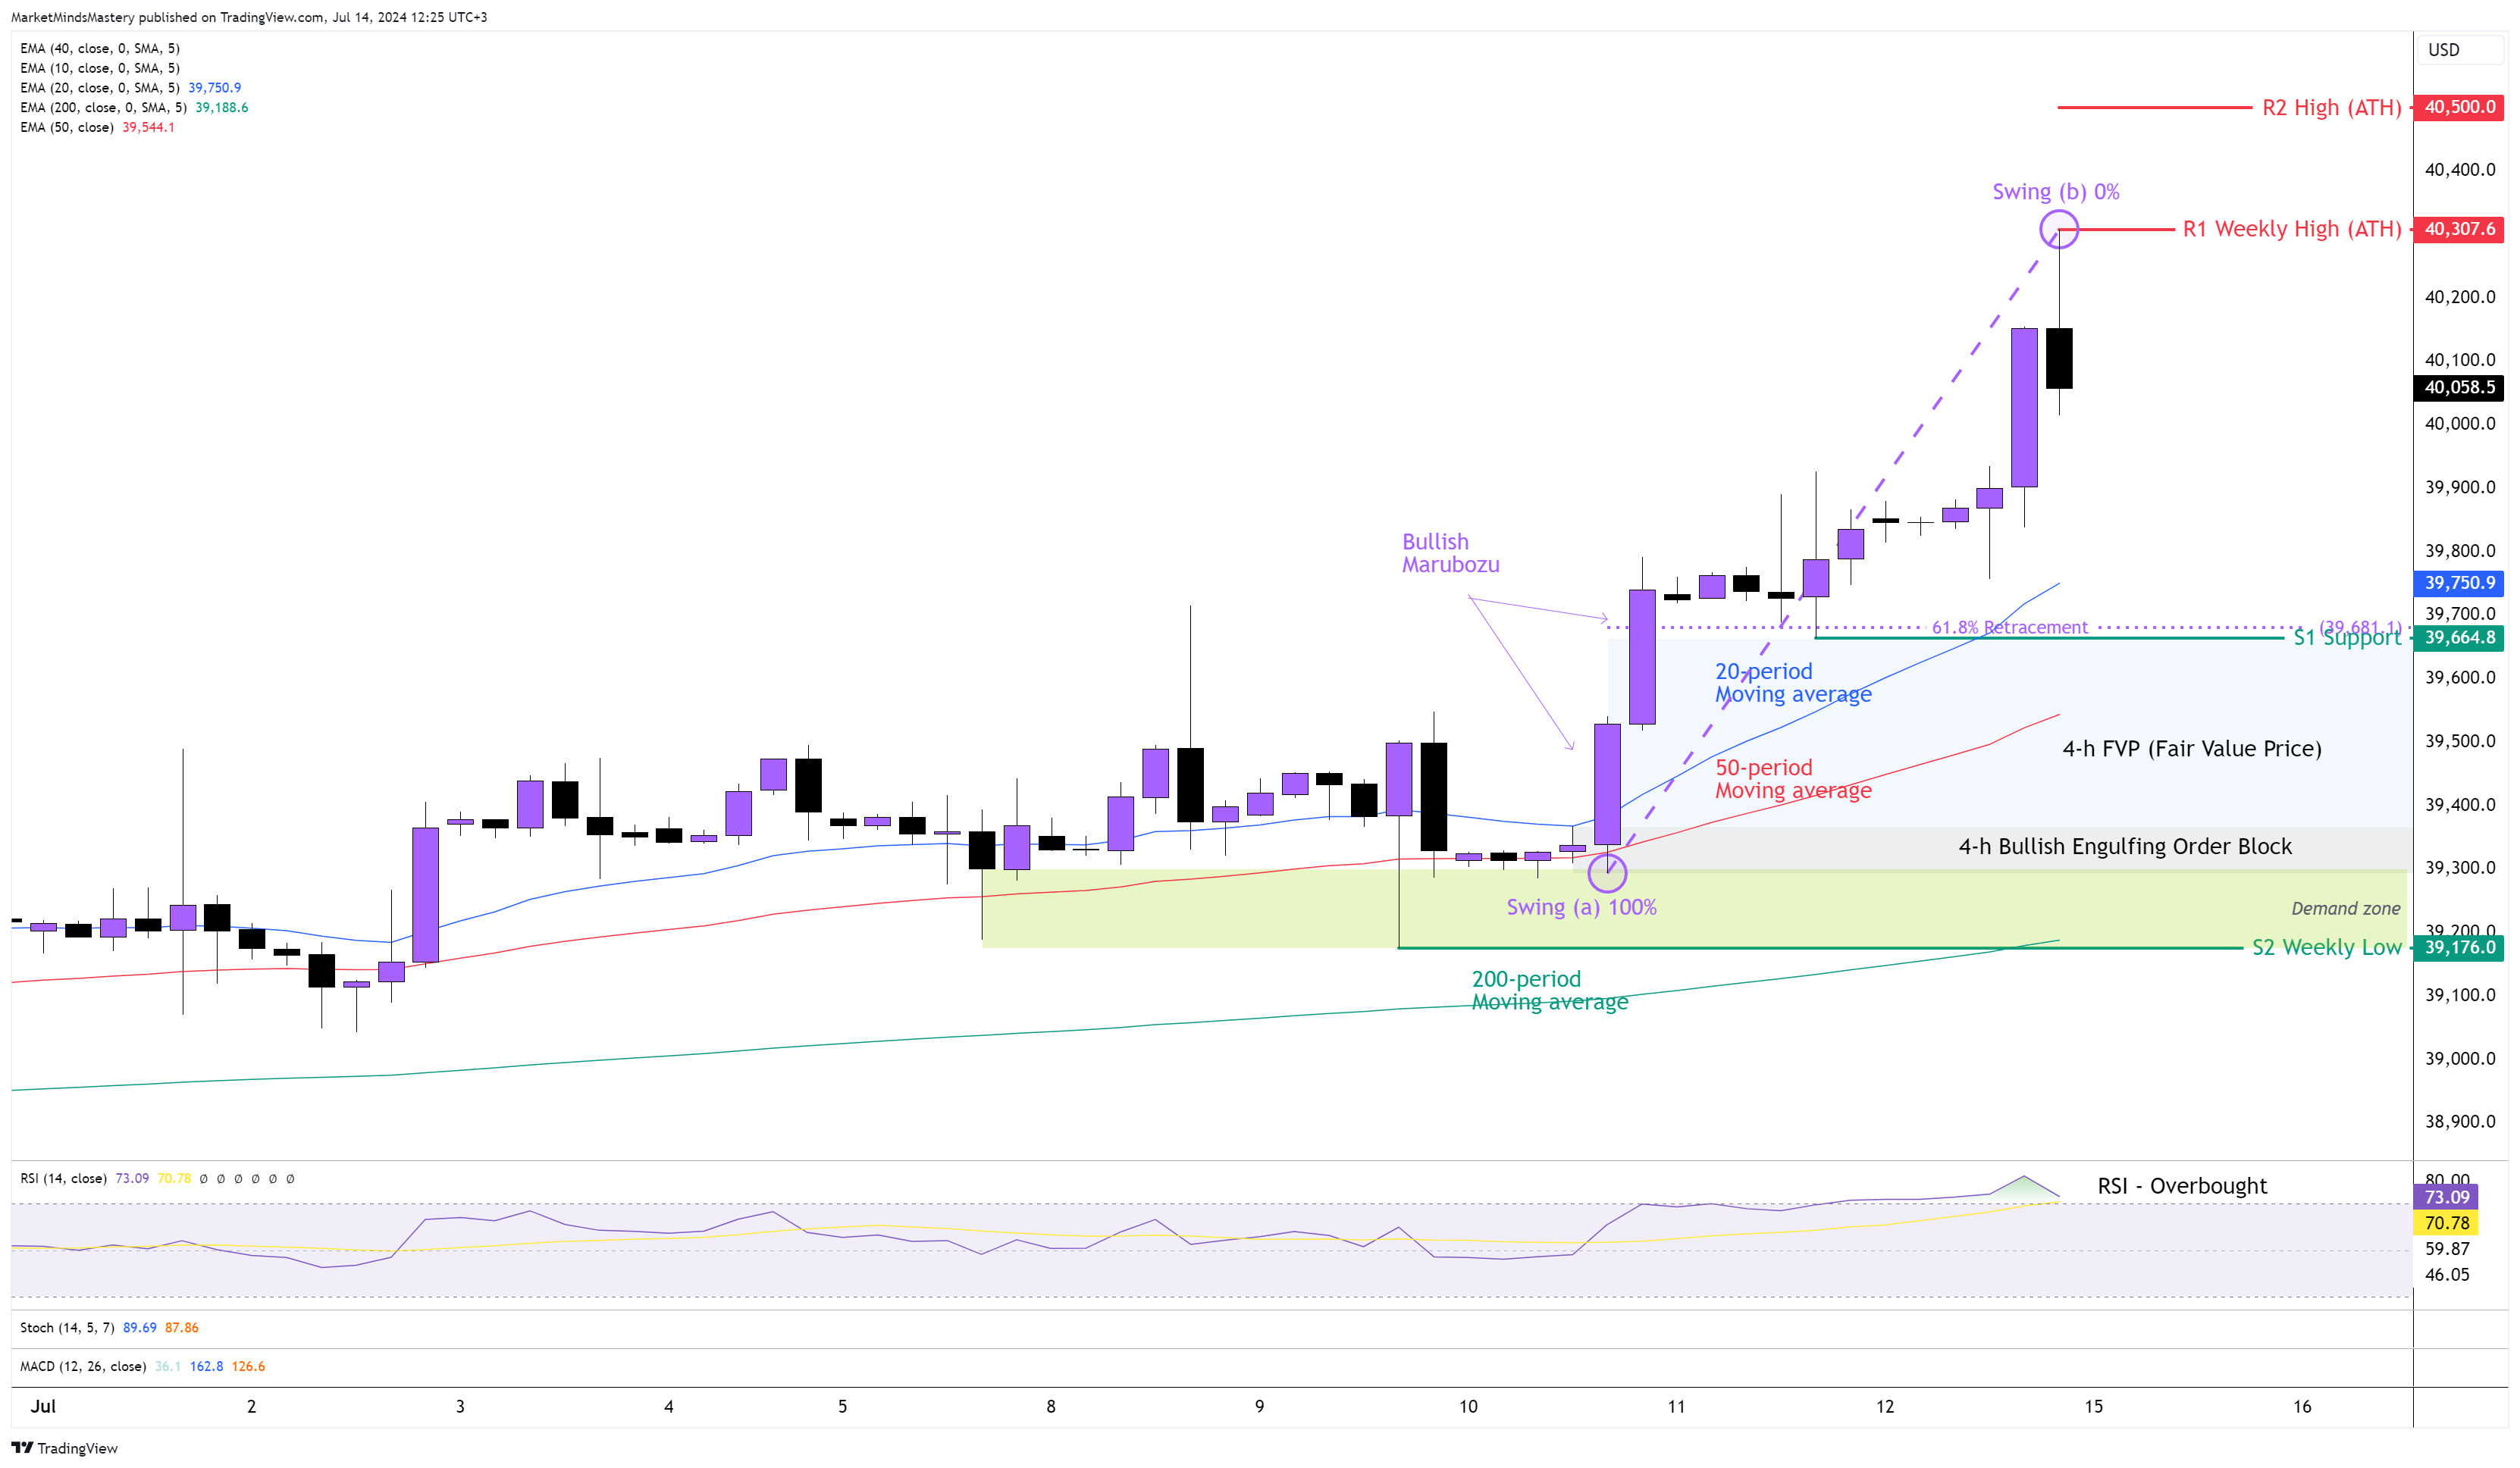
US 30 4H
Last week, the price broke outside of the Upper Band of the Bollinger Band indicator, and it created a weekly bullish candle. The weekly candle created a new ATH (All-Time High), and on the 4-hour chart, the price created an uptrend in a series of higher highs and higher lows. The breakout occurred on Wednesday with two Bullish Marubozu candles, as shown on the chart. During this upward move, the price created a Bullish Engulfing Order Block, and it left behind an FVP (Fair Value Price).
The 20-period is above the 50-period moving average, and the 50-period at the same time is above the 200-period moving average and this is a bullish indication. Because the RSI Oscillator is at its overbought condition, this indicates that the US30 market is in a strong uptrend. As of Friday, the last candle was a Bearish Candle, and it can mark the swing high starting Monday. If the price declines and moves downward, the first thing we expect is a price correction. If this happens, then the price is expected to move downwards until the S1 support area, which consists of the $39664 and the Fibonacci Golder Ratio, 61.8%. In case the price if the price penetrates the S1 and declines further, the next support area, S2, will be the previous week’s low, around $39176. At this price level, the Order Block, the 200-period moving average the FVP, and the demand zone can all be supporting factors for the price to remain above the S2 support. Oppositely, if the price keeps on moving upward, the first resistance area, R1, will be the previous week’s high, which is the ATH at around $40,300. In case the price penetrates the R1 and keeps increasing, then the next potential ATH price will be around $40500.
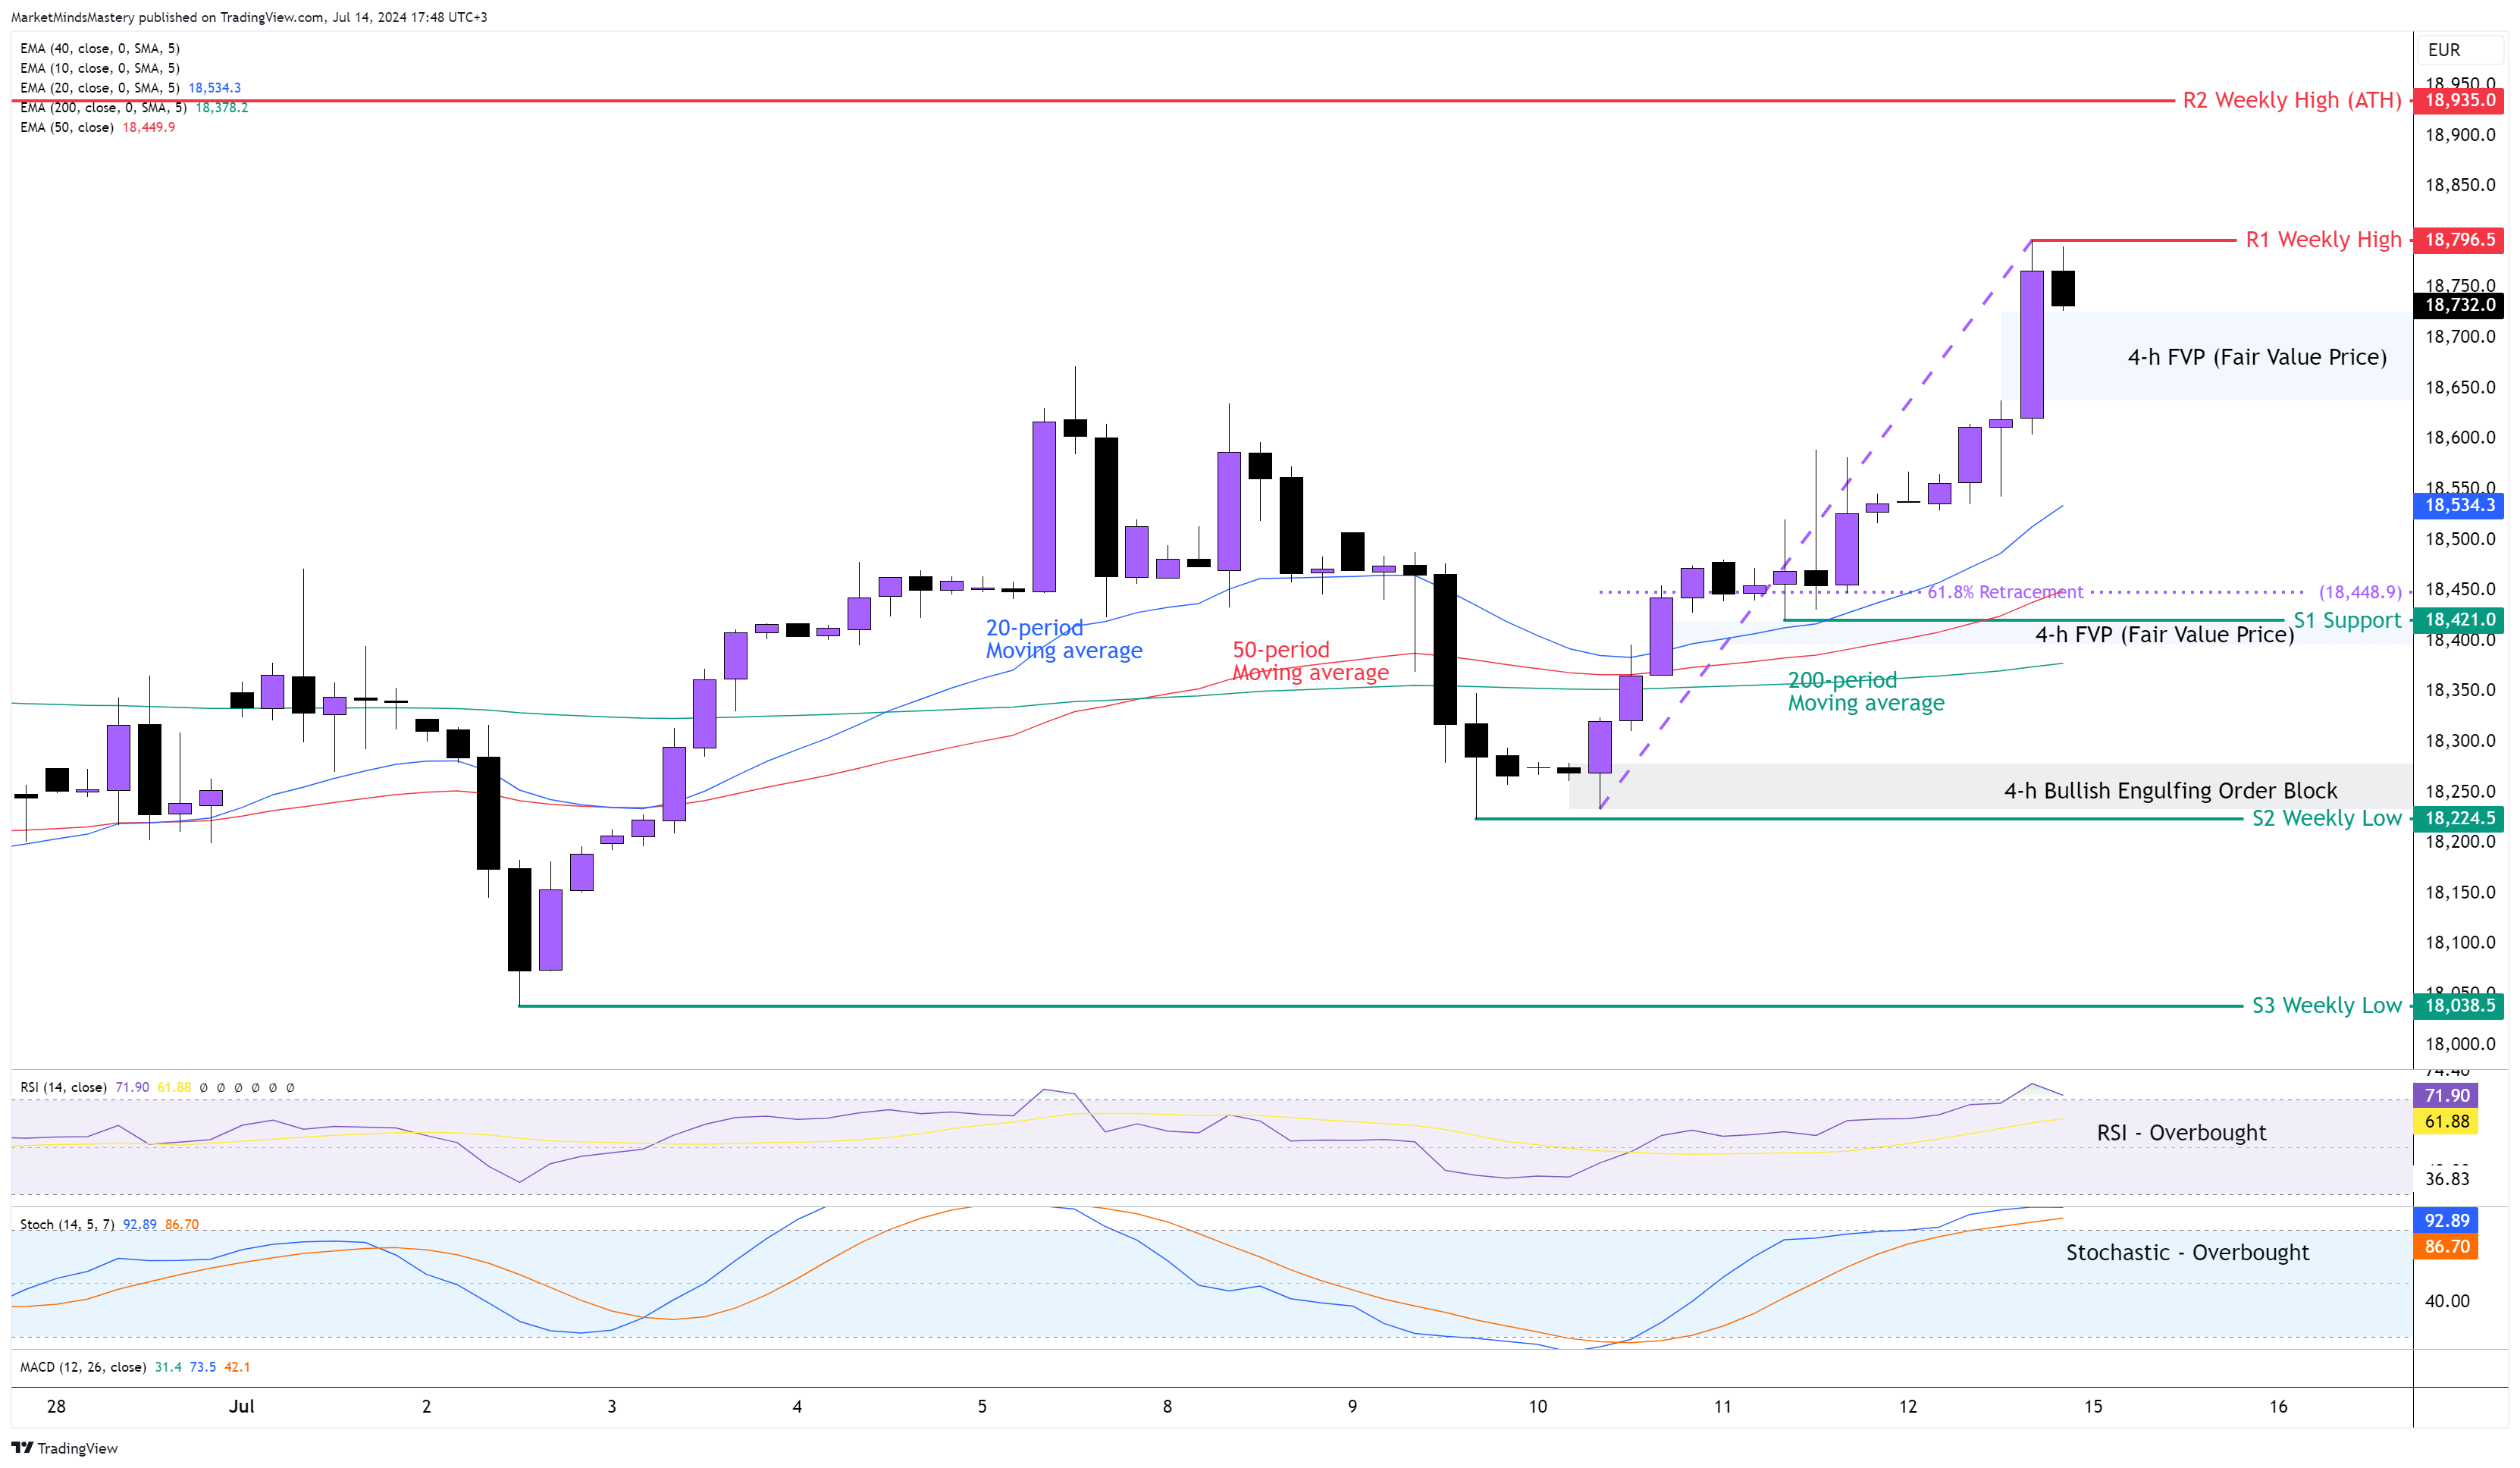
GER 30, 4H
Following last week’s market bullishness, the price retraced on the 61.8% Fibonacci we pointed on the chart, bounced off with a Bullish Engulfing candle, and moved upwards, continuing the higher highs and higher lows formation. Therefore, the weekly candle ended as a bullish candle. As the price made a new high on the 4-hour chart, the uptrend continued. The 20-period is above the 50-period moving average, and the 50-period is above the 200-period moving average. The direction of the moving averages confirms the upward price move. The RSI and the Stochastic Oscillator are both in their Overbought conditions, and this has bullish implications. Last Friday, the last candle was an Inside Bearish candle, and this can set the price in a corrective phase. Therefore, if the price declines and moves downwards, the first support area, S1, will be around 18421. This price level seems to be significant for the GER30 indices because it consists of the 61.8% Fibonacci retracement and the FVP (Fair Value Price) created on the 4-hour chart last Thursday. If the price penetrates the S1 and moves further downwards, the next support area, S2, will be around 18224, which is the previous week’s low.
On the other hand, if the price continues to move upwards, the first resistance area, R1, will be the previous week’s high around 18796. This price level is very close to the last weekly candle close. In case the price penetrates the R1 and keeps increasing, the next resistance area, R2, will be the ATH (All-time High) around 18935.