The Trading Pit Week Ahead Market Outlook (May 27 – June 02)
Last week, the RBNZ (Reserve Bank of New Zealand) kept the interest rates at 5.5%, whereas the FOMC boosted the USD for a while. The Sterling was the surprise currency as the CPI reported a 2.3% increase, which helped the pound to gain momentum. We always explain that the currencies will best move during major news events when the actual number deviates from the forecast and not the previous report.
On Monday, the volatility will pick up during the Asian trading session, and the Bank of Japan’s Governor Ueda will give a speech. Usually, his speech aims to inform us about the Monetary Policy guidelines and thoughts about Japan’s future economy, which can tell us about the next move on the country’s interest rates, which will be reported in the middle of June.
The UK stock market will be closed due to the Spring Bank Holiday. Also, the Banks will be closed in the US because of Memorial Day. In the Eurozone, the Chief Economist Lane will host a speech, which can fuel the volatility of the Euro just before the New York trading session starts.
On Tuesday, the retail sales in Australia will be reported. The previous number was reported at 0.4% and is expected to grow by 0.7% this month. The Aussie is likely to rally if the actual number is reported higher than the forecast. Based on the swing analysis, the AUSUSD is still technically in an uptrend. The uptrend is likely to continue if the Australian Dollar follows through with a positive outcome and rallies. Next, the Switzerlan’s National Bank’s Chairman will give a speech a few hours before the London trading session starts. The last significant event for the day will be the House Price Index in the US. The previous report was at 1.2%, and this time, the forecast shows a decrease to 0.5%.
Moving into Wednesday's events, starting from Australia, April's CPI (Consumer Price Index) will be reported early in the morning. The last report was 3.5%, and now is expected to decrease to 3.4%. Usually, the CPI outcome significantly impacts the performance of the Australian dollar. It is the first indication the Reserve Bank of Australia will consider how to adjust the country’s interest rates next month. Also, the Consumer Price Index will be reported in Germany and is forecasted to increase to 2.8%. This forecast is based on the yearly CPI, which means that the Consumer Price Index was much lower in the same month one year ago. A rising CPI will be favourable for the Euro and can set the Euro’s price higher. However, a significant increase like this will not be welcomed by Consumers as it usually leads to a rise in the country's prices of goods and services.
On Thursday, the markets will get “busy”. The Trade Balance in Switzerland will be reported, and the existing number is 3.5B. As there is no forecast for this event, if the actual report is higher than the previous one, the Swissy is expected to rise. If reported at a lower number, it is expected to affect the currency negatively. The market participants will focus mostly this day on Switzerland’s GDP (Gross Domestic Product). The consensus estimates this report will have a higher number than last year's first quarter report. Specifically, in the first quarter of a year ago, the GDP in Switzerland was 0.6% and for the same period this year is expected to grow to 0.7%. If this is confirmed on the day, the Swissy is expected to increase. A few hours later, the Eurozone's unemployment rate will be reported, and the forecast shows there won't be any change in the number, and it is expected to remain at 6.5%.
During the New York trading session, the Gross Domestic Product in the US is expected to drop from 1.6% to 1.5%. If this estimation is confirmed and the Swissy rallies, then the USDCHF can experience a downfall. Everything will depend on whether both currencies will follow through with the event’s outcomes. The last significant event will be the US's weekly crude oil stocks report, which holds 1.825M barrels as per the previous report. The forecast estimates -2M inventories, which can significantly increase the demand and tank prices.
Friday will be the last trading day of the week, as well as the last trading day of May. The day will start with the speech of Reserve Bank of New Zealand Governor Orr. His comment on New Zealand’s economy will determine if the RBNZ will change the interest rates next month. Next, in Japan, they will announce the Consumer Price Index. Currently, the CPI is 1.6% and is expected to be reported 1.9%. This will be a significant increase, and if this occurs and the Yen follows through, we might observe strength in the Japanese Yen and the GBPJPY, and the USDJPY will drop accordingly. They are both at significant price levels of resistance, and an event like this can change market directions and trends. Maybe it will be the beginning of a downtrend on both currency pairs. Additionally, retail sales in Japan are expected to increase by 1.8% compared to 1.2% in the previous report. In the Eurozone, the Harmonize Consumer Price Index is expected to grow from 2.4% to 2.5% and can set Euro prices higher. The week will finish with the last report from Canada, the GDP. According to the forecast, the Gross Domestic Products in Canada are expected to drop from 0.8% to 0.7%. If this is confirmed and the Canadian dollar follows through, we might see a rally on the USDCAD on the day.
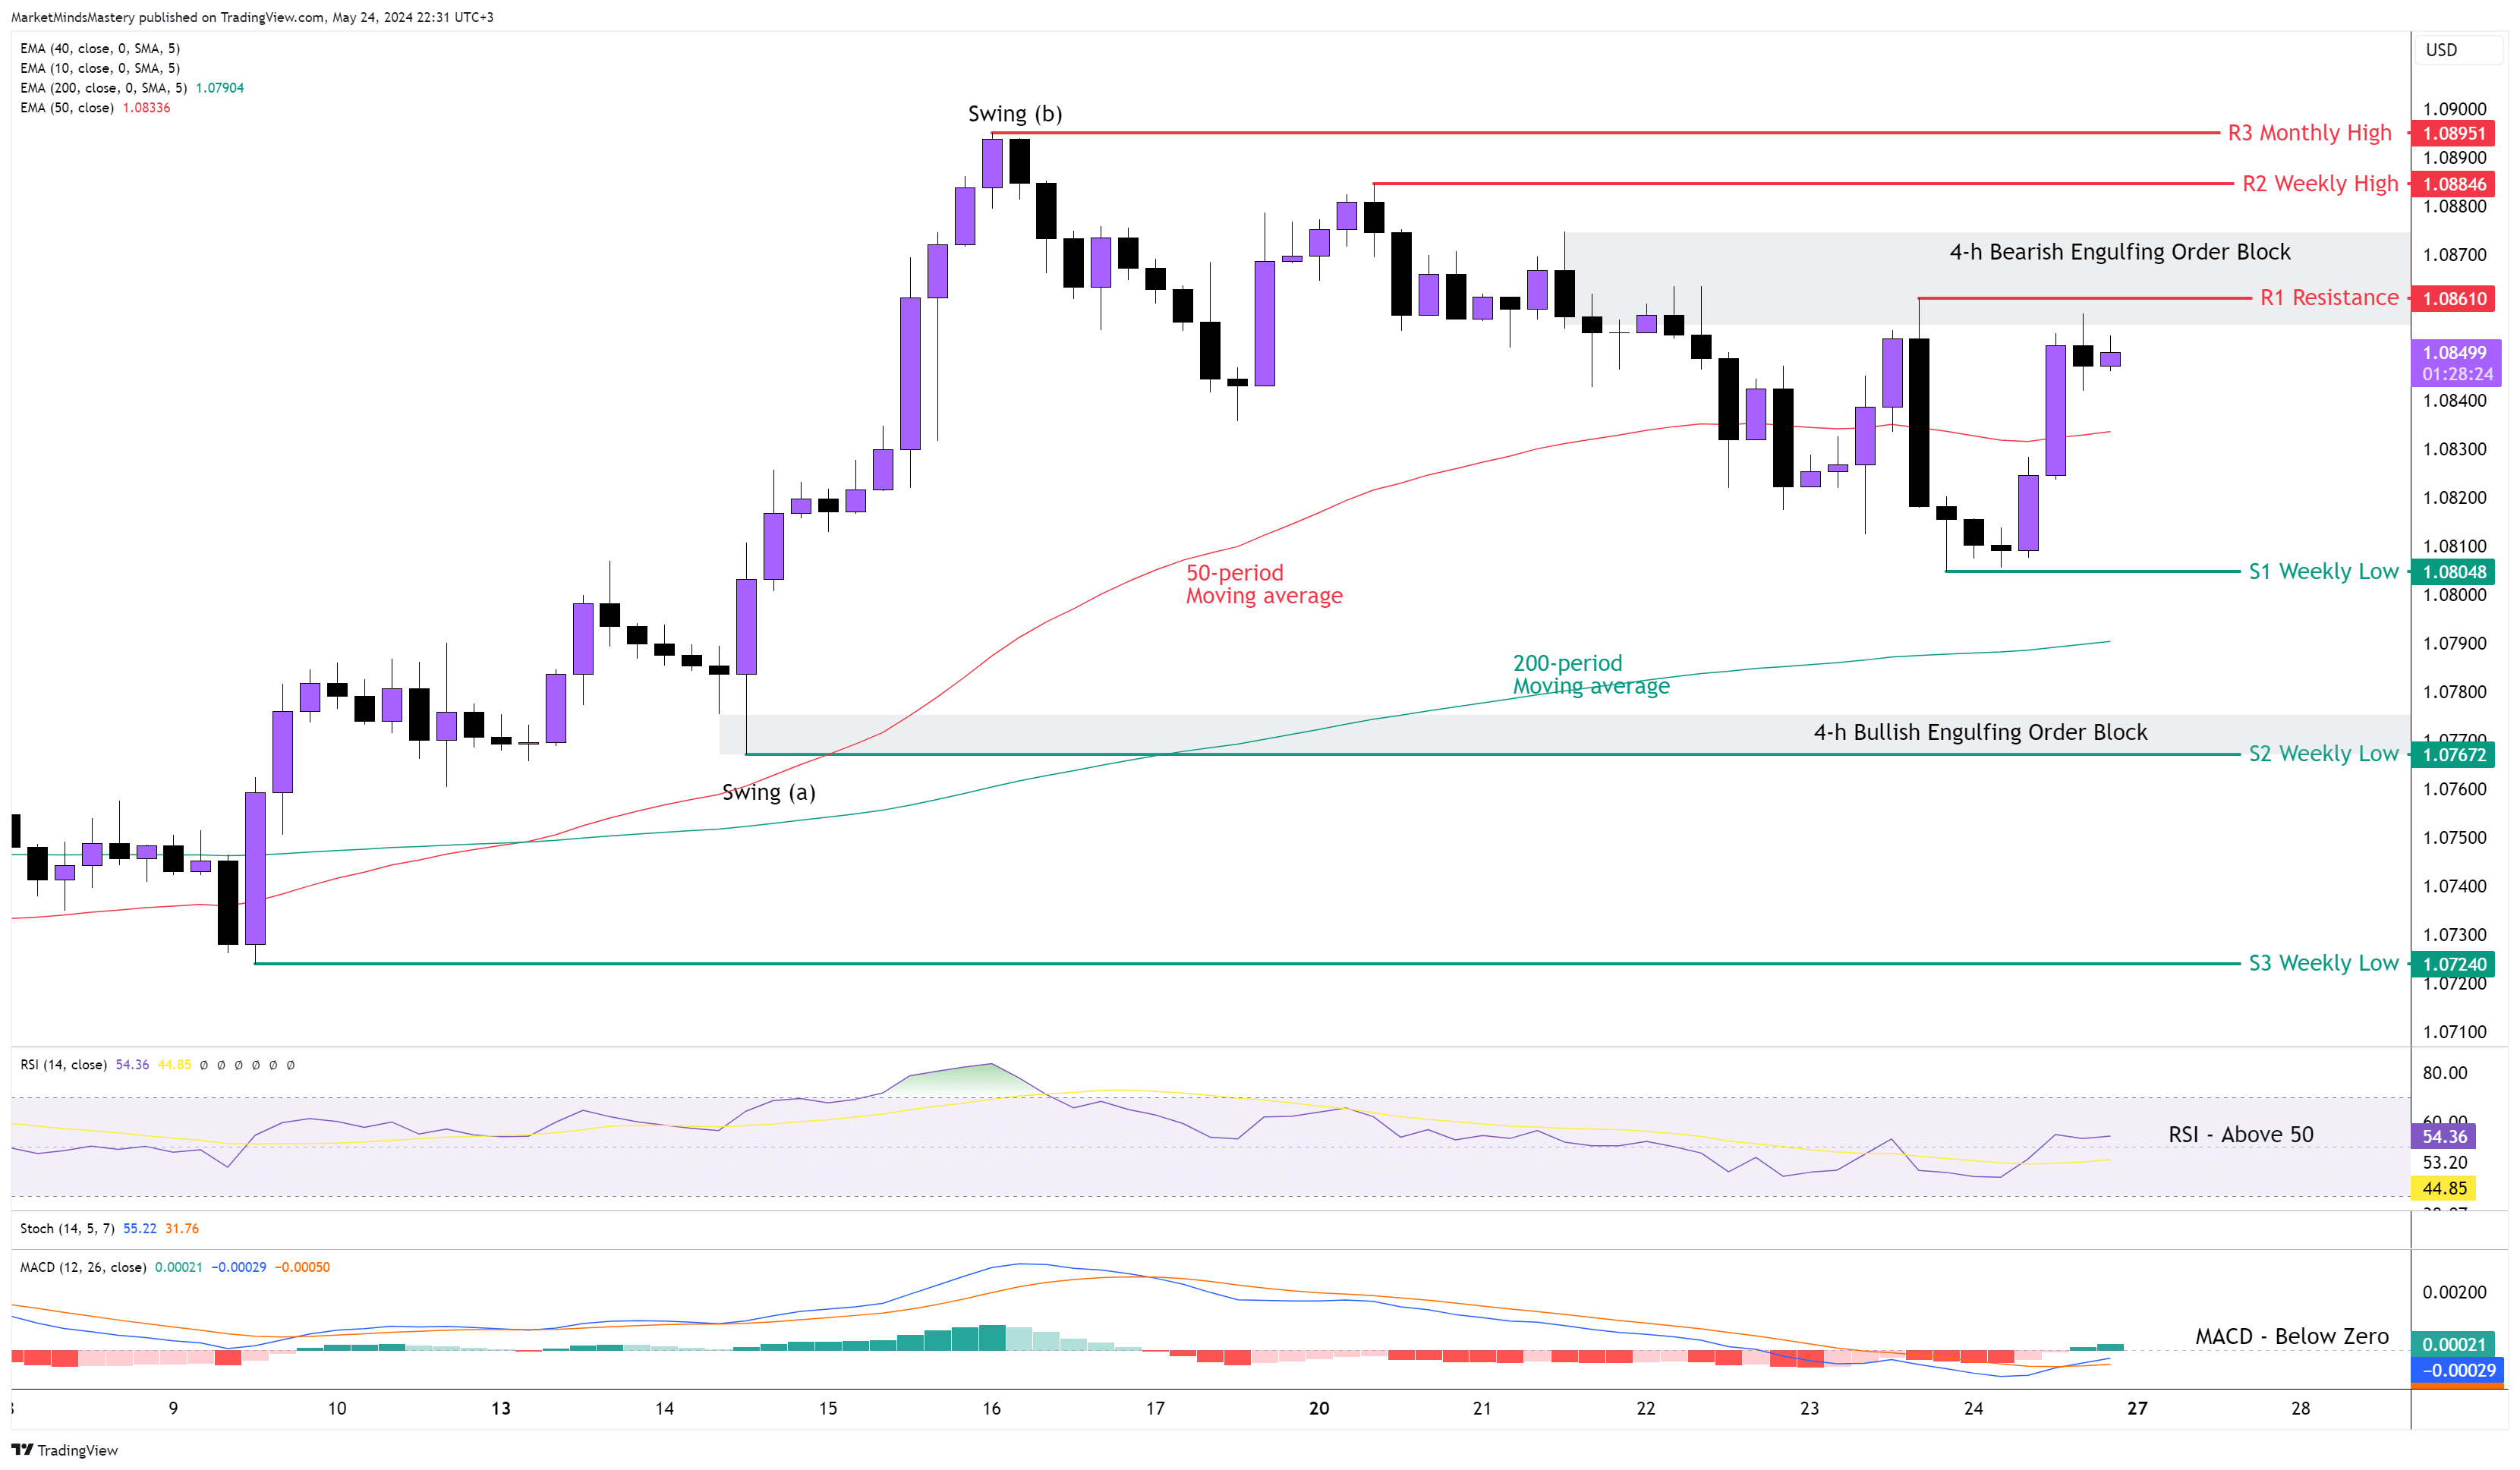
EUR USD 4H

Following the previous week’s analysis, the price didn’t make a new high and stayed as an inside candle named “Hanging Man” This is a very common price action pattern to find on charts, usually at the end of an upward move. After a hanging man appears, the price is generally set to move in the opposite direction.
On the 4-hour chart, the price looks like it started a downtrend. However, the actual market structure marked from swing (a) and swing (b), the price is still within these boundaries, and unless it moves above swing (b) or below swing (a), it still has bullish implications.
Nevertheless, any moving average is considered a lagging indicator. The 50-period moving average is above the 200-period moving average. Additionally, the RSI oscillator is above 50, which is an indication of a bullish market, and the MACD is under zero but with a MACD line crossing above the Signal line.
If the price moves upwards, the first resistance, R1, is approximately 1.08610. A recent Bearish Engulfing Order Block was tested successfully last week in this area. If the price penetrates the R1 and increases, the following two areas of resistance, R2 and R3, are very close to each other, with the R2 being around 1.08846 and the R3 around 1.08951. The R2 is a weekly high price level, and the R3 is a monthly high price level. If the price moves lower, the first support area, S1, is the previous week’s low, around 1.08048. If the price closes below the S1 support and moves downwards, the next support, S2, is another weekly low around 1.0767, which created a Bullish Engulfing Order Block a few weeks ago.
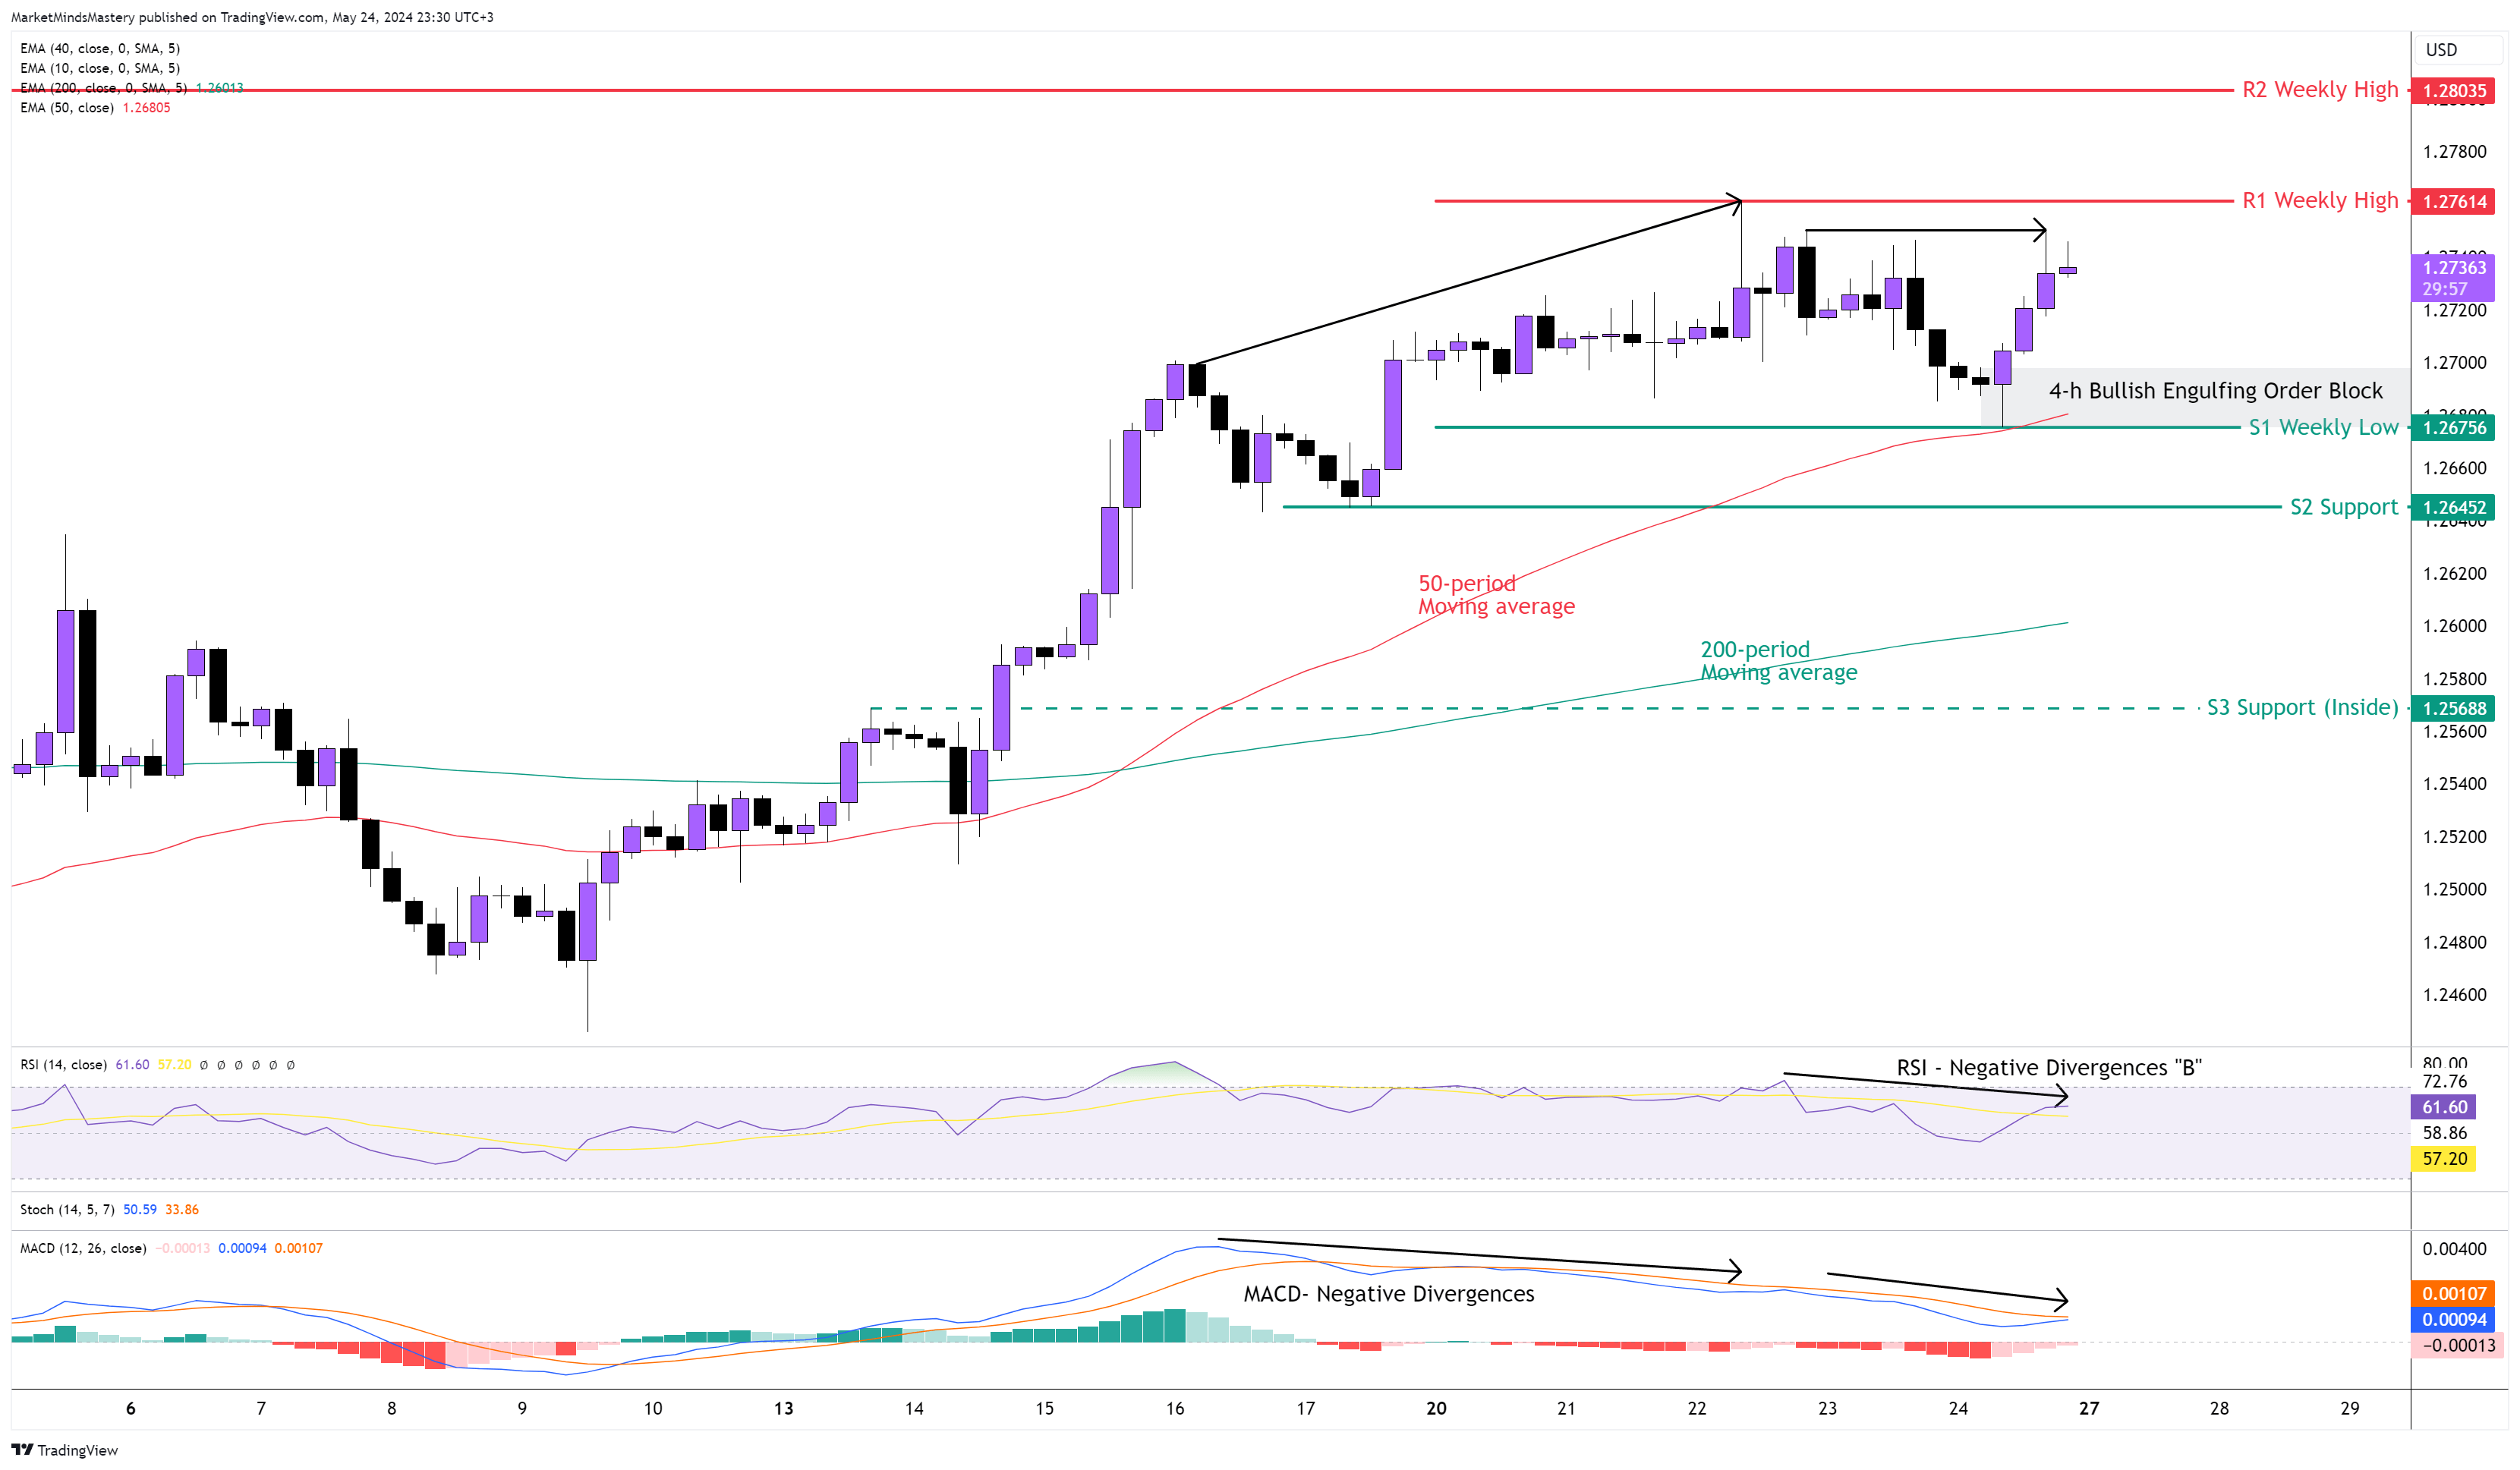
GBP USD 4H
The CPI (Consumer Price Index) was primarily Sterling's best event last week, forcing the GBPUSD to create a higher high on the Weekly chart. Despite the new high, the body of the weekly candle is very small compared to the candles a few weeks ago. The examination of candlesticks indicates weakness in the market. The price formed a higher high, regarded as a bullish indication on the 4-hour chart.
The lack of momentum was apparent on the MACD at the beginning of the previous week with the negative divergences as soon as the price made a new high, and the RSI oscillator with the most recent negative divergences "B" Class as the price made equal highs and the RSI lower highs. If the market performs with strength this week, and the Sterling sets for a new higher high, the Divergences can force the price to create a correction before the upward move. The moving averages also confirm the bullishness. The 50-period moving average is above the 200-period moving average. Starting Monday, if the price declines, the first support area, S1, will be the previous week’s low, around 1.26756.
At this level, a Bullish engulfing Order Block formed last week. Also, the interaction of the 50-period moving average can add additional validation. If the price doesn’t bounce off and declines, the next support area, S2, will be around 1.26452. A further downward move will change the market structure, and the S3 support will be around 1.25688. If the price moves upwards, the previous week’s high will be considered as the first resistance, R1, approximately at 1.27614, and the following resistance, R2, approximately 1.28035. Both these resistance levels are weekly highs.
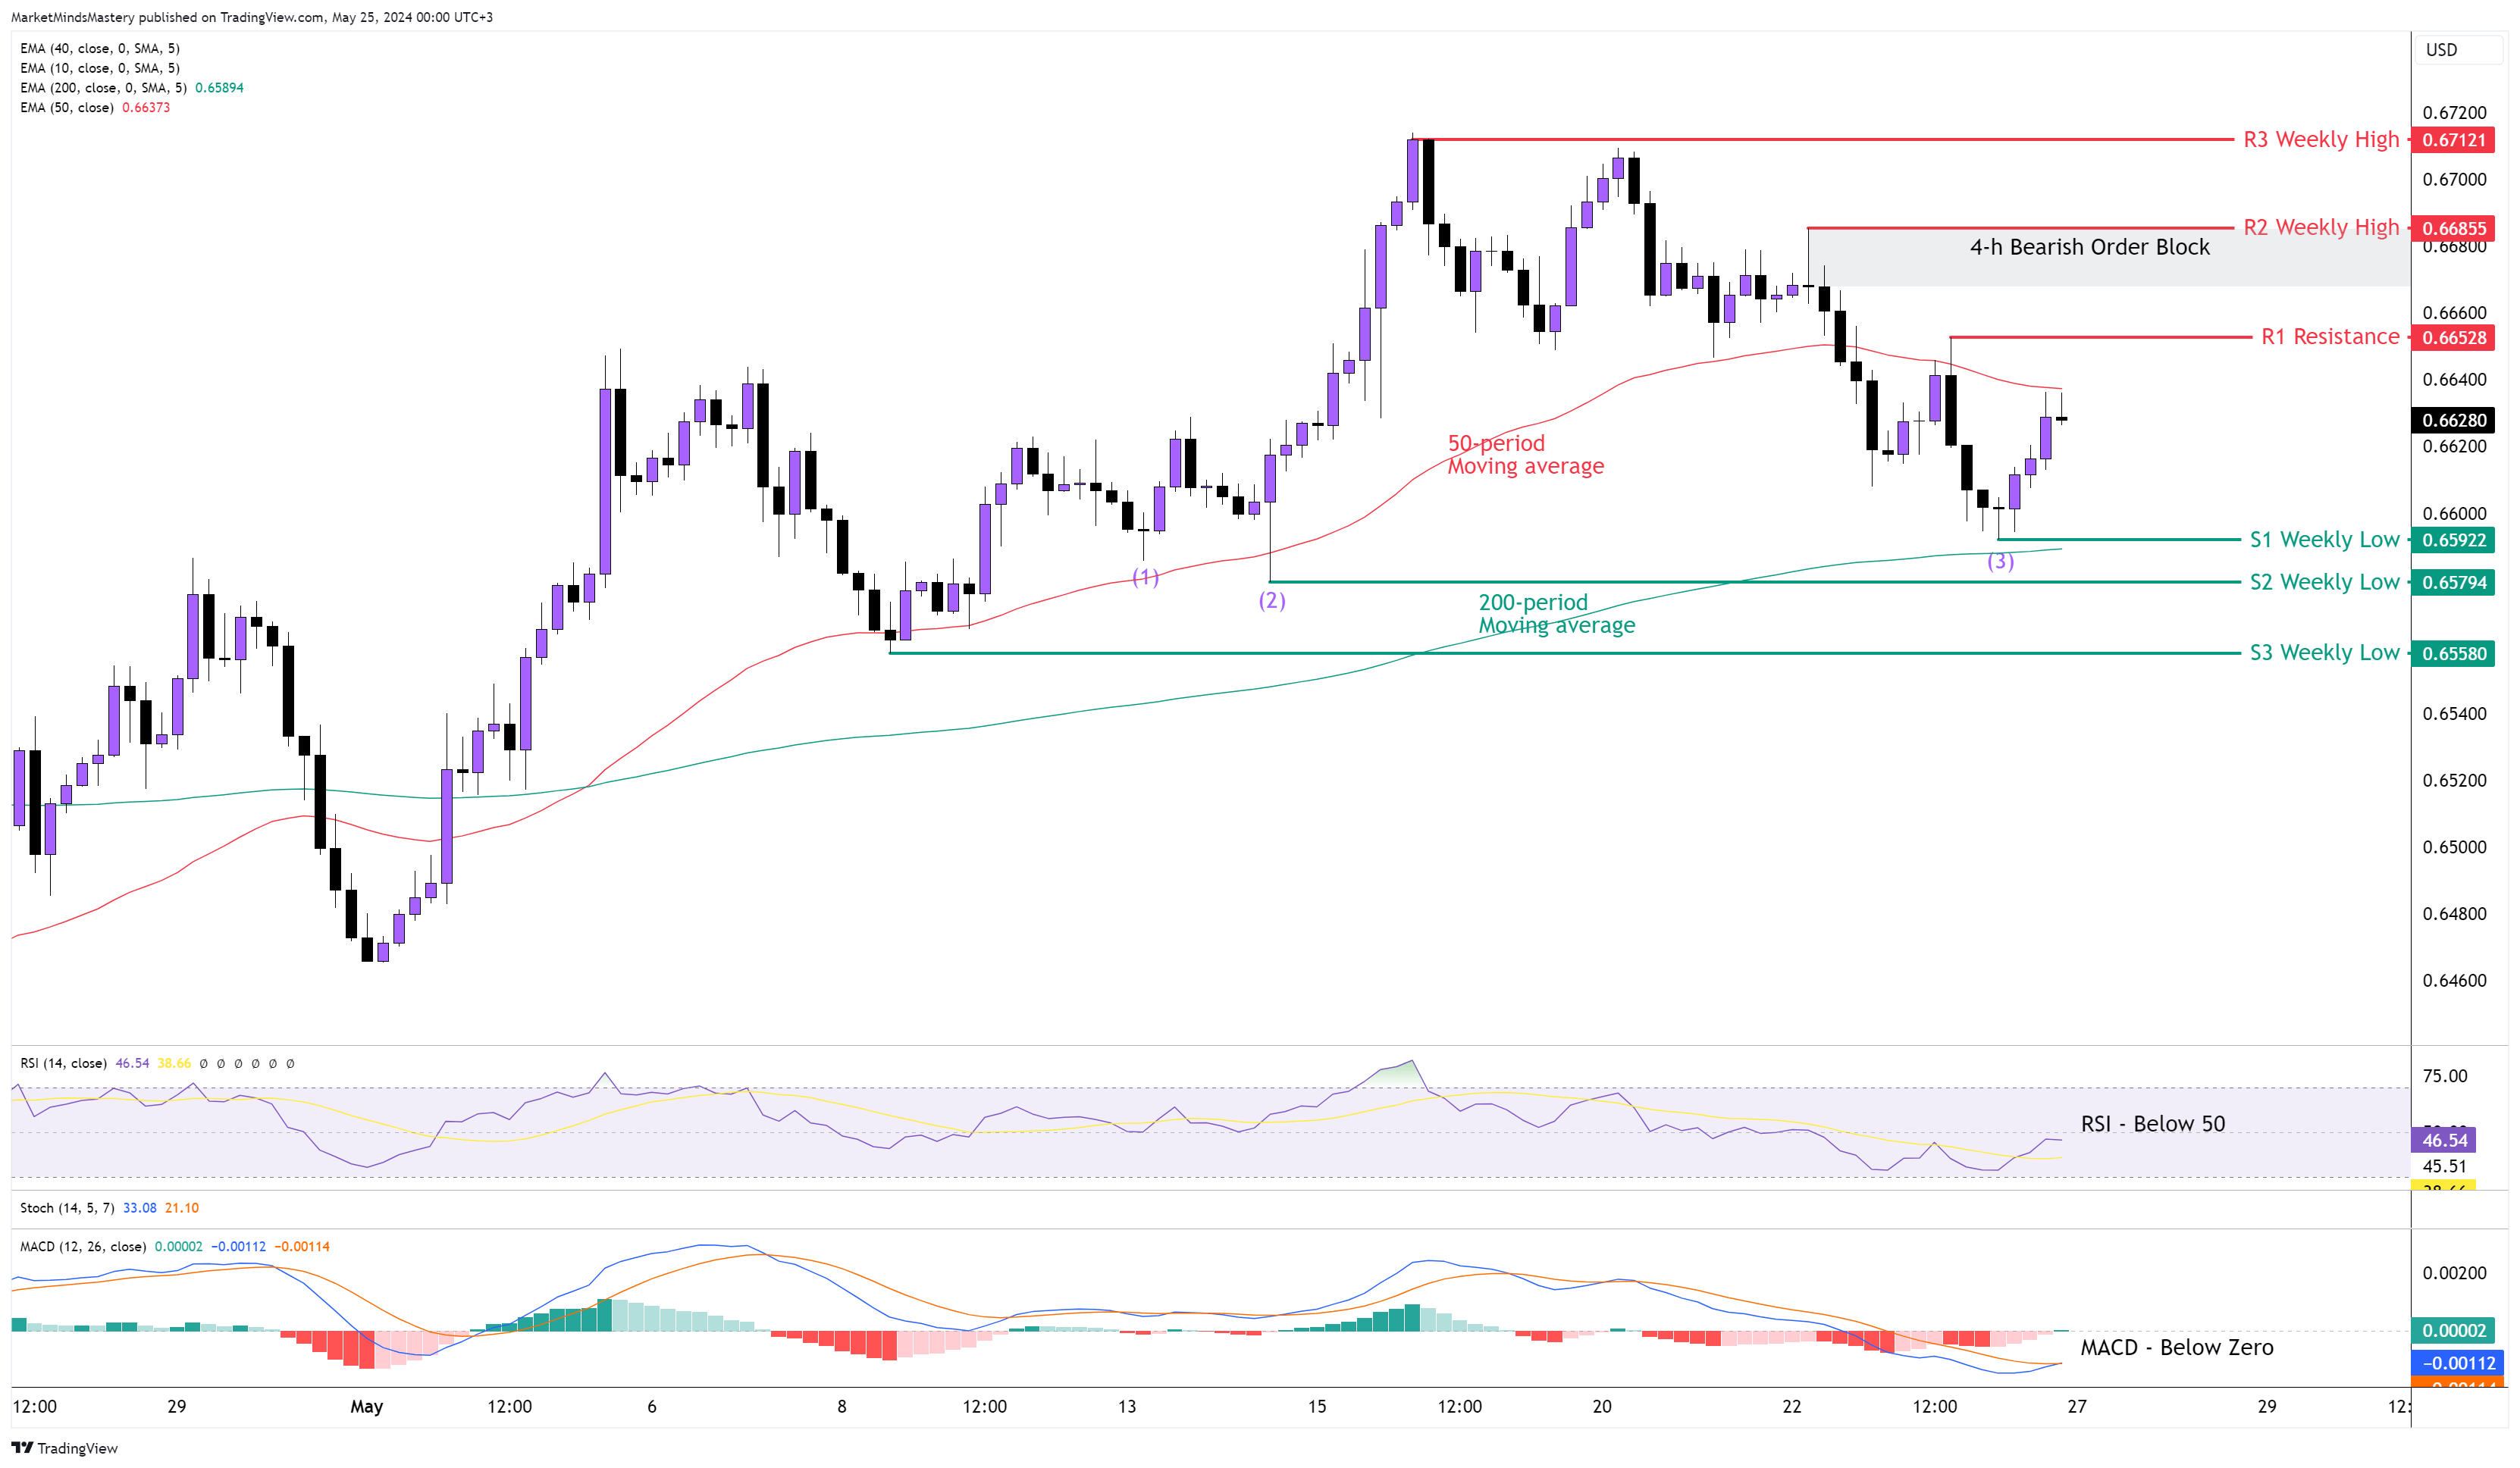
AUD USD 4H
Following the RBA’s Meeting Minutes, the Australian Dollar was among the poorest performance currencies last week. The price on the weekly chart shows that the black candle has been inside the candle for two weeks. It is important to mention that the rejection occurred around a monthly resistance. On the 4-hour chart, the price compresses between the 50 and the 200-period moving averages. Although the 50-period moving average is above the 200-period moving average, the price doesn't follow through with momentum. The RSI oscillator and the MACD show a bearish market because the RSI is below 50, and the MACD is under the zero line without any significant crossover.
If the price keeps moving downwards, the first area of support is a confluence of the previous week’s low around 0.65922 and the 200-period moving average. Only ten pips below is another weekly low, which will be the S2 support if the price penetrates the S1 and moves downwards. Both the S1 and the S2 we can consider them as a zone because of the candles marked with (1), (2), and (3). These three candles have long wicks and have recently rejected the area between 0.6600-0.65794. If the price keeps lowering, the next support level will be the S3 weekly low of around 0.65580.
On the other hand, if the price moves upwards, the first resistance, R1, is around 0.66528. If the price penetrates the R1 and moves upwards, the next resistance, R2, is the previous week’s high, around 0.66855. A Gravestone candle caused the price to decline last week, leaving behind a Bearish Order Block.
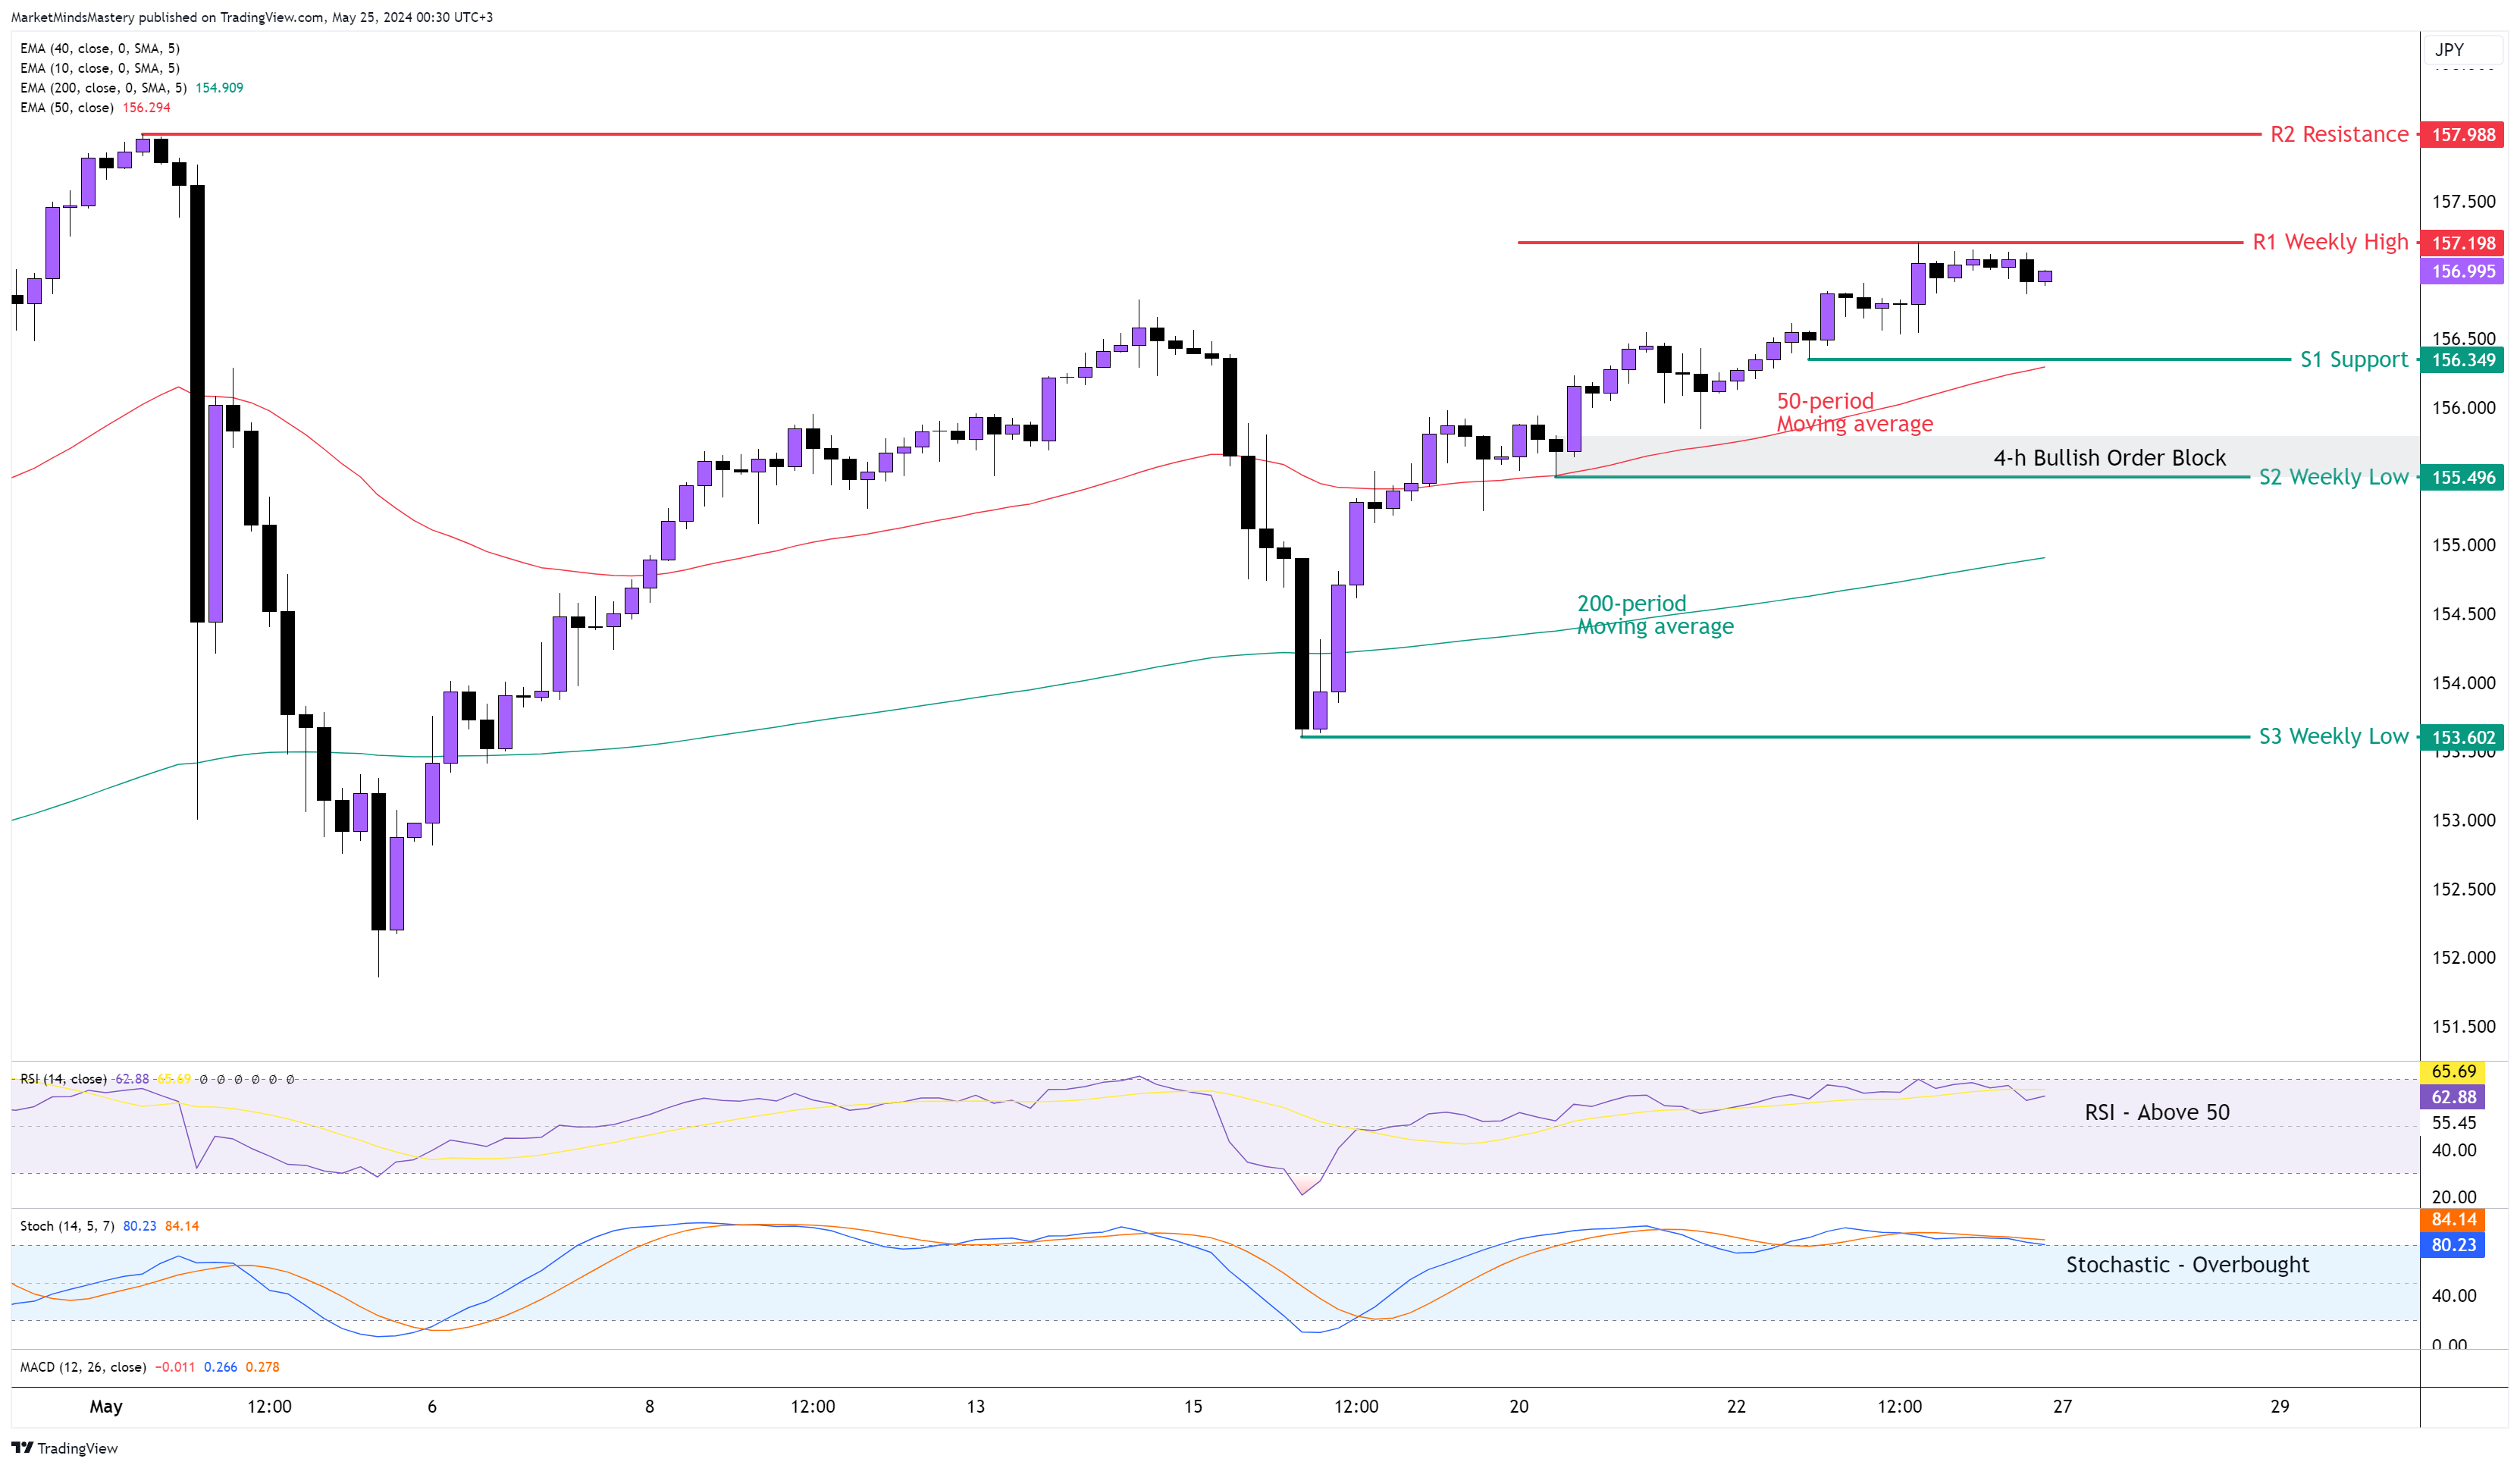
USD JPY 4H
Following the previous market outlook, the price increased as expected as the primary trend rose. The weekly closed with a bullish marubozu candle with almost no upper or lower wick. On the 4-hour chart, the price forms higher highs and higher lows. Generally, the volatility last week was low. Therefore, the candle has small bodies, both the bullish and the bearish candles. The 50-period moving average is in a rising curve, and it is above the 200-period moving average, which has bullish implications. The RSI oscillator is above 50, and the Stochastic oscillator is overbought. Both oscillators indicate a strong bullish market.
Starting Monday, if the price continues to move upwards, the first resistance area, R1, is the previous week’s high, approximately around 157.198. If the price penetrates the R1 resistance and increases, the next resistance area, R2, will be at the 158 level. This level was created on the first of May but hasn’t been tested. If the price closes above the R2, it can move upwards until the ATH(All-Time High), around 160.
On the other hand, if the price is rejected and moves downwards, the first support area, S1, is expected to be at the 156.349 level. This is a swing low and is expected to hold the price on a decline if the uptrend continues. If the price breaks and closes under their S1, the next support area, S2, will be the previous week’s low, around 155.500, with a Bullish Order Block formed last week. A further decline can find the price to the dynamic 200-period moving average.
USD CHF 4H
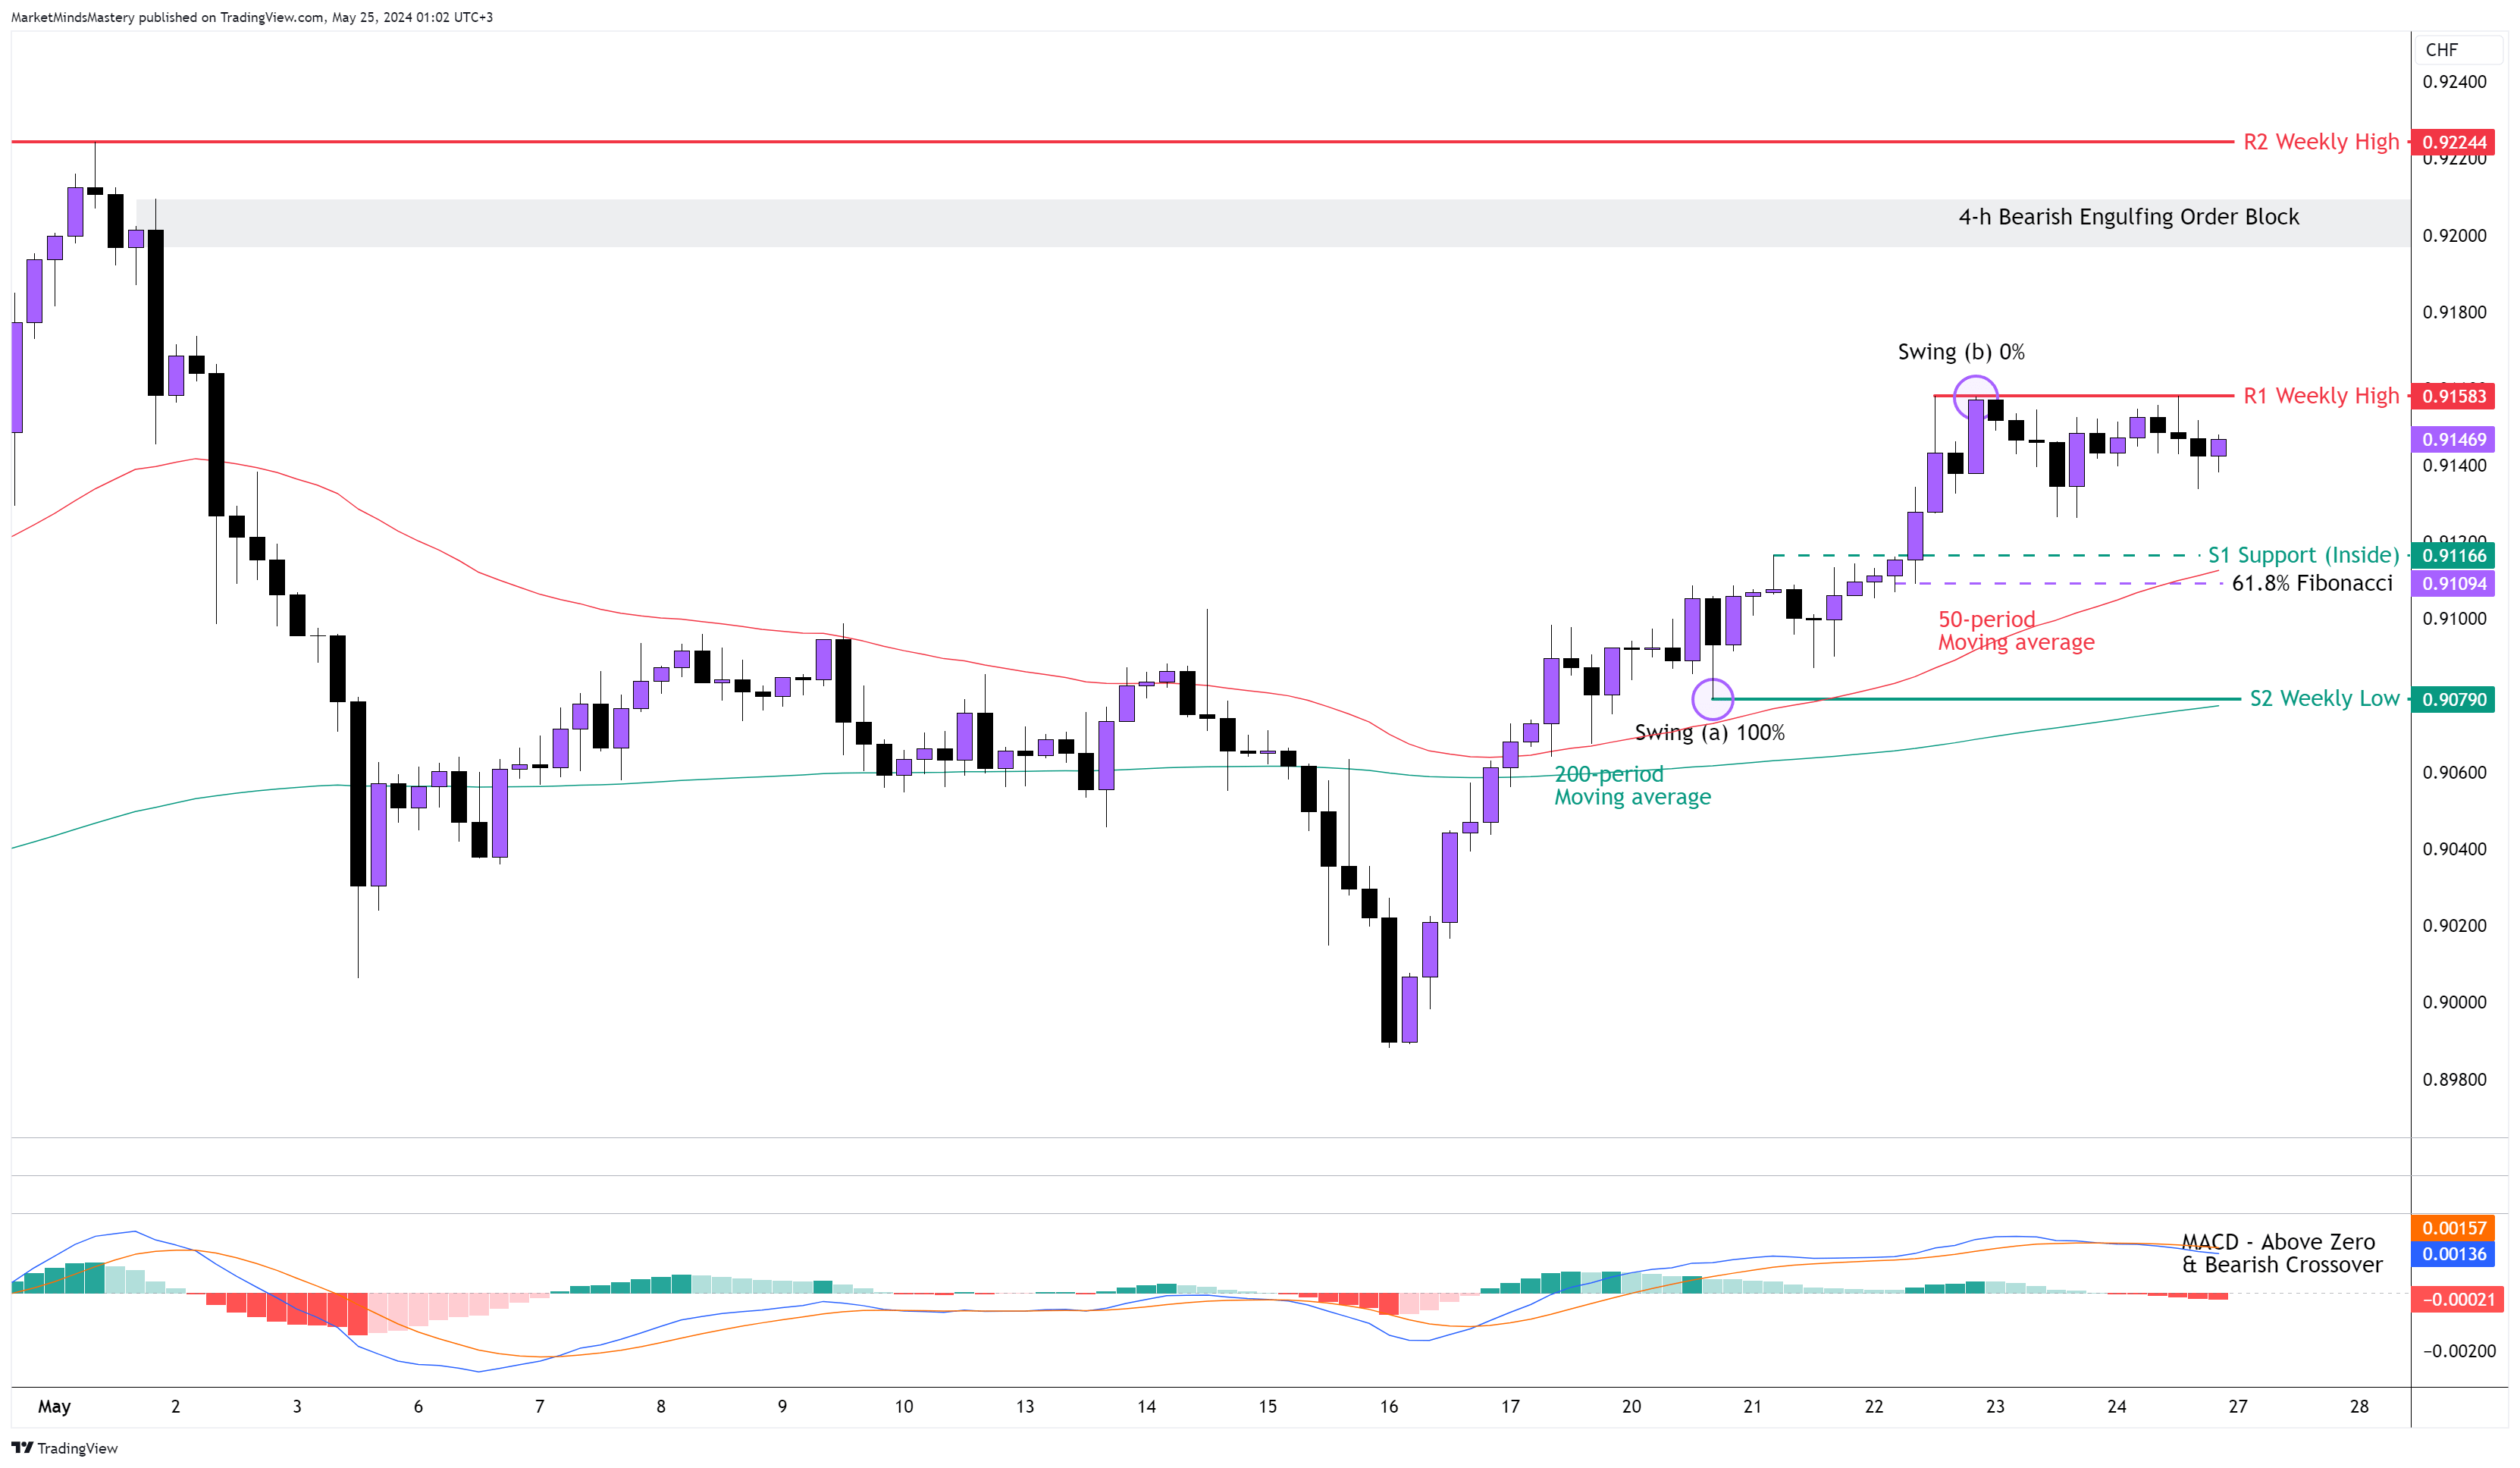
This currency pair was one of the most promising pairs last week. Following the previous market outlook analysis, the price was expected to move upwards, continuing the primary uptrend. The price and moving averages were pointed to an uptrend on the weekly chart. The price action was a hammer reversal. This week, the price moved upwards in a series of higher highs and higher lows, as shown on the 4-hour chart. The 50-period moving average is above the 200-period moving average, indicating bullishness. Despite the MACD being above the zero line, the MACD line (blue) crosses under the signal line (orange), and this is a bearish crossover. The trend will be considered an uptrend as long as the swing at point (a) is not penetrated.
If the price moves downwards, the first support, S1, is an inside support, and it is around 0.91166. It is at a very close distance with the 61.8% Golder Ratio. This area can be considered significant, not only because of these two potential supports but also because of the 50-period moving average clusters with these levels. If the price declines further and moves downwards, the swing at point (a) will be the next support, S2, which is around 0.90790. This is the previous week’s low.
On the other hand, if the price moves upwards, the first resistance is R1, which is the previous week’s high, around 0.91582. If it closes above the R1 and keeps moving upwards, the next resistance area, R2, is another weekly high around 0.92244. A well-defined Bearish Engulfing Order Block was formed some time ago and hasn’t been tested yet.
GBP JPY 4H
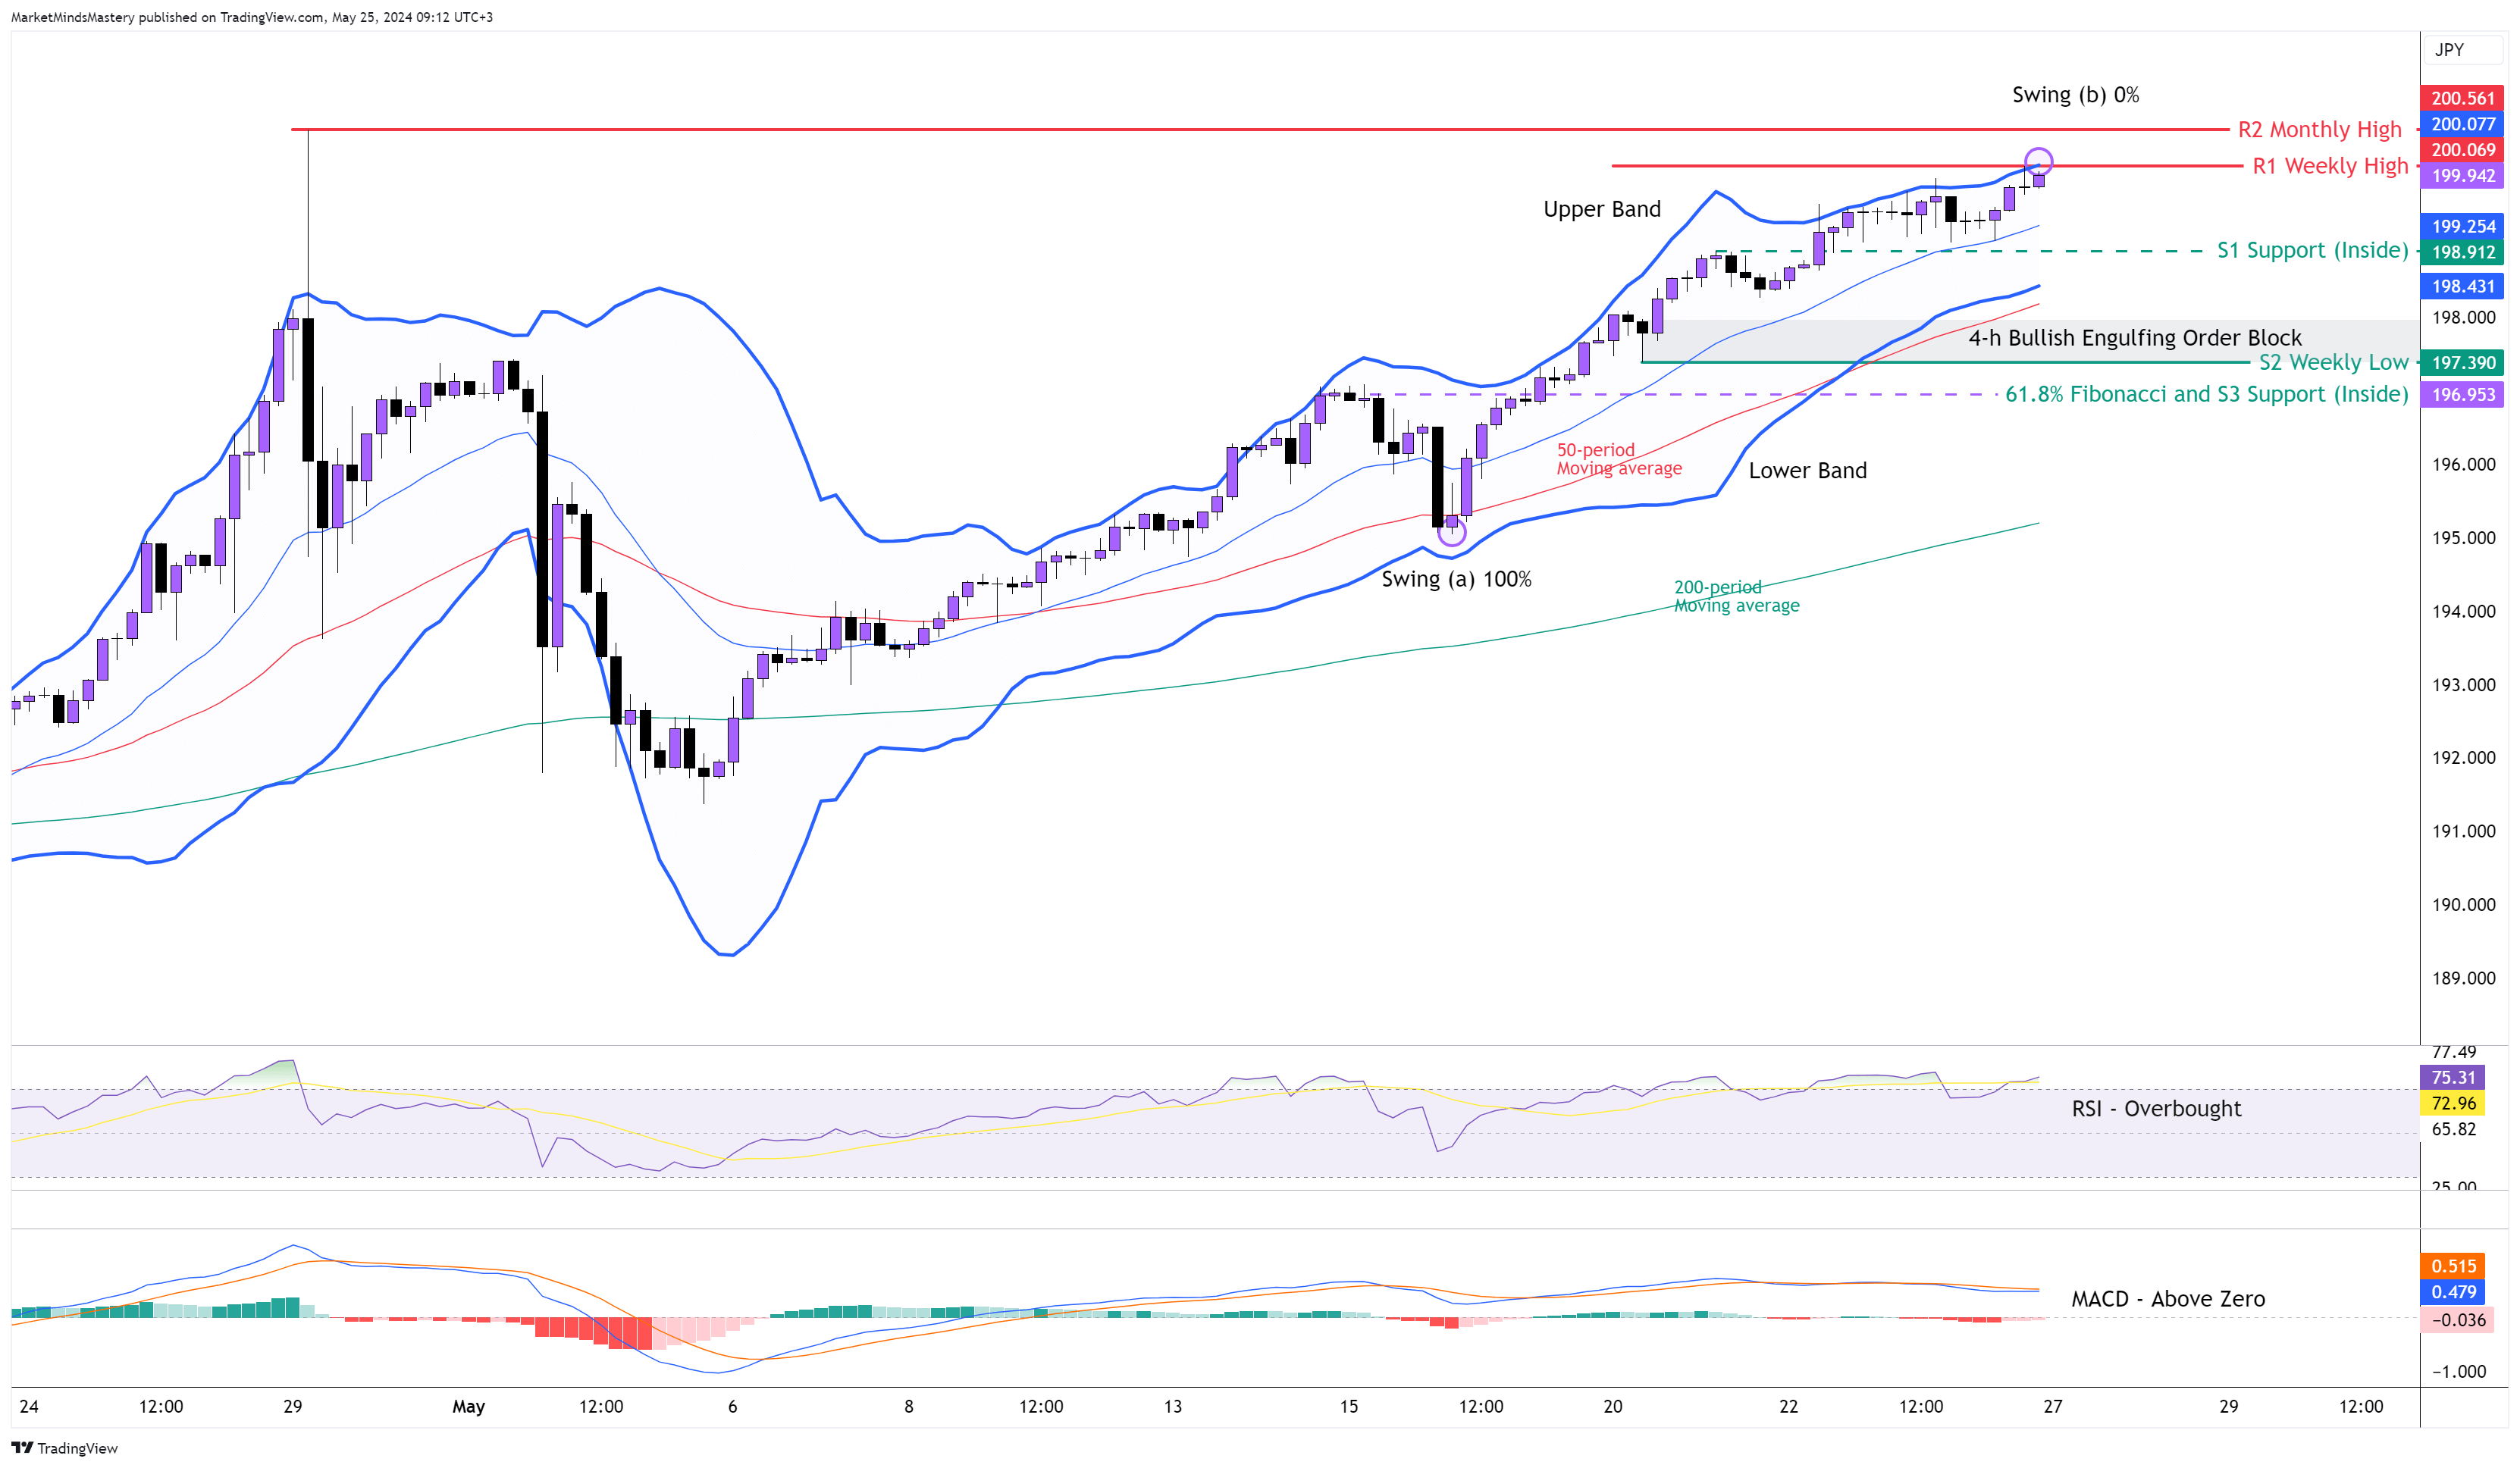
The Japanese Yen weakness was evident due to weak CPI numbers last week, and the strength came in the Sterling, boosting the currency pair. The price rallied, penetrating the resistance levels through higher highs and higher lows but with shallow retracements.
This is a characteristic of a strong uptrend, but at the same time, the prices usually retrace a part of their move before they set off for another rally. Complex retracements like (ABCD) patterns are the most common on these occasions. The strength of the uptrend is apparent on the 4-hour chart, and using the Bollinger Bands, it becomes more visible. Both Bands, the upper and the lower, point upwards, and the price trades above their middle line, which by default is the 20-period moving average. All moving averages are in order as the 20 is above the 50 and the 50 is above the 200, which indicates an uptrend. The MACD is above the zero line, which is a bullish indication. The RSI oscillator is in an Overbought condition and has bullish implications. If the price keeps the uptrend, the first resistance R1, which is the 200, must be broken. The R1 resistance is a round number and is well noticeable by traders who usually place limit orders for an anticipated move. If the price penetrates the R1, close above it and moves upwards at a distance of approximately 50 pips, the next area of resistance is the R2. This level is a monthly high and can have a significant impact.
On the other hand, if the price is rejected and moves downwards, the first support area, S1, is an inside support around 198.91. If the price closes under the S1 and moves downwards, the next support area, S2, is the previous week’s low, around 197.39. At this level, a Bullish Engulfing Order Block was formed.
GOLD 4H
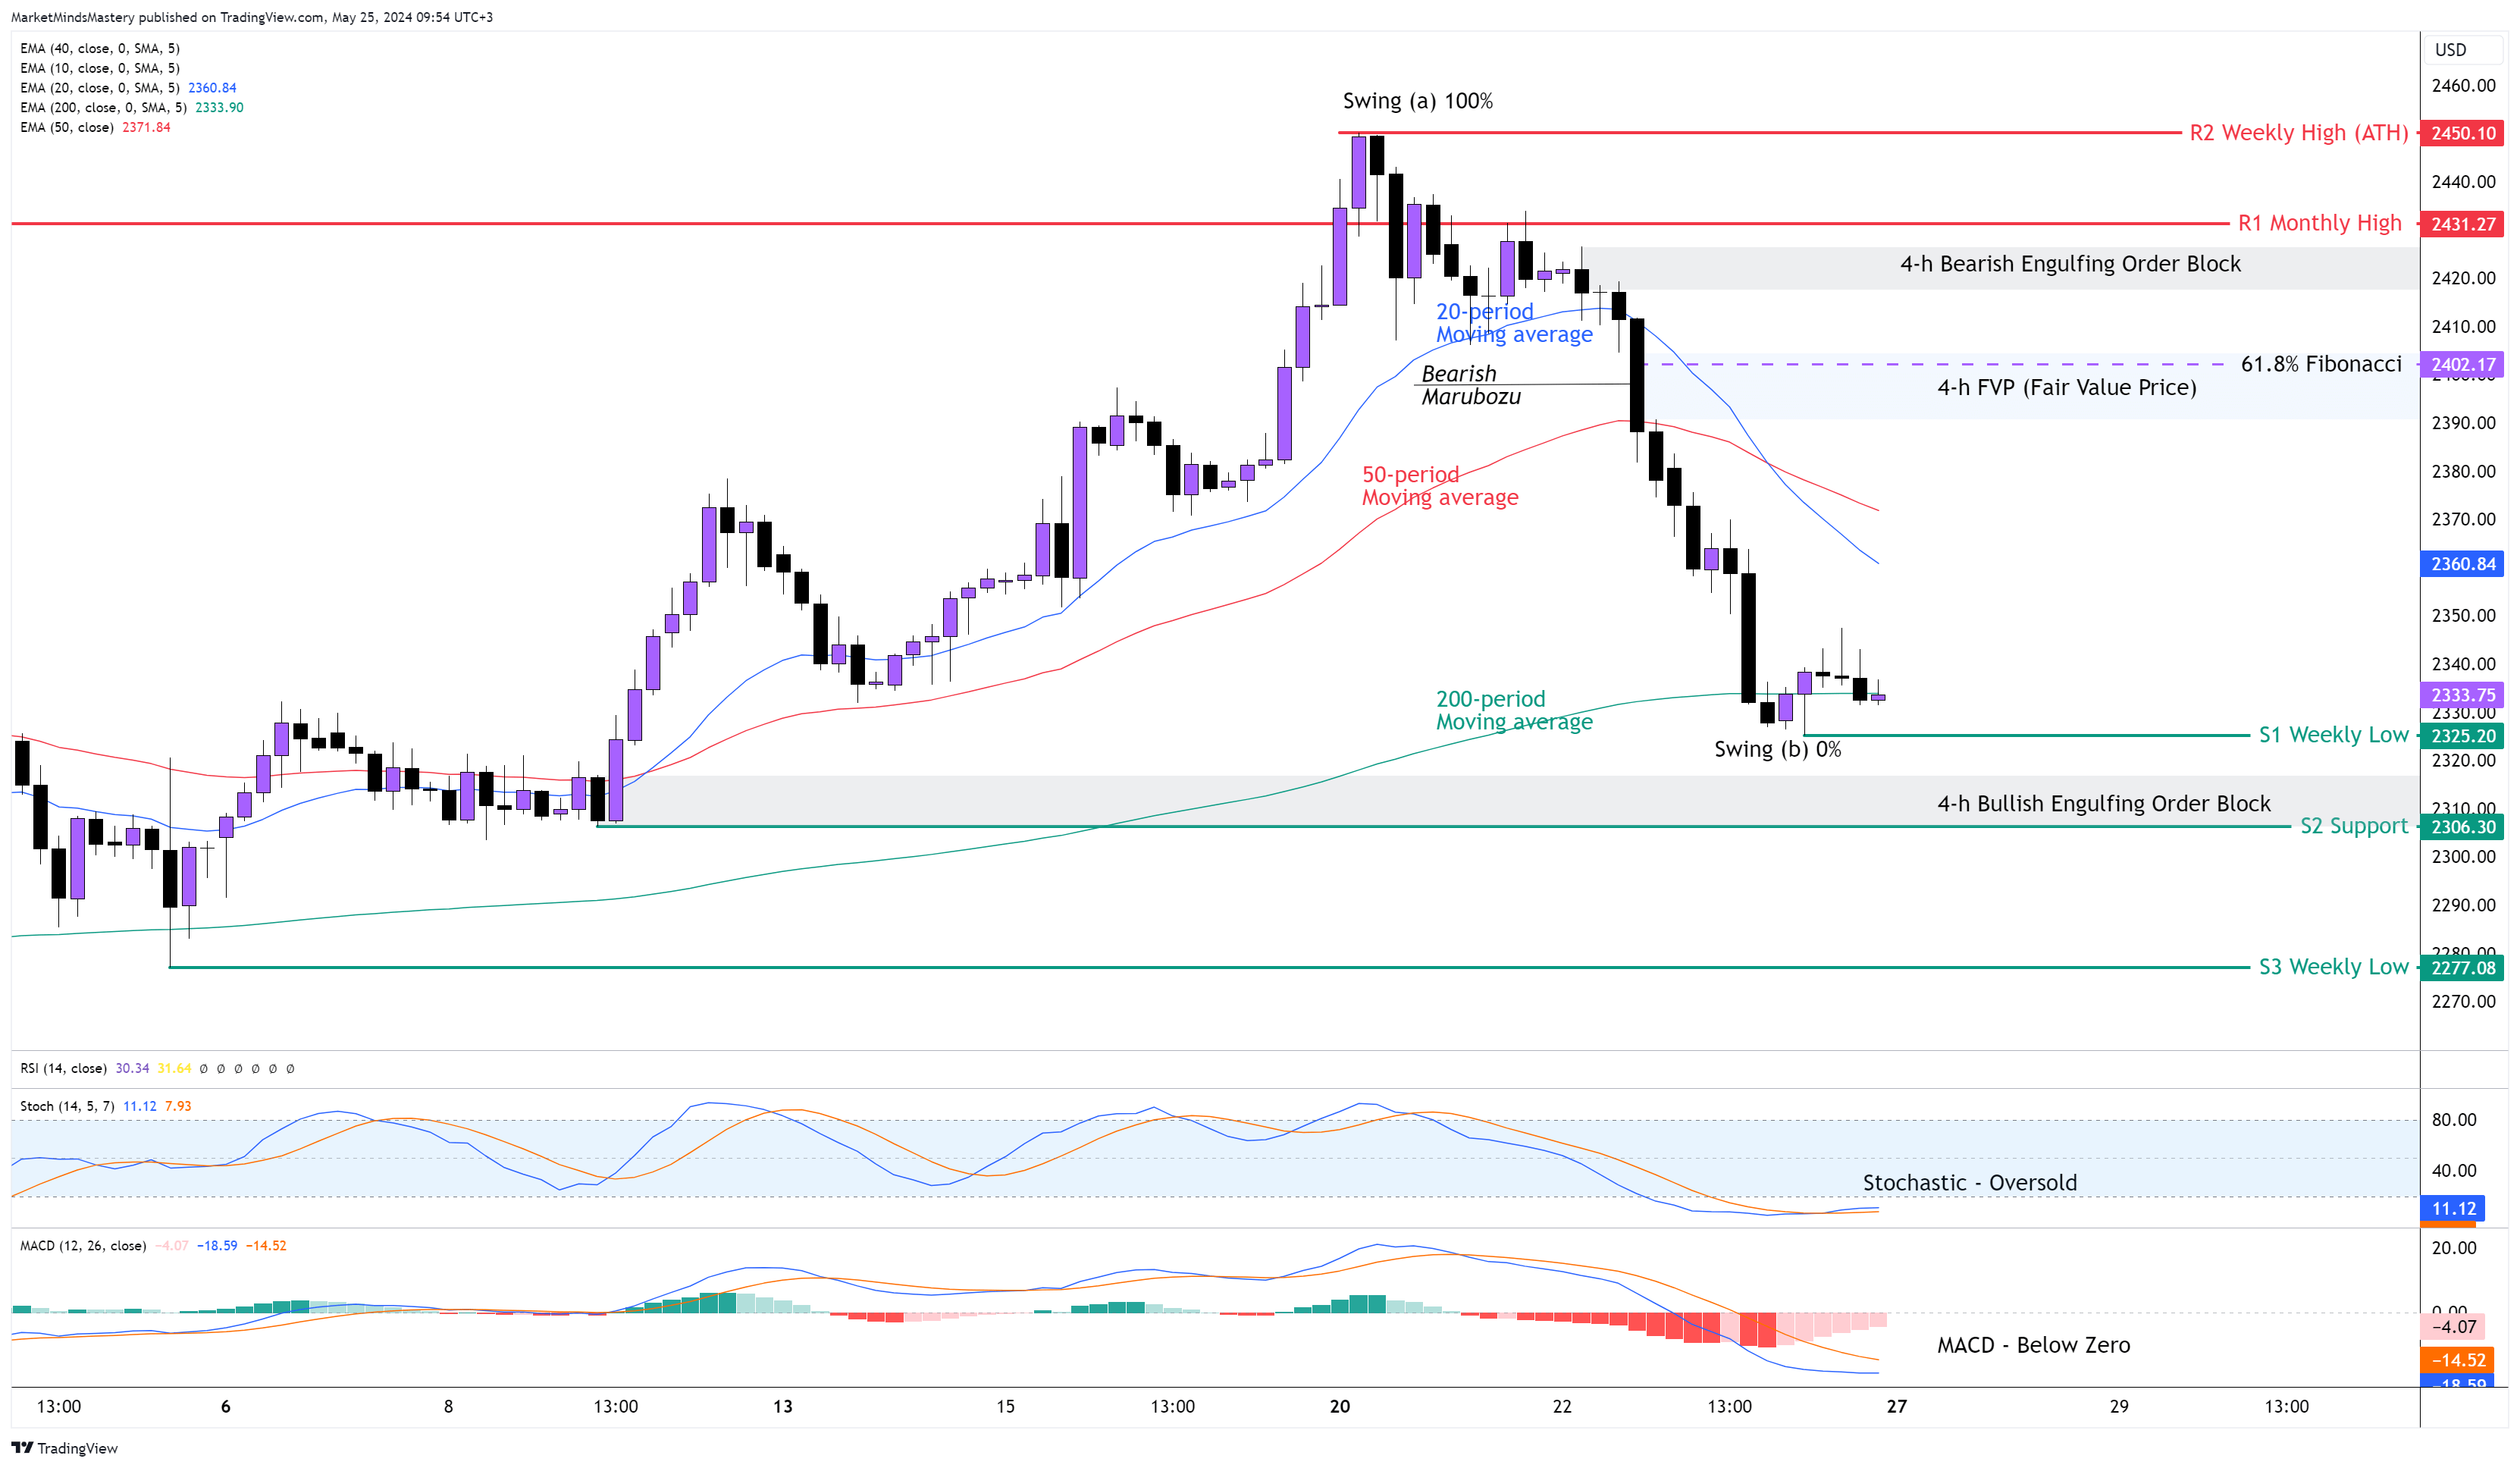
Following last week’s market outlook, the price interacted with the weekly resistance and created a False Break out. The price marked a new All-Time High (ATH) at around $2450. The FOMC last Wednesday fueled the decline of the GOLD, and the market created a downtrend on the 4-hour chart. The 20-period crossed under the 50-period moving average, which is a bearish sign. The price simultaneously made a Bearish Marubozu candle and a Fair Value Price (FVP). The price decline forced the MACD to move under zero, which is a bearish indication. Also, the Stochastic oscillator is in an oversold condition, indicating a strong downtrend. Currently, the price trades at the 200-period moving average, creating the first swing low (b). If the price keeps moving downwards, the previous week’s low, S1, will be the first area of support, around $2325. If the price penetrates the S1 and moves lower, the next support area, S2, will be the $2306. A well-defined Bullish Engulfing Order Block can temporarily act as a barrier to the price.
On the other hand, if the price bounces off and moves upwards, the first significant area of residence will be the 61.8% Fibonacci level measured from swing (a) to swing (b). This level consists of the middle of the Bearish Marubozu and the FVP. Furthermore, around the $2420 level, a Bearish Engulfing Order Block was formed last week. The first static Resistance, R1, is around $2431, which is the previous month’s high.
US OIL 4H
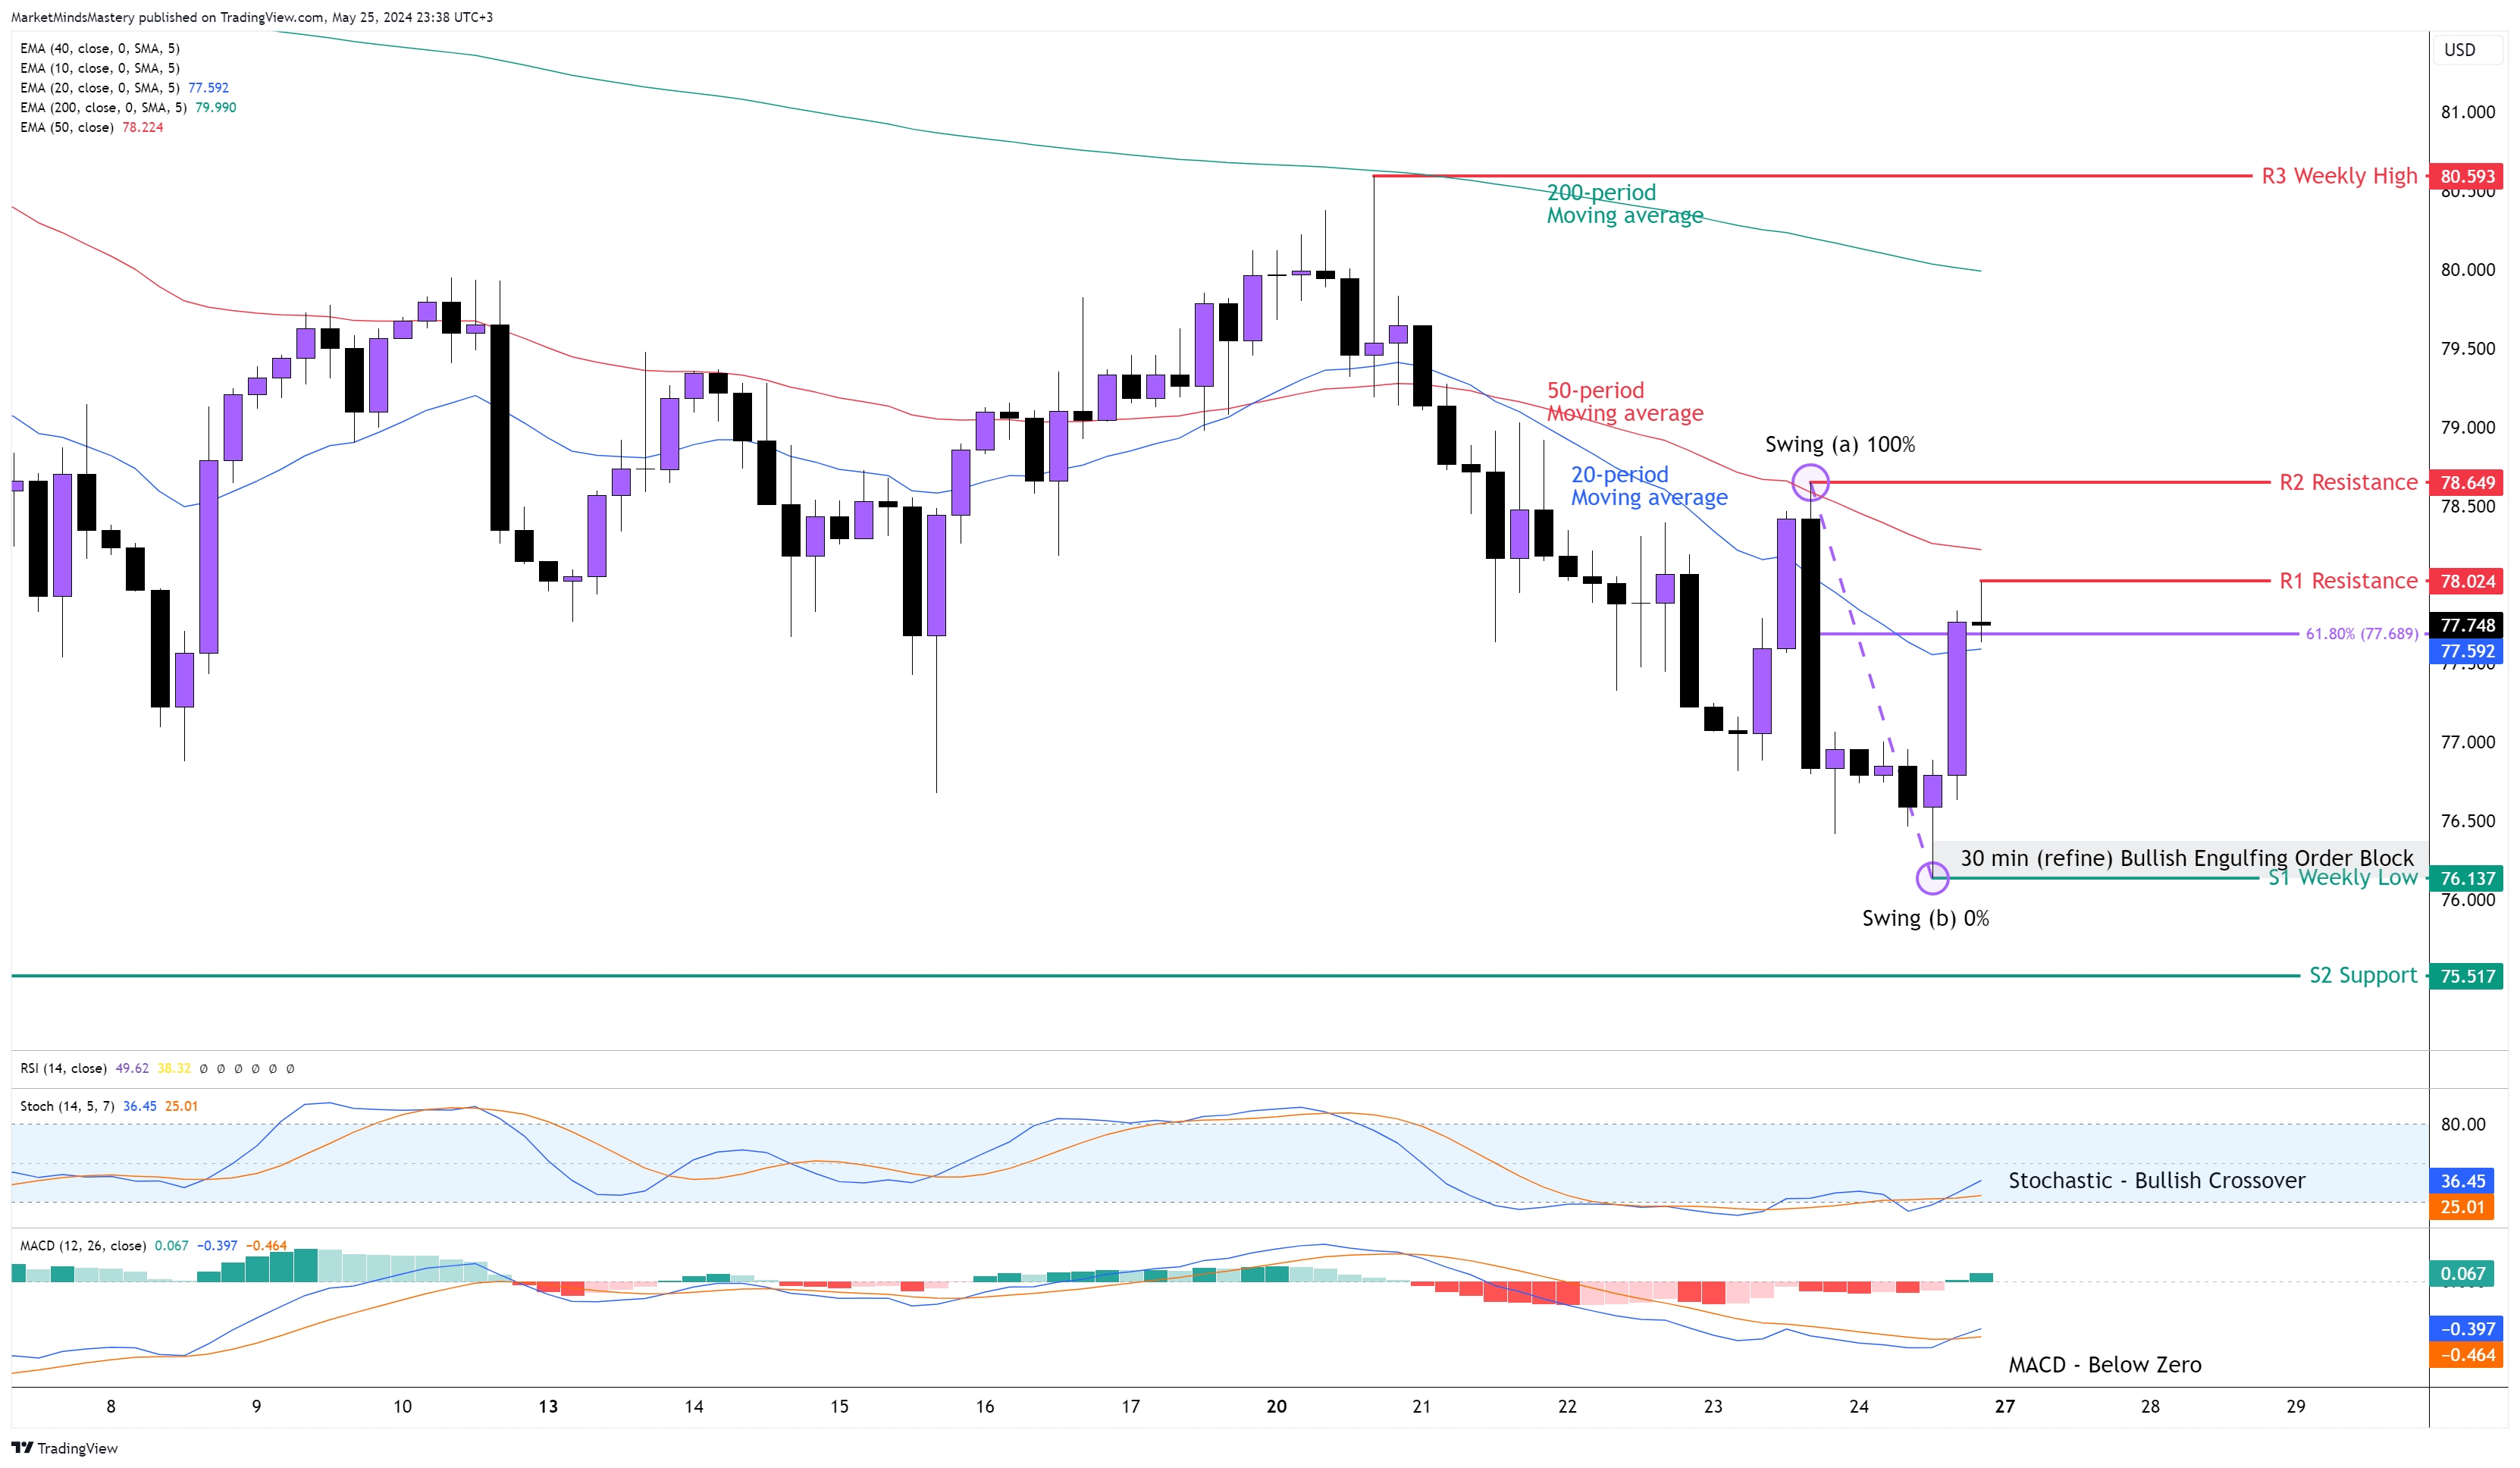
The Bullish Engulfing on the weekly chart didn’t follow through last week, and the price was rejected and moved downwards, resuming the 4-hour downtrend. The 20-period crossed under the 50-period moving average, confirming the downtrend. The 200-period is above both the 20 and the 50 in a wide distance. The Stochastic recently became oversold, and now the fast line crossed above the slow line, which has bullish implications. The MACD is under zero but with a Bullish crossover as the MACD line (blue) crosses above the Signal line (orange), which explains that the price is likely to be in a corrective phase. As the price makes lower highs and lower lows, it can be considered a downtrend. If the price continues downwards, the first support area, S1, will be the previous week’s low at $76.13. A Bullish Engulfing Order Block was created on the 30-minute chart, the marked area on the chart above.
If the price closes under the S1 support and keeps moving downwards, the next support area, S2, will be around $75.50. It will be approximately 60 pips under it. On the other hand, if the price finds support, bounces off and moves upwards, the first resistance area, R1, will be around $78. In this area, there is a Fibonacci retracement of 61.8% from the swing point (a) to the swing point (b). If the price penetrates the R1 and keeps moving upwards, the next resistance area, R2, is approximately $78.65, which, in this case, the price will have to retrace 100% of its move, and the downtrend needs to be questioned.
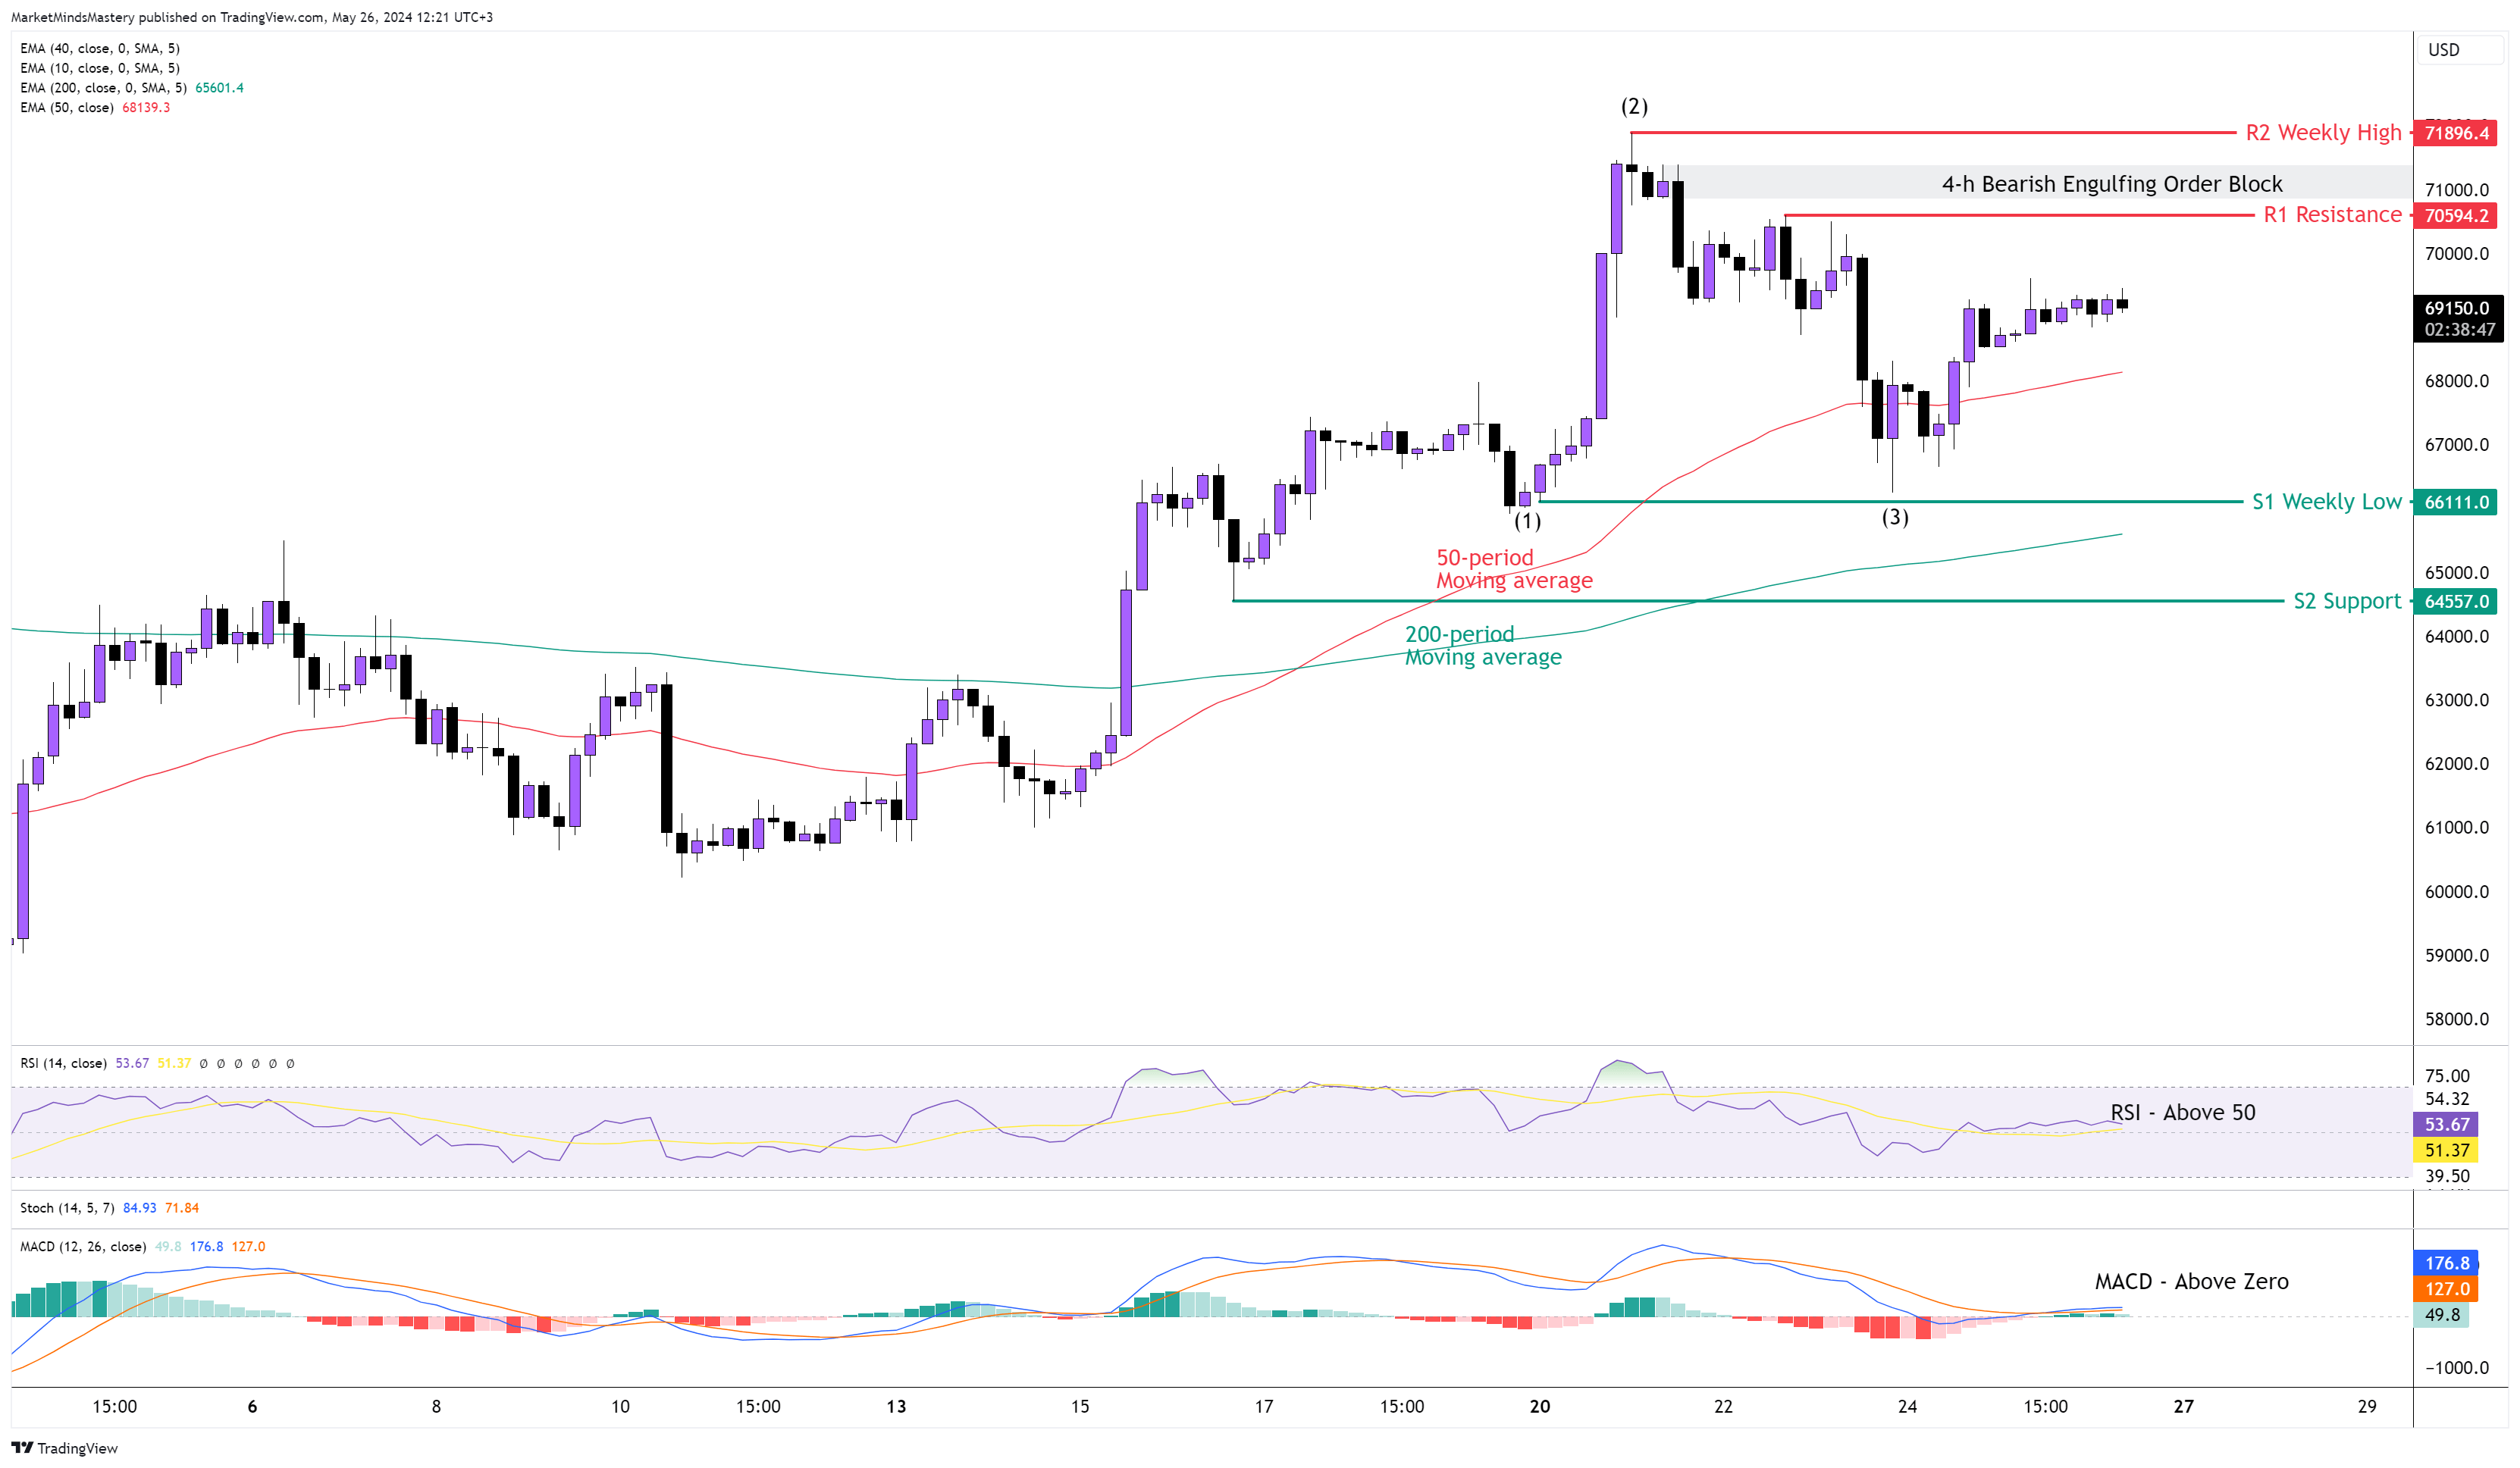
BTC USD 4H
The enthusiasm among traders and investors is the primary force behind the upward momentum in cryptocurrencies. With Bitcoin leading in volume and price, the market, for another week, rallied and created a higher high and higher low on the 4-hour chart. Currently, the rising prices keep the 50-period moving average above the 200-period moving average. The RSI oscillator is above 50, a clear indication of an uptrend. The MACD is above the zero line, and this has bullish implications. The MACD Line (blue) croissant above the Signal Line (orange), which the indicator trades above zero, confirms the market’s uptrend. The swing at point (3) almost traded at the same level as at point (1), indicating some kind of market weakness. Starting Monday, if the price continues to increase, the first resistance area, R1, will be $70594, a level tested twice last week. If the price penetrates the R1 and moves higher, the next resistance area, R2, is around $71896. This is the previous week’s highest price and an area with a Bearish engulfing Order Block.
If the price is rejected and moves downwards, the first support area, S1, will be $66111, the previous week’s low. A further decline leads to the next support, S2, around $64557.
SP 500 4H
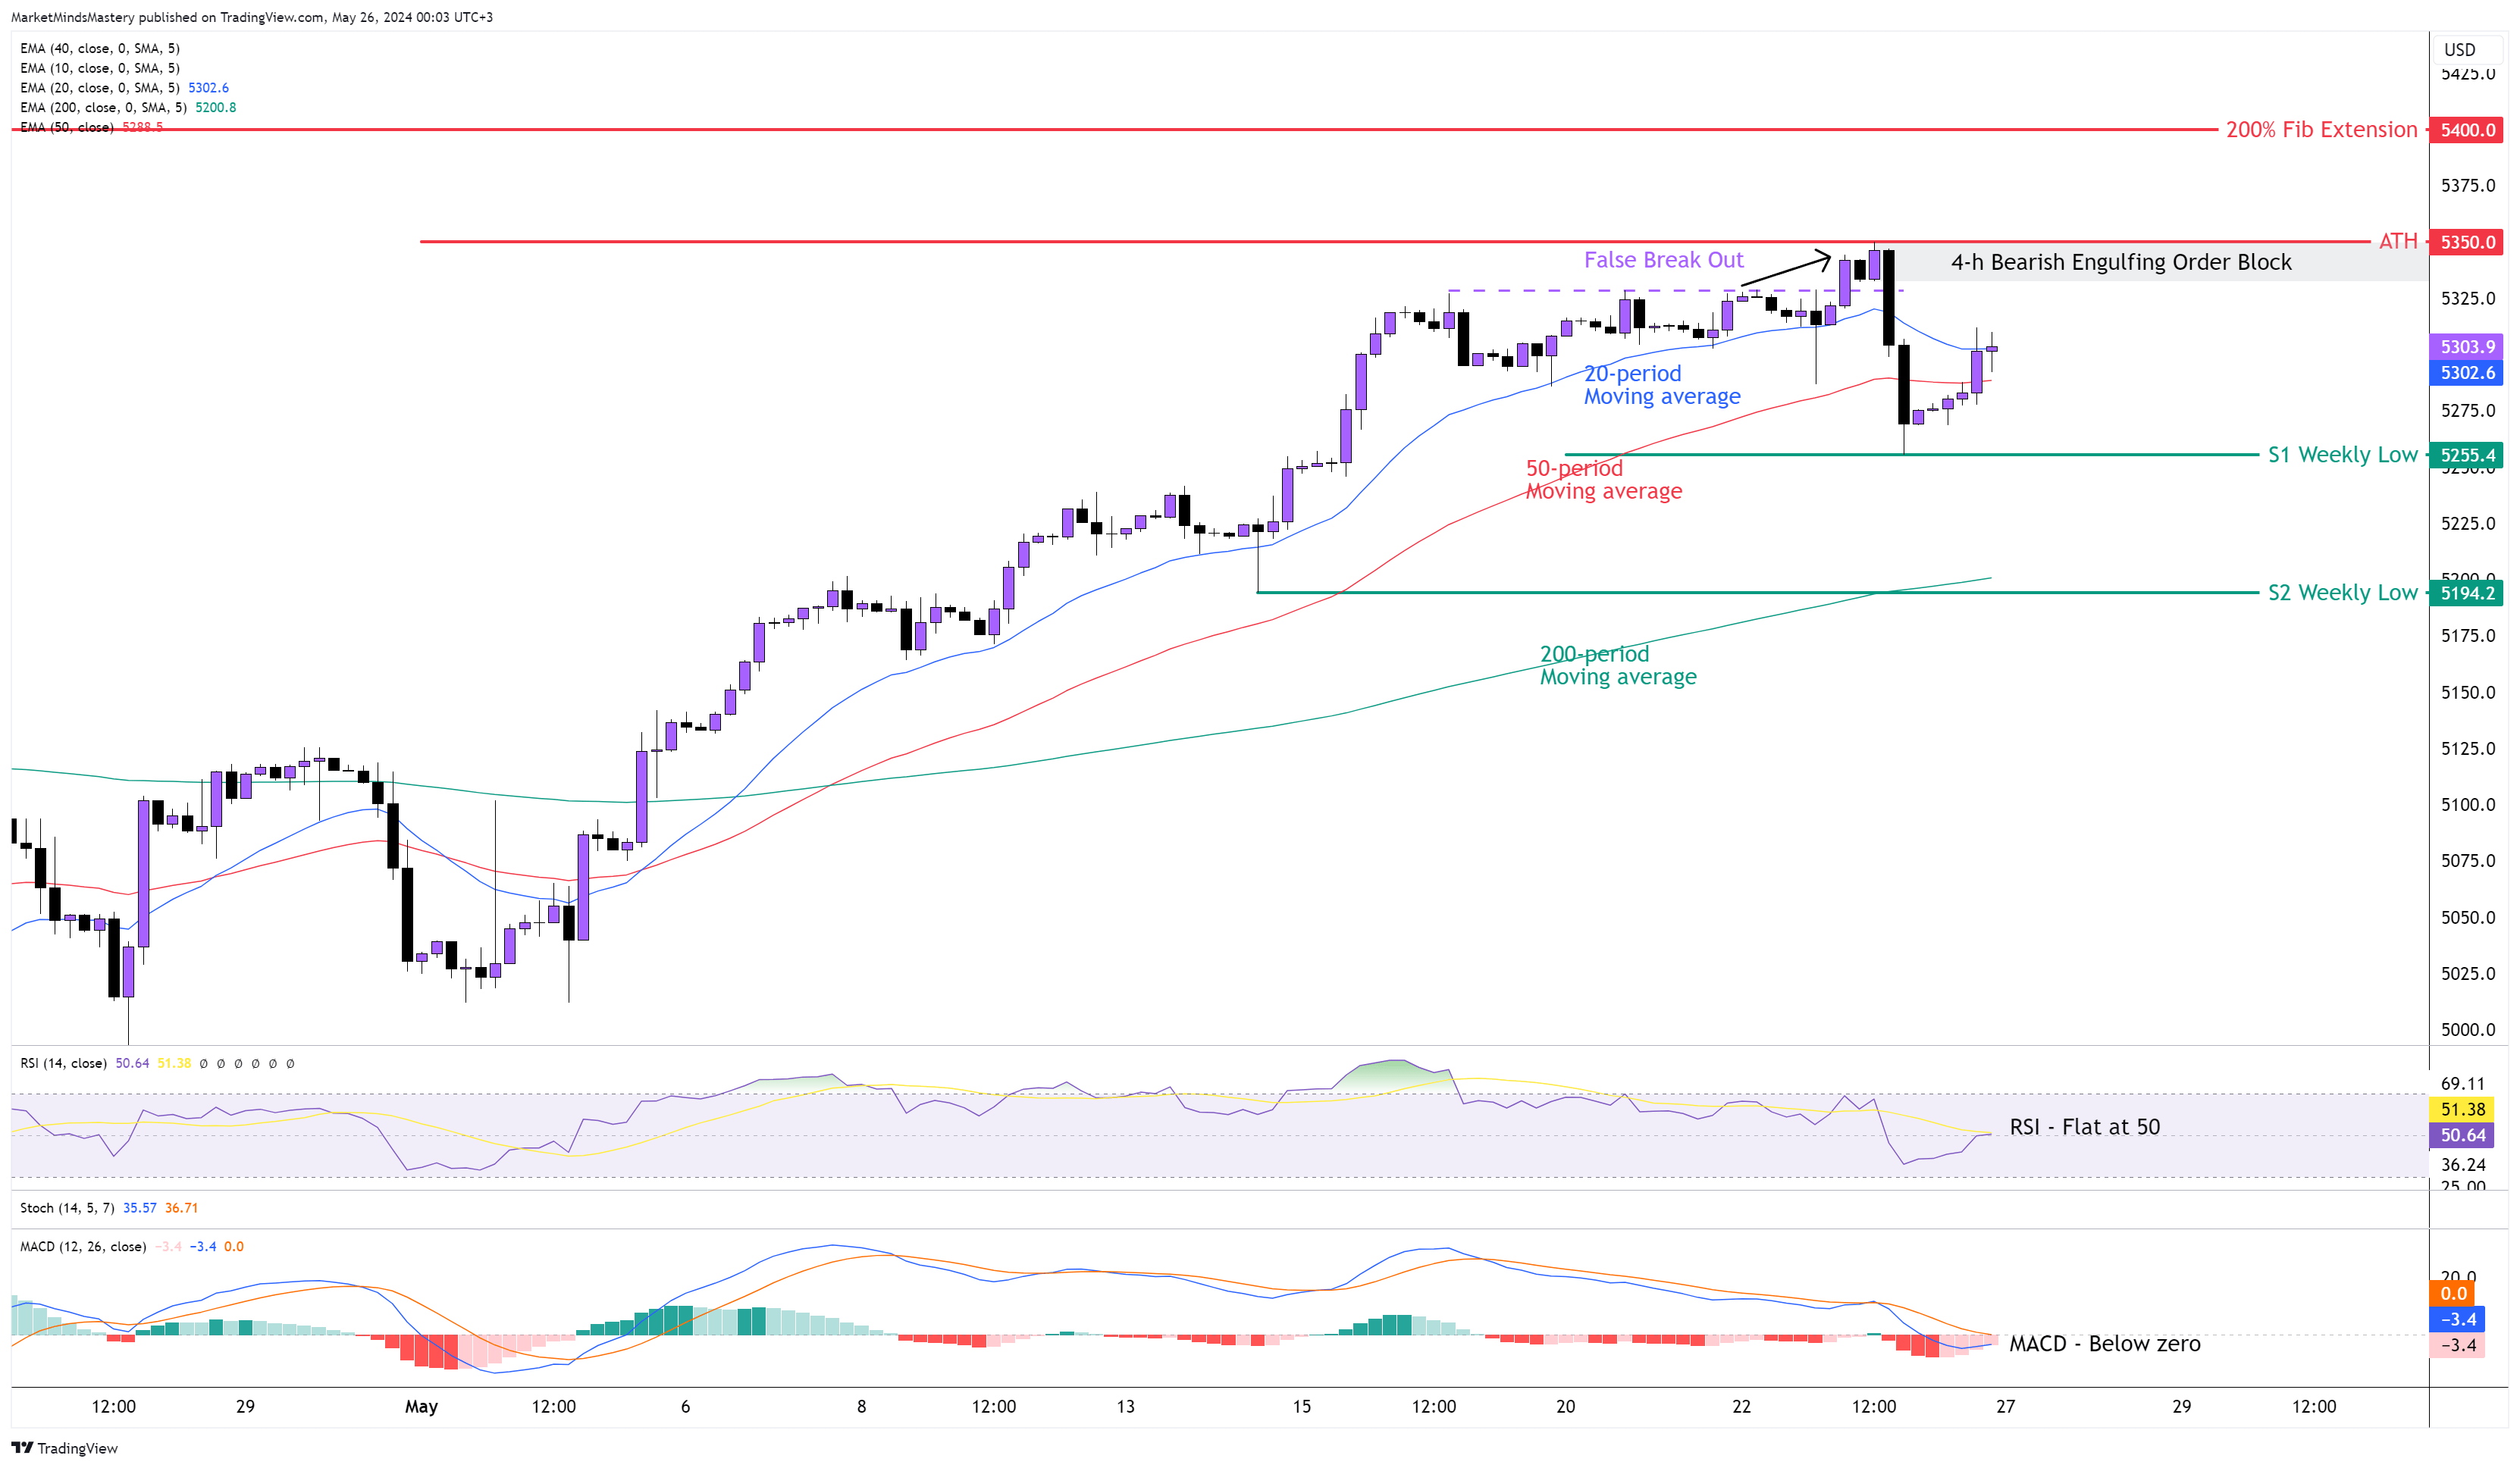
The primary uptrend on the SP 500 continues, and the previous week, the market closed with a new All-Time High (ATH) around $5350. This is a significant price for the Index despite the weekly candle created last week being a doji. A doji candle is not considered a reversal price action in candlesticks analysis. However, when it is found after a few bullish candles, it usually starts the price correction. On the 4-hour chart, the price showed a strong sell-off on Thursday during the New York Trading session with the two long black candles. Despite that, the 20-period moving average is above the 50-period, and both are above the 200-period moving average. This setup indicates the trend is upward. As the price hasn't created the structure of lower highs and lower lows, we can't define a downtrend.
Additionally, based on swing analysis, the uptrend is not in tack anymore on this timeframe due to the penetration of the swing low that deifies the boundaries of the last upward move. For this reason, we see the RSI as flat at around 50. The MACD is below the zero line, which indicates bearishness. Starting Monday, if the weekly doji sets the price in a downward corrective phase, the first support area, S1, will be around $5255, which is the previous week’s low. If the price penetrates the S1 and moves lower, the next support area, S2, will be $5194, another weekly low price.
Oppositely, if the price bounces off and moves upwards, the first resistance area, R1, will be ATH around $5350. A move above this will lead to $5400 due to the Fibonacci extension of 200%.
US 30 4H
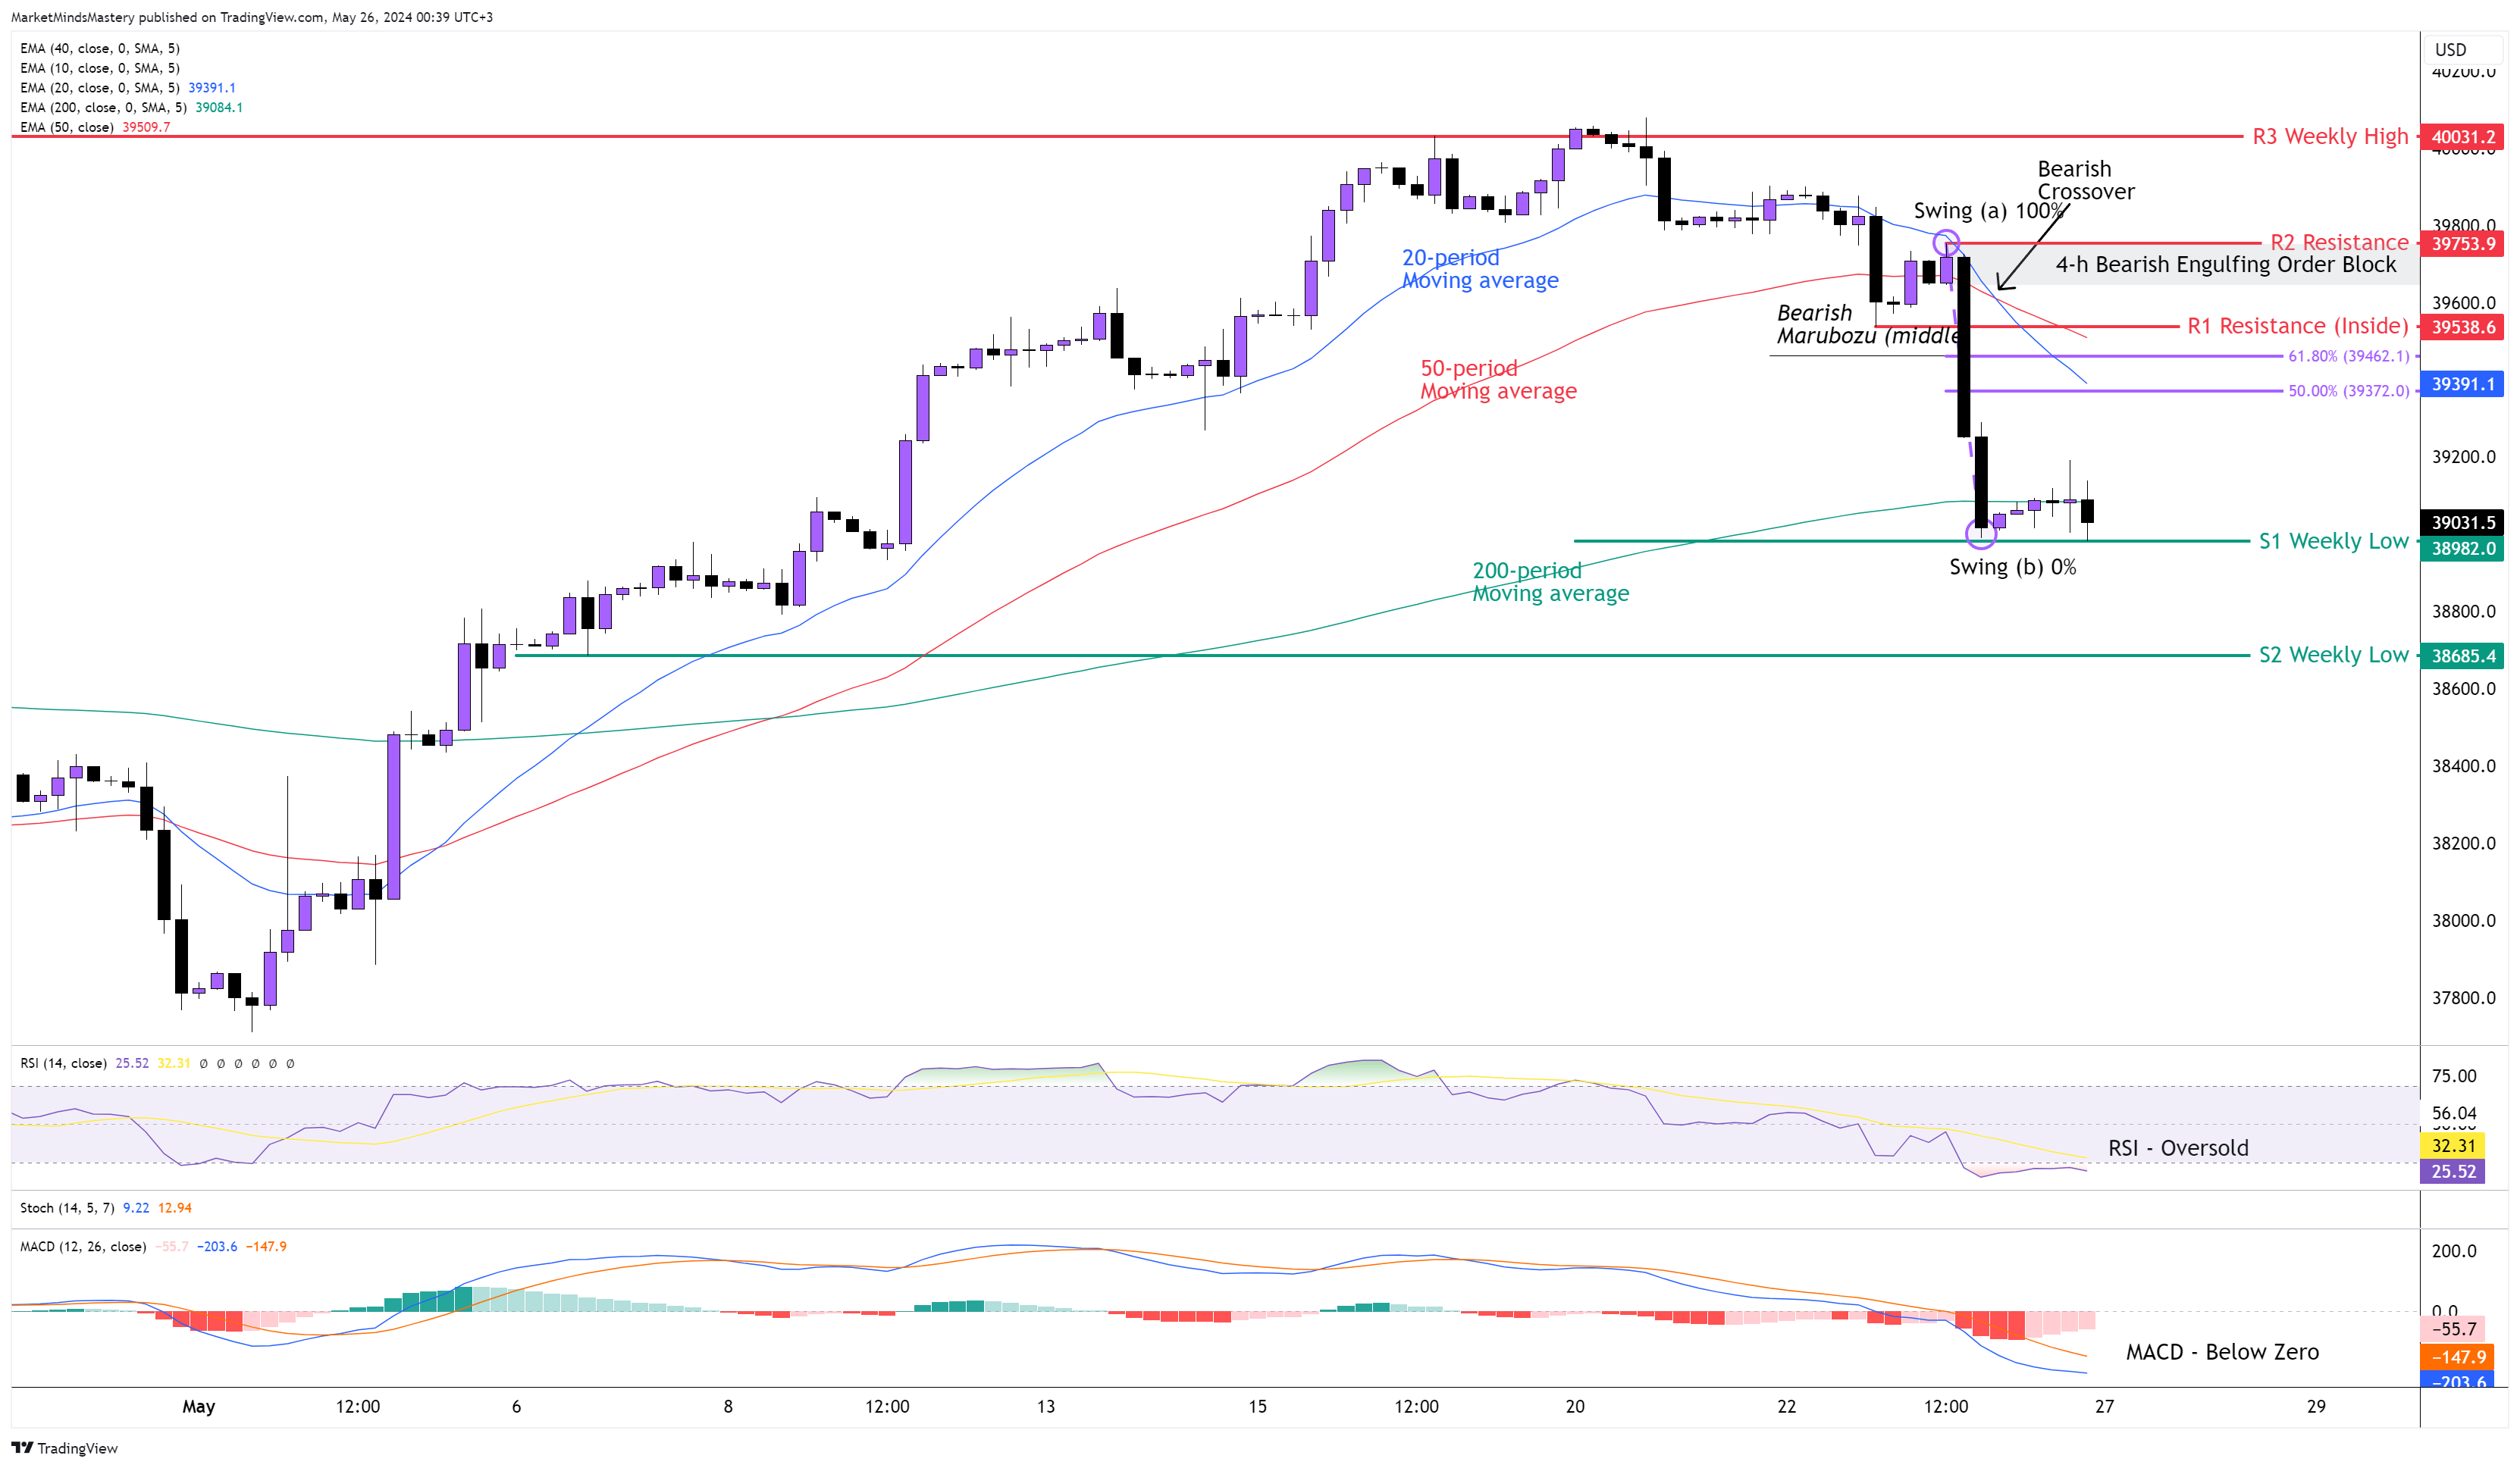
The US 30 was the weakest of the three major US Indices last week. On the weekly chart, a Bearish Engulfing formed exactly at the ATH price level around $40000. The RSI and the MACD show the Negative Divergences “B” class on the weekly chart. Although we don't trade the weekly timeframe, these indications are worth mentioning.
The first situation in the 4-hour timeframe is the bearish crossover of the 20-period and 50-period moving averages. The RSI is in an oversold condition, showing a strong downtrend. The MACD is below zero, with the MACD line (blue) under the Signal line (orange). The market structure changed on the 4-hour chart, and the price created a series of lower highs and lower lows. The last downwards impulsive move was due to the large bearish candles (black).
Currently, the price is at the 200-period moving average. If it finds support, bounces off, and moves upwards, the first resistance area, R1, will be the inside resistance around $39538. This price level is approximately the same area as the 61.8% Fibonacci retracement from swing (a) to swing (b) and with the middle of the bearish marubozu candle. If the price breaks above the R1, closes above it and moves upwards, the next resistance area, R2, will be around $39800.
This level is significant because it is the starting point of the recent downward move, and a Bearish Engulfing Order Block was created last week. If the price declines and moves downwards, the first support area, S1, will be $399802, the previous week’s low and the next support, S2, another weekly low, around $38685.
GER 30, 4H
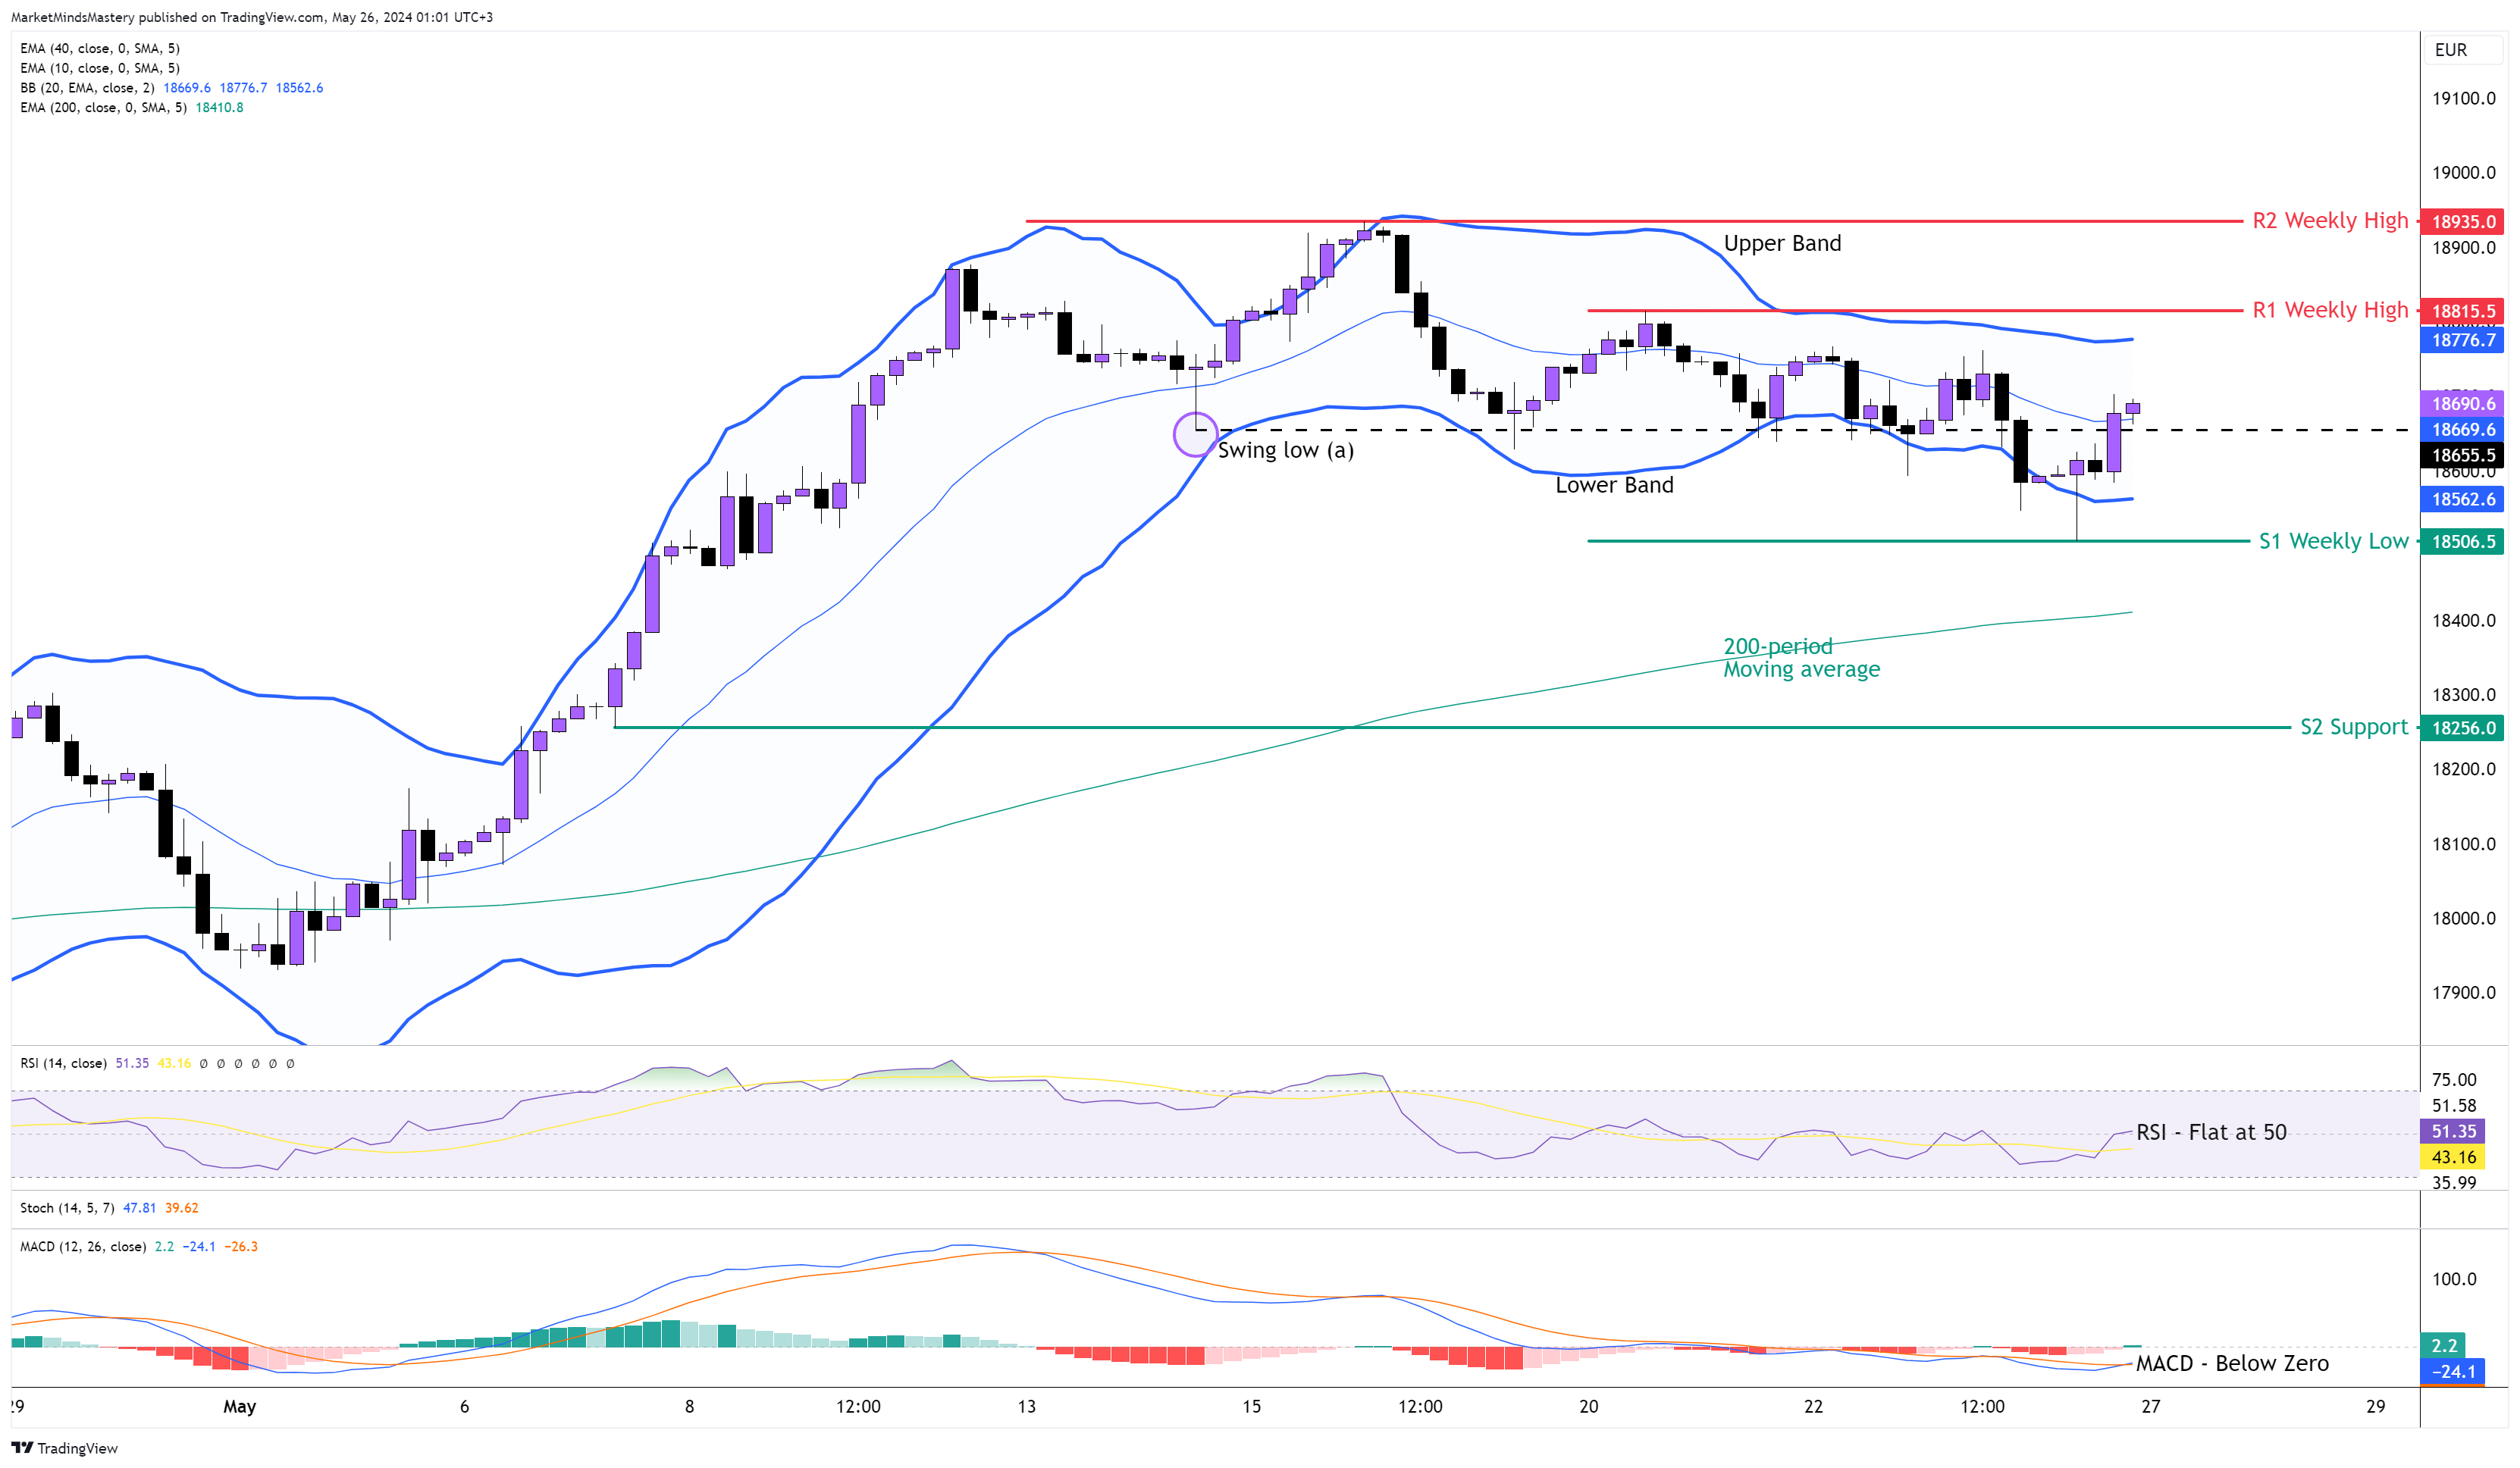
The negative divergences from last week set the price to a downward correction. The move wasn't enough to create a long bearish candle on the weekly chart, and the week ended with a weekly doji candle followed by a spinning top candle. On the 4-hour chart, the price looked like it created a downward market structure with a lower low and a lower high. However, the price didn’t stay below the broken swing low (a). On Friday, it closed above the swing.
In most cases, it induced a market weakness to follow through a breakout. The RSI is around 50, indicating a more directionless phase rather than a trend. The MACD is under the zero with a bullish crossover. Looking at the Bollinger Bands, the price trades closer to the lower band rather than the upper band.
Starting Monday, if the price keeps moving upwards, the first resistance area, R1, will be $18815, the highest price the market traded last week. If the price breaks above the R1, closes above it and moves higher, the next resistance area, R2, will be $19835, another weekly high.
On the contrary, if the price is rejected and moves downwards, the first support area, S1, will be $18500, the previous week’s low. A close under the S1 and a move lower finds the 200-period dynamic moving average acting as a potential support. If the price moves under the 200-period, it will find the next support, S2, around $18256.
👉 Click here to check our Challenges
👉 Don’t miss our Free Live Webinars
👉Join us on Discord
Risk Disclosure:
The Trading Pit offers only demo accounts to all users within the Challenges and Signal Provider Agreements (Scaling Plan). All assets and trading activities are purely virtual. Please note that we do not offer CFD (Contract for Difference) challenges to residents of Canada and the United States. All content and information on this website is for informational purposes only and should not be interpreted as financial advice. Also, remember that results achieved in the past are no guarantee of future results. It is essential to understand the risks associated with trading. If you are unsure, always consult an independent financial advisor.