The Trading Pit Week Ahead Market Outlook (June 03 – June 09)
The Swissy was the dominant currency last week, primarily due to the GDP, which reported much higher than the forecast. All the other currencies depreciated against the Swiss Frank. The other important outcome was the Japanese Yen’s performance. The CPI number in Japan was higher than the previous report, and the Japanese Yen didn't follow through, resulting in its price falling against all the other currencies.
On Monday, during the New York session in the US, they will report the ISM Manufacturing PMI for May. The consensus estimates an increase in the number, but it is expected to remain under 50. It is worth mentioning that the USOIL market is expected to experience significant fluctuations because of the OPEC meeting the previous day.
On Tuesday, 30 minutes before the London Open in Switzerland, they will announce the CPI (Consumer Price Index) numbers. The previous monthly report was 0.3%, and now they expected an increase to 0.4%. Additionally, the yearly CPI number will be reported, which means they compare the Consumer Price Index in the same month with the year before. The markets usually react much more based on the yearly CPI than the monthly.
In the US, the job openings are expected to drop from 8.49 million to 8.4 million. As it's the first week of the calendar month, the NFP will be reported on Friday, which is an early indication of what might happen with the NFP. The last event in the US will be the Factory Orders report. Based on the forecast, a drop from 0.8% to 0.7% is expected. Factory orders also relate to the CPI and the country's exports, which can affect the value of US DoIlar.
Wednesday is expected to be a “busy” day. Starting from Australia, the first quarter's GDP (Gross Domestic Product) will likely remain at 0.2%. Any reported number besides the 0.2% will create a lot of fluctuation in the Australian dollar. As it is Wednesday and a few days before the NFP, the ADP report is expected to increase from the previous month’s report from 192K to 180K. This is an early indication that the NFP event will be on Friday. Less than a few hours later, the Bank of Canada is about to surprise the markets with the interest rates report. Currently, the Interest Rates in Canada are 5%, and they estimate a drop to 4.75%. This will bring immense volatility in the Canadian dollar and the USD. Therefore, a cautious approach to intraday positions is required. It is the first time since 2022 that the BoC (Bank of Canada) has considered dropping interest rates. If the actual confirms the forecast, we expected the value of the Canadian dollar to fall and see a strong sell-off on the charts. Last will be the ISM Services PMI in the US, and this time, the forecast suggests an increase in the number from 49.4 to 50.5, which can be considered bullish for the US Dollar.
On Thursday, the main focus will be on the Euro, but before that, the trade balance will be reported in Australia. The currency number is 5.024 million.
In the Eurozone, there will be Parliamentary elections, the Retail Sales report, and the European Central Bank will report the new Interest Rates for the month. Retail sales are currently at 0.7%, and no forecast is given. The Euro will experience its highest fluctuation on the day once the Interest Rates are reported, and surprisingly or not, the European Central Bank estimates dropping the rates from 4.5% to 4.25%. As the EURUSD is trading within a narrow trading range, the price of the Euro will likely fall first if the interest rates decrease and the Euro follows through. (Remember that Japan’s CPI increased the previous week, but the Yen didn’t follow through. Therefore, the JPY depreciated). Hence, it is very important after negative or positive news, the currency to follow through the news,
On Friday, initially, the Eurozone's GDP (Gross Domestic Product) is expected to remain at 0.3% as per the consensus. This numerical stability doesn’t help the Euro to advance. Next, the Unemployment Rate in Canada is currently at 6.1%. A continuously rising unemployment won’t help the Canadian Dollar to strengthen because if more Canadians keep receiving paychecks from the government due to employment issues, it will simply negatively affect the Loonie (Canadian Dollar).
As this Friday is the first Friday of June, the market participants will be anticipating the NFP (Non-Farm Payrolls). As per the consensus, the NFP is estimated to be reported at 180K new payrolls to be added in the US compared with the 175K new payrolls added as per the previous report.
During the week, the BoC and the ECB will report, as per the consensus, lower interest rates than the current ones. If the actual numbers confirm their forecasts and if the NFP reports positive, the volatility on the EURUSD and the USDCAD and the downside and the upside, respectively, can cause major trend reversals. Sometimes, the major currency pairs, the first week of each calendar month theory, are moving a bit sideways until the NFP report, and then a directional move occurs, which is normal price behaviour.
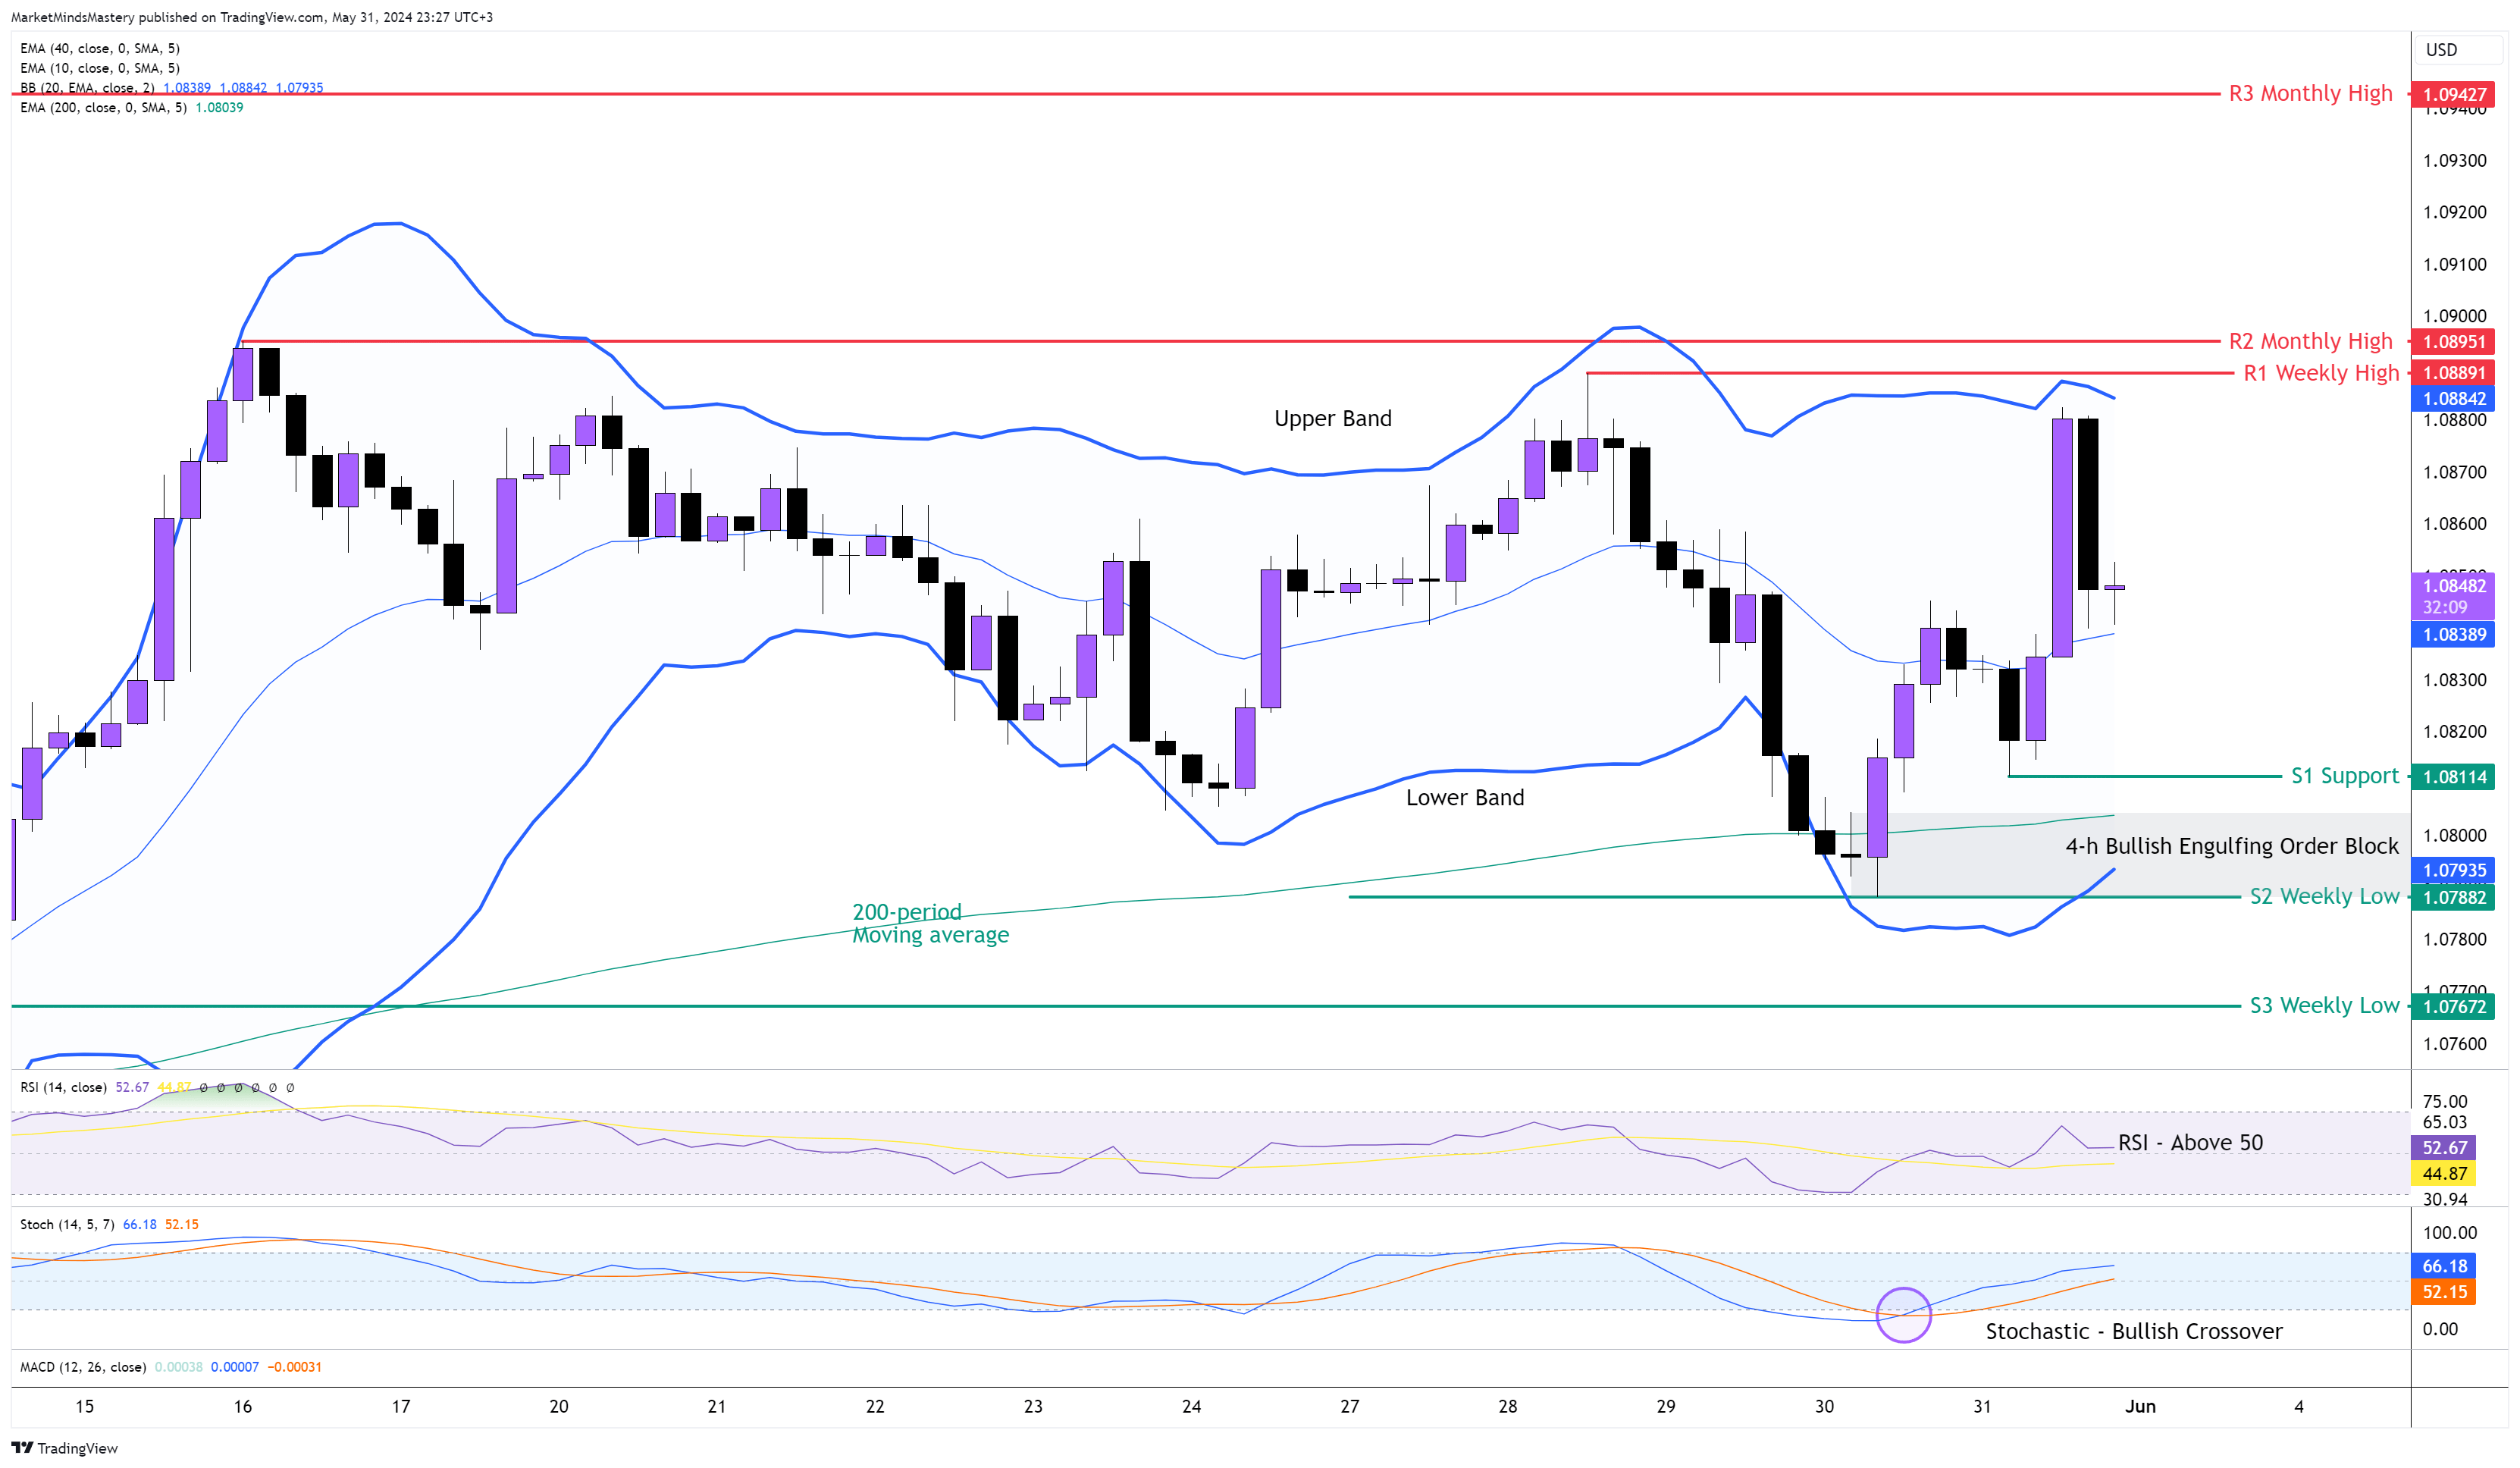
EUR USD 4H

The price created a weekly high at the beginning of the last week. During the middle of the week, it retraced all the moves and created a weekly low, and until the end of the weekly candle, it moved upwards, testing the R2 resistance we marked on the previous week’s analysis. Therefore, the weekly candle ended as a doji. The price didn't create a direction bias, and the market entered a range condition. To best describe the range market, the Bollinger Bands is usually better. Despite their excellent trending filter, the upper and the lower bands act as an area of resistance and support during range market conditions. Also, after a breakout occurs, the bands will react to the volatility and will serve as a validation filter for the breakout. Both bounded Oscillators, the RSI and the Stochastic, show bullishness, with the RSI being above 50 and the Stochastic with a bullish crossover being valid. Currently, the price trades around the 20-period moving average in the middle of the Bollinger Bands. If the price declines and moves downwards, the first support area, S1, is around 1.08114. If it breaks and closes below the S1, the following support is the S2, around 1.07882. This level is the lowest of the previous week. A Bullish Engulfing Order Block was formed last week at the same price level. Also, around this price level, the 200–period dynamic moving average acted as support.
On the other hand, if the price moves upwards, the previous week’s high will be the first R1 resistance around 1.08891. Only a few pips above the R1 is the R2 resistance, which was the last month's high.
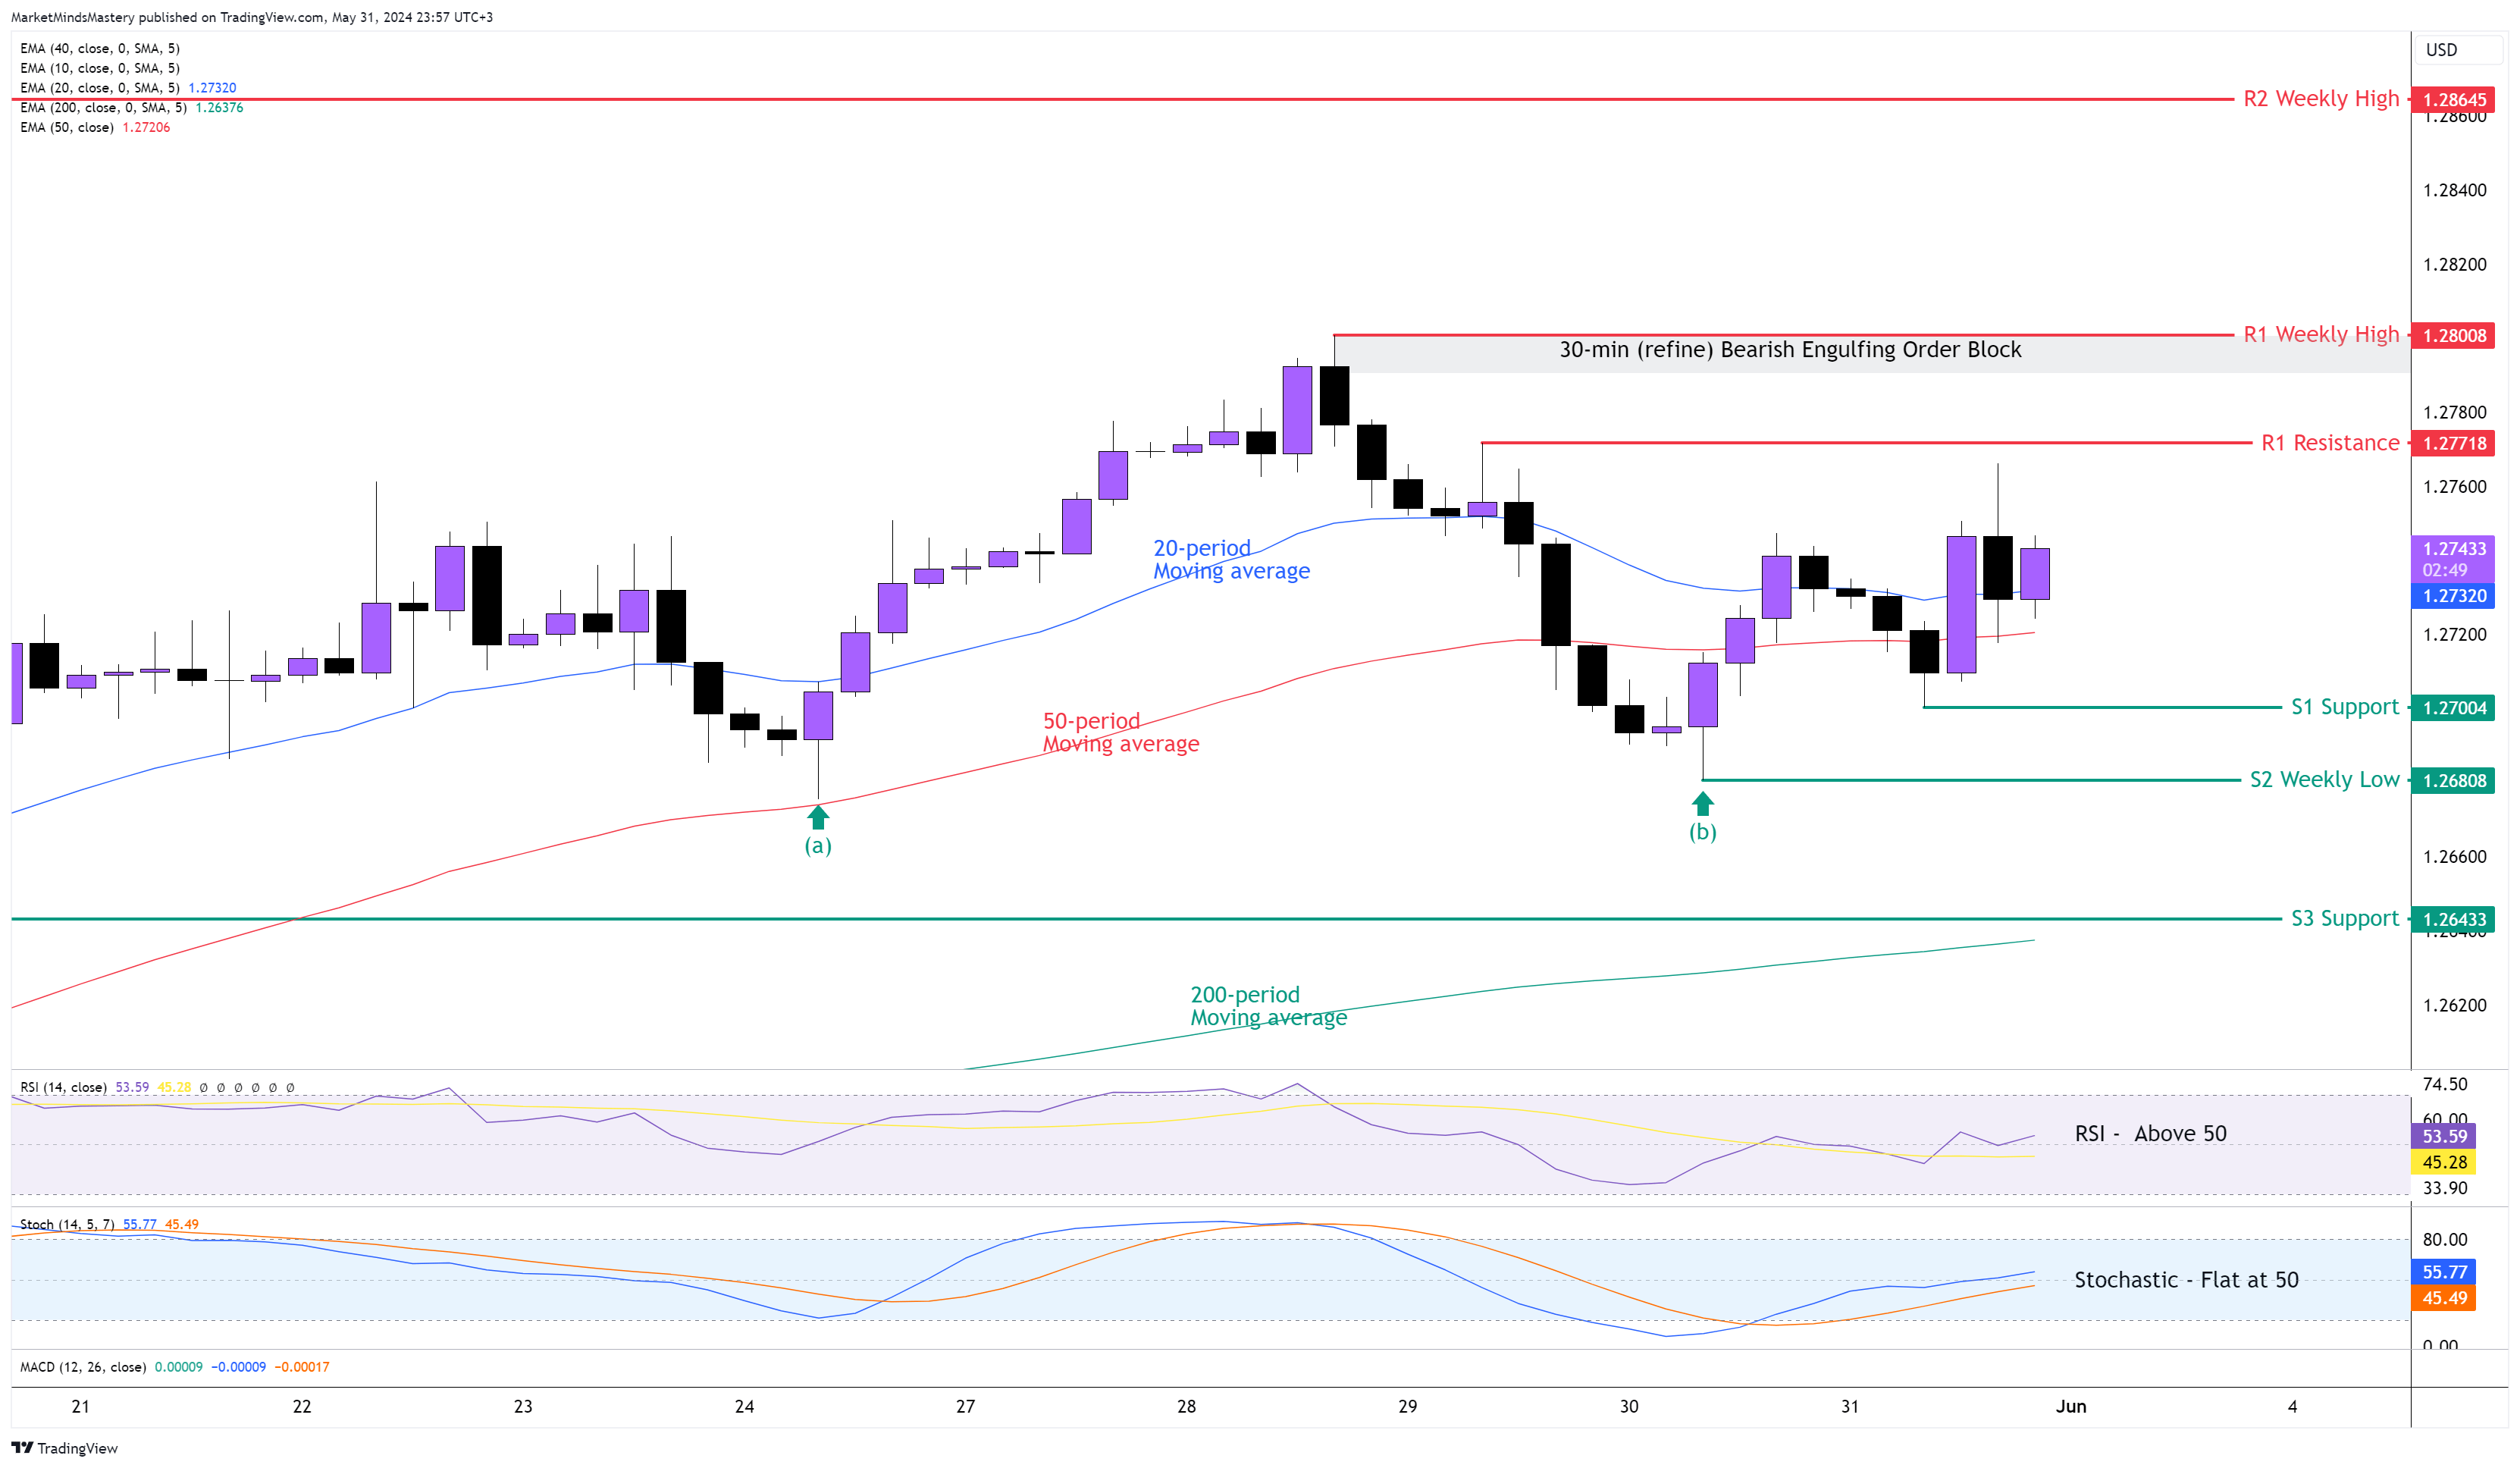
GBP USD 4H
Last week, the Sterling held strong against the US Dollar and created a higher high and higher low on the weekly chart. On the 4-hour chart, the 20-period is above the 50-period moving average, and the is 50, above 200. All these have bullish implications. While the Stochastic oscillator is flat around the middle line, the RSI is above 50, indicating bullishness. The weakness is shown at point (b) using swing analysis. This price level had a Bullish Engulfing Order Block marked from last week's market outlook analysis. The price traded until this Order Block, and a Bullish Engulfing reversal candlestick was printed last Thursday. However, the price doesn’t retrace 100% of its move in a strong uptrend. This can indicate a weakness in this currency pair, as the low at (a) equals the low at (b). If the price increases, the first resistance will be around 1.27718, marked as R1 resistance on the chart. If the price breaks and closes above the R1, the next resistance area, R2, will be 1.28. This level hosts an Order Block, as shown on the chart and can be a significant area where many buy and sell orders are placed. If the price declines and moves lower, the first support area, S1, will be 1.27. A further downward move, find the next support area, S2, around 1.26808, the previous week's low.
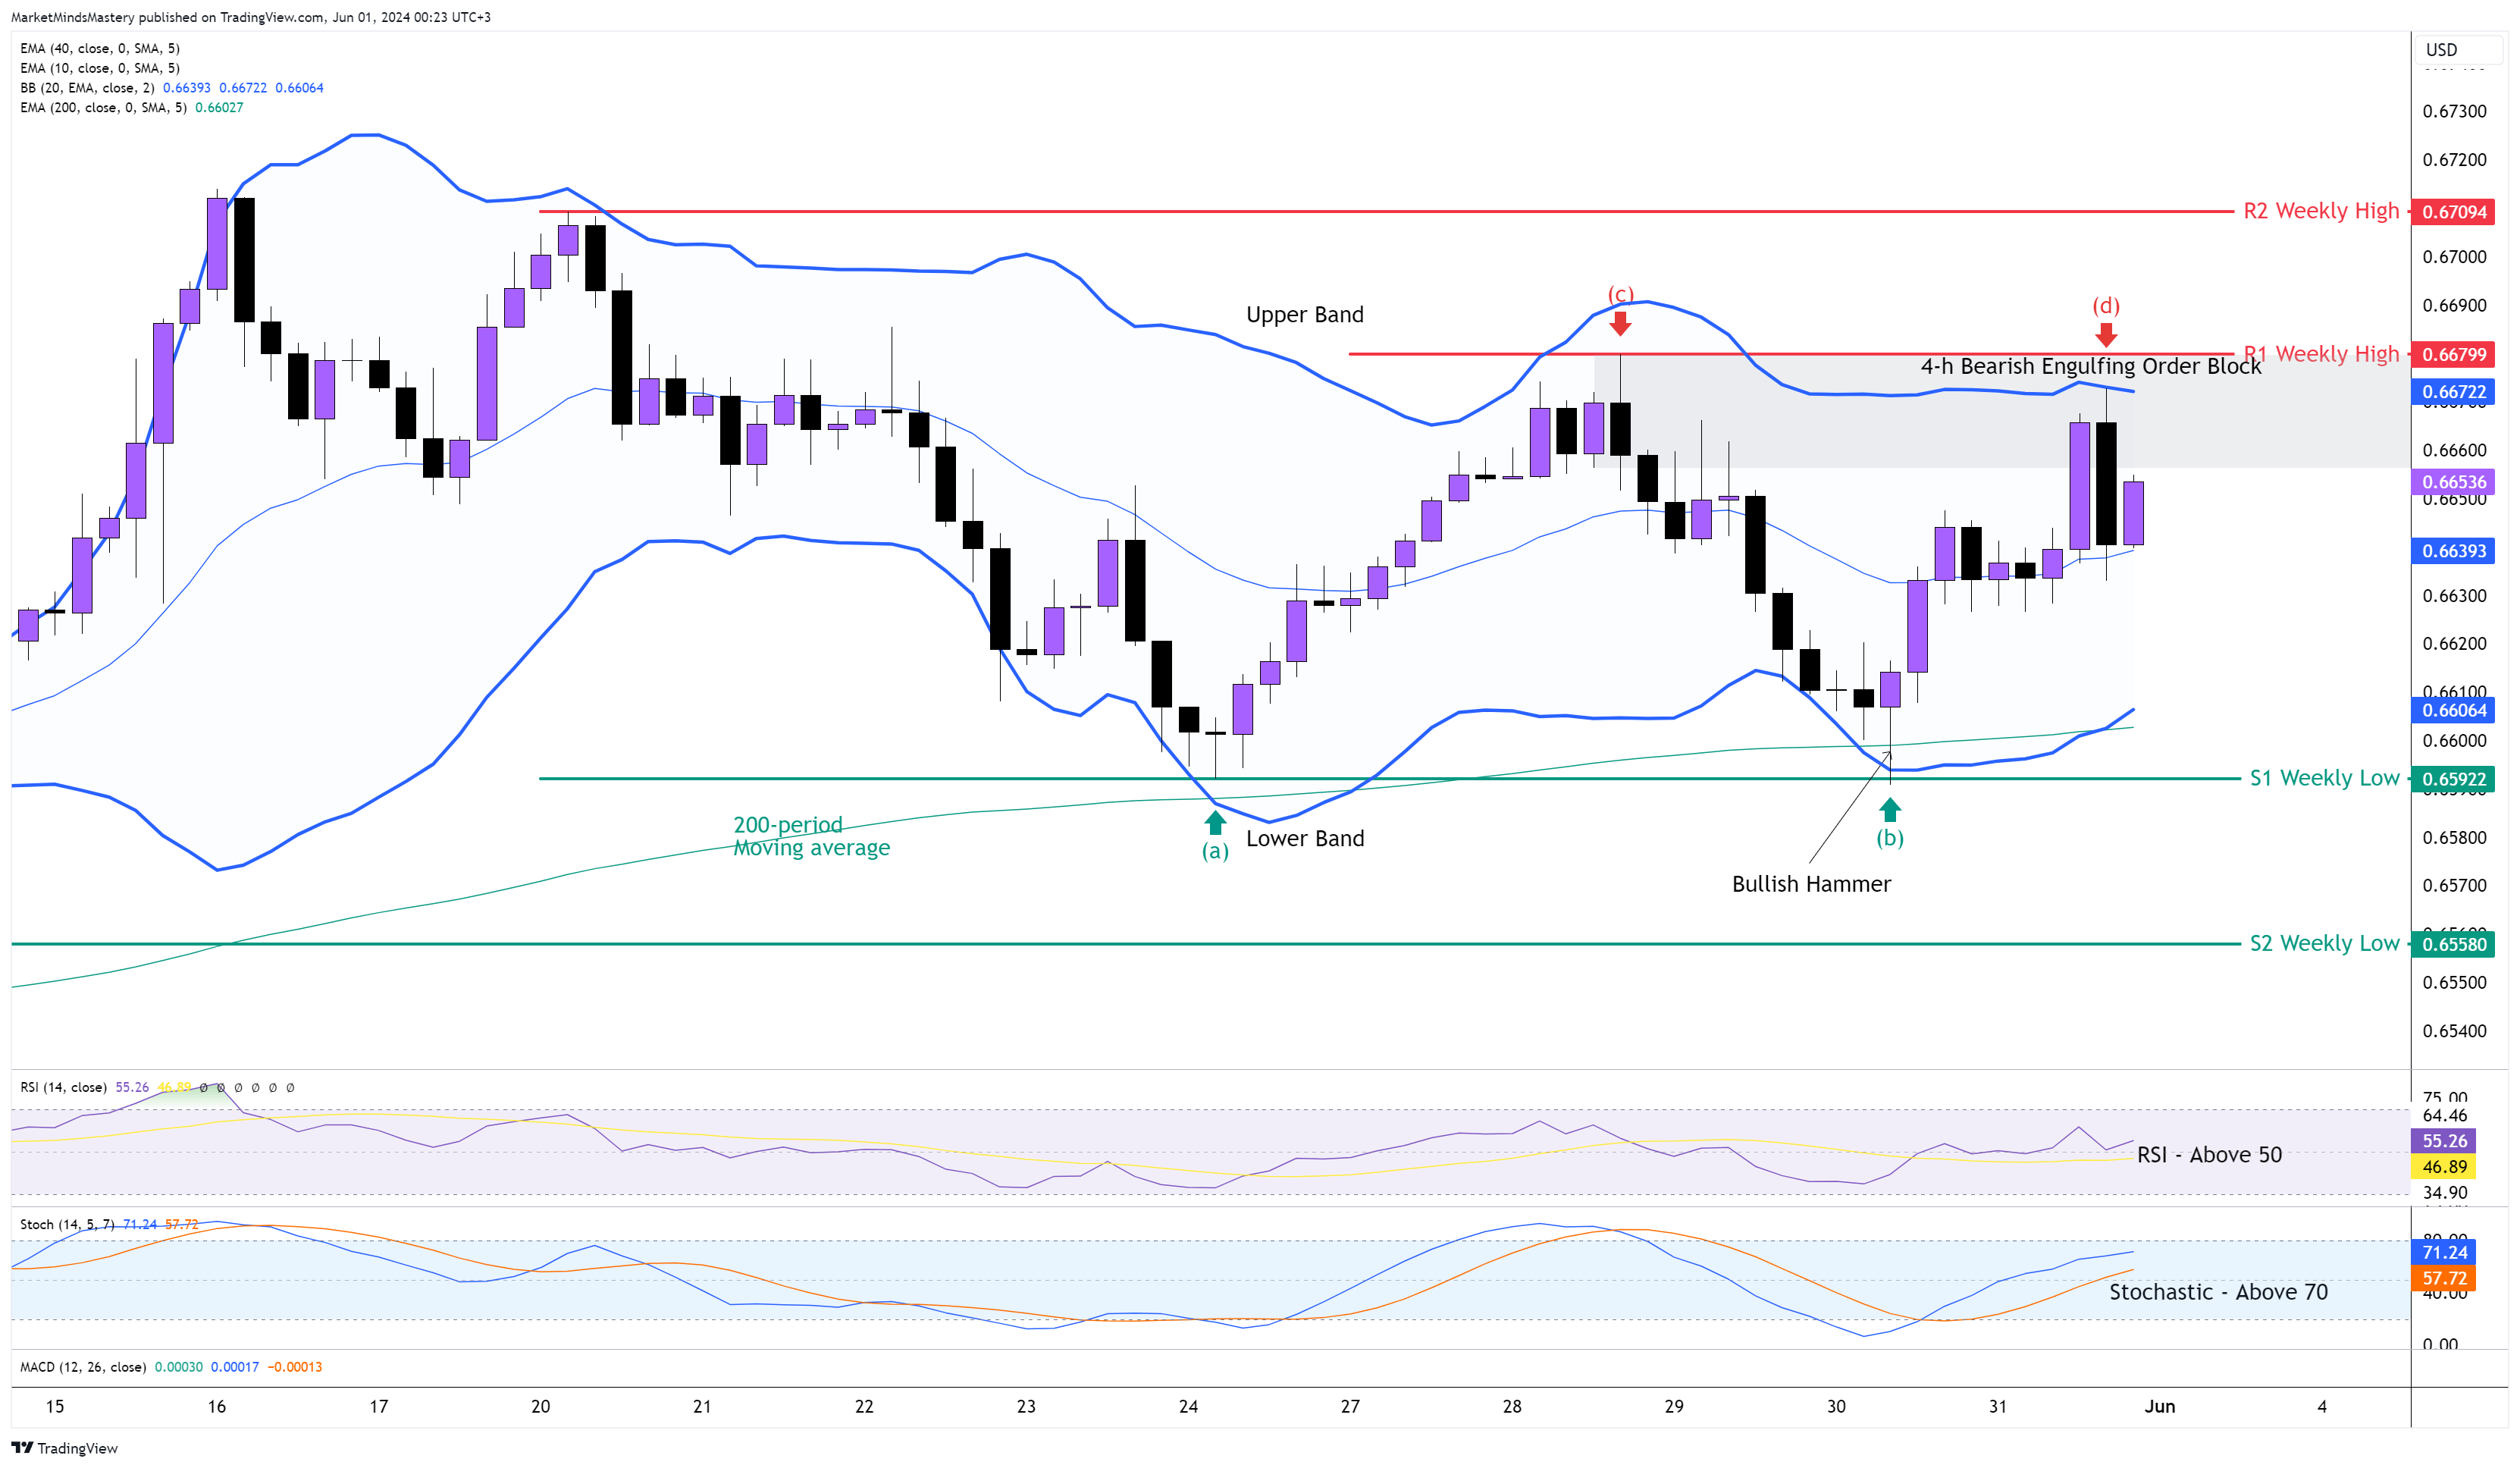
AUD USD 4H
Last week’s candle was a Double Inside pattern. This means that the price is congested within a smaller range of moves, and you can think of it as a spring that, once released, will expand. In the long term, the primary chart indicates a bullish breakout, as the moving averages on the weekly chart created a bullish crossover. Looking at the 4-hour chart, the price is entered into a Bearish Engulfing Order Block area, where an accumulation of orders was rejected, creating a Bearish Engulfing reversal that didn't follow through. The Bollinger Bands are flat and parallel. The four points (a), (b), (c), and (d) indicated a range market. The RSI oscillator is above 50, and this has bullish implications. The Stochastic is above 70, almost overbought, and has bullish implications. Last Thursday's price tested an old weekly low, and the 200-period moving average bounced off and pushed upwards with a Bullish Hammer reversal candlestick.
If the price moves upwards, the first resistance, R1, will be the highest of the range, at around 0.66799. This is the previous week’s high. If the breaks above the R1 and the upper band moves higher, the next resistance area is the R2, which is another weekly high around 0.67094. If the price remains in the range and moves downwards, the first support area, S1, will be clustered between the dynamic lower band, the dynamic 200-period moving average and the st6atic level around 0.65922. If the price breaks under the S1, the next support level, S2, is around 0.65680, another weekly low price.
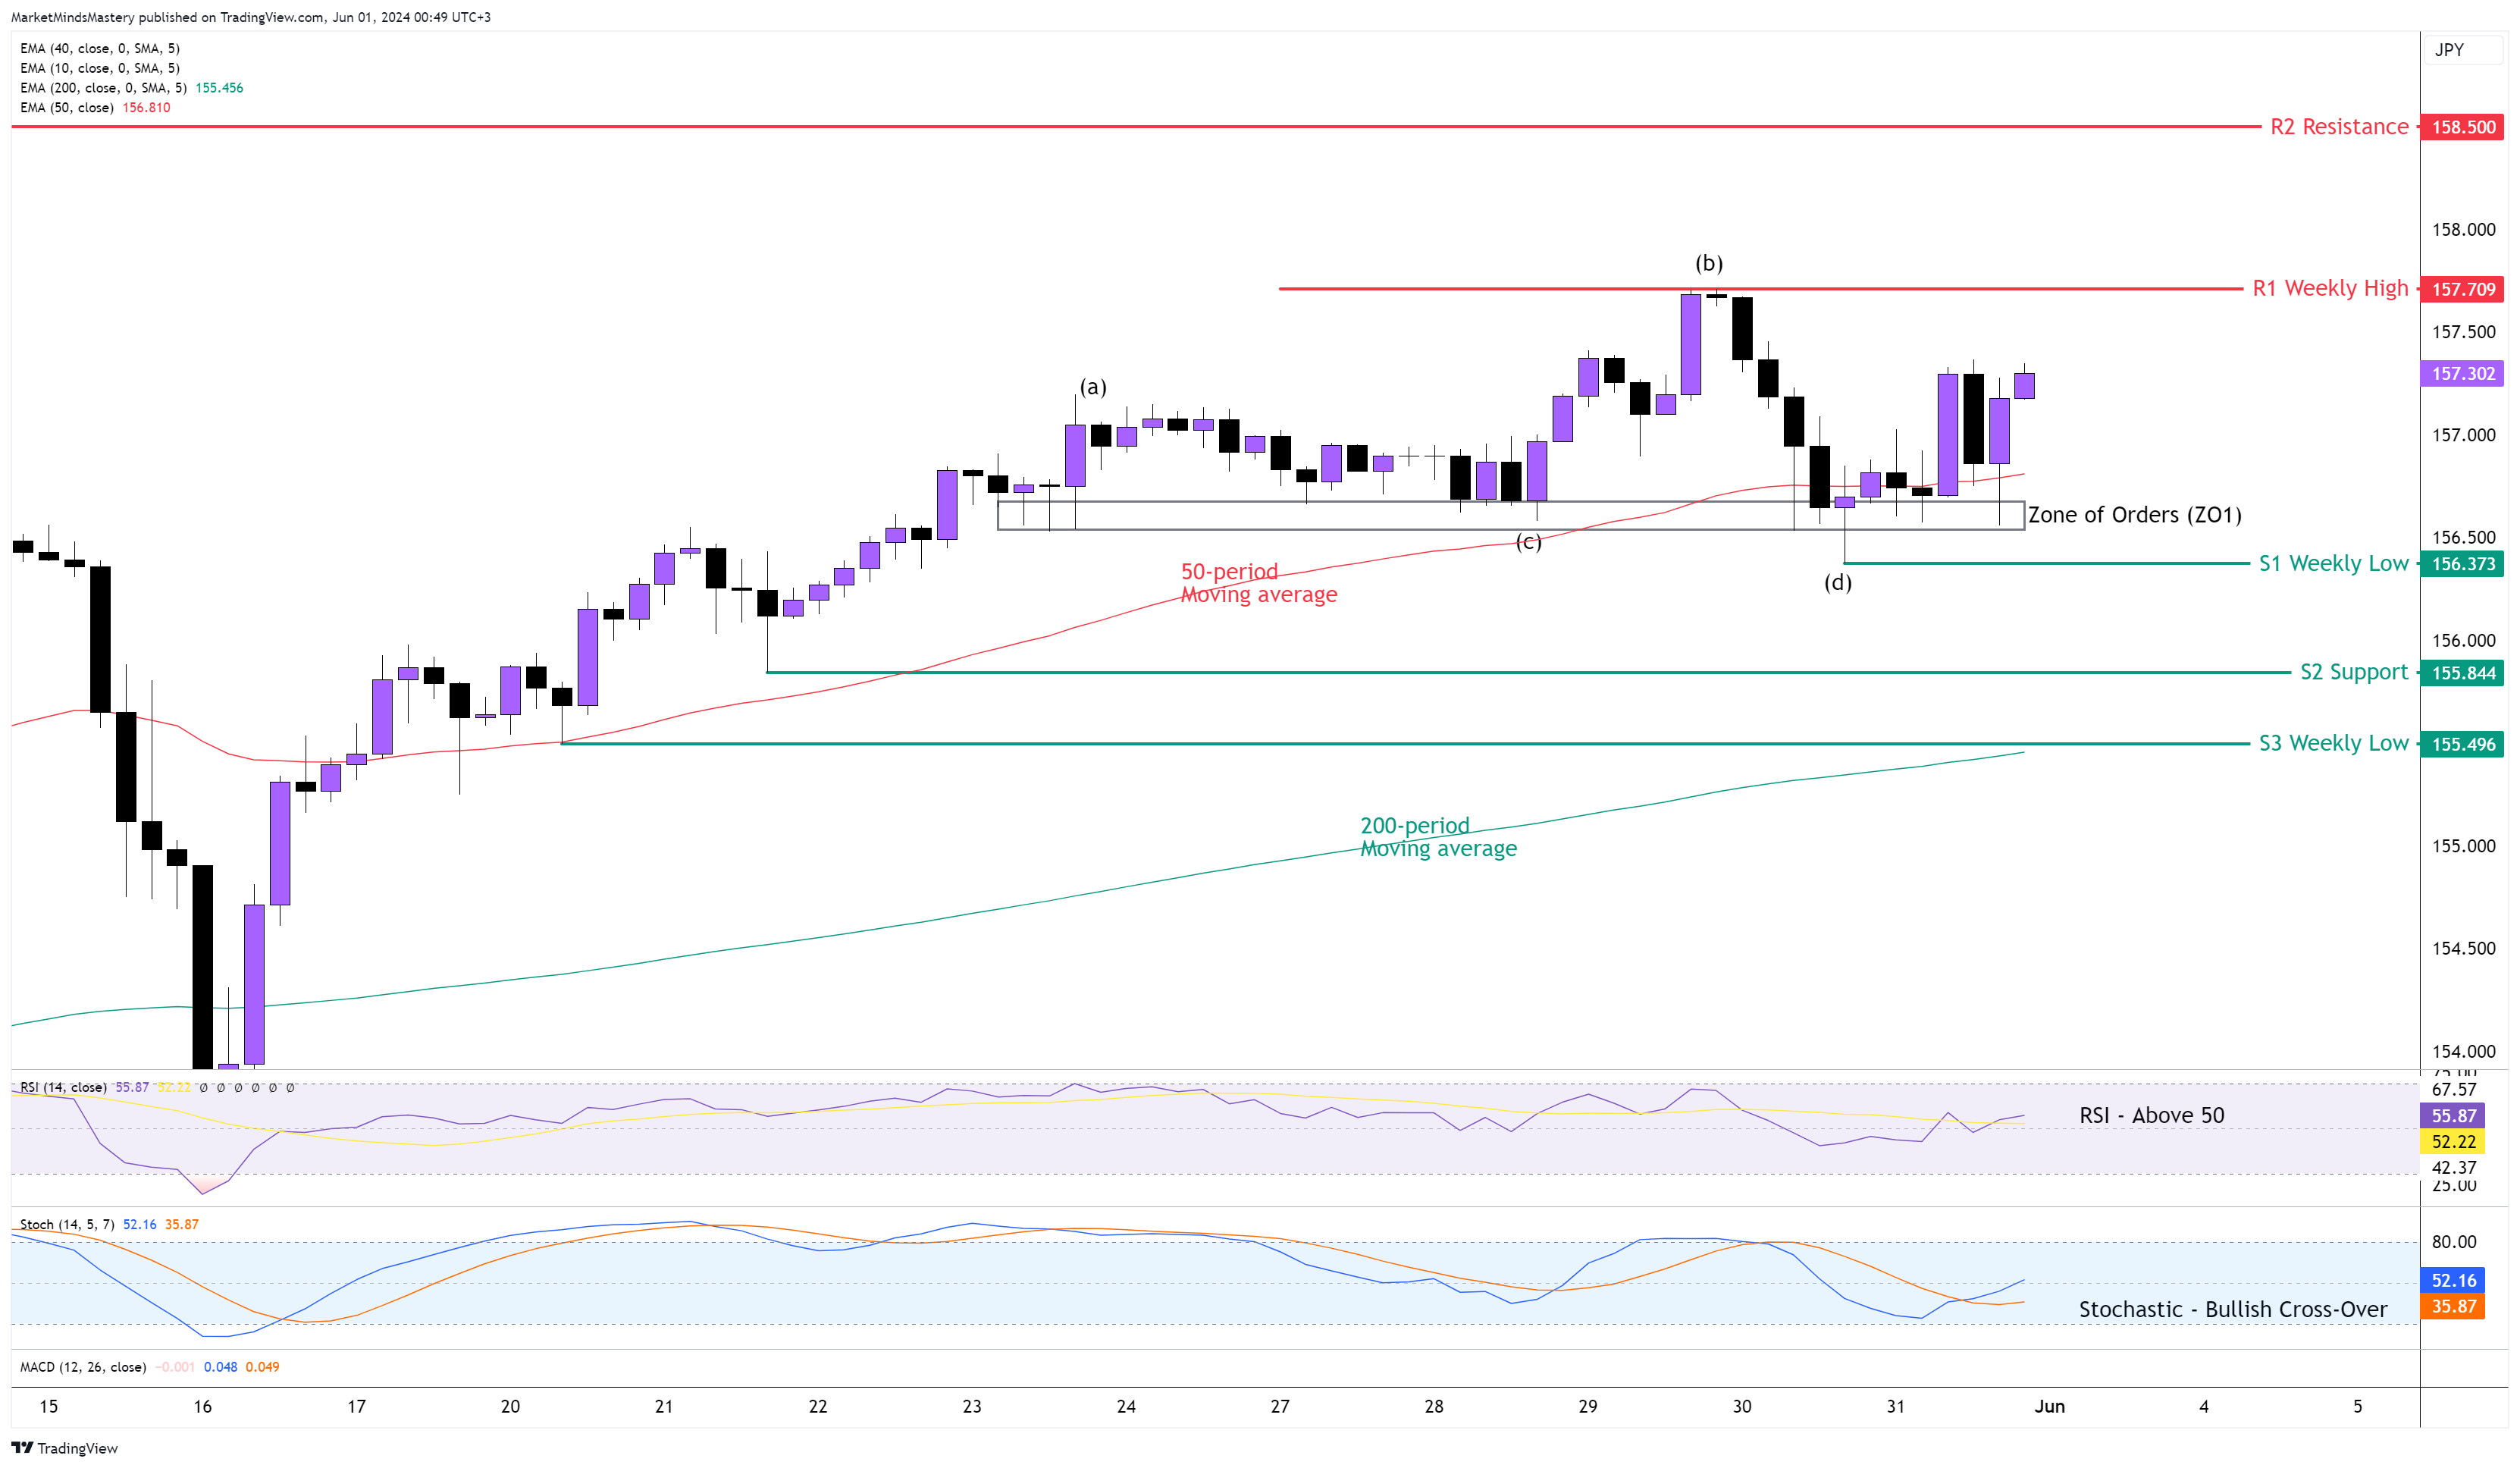
USD JPY 4H
Another bullish week was finished for the USDJPY. Despite the higher CPi in Japan, the Yen didn’t show strength, and the USD took over, creating a new weekly high and close. Comparing the weekly candles, last week’s candle has a very small body, which means a lack of bullish momentum. On the 4-hour chart, the price created a higher high, as shown at points (a) and (b), but a lower low at points (c ) and (d). Although the low at point (d) was a false breakout, the uptrend must be questioned. The 50-period moving average is above the 200-period. The price bounced off the 50-period moving average on Thursday and Friday last week. The RSI oscillator is above 50, indicating bullishness. The Stochastic created a Bullish crossover, another bullish indication.
Around 156.600, the price created a short-term solid Zone of Orders ZO1, which must be considered. Starting Monday, if the price keeps trading above the 50-period moving average and moves upwards, the first resistance area, R1, is around 157.700 and is the previous week’s high. If the price penetrates the R1 and moves higher, the next resistance area, R2, is approximately 158.500. On the other hand, if the price declines and moves lower, the first support area, S1, is 156.37, which is the previous week’s low. If it breaks and closes under S1, the next support area, S2, is around 155.844.
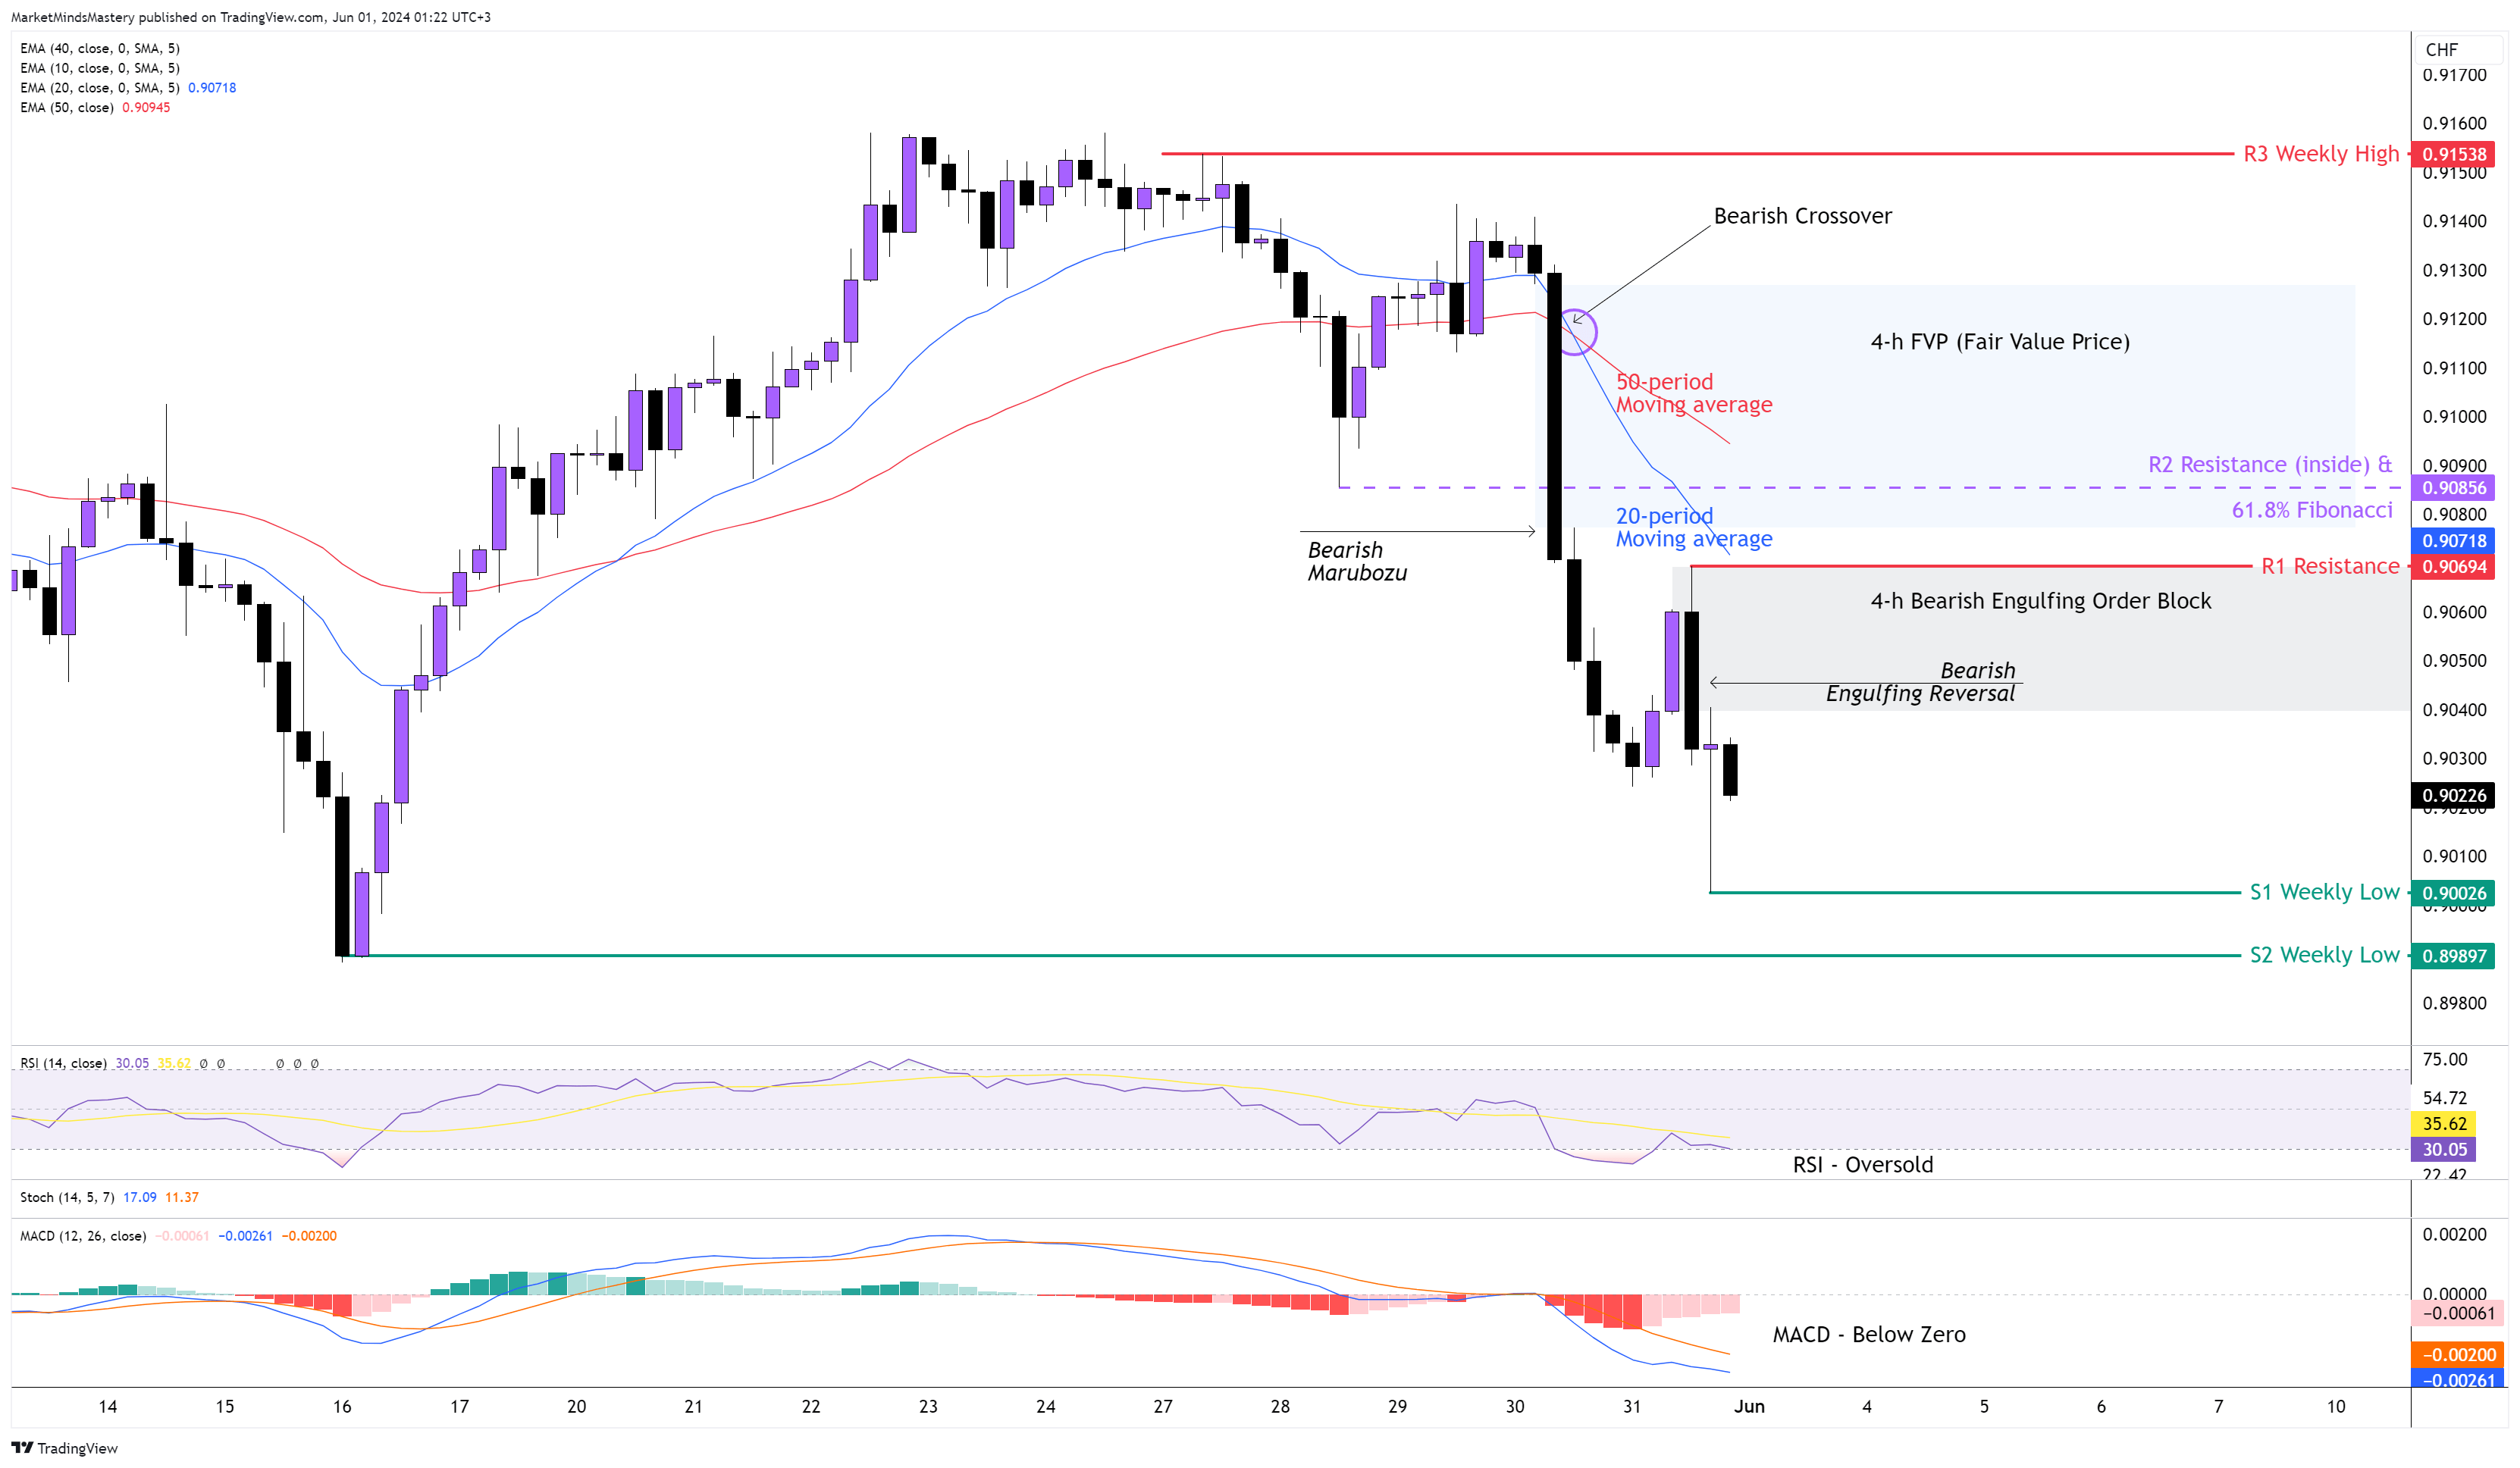
USD CHF 4H
The strongest currency last week was the Swissy. It shows across the board on all currencies it was traded with. Although the USD held well against other currencies, it couldn’t sustain a bullish momentum with the Swiss. On the weekly chart, the weekly candle closed as a Bearish Engulfing, a strong reversal pattern that indicates the shift in market momentum from buying orders to sell orders. The moving averages on the 4-hour chart turned to the downside, with the 20-period being below the 50-period moving average.
The RSI Oscillator is in an oversold condition, indicating extreme selling pressure. The MACD is under the zero line, and this has bearish implications. The price created a series of lower highs and lower lows, with the Bearish Marubozu candle being the driving force behind the downwards impulsive move. They left behind a 4-hour FVP and an Order Block created by a Bearish Engulfing candle last Friday.
If the price continues to move downwards, the first support area, S1, will be the previous week’s low, around 0.900 and the next support, S2, will be an older weekly low, around 0.89897. If the price finds support, bounces off and moves upwards, the first resistance area, R1, will be 0.9069. If the price closes above the R1 and moves higher, the FVP can be filled, and the price can find the next resistance, R2, around 0.9085, which consists of the 61.8% Fibonacci Golden ratio and an inside resistance.
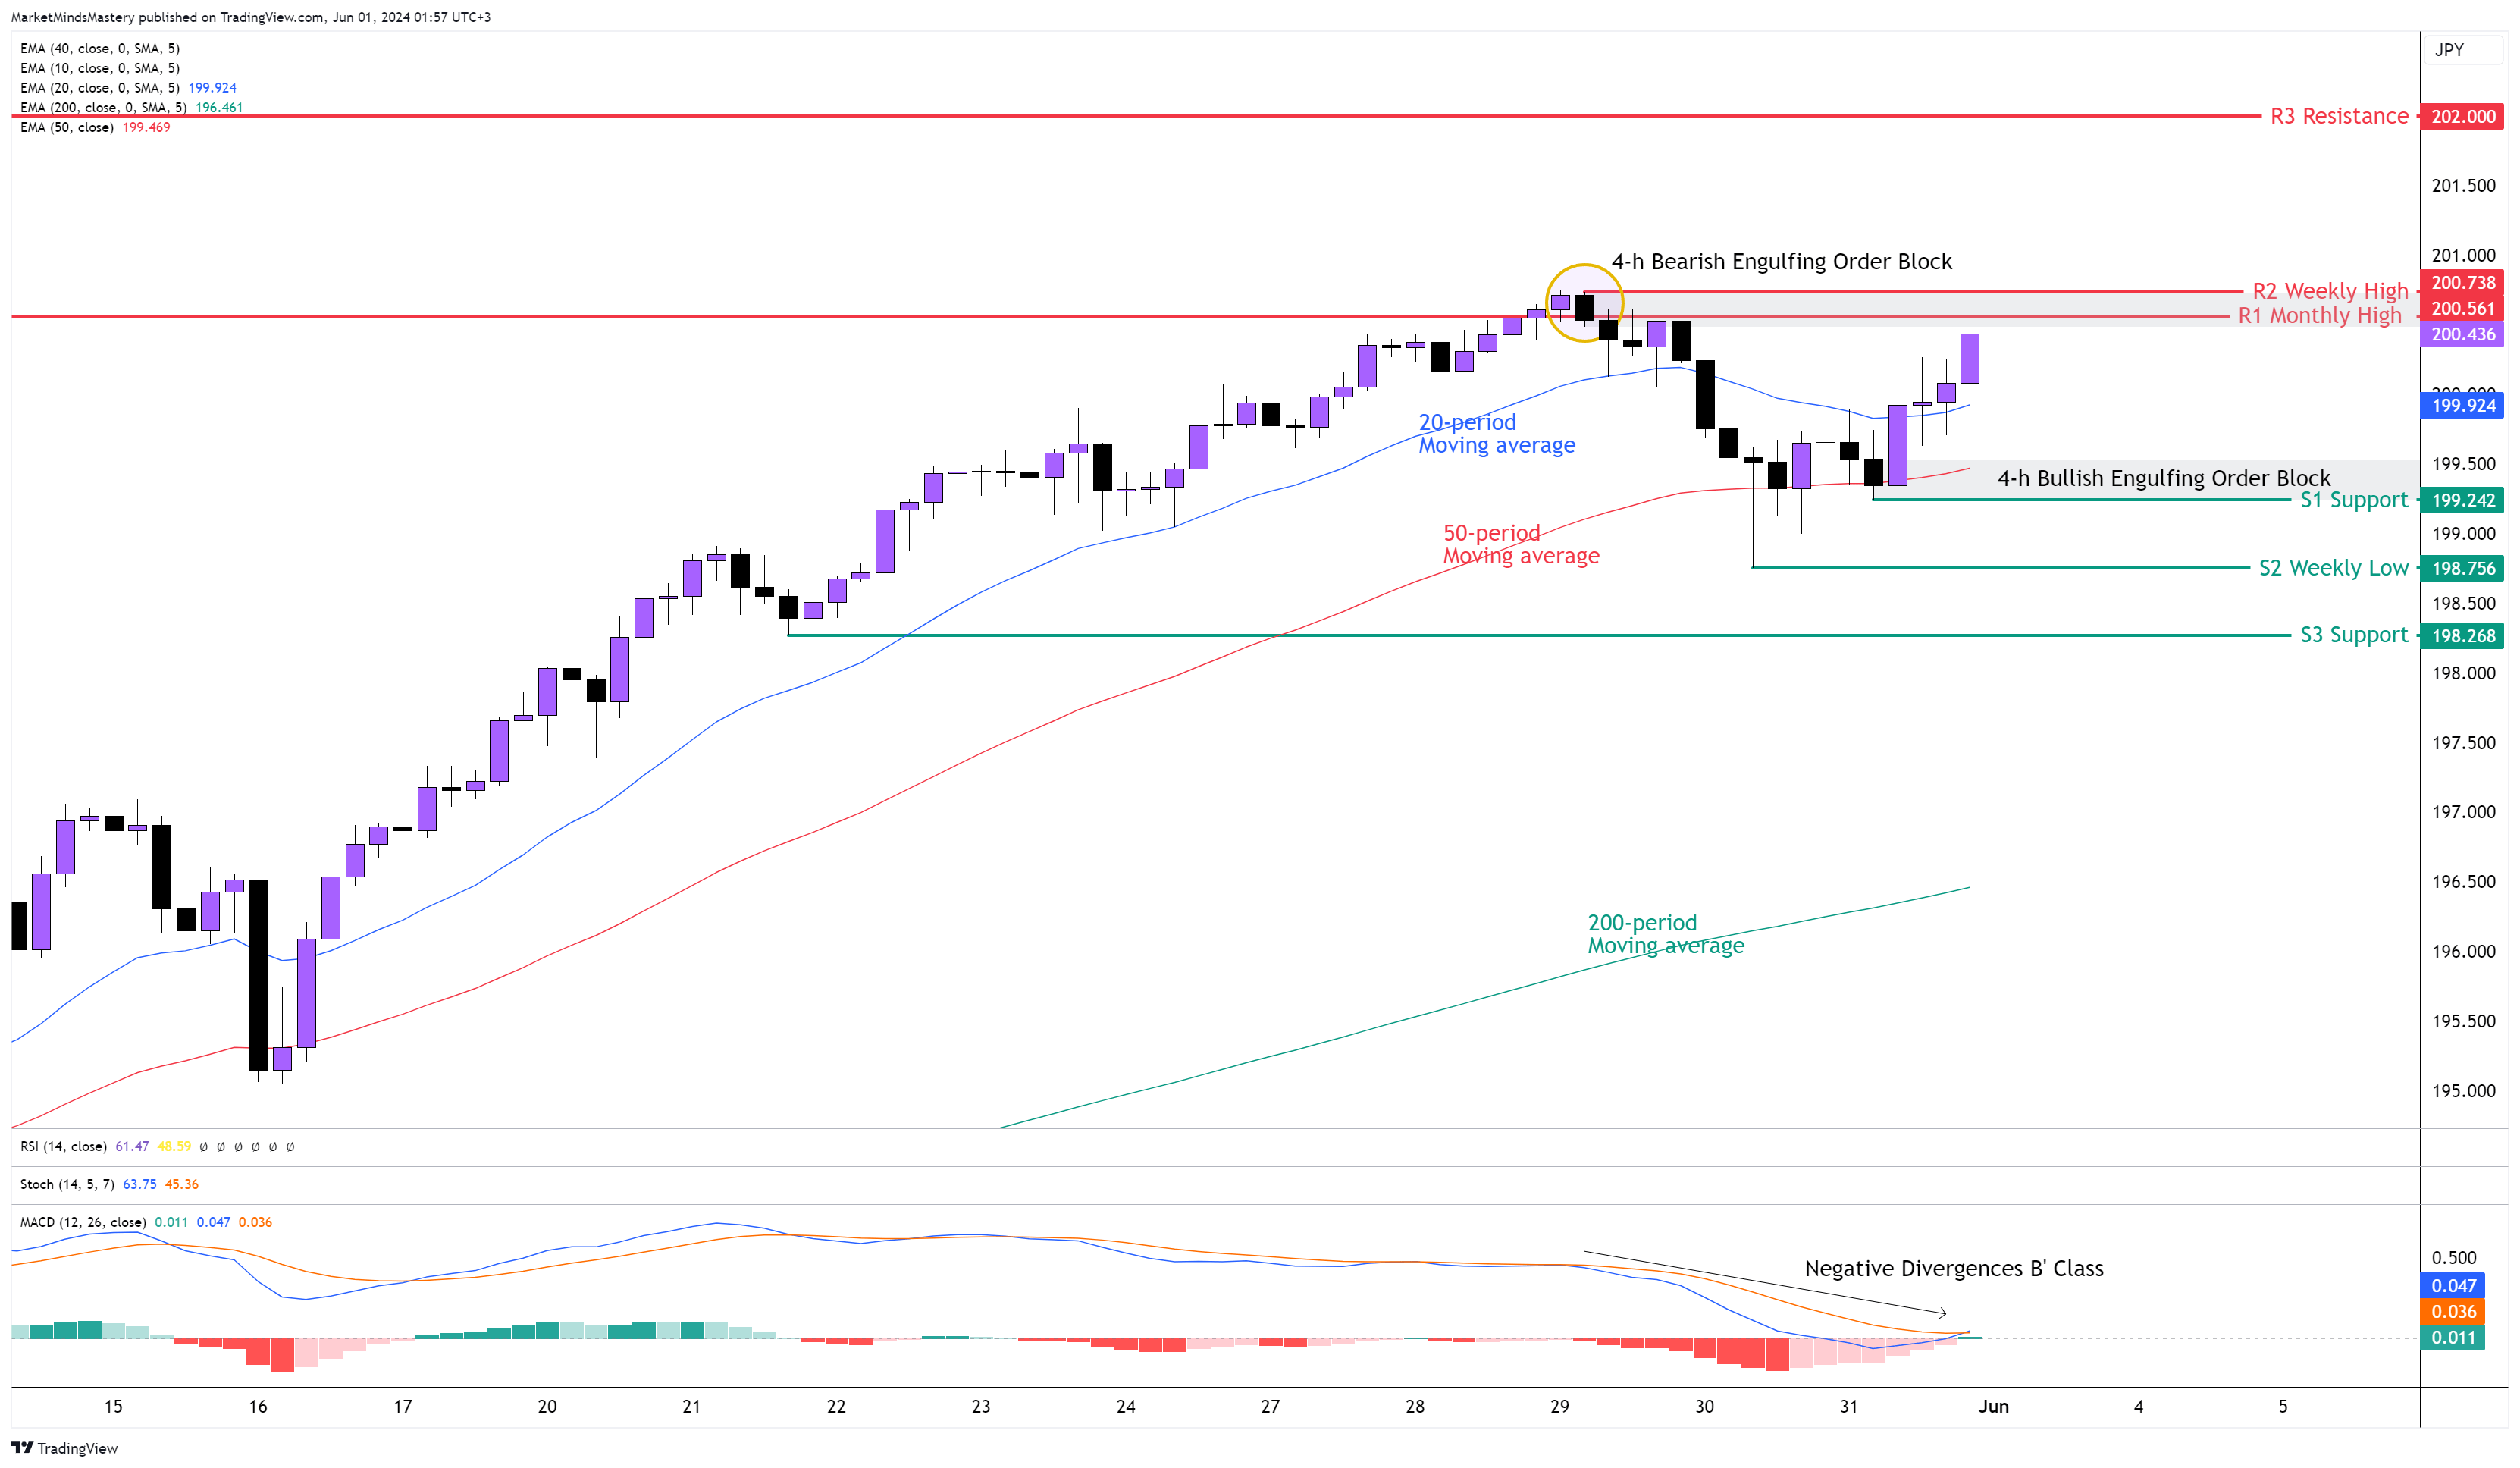
GBP JPY 4H
The price found support at the Inside support as we marked it as the S1 on the previous week’s market outlook. It bounced off with a doji dragonfly candle and moved upwards. Although it made a higher high and a higher low, it stopped at the 200 level. That is a round number that is usually attractive to market orders. As the price approaches the recent swing high on the 4-hour chart, the MACD shows weakness in the form of Negative Divergences B’ Class. The 20-period moving average is above the 50-period, and both are above the 200-period moving average. Despite the Negative Divergences shown on the MACD, the MACD Line crossed above the Signal line, and they are both above zero, which confirms the currency's bullish momentum. If the price continues to increase, the first resistance area will be the R1, which is the previous week’s high. That is around 200.56.
Less than 20 pips higher is the next resistance, the R2, which is the last month's high, around 200.73. Looking carefully between the two levels, the price formed a Bearish Engulfing Order Block. This can be a significant area because if it holds, the price should decline aggressively, or if it breaks, the price should create a long bullish candle and the level afterwards should reverse the role and become a support. If the price breaks the R2 and moves higher, the next resistance level, R3, will be around 202. Oppositely, if the price declines and moves lower, the first support area S1 is around 199.24. This level is around the 50-period moving average, and the Order Block was created last Friday. The next support level will be the S2, which is the previous week’s low, around 198.75.
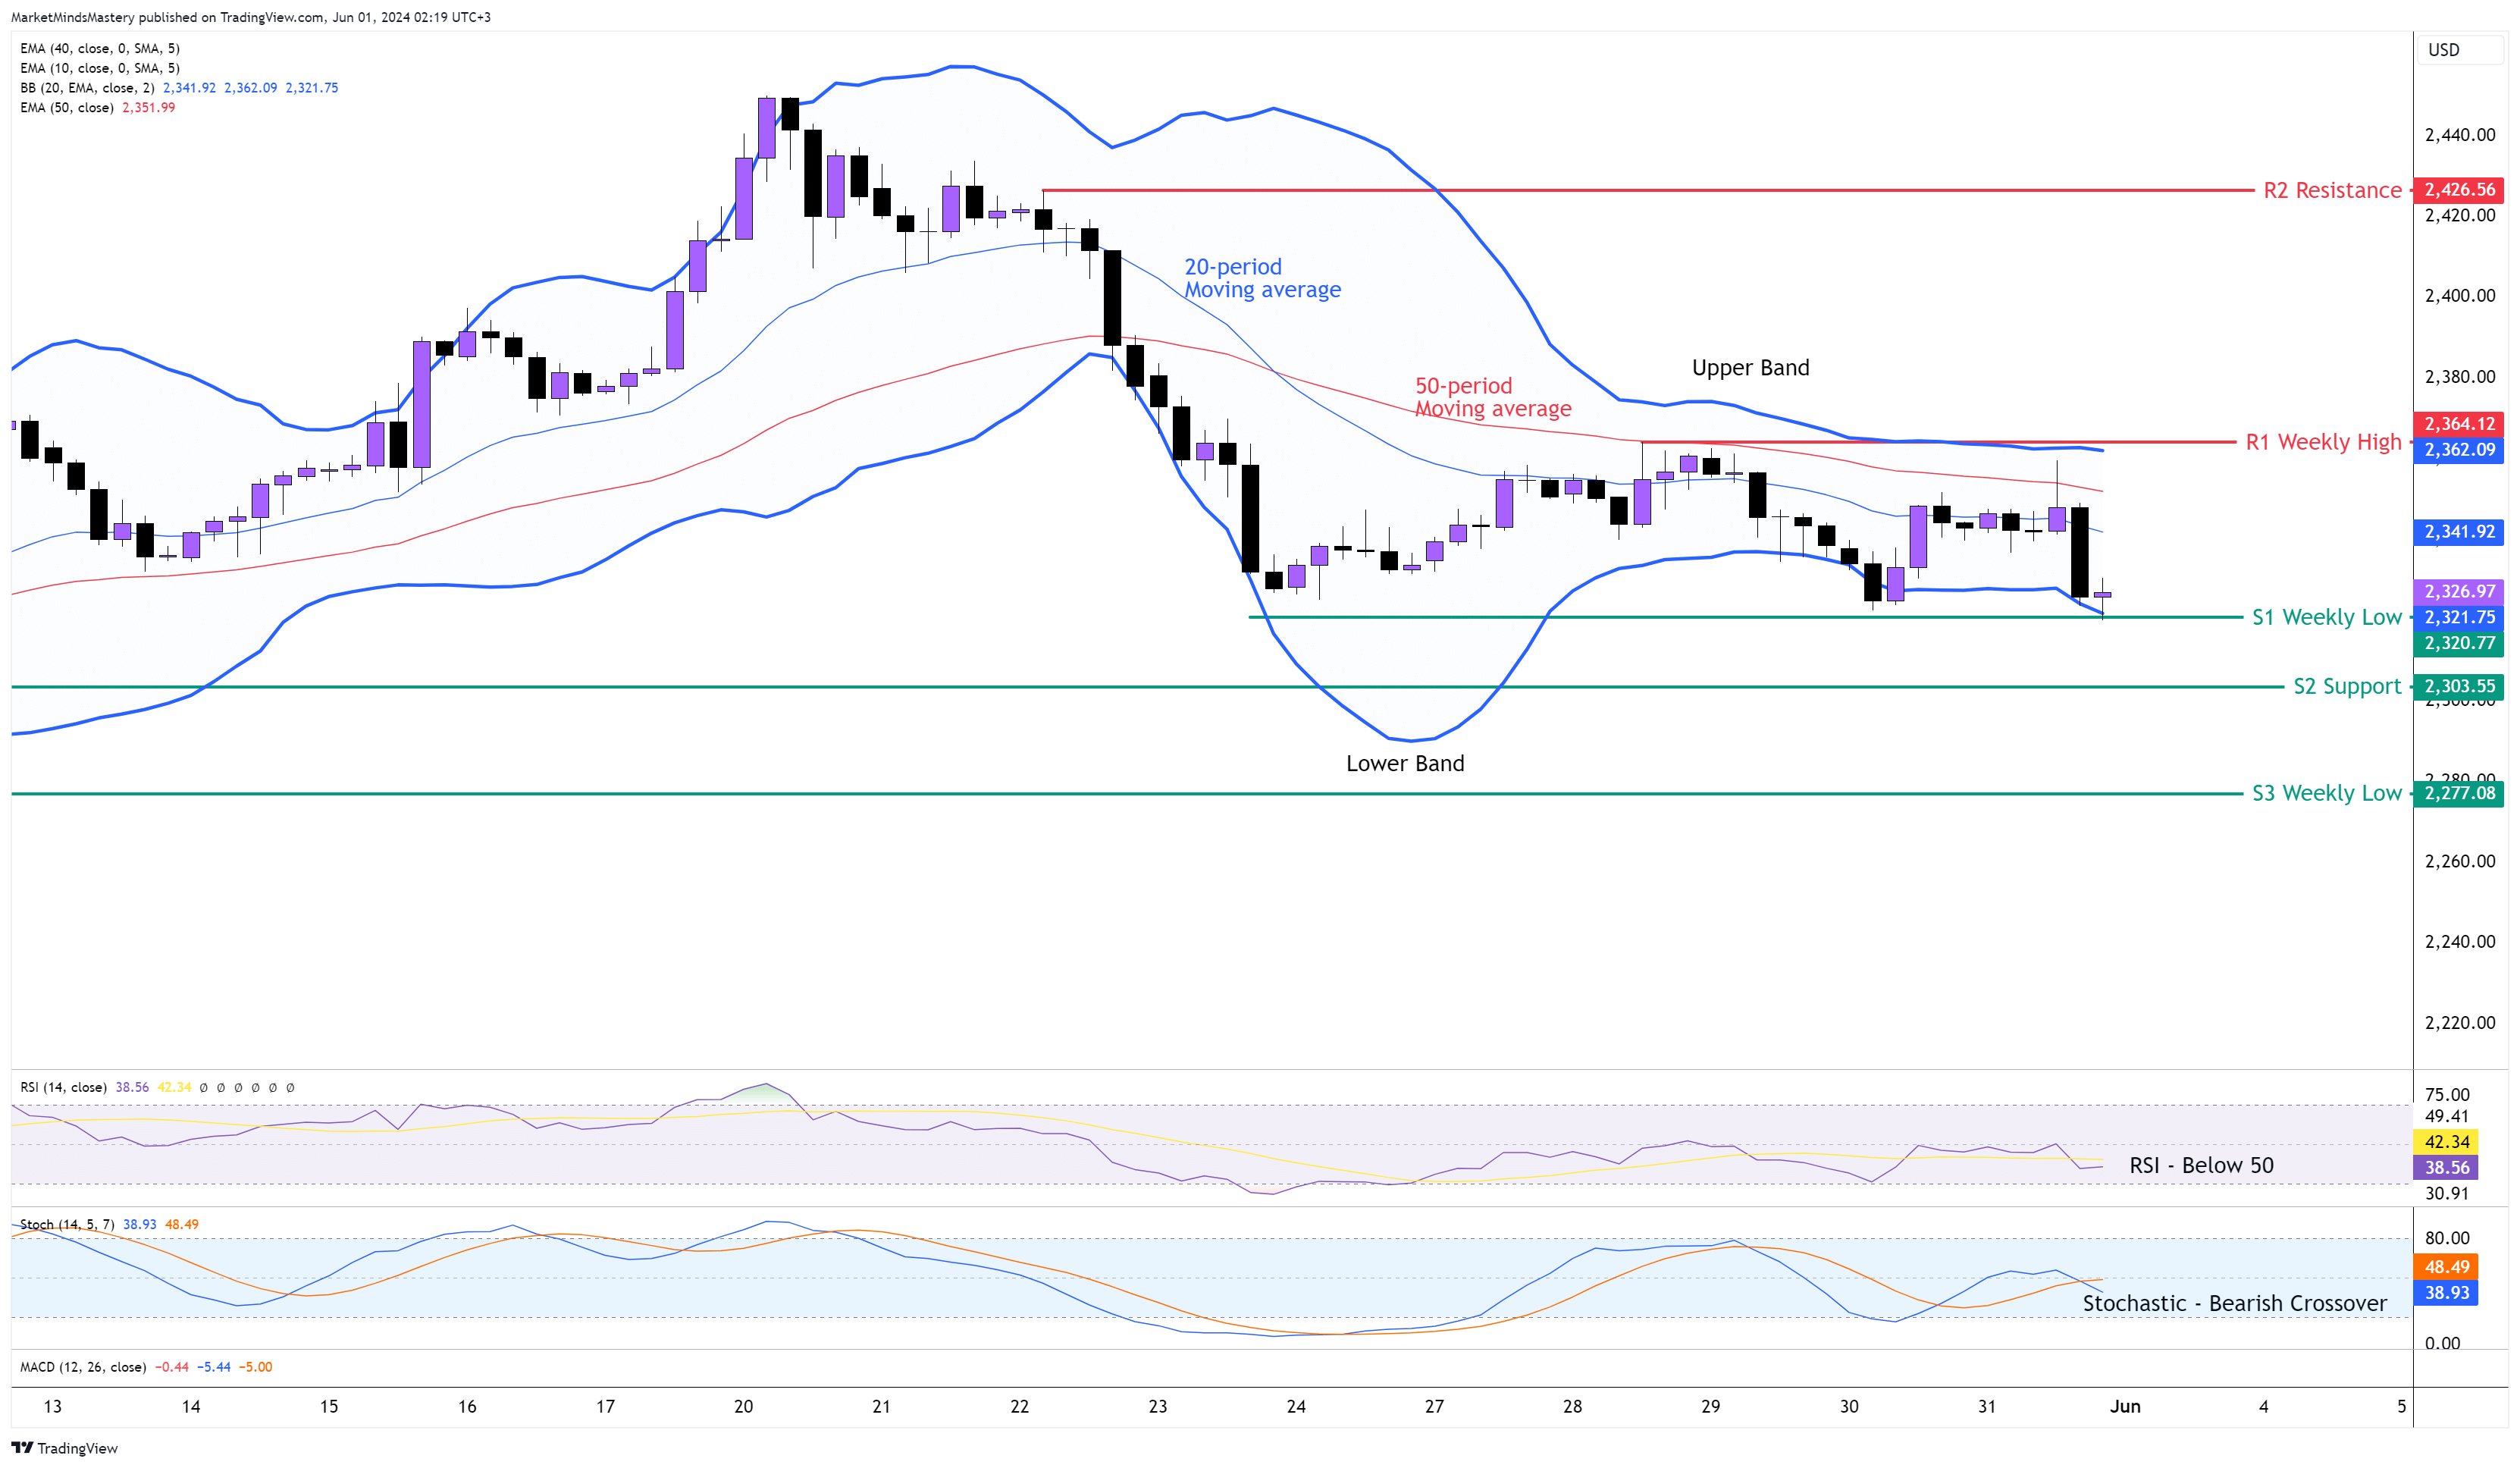
GOLD 4H
The Gold “didn't move” last week. A very small price range movement is visibly better in the 4-hour time frame. On the weekly chart, the price shows the Bearish Engulfing’s low holding as a strong support during last week’s trading activity. The price was traded sideways in the lower time frames, and the 4-hour Bollinger Bands ensured the price was traded between the upper and the lower bands. Both bands are pointing forward, and they are parallel to each other. The RSI Oscillator is below 50, and the Stochastic created a Bearish Crossover, which both indicate bearishness. The 20-period moving average is under the 50-period, which has bearish implications.
Starting Monday, if the price creates a Bearish breakout, the first support area will be the previous week's low, around $2320. A further downward move can move the price to the next support, S2, around $2300, and any more push to the downside leads to the S3 support, around $2277, an old weekly low.
On the other hand, if the price creates a Bullish breakout, the first resistance R1 is around $2364, which is the previous week’s high. If the price breaks and closes above the R1 resistance and moves upwards, the next resistance area, R2, will be 2426.
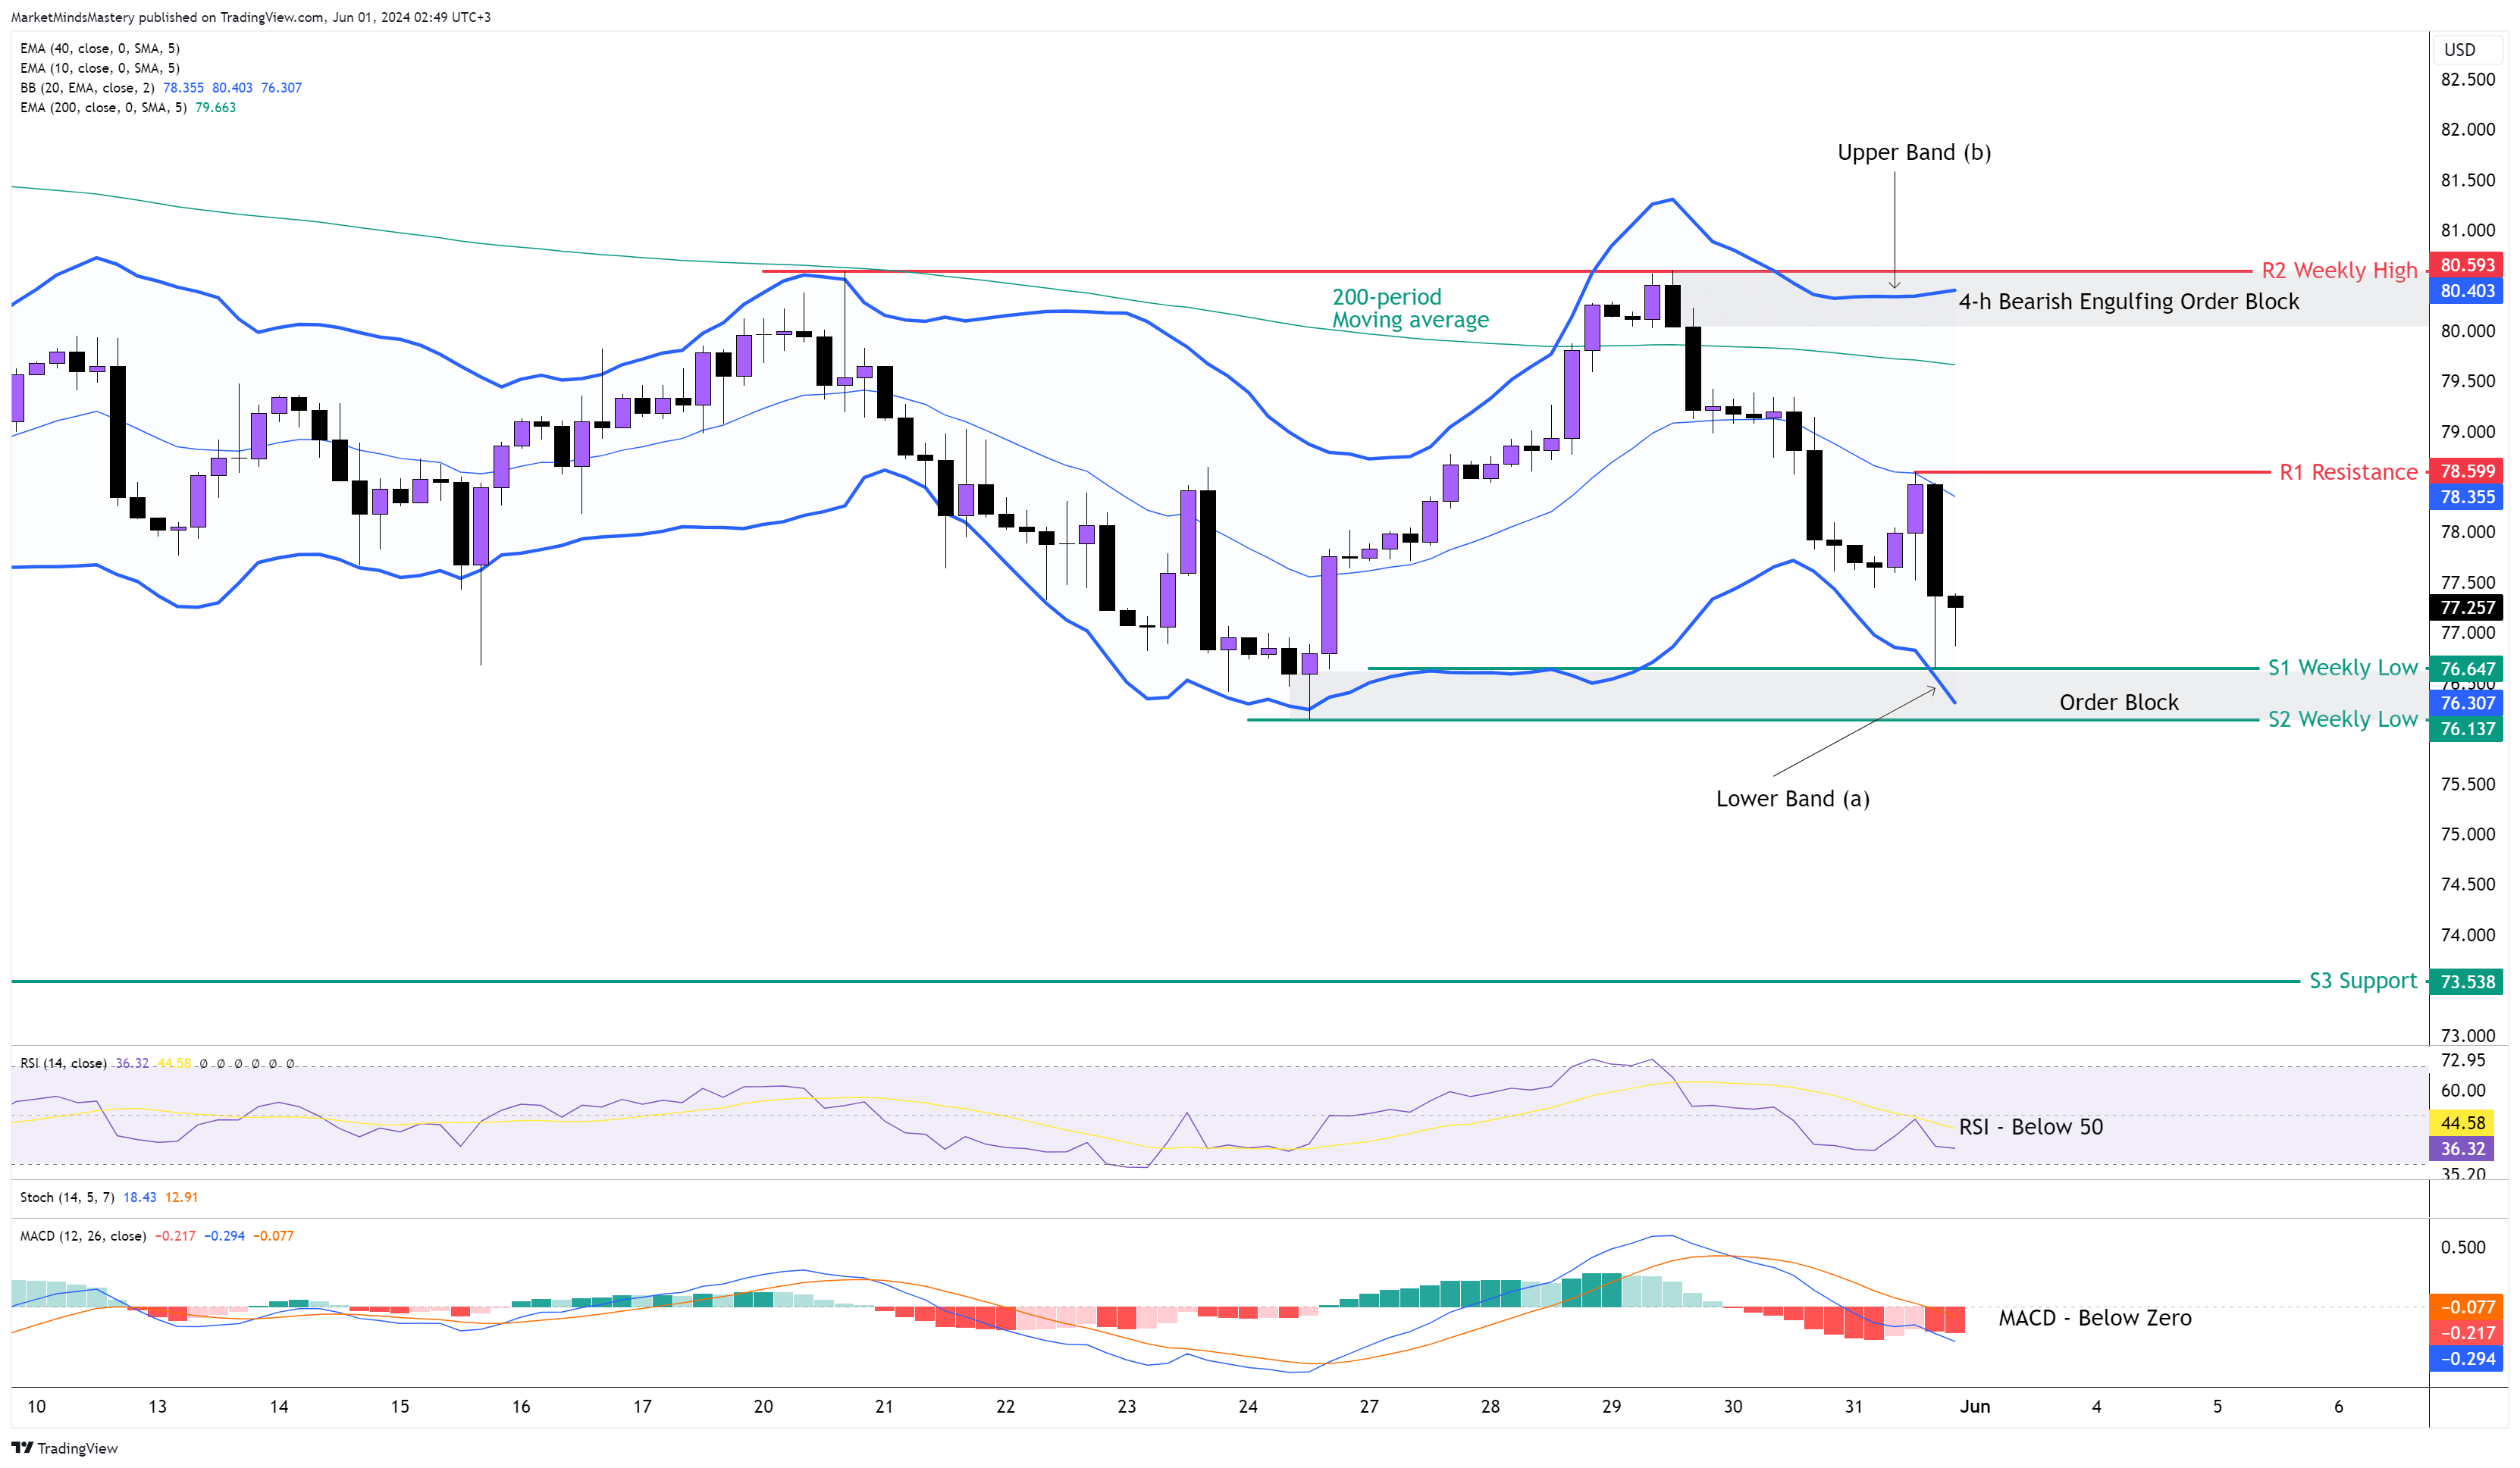
US OIL 4H
Following the Bearish Engulfing candlestick on the weekly chart created two weeks ago, last week's price stayed within the boundaries of the Engulfing. It tested the Bearish Engulfung’s high, rejected it, and closed above its low. The 4-hour chart shows it as a range market rather than anything else. Going one step further and examining the 200-period moving average, the price finds resistance and declines when it interacts with it. The RSI is under 50, indicating bearishness.
The MACD trades below its zero line, which has bearish implications. The price trades under the middle of the Bollinger Bands, the 20-period moving average. The lower band at (a) expanded last Friday when the price moved downwards, while the upper band at (b) remained flat. If a dynamic downward move occurs, the upper band must point upwards. This indication is one of the most important parts of the Bollinger Bands strategy. It shows whether there is market momentum to follow the price move. If the price moves downwards, the first support area, S1, will be the previous week’s low, around $76.64. If the price breaks and closes under the S1 and moves lower, the next support, S2, is an older weekly low of around $76.13. Between the S1 and the S2, there is an Order Block. If the price finds support, bounces off and moves upwards, the first resistance area, R1, will be $78.59. If the price penetrates the R1 and moves higher, the next resistance, R2, will be the previous week’s high, around $80.59.
BTC USD 4H
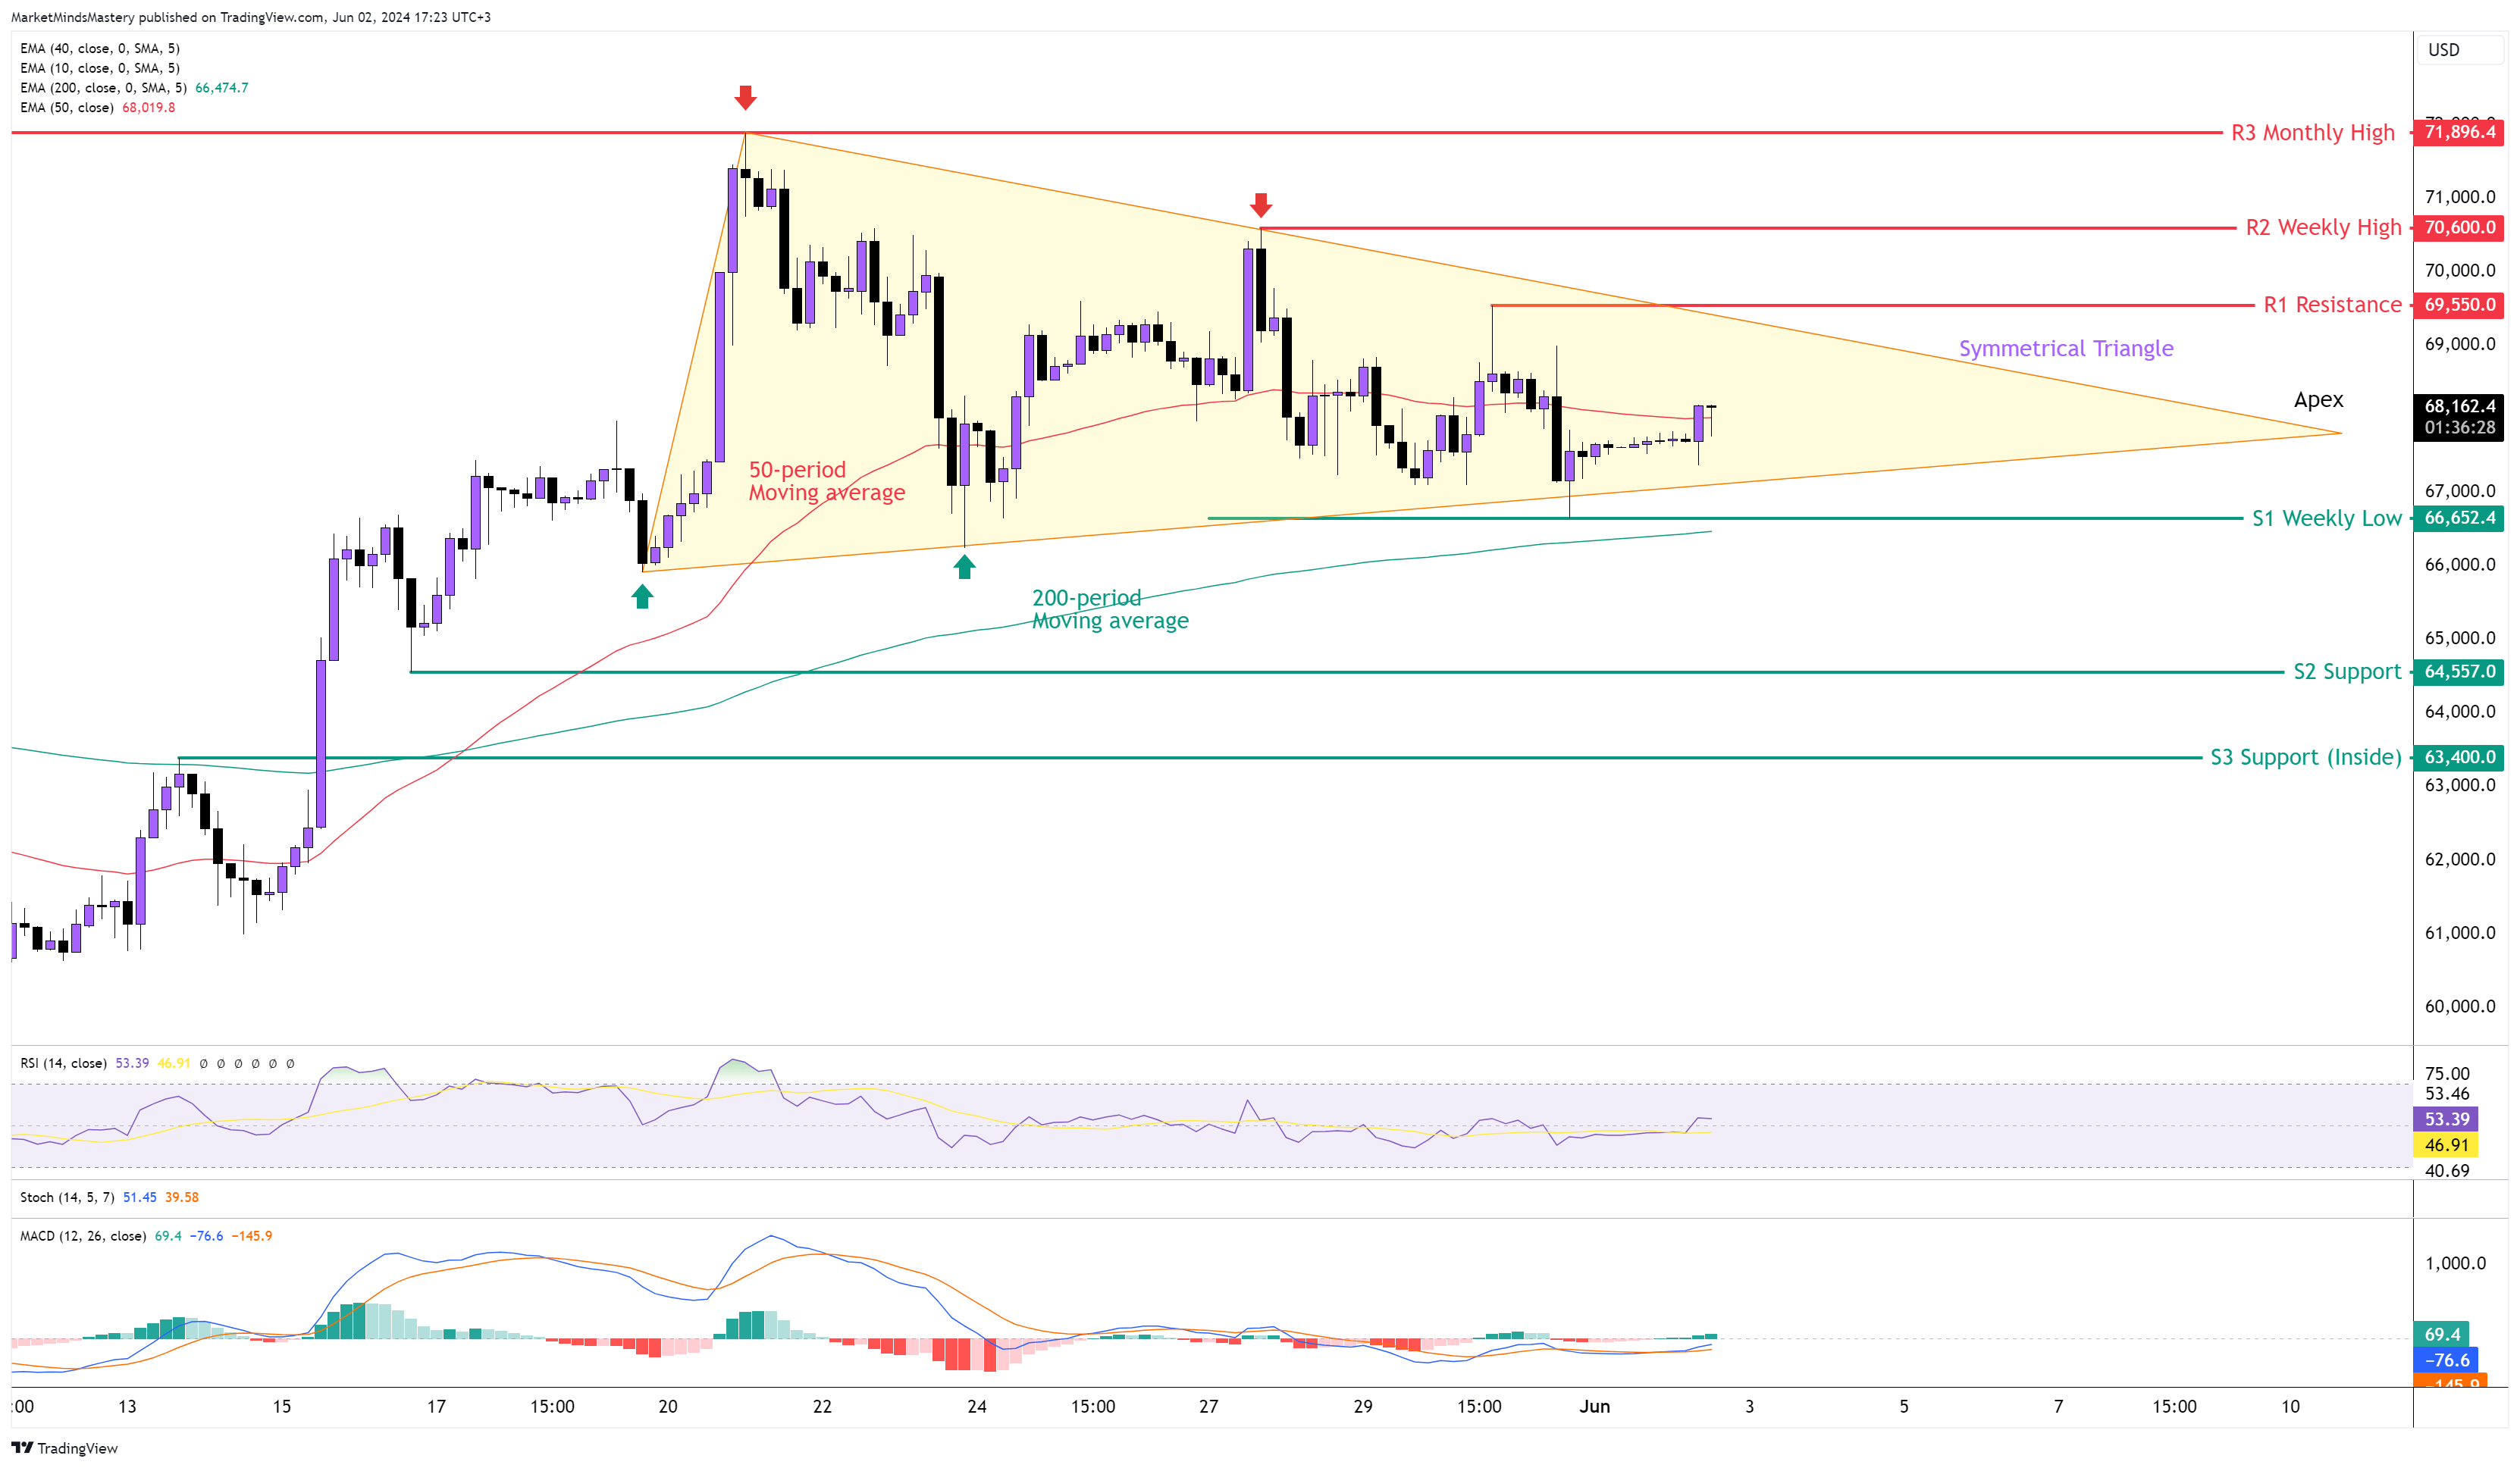
Following Bitcoin’s bullish move, which started a few weeks ago, the price created a Symmetrical Triangle pattern last week. Usually, the pattern is a continuation pattern that resumes the trend. We must mention that the pattern often fails and either acts as a reversal pattern or does not show the breakout until the price moves all the way to the triangle's apex.
Looking at the moving averages, the 50-period is above the 200-period, and this is considered a bullish sign.
The RSI is below the middle line of 50, and which indicates bearishness and the MACD is under the zero line and moving flat, indicating a bearish market.
Starting Monday, if the price moves and breaks above the upper line of the symmetrical triangle, the first resistance is an R1, which will be around $69550. If the price penetrates the |R1 and moves beyond, the next resistance area R2 will be the 70600, which is the previous week’s high.
Alternatively, if the price moves downwards, the first support area will be the $66650, the previous week’s low price. If the price breaks and closes under the S1, the next support area, S2, will be the $64550.
SP 500 4H
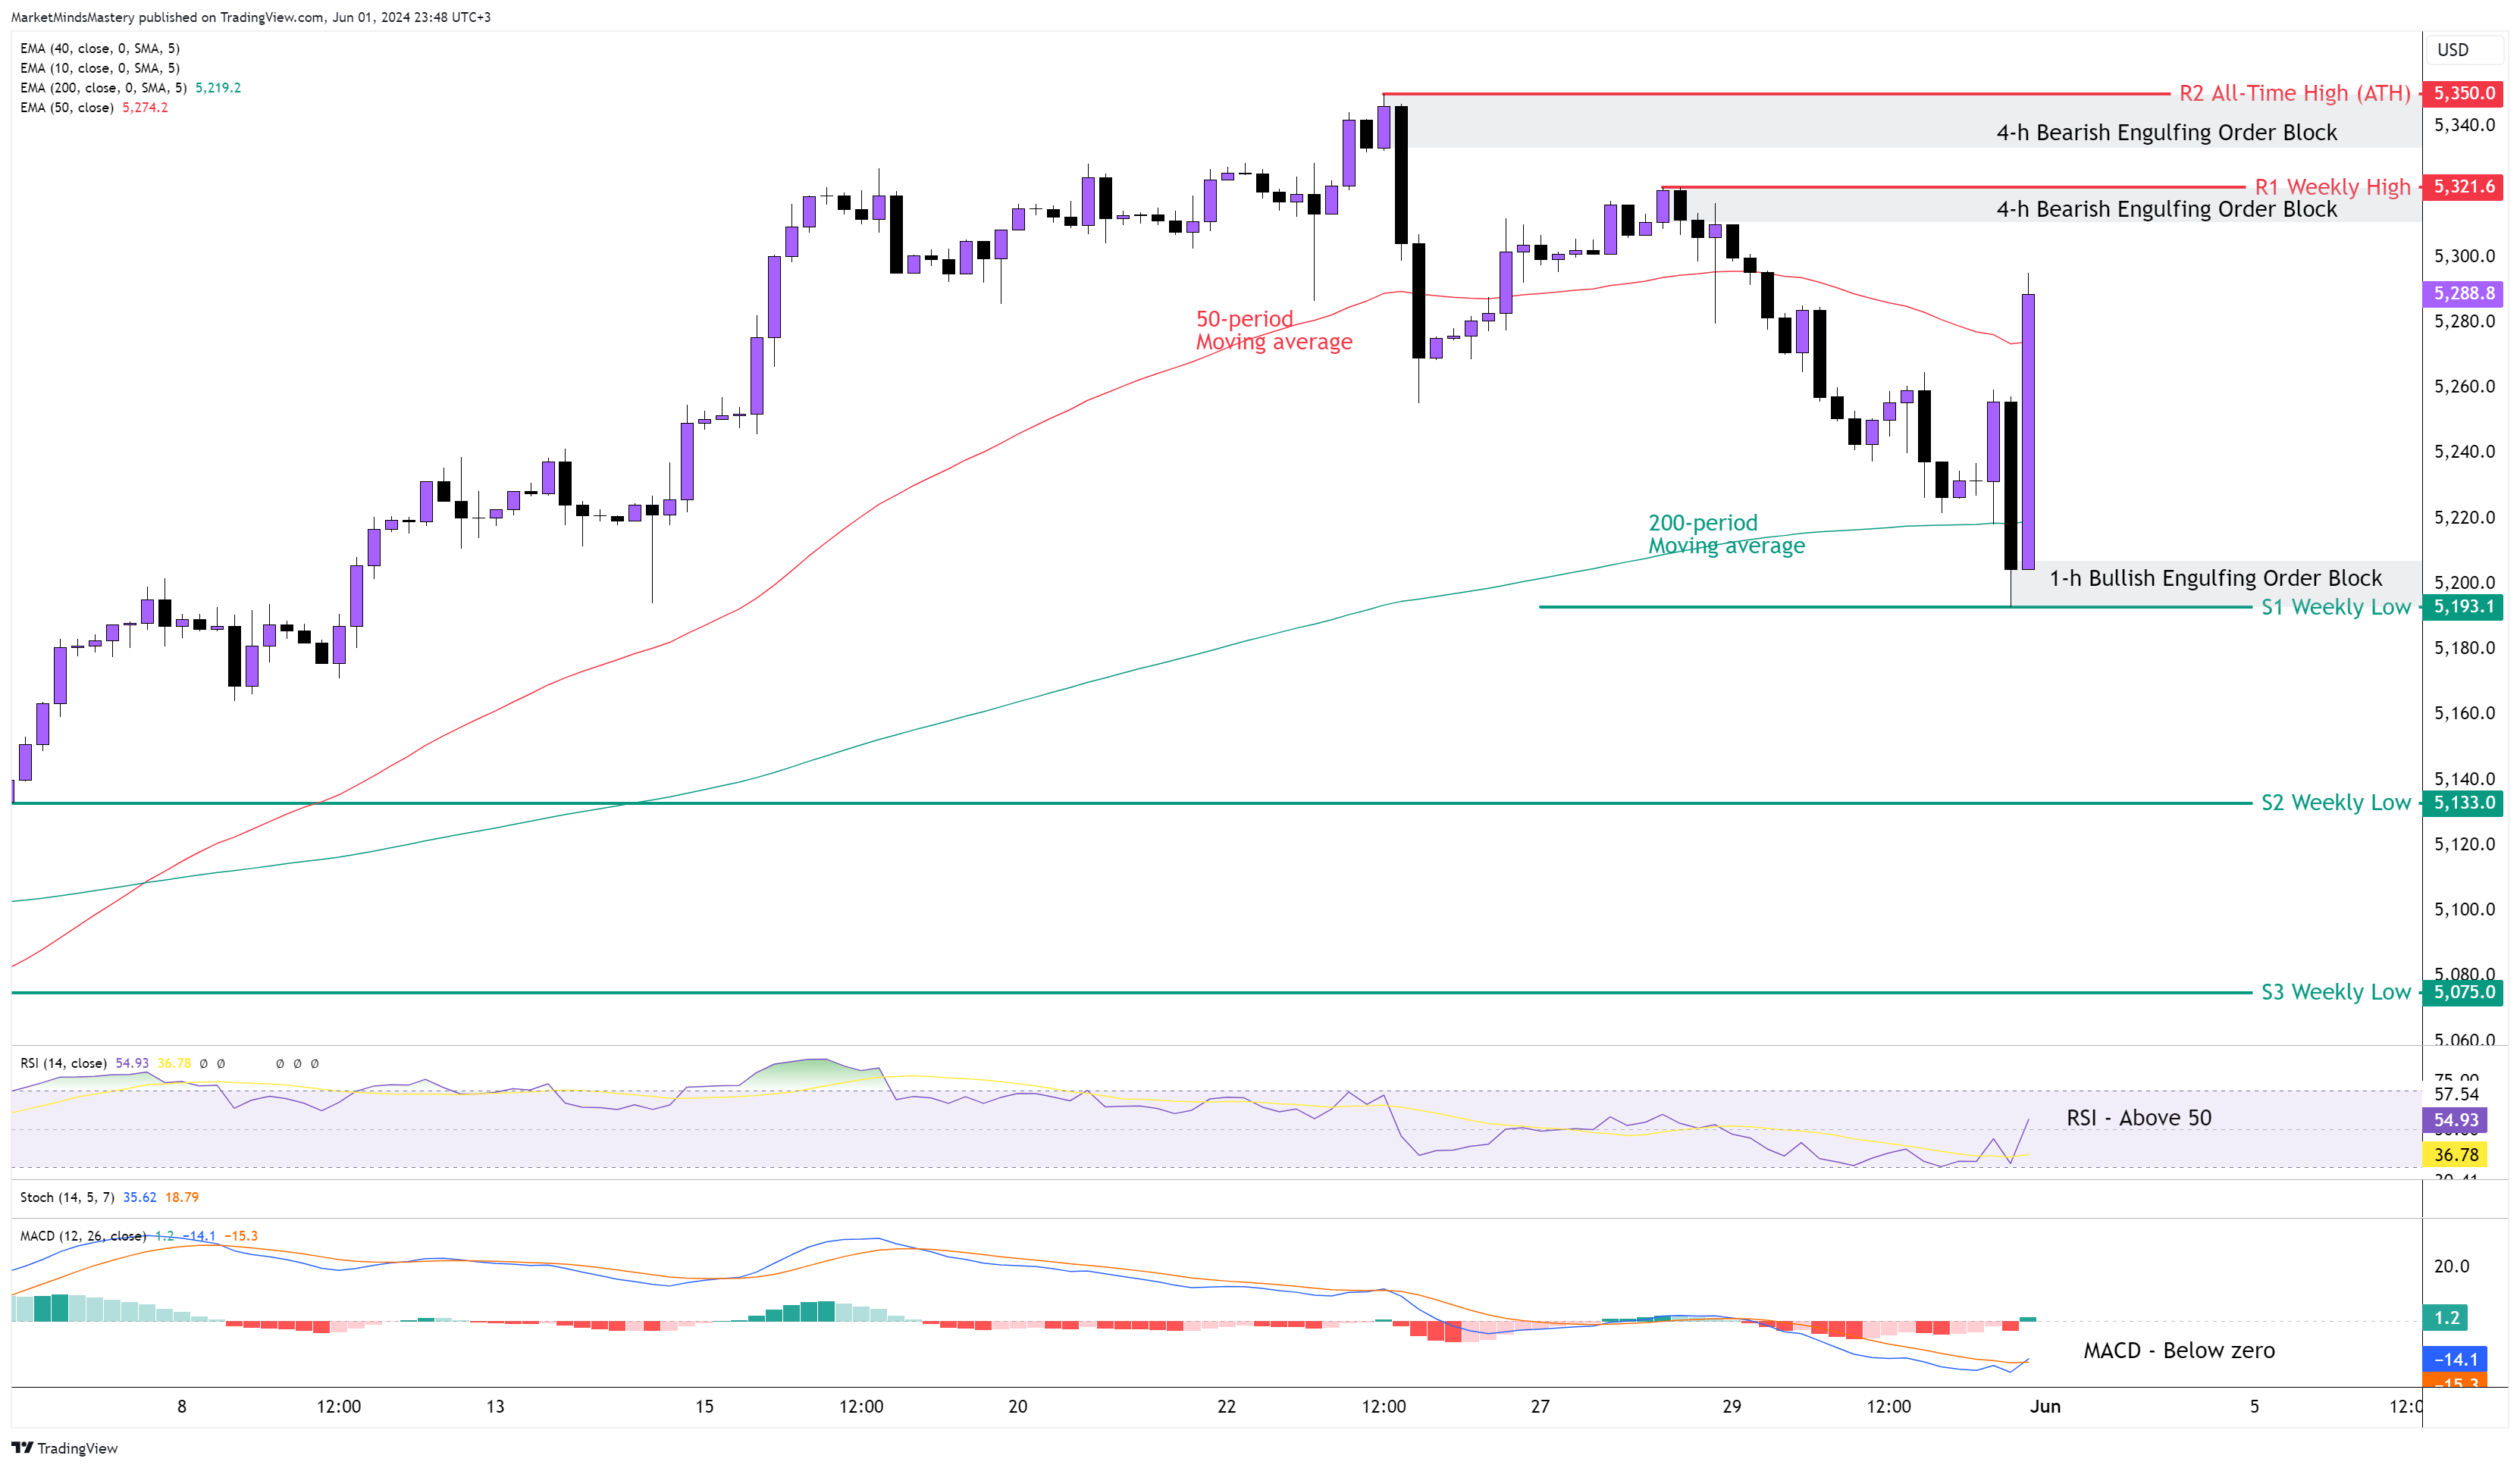
Following the previous market outlook analysis, the price continued trading downwards, with last Tuesday’s Bearish Engulfing candle being the force behind the new downward trend. The price left behind an Order Block marked on the chart under the R1 resistance, which was the previous week’s highest price.
Last Friday, the price found support on the 200-period moving average, from where It bounced off, and by the end of the week, it closed above the 50-period moving average. The 50-period is above the 200-period, which is considered as bullish. The RSI Oscillator is above the middle line 50, indicating bullishness. The MACD is under zero, and it looks like the MACD Line (orange) crosses above the Signal Line (blue).
Starting Monday, if the price moves toward the weekly (primary) trend, the first resistance area, R1, will be the 5321, which is the previous week’s high, as we mentioned earlier. If the price penetrates the R1 and moves beyond, the next resistance area, R2, will be the All-Time High (ATH) around 5350. Combined with the Bearish Engulfing Order Block, this level can be an attractive spot for traders.
If the price declines and moves downwards, the first support area, S1, will be the previous week’s low, around 5193. If the price drops further, the next support area, S2, will be an older weekly low of around 5133.
US 30 4H
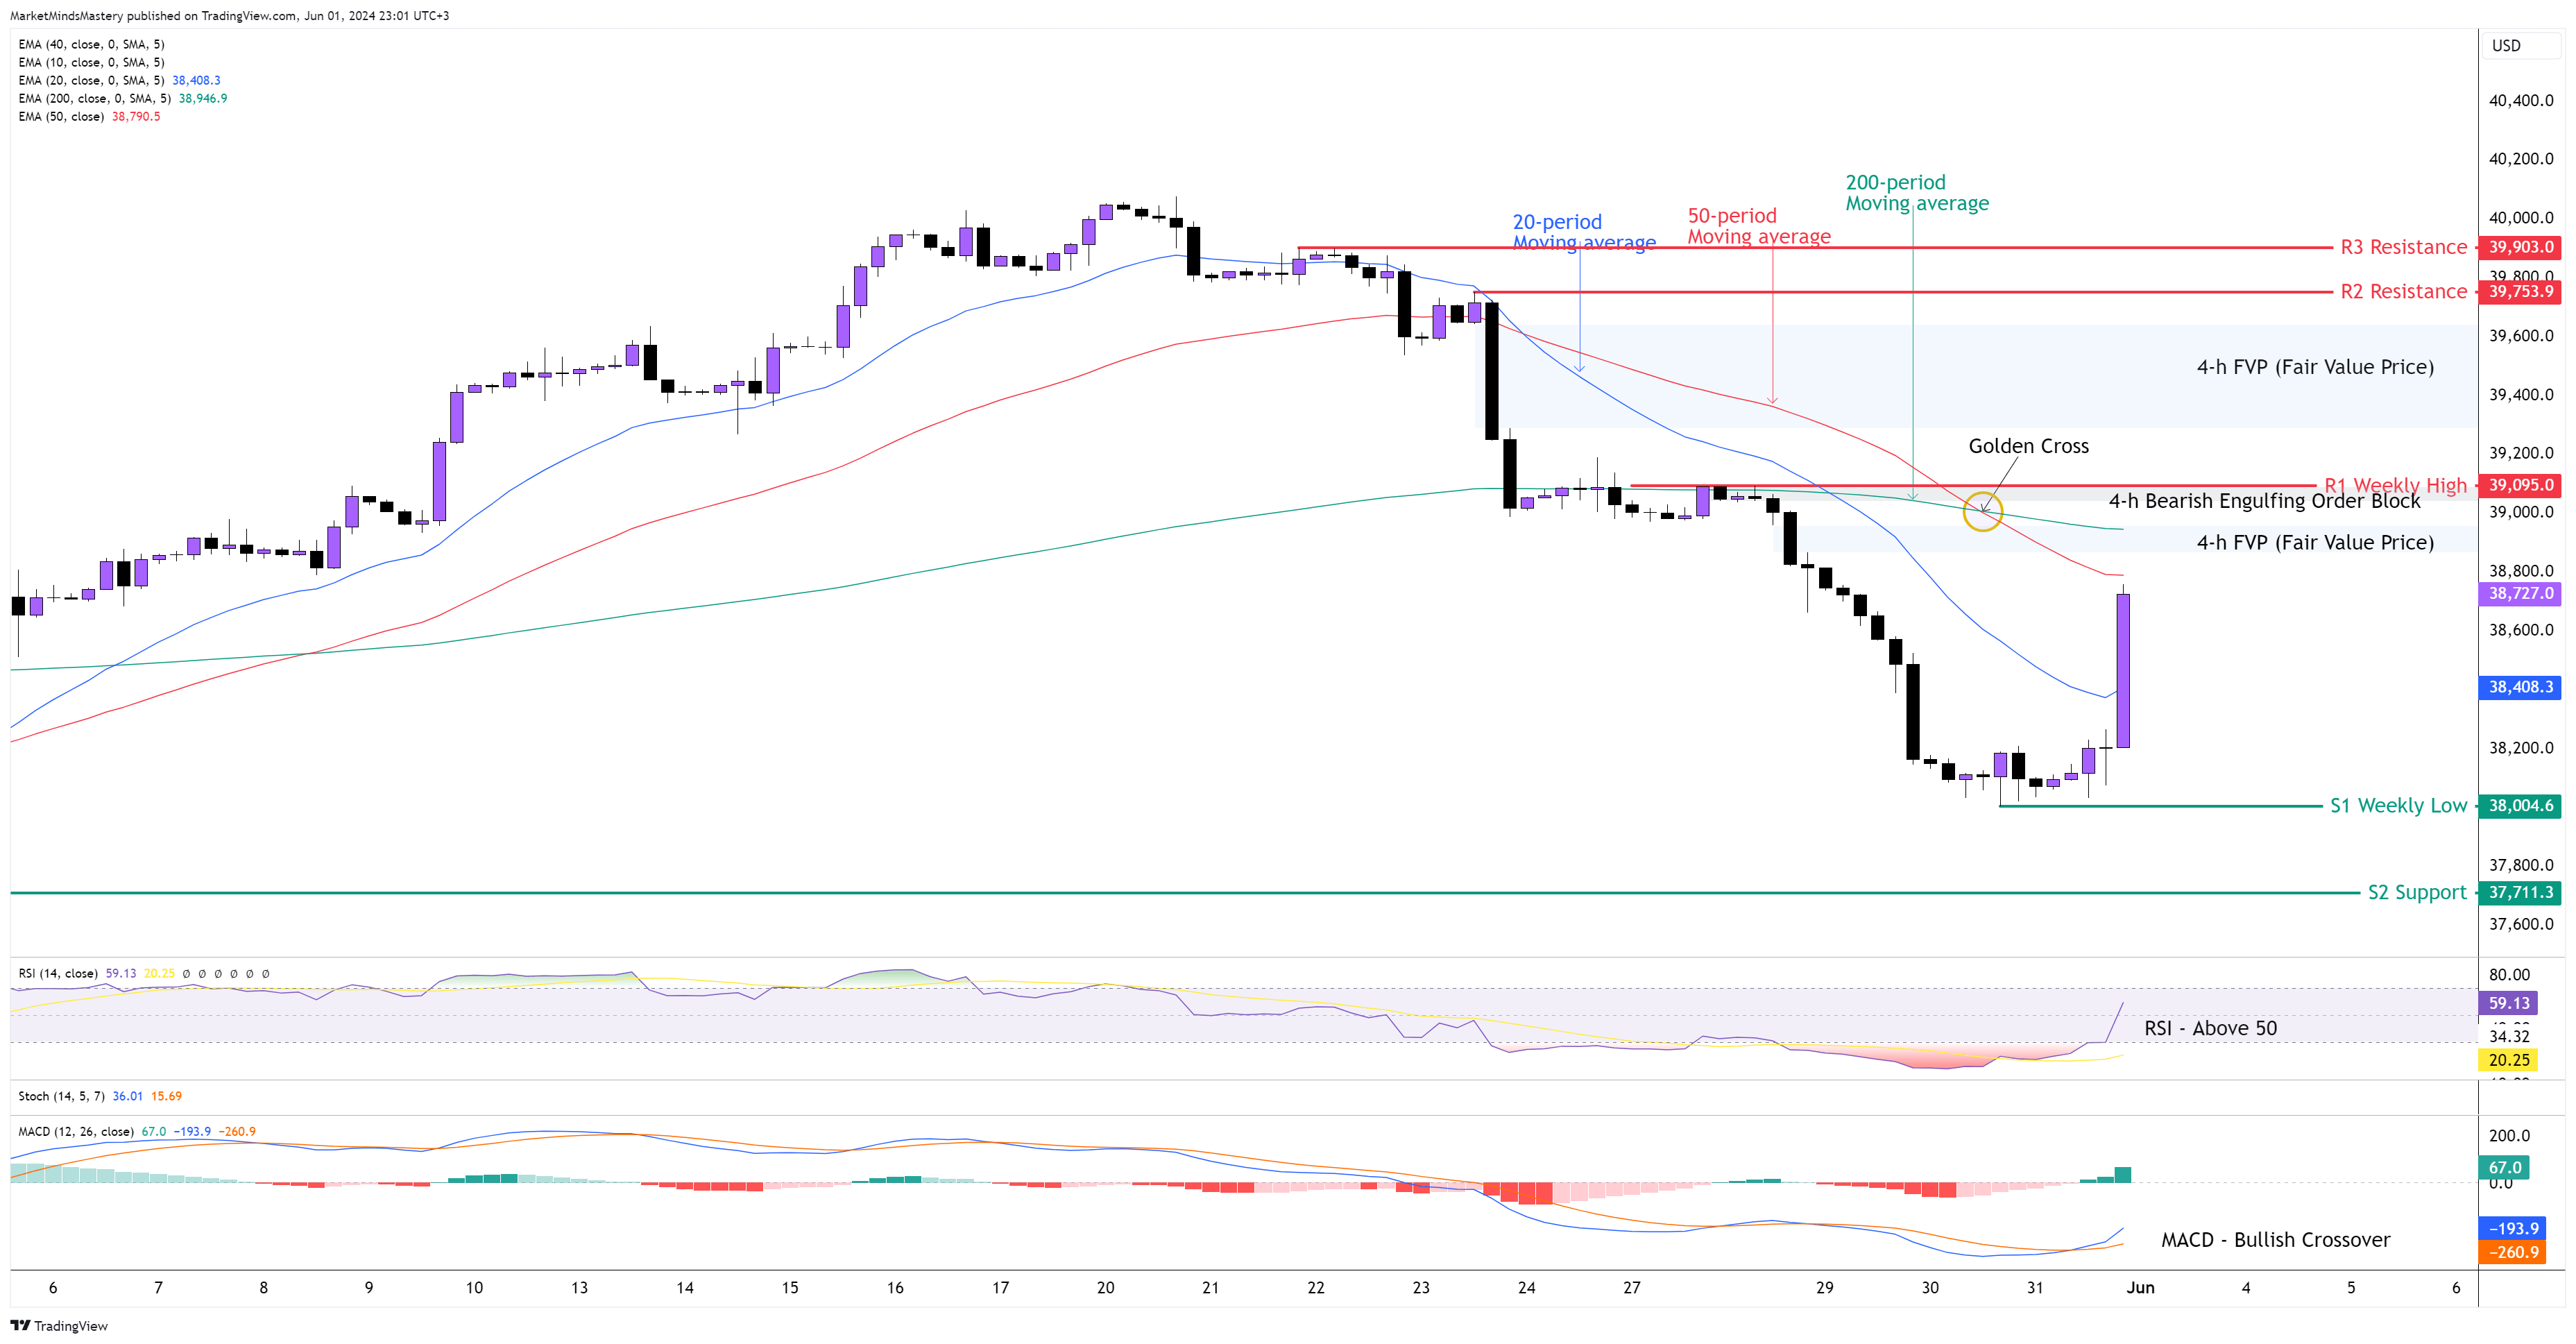
Per our previous market outlook analysis, the Bearish Engulfing candlestick pattern on the weekly chart forced the price downwards last week. The 4-hour chart showed consistency on lower highs and lower lows with small retracements until last Friday. The three moving averages are in order, with the 20-period below the 50 and the 200-period moving averages. After being oversold, the RSI moved above 50, which indicates bullishness and the MACD created a bullish crossover below the zero line.
We consider the weekly chart the primary trend in this case study. The price is in an uptrend from a technical perspective. If the price moves upwards, on the 4-hour chart, the first resistance area, R1, is approximately 39100. The FVP shown on the chart and the Bearish Engulfing Order Block indicate that the trading activity will be intense. If the price penetrates the R1 level and moves upward, the first thing expected to happen is the market is likely to turn upwards and align with the weekly uptrend. In this case, the price can move into the 4-H FVP and reach the R2 resistance around 39753.
On the other hand, if the 4-hour downtrend continues, the price will move lower, with the first support being the previous week’s low around 30000 and marked as the S1 support. The 30000 is a round number and will force many traders to initiate orders to fulfil their beliefs about where the price might go. If the price breaks below the S1 and moves downwards, the next support area, S2, is around 37711.
GER 30, 4H
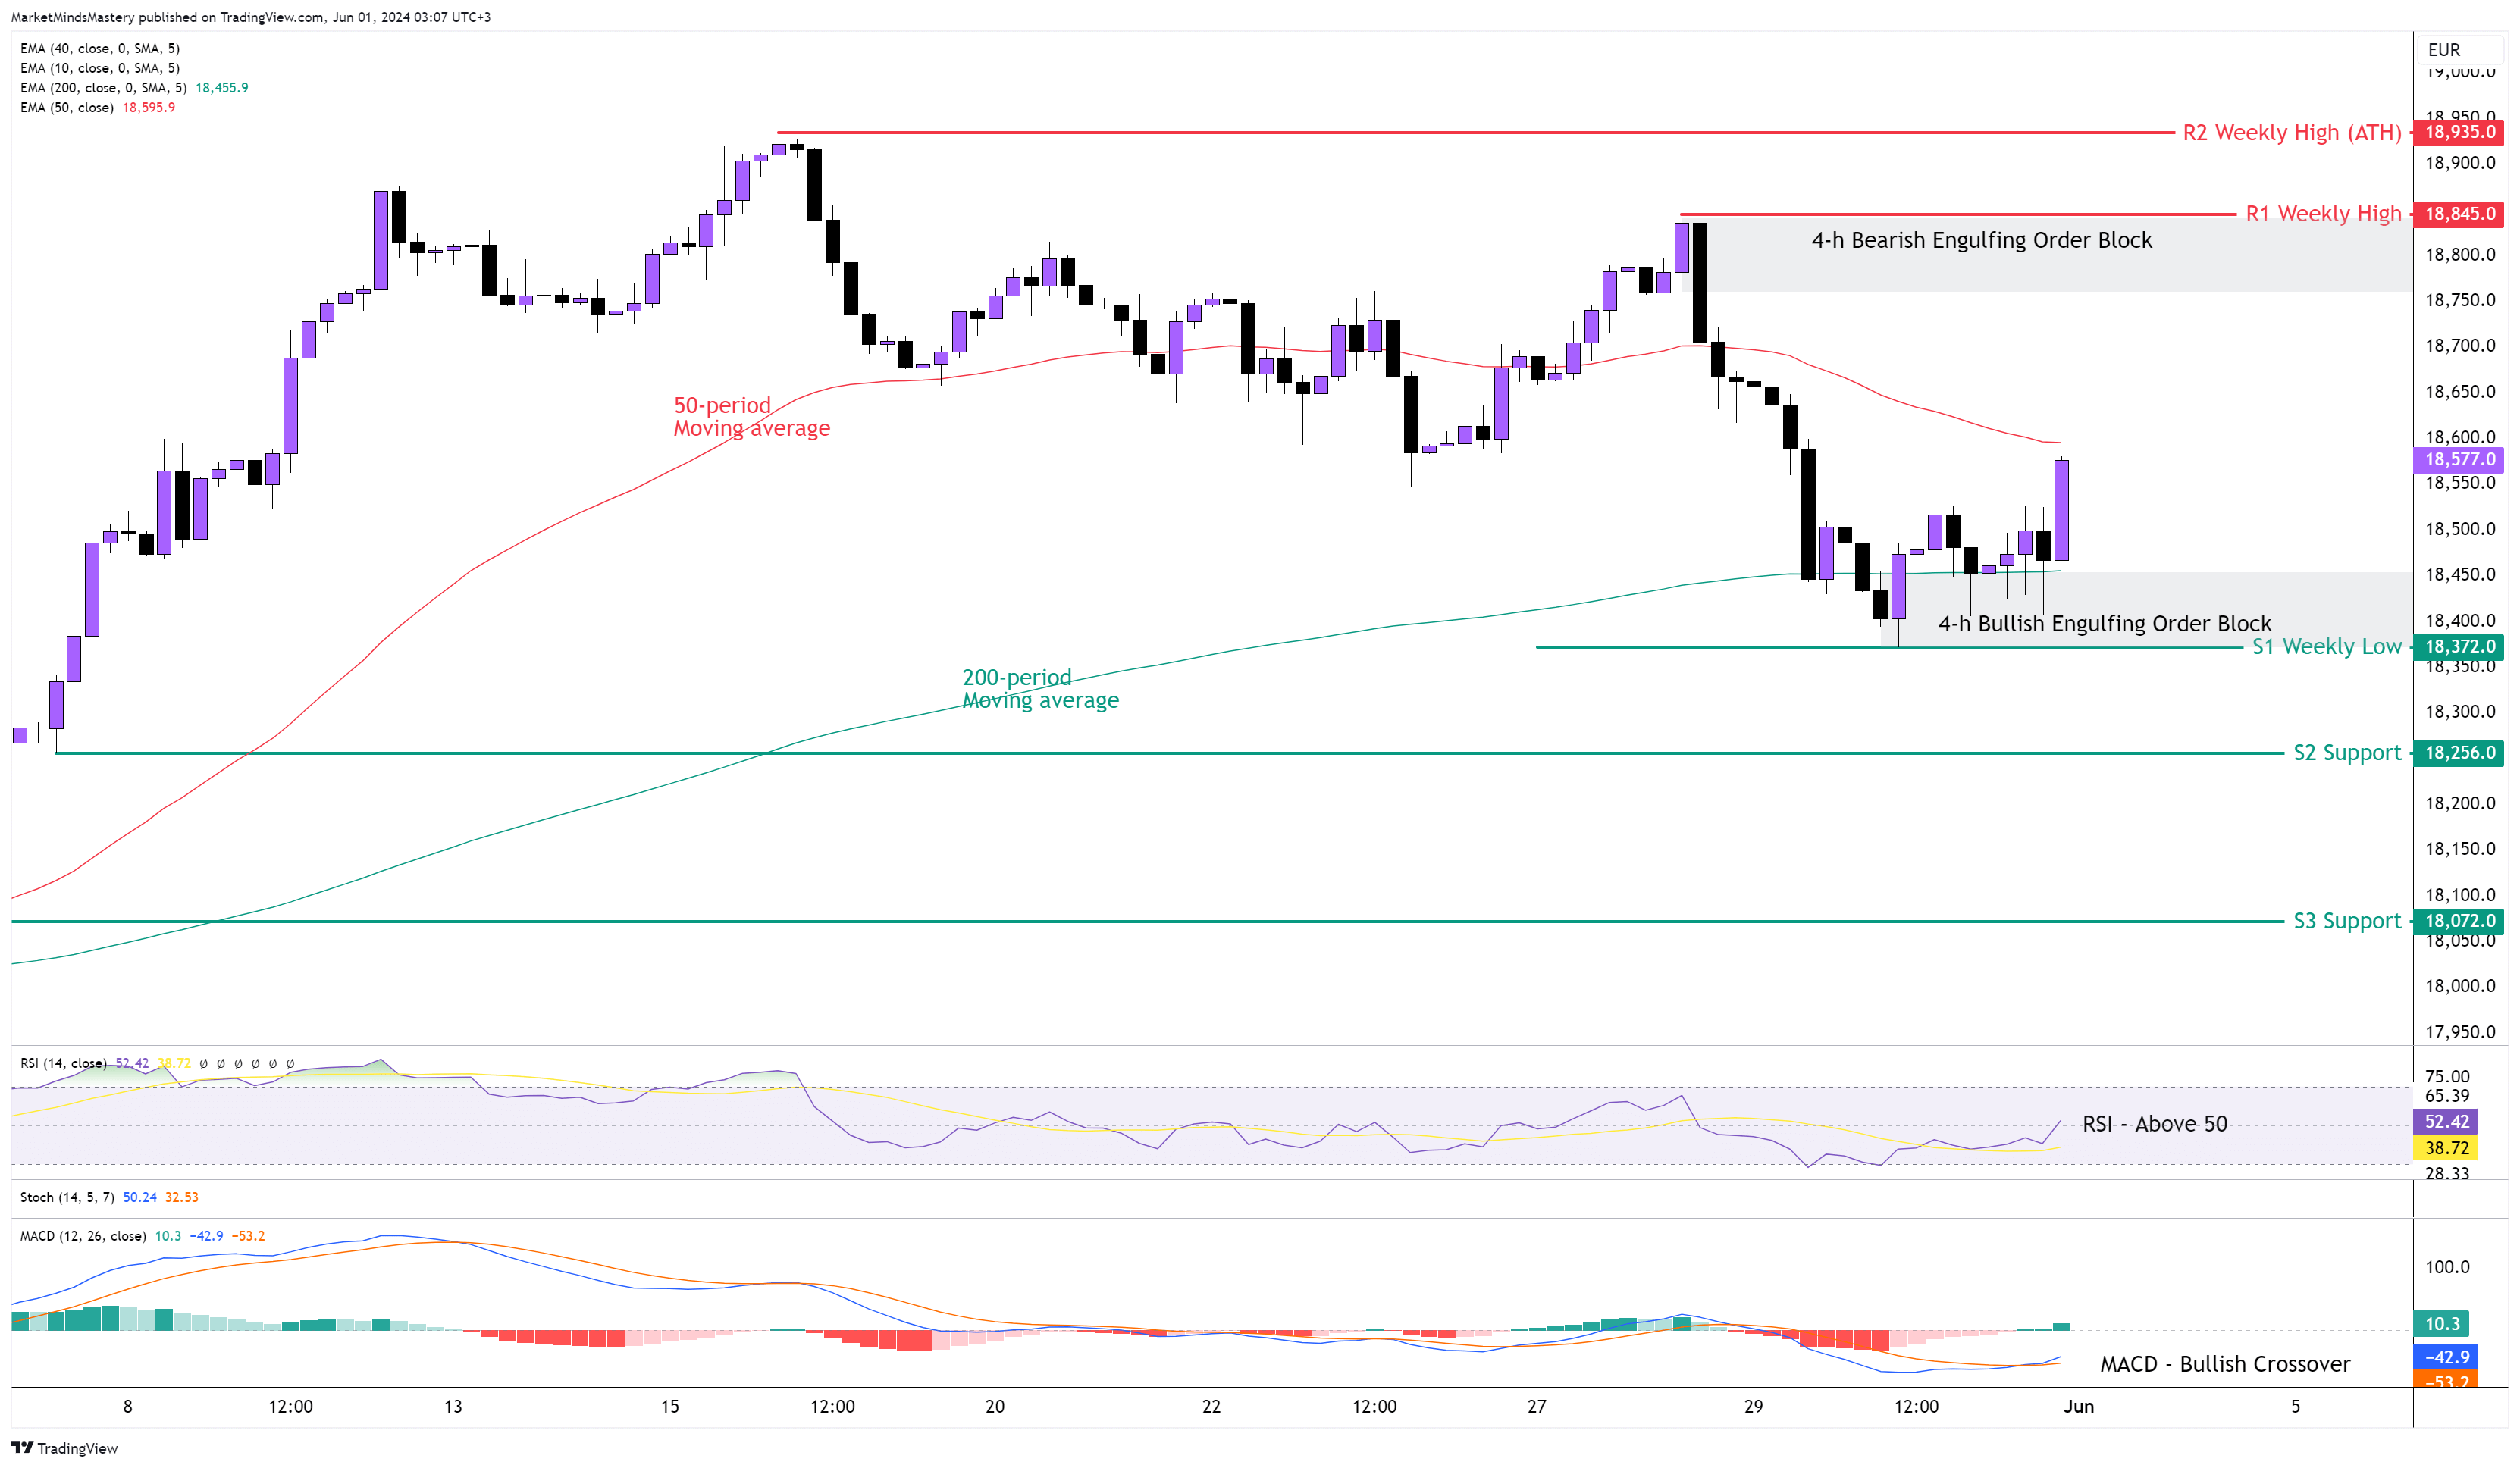
Last week, the German Index created a bearish candle on the weekly chart. Although the weekly (primary) uptrend is up, the Index made another deep lower for a price correction. The price found support on the 200-period moving average, and after a few days of interaction, it bounced off and moved upwards. The 50-period moving average is still above the 200- a bullish indication. However, having the price above both moving averages is far more important than in between. Around the 200-period, the price created a bullish, engulfing Order Block, which can attract the attention of market participants. Additionally, the RSI Oscillators are above 50, which is a bullish indication, and the MACD created a bullish crossover as the MACD Line crossed above the Signal line while they were below the zero line.
Starting Monday, if the price continues to move upwards and close above the 50-period moving average, it will find the first resistance R1, around 18845. At this level, a Bearish Engulfing Order BLock was created last week and can be a significant attraction for market orders. If the price penetrates the R1 and closes above it, the next resistance, R2, will be the All-Time High (ATH) around 18935.
On the other hand, if the price is rejected and moves downwards, the first support area, S1, will be the previous week’s low, around 18372. A close below it and a move lower will find the next support area, S2, around 18256.
👉 Click here to check our Challenges
👉 Don’t miss our Free Live Webinars
👉Join us on Discord
Risk Disclosure:
The Trading Pit offers only demo accounts to all users within the Challenges and Signal Provider Agreements (Scaling Plan). All assets and trading activities are purely virtual. Please note that we do not offer CFD (Contract for Difference) challenges to residents of Canada and the United States. All content and information on this website is for informational purposes only and should not be interpreted as financial advice. Also, remember that results achieved in the past are no guarantee of future results. It is essential to understand the risks associated with trading. If you are unsure, always consult an independent financial advisor.