The Trading Pit Week Ahead Market Outlook (June 17 – June 23)
Last week, we saw big directional moves in the US dollar due to the interest rate decisions made by the FEDs and the FOMC. The Fed decided to keep the Interest Rates in the US unchanged at 5.5%. Considering the drop in interest rates at the ECB and the BoC, the market participants became optimistic and appreciated the US dollar. Additionally., the BoJ kept the interest rates at 0%. This week is expected to be another volatile week due to interest rates reports by other major banks.
Starting Monday, the Industrial Production in China will report and the forecast estimated decrease from 6.7% to 6%. Additionally, the Retail Sales in China are about to increase significantly, from 2.3% to 3%, as per the forecast. This will directly affect the volatility of the Chinese Yuan.
In Australia, on Tuesday, the Reserve Bank of Australia will report the interest rates, and the forecast shows the RBA's willingness to keep the rates unchanged at 4.35%. The Aussie can be a promising currency, and it can experience high demand if the rates remain as per the consensus or if they will increase (unlikely) and if traders and investors around the world will be positive and buy the Aussie. If the Euro’s weakness continues, then the EURAUD currency pair can develop downtrends. Regarding the AUDUSD, the currency pair is ranging. Therefore, a breakout needs to occur first before we look for trend developments.
The last major event for the day will be the Retail Sales in the US, and the forecast shows anticipation for an increase. The previous report was 0%, and now the forecast shows an increase to 0.3%. This can significantly increase the volatility in the USD during the New York trading session.
The CPI (Consumer Price Index) in the UK will be the primary event on Wednesday. There is a significant forecast for this event, with a drop in the number compared to the previous report. Previously, the Consumer Price Index in the UK was 3.9%, and now they are expected to decrease to 3.5%. Usually, if the actual number confirms the forecast and the market follows through, there is a high probability the market participants will depreciate the value of the Sterling and start selling it. If the AUD gains strength and the GBP weakens today, short-sell opportunities will arise for the GBPAUD currency pair.
In the US, the banks will be closed all day due to Juneteenth.
The volatility is expected to be high and intense on Thursday, and starting in the early morning during the Asian session in New Zealand, they will report the GDP( Gross Domestic Product).
As per the forecast, the report is expected to be positive compared to the GDP in the last quarter. Last GDP was -0.1%, and this time is likely to increase to 0.1%. This could be favourable for the Kiwi and lift the value of the NZD higher. Thirty minutes after the London trading session, the SNB (Switzerland National Bank) will report their interest rates. The forecast this time shows a willingness to keep the rates unchanged at 1.5%. Usually, when the IR of a major economy stays unchanged, it is not considered a positive sign for the country’s currency. However, currently, as other major banks decrease, traders and investors will look at major banks that at least keep their rates unchanged as a positive sign. Anyhow, the USDCHF has been technically in a downtrend since the beginning of June, and this is exclusively due to the Swissy dominance. The last Interest Rates report for this week will be in the UK. This month, the majority of the committee members voted for the rates to remain at 5.25%, and only two Members voted for a rate cut. If the rates remain unchanged, the Sterling is likely to be appreciated by the market participants, and it might create some robust price correction on the GBPUSD currency pair. If the BoE decreases the interest rates, the Sterling will most likely depreciate.
This trading week will end on Friday without significant events during the Asian and Australian sessions. One hour before the trading session starts in the U.K., they will announce the Retail Sales and the forecast shows a significant increase from -2.3% to 1.6%. This will go along with the yesterday's event. If the IR report favours the value of the Sterling and if the Retail Sales keep the market participants optimistic, then a strong GBP can be the surprise of the week. Next, in Germany, the Composite PMI and the Services PMI are expected to be reported above 50 and the Manufacturing PMI around 46.4. Similarly, in the Eurozone, the Composite PMI and the Services PMI are expected to be reported above 50, and the Manufacturing PMI is expected to be around 48. These events alone don't usually significantly affect the price of the Euro, but they can make the price charts volatile, especially in short-term time frames.
In the UK, all three, the Composite PMI, the Manufacturer PMI and the Services PMI, are expected to be reported above the benchmark 50, which can be considered as positive for the Sterling. The week will end with the S&P Global Manufacturing PMI and Global Services PMI in the US, which are expected to report 51 and 53.5, respectively. As they will remain above 50, it can be considered bullish for the US Dollar.
EUR USD 4H

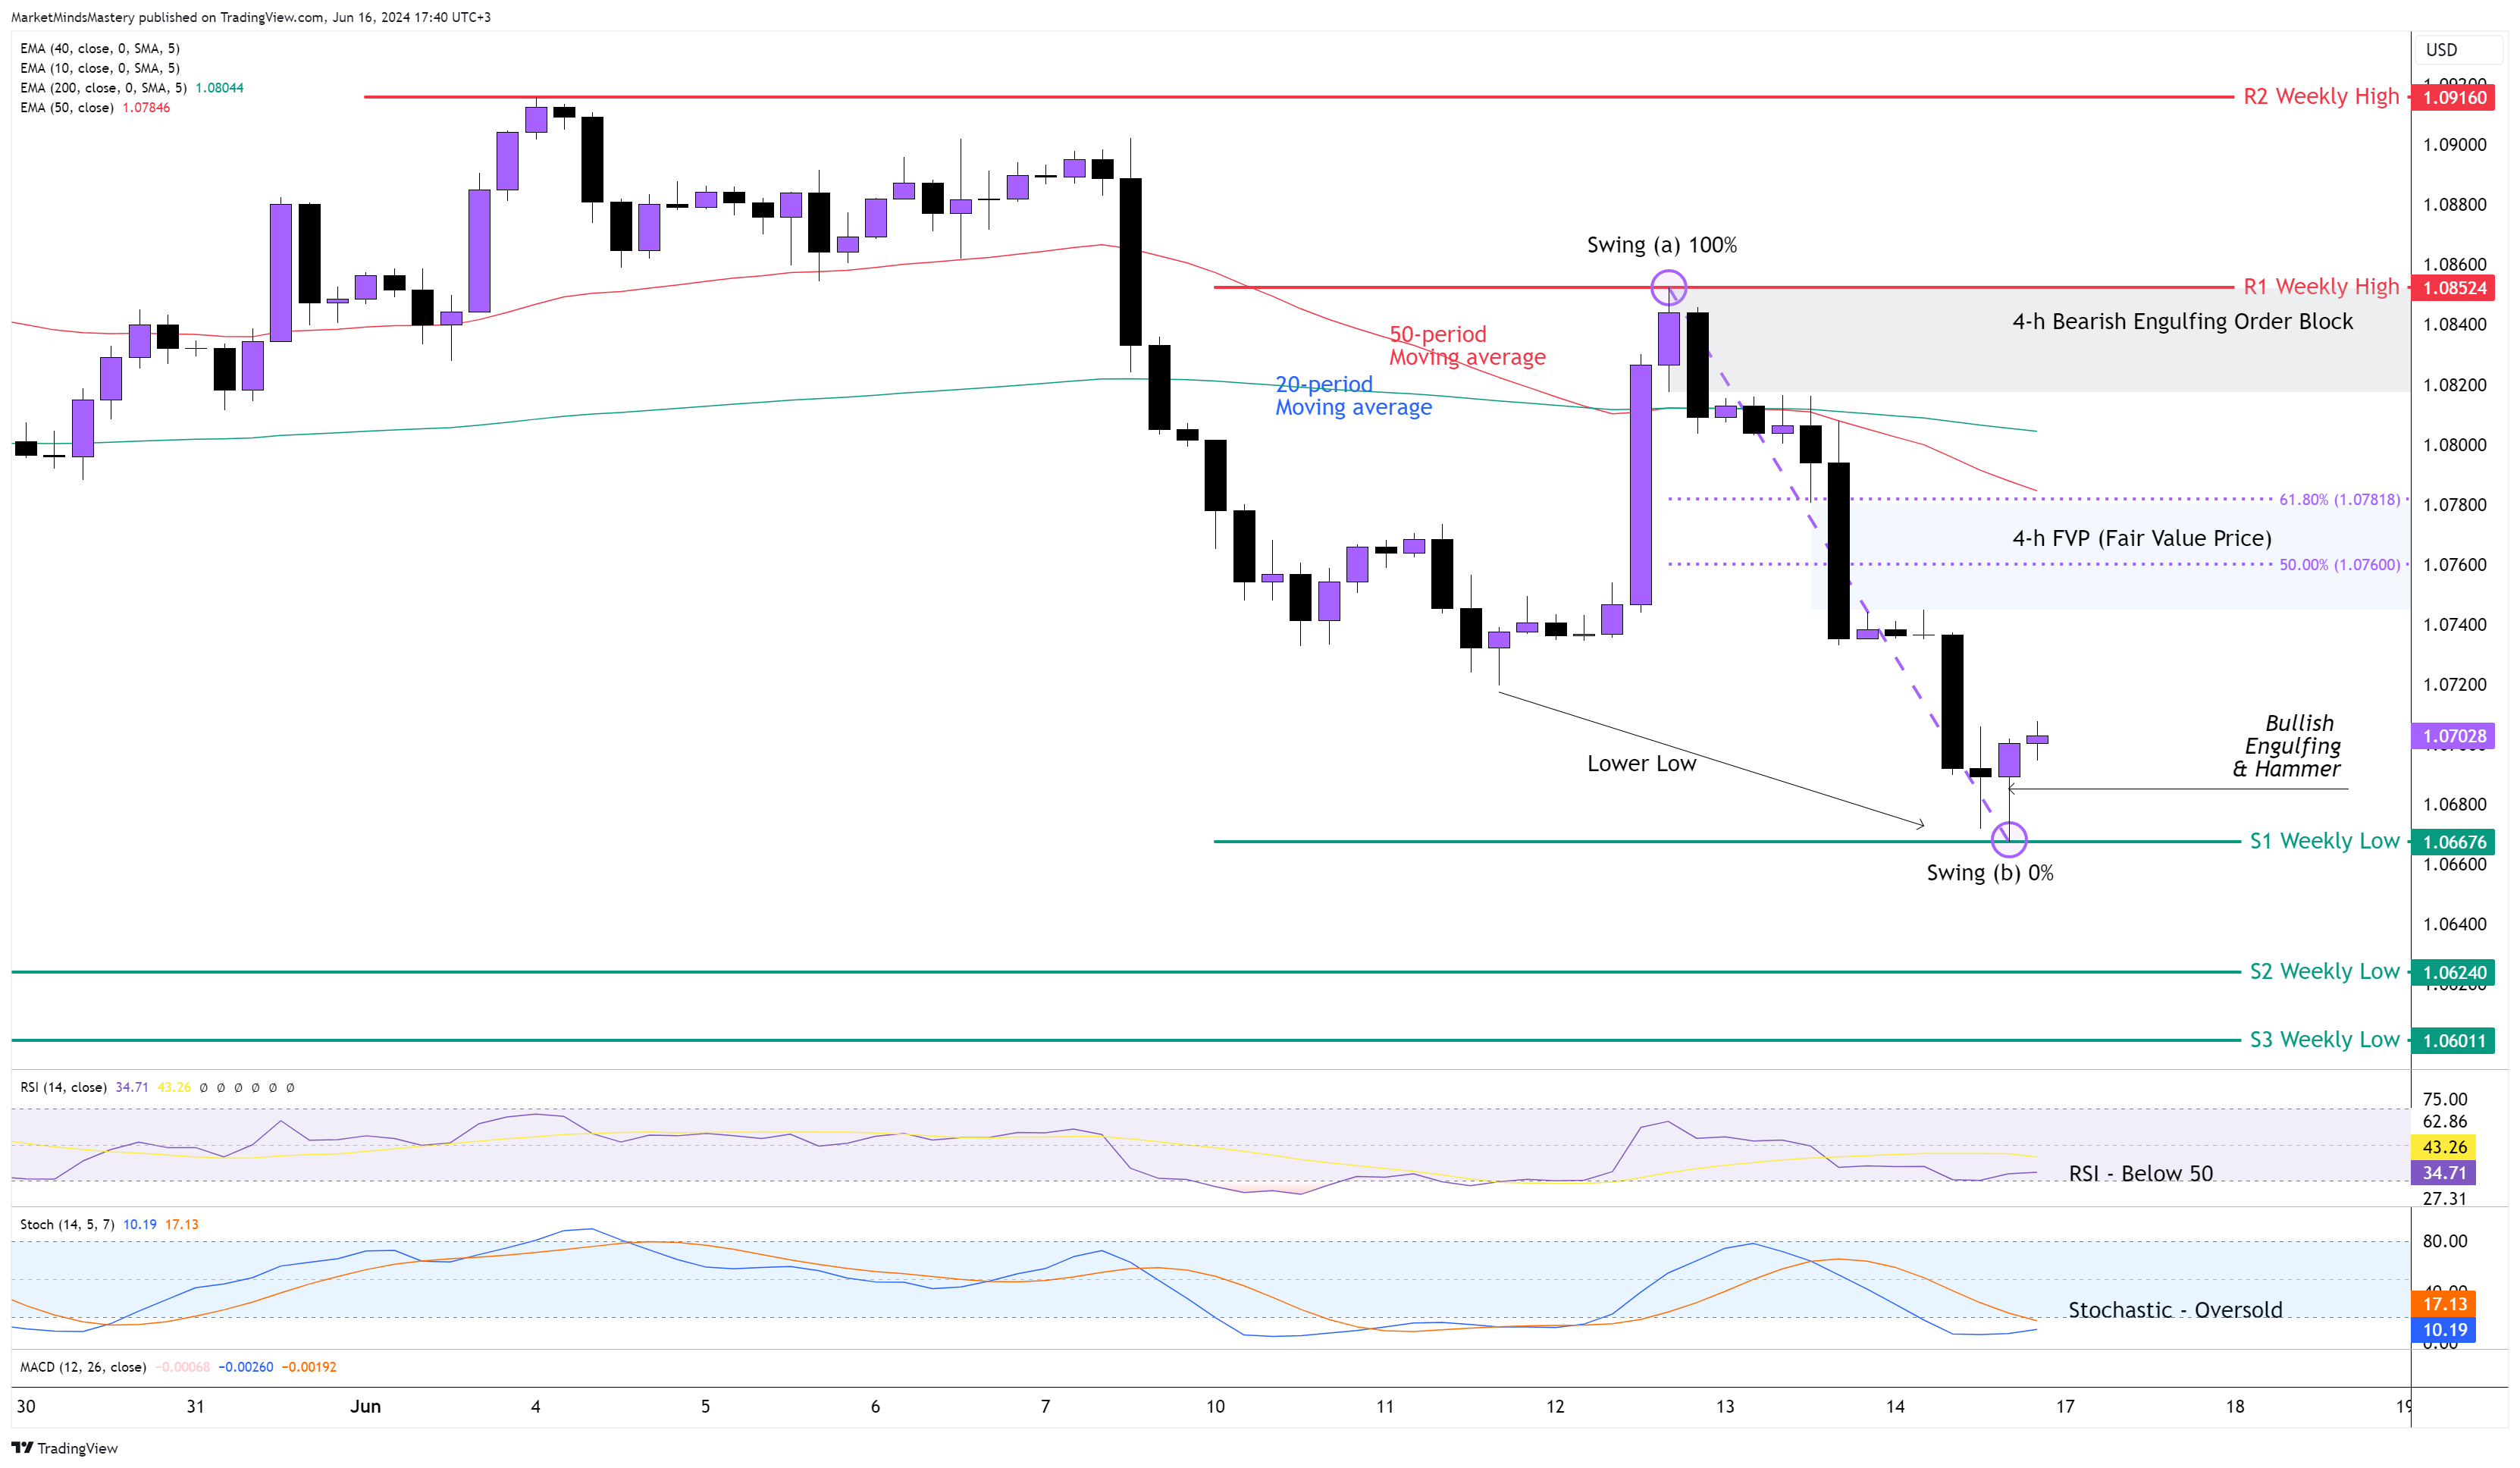
Last week, the weakness of the Euro continued as expected, and as per the previous week’s market outlook, the price entered the FVP (Fair Value Price) area, declined, and created a new Lower Low. During the downward move, the price left a few new FVP areas, and we show the most important one on the chart. As the price created a Bullish Engulfing and, at the same time, a Bullish Hammer reversal, we can use the Fibonacci retracement tool to identify prominent areas of resistance.
The 20-period is below the 50-period moving average as expected, which is a bearish indication. Also, the RSI Oscillator is below 50, and the Stochastic Oscillator is in an oversold condition. However, the %K line didn't cross above the %D line.
Starting Monday, if the price moves upwards for a retracement, the first area of resistance can be considered the area between the 50 and 61.8% Fibonacci levels. At these levels, the moving averages interact to make the levels more attractive to market participants. If the price penetrates both Fibonacci levels and moves upwards, the next resistance area will be the static resistance, R1, approximately 1.08524. This is the previous week’s high. If the price retraces 100% of the move and penetrates the R1, the next resistance area, R2, will be 1.09160, which is also a weekly high. On the other hand, if the price is rejected and keeps moving downwards, the first support area, S1, is around 1.06676, which is the previous week’s low and the next support, S2, will be around 1.06240, which is also a weekly low.
GBP USD 4H
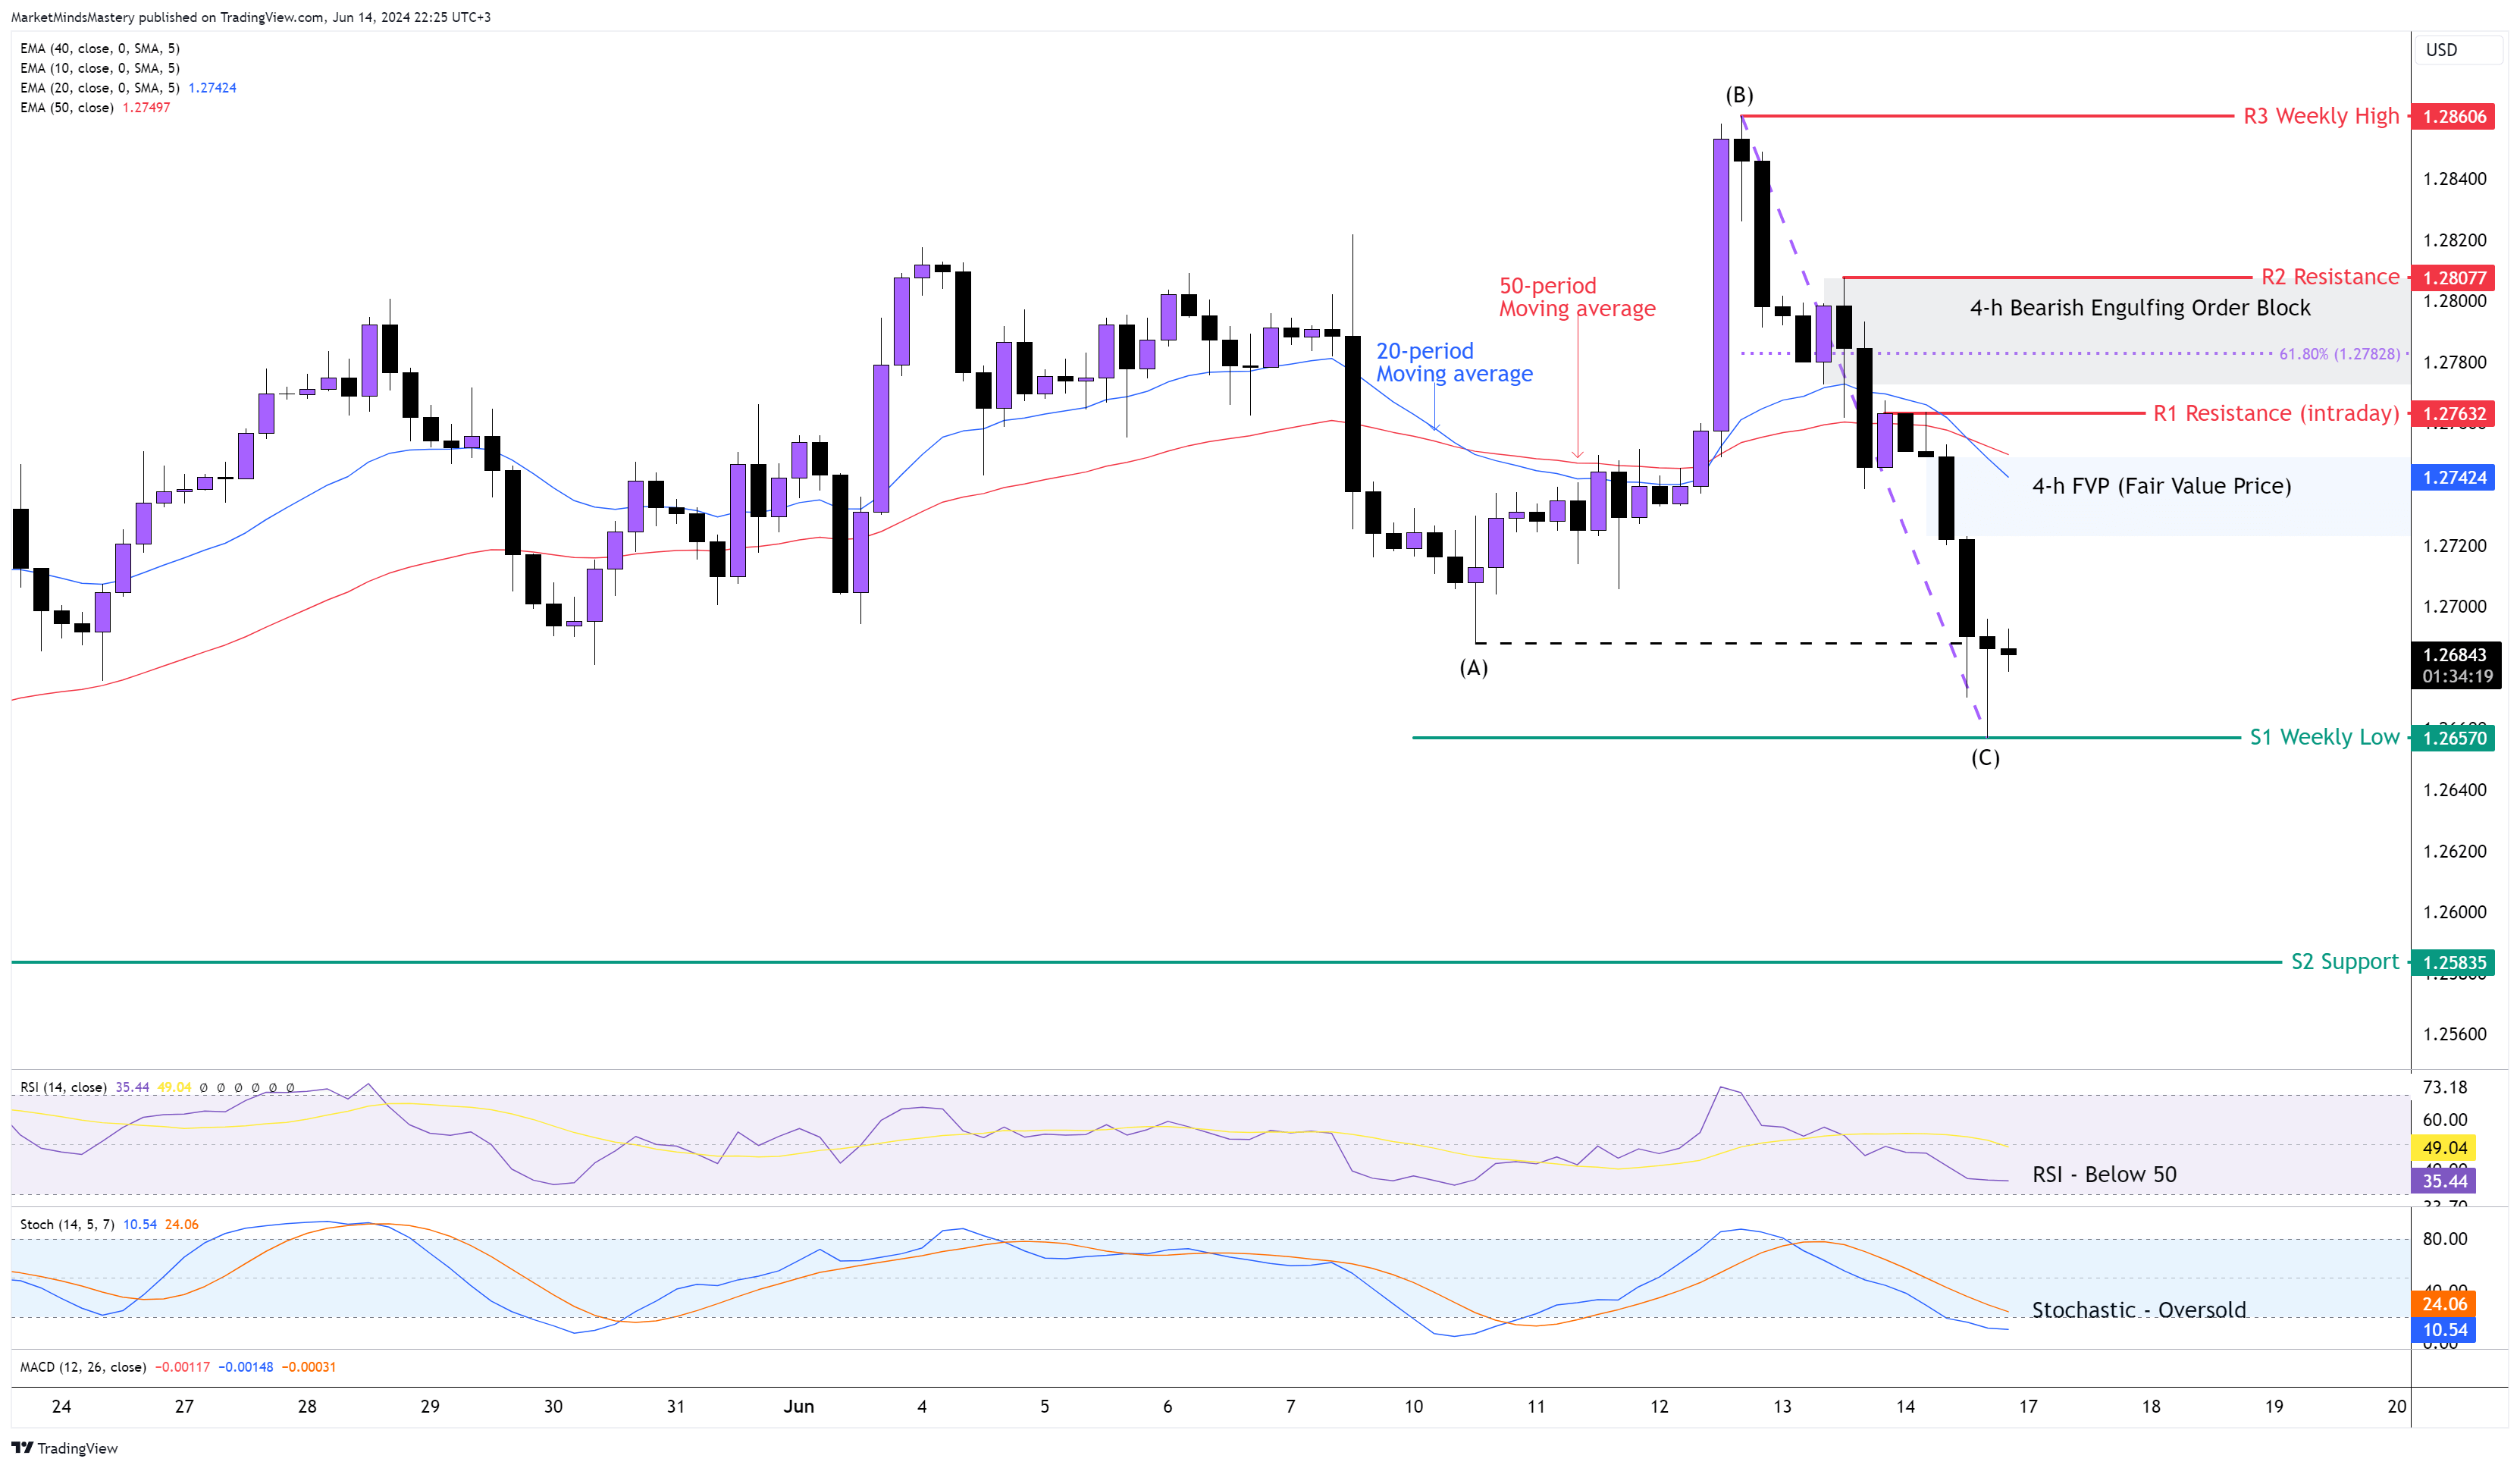
It has been a while since the Sterling traded until 1.2900, which is a critical level for the currency, and the price last week falsely broke multiple weekly highs. It declined after the FOMC, leaving the reversal weekly candle, what we call a combination of a Bearish Engulfing with a long Upper Wick.
On the 4H chart, the price broke the uptrend structure as the low at point (A) penetrated by the Low at point (C ). As the price didn’t move fast downwards after the breakout, it instead created a reversal candle with a long lower wich, as per point ( C), so the breakout needs to be suspected, at least temporarily. The 20-period crossed below the 50-period moving average, and this has bearish implications. Also, the RSI is below 50, and the Stochastic Oscillator is in an oversold condition, which also has bearish implications.
If the price bounces off and moves upwards, the first resistance area, R1, will be around 1.27632, which is an intraday resistance. If the price penetrates the R1 and moves upwards, the next resistance area, R2, is around 1.28077. A Bearish Engulfing Order Block was created in this area, and it can add value to the R2 resistance. A further upward move finds the next resistance area, R3, at around 1.28606, which is the previous week’s high. Oppositely, if the price keeps moving downwards, the first support area, S1, will be the previous week’s low, around 1.26570. If the price penetrates the S1, the next support area, S2, is approximately 700 points (70 pips) below the S1, around 1.25835.
AUD USD 4H
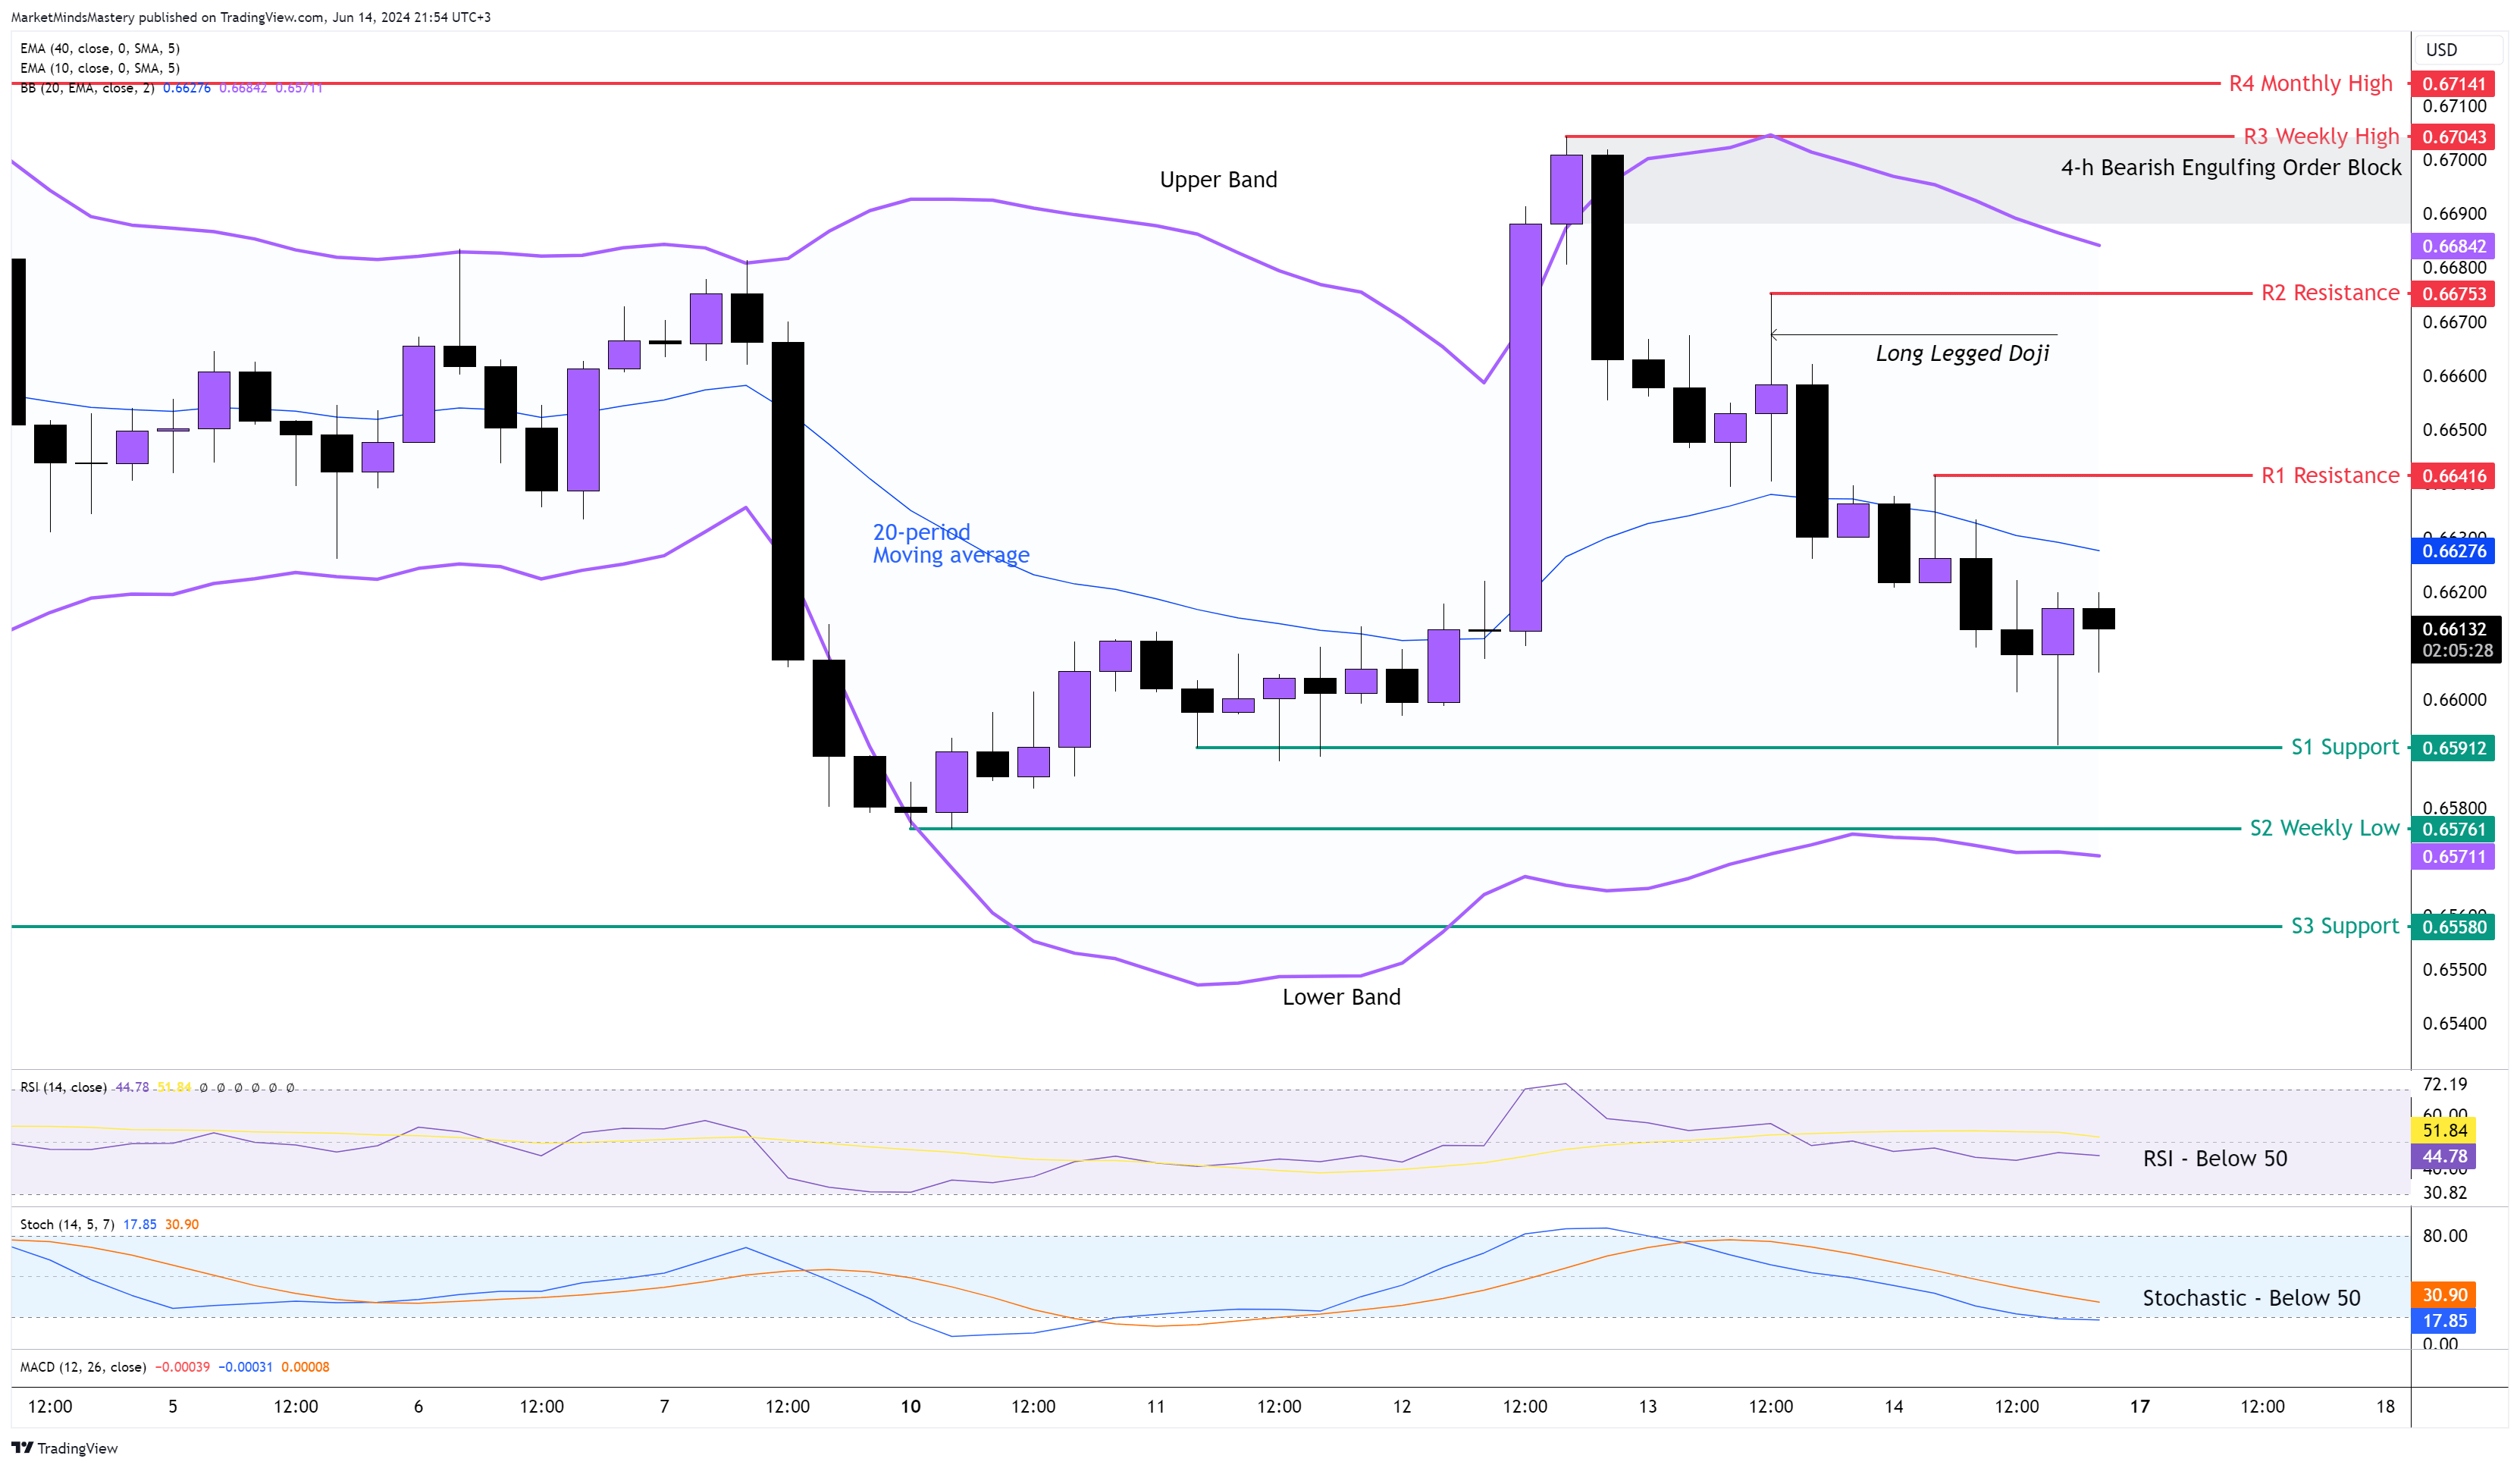
The Australian Dollar ended the previous week without any significant move to create a market structure. Oppositely, it ended up staying in a range, and it managed to trade until the recent weekly high and the recent weekly low.
Using the Bollinger Band, the Upper and the Lower Bands are parallel, and the price is trading within both bands without any significant breakout.
Both Oscillators, the RSI and the Stochastic, are under their middle lines, and this indicates that in the last 10-14 period on the 4H time chart, the price declined. The price is trading below the 20-period moving average, which has bearish implications on the short-term price move. If the price moves downwards, the first support area, S1, is around 0.65912. If the price penetrates the S1 and moves lower, the next support, S2, will be the previous week’s low, at 0.65761. This level clusters with the lower band of the Bollinger Band indicator. Moving further downwards, find the next support, S3, at around 0.65580.
On the other hand, if the price finds support, bounces off and moves upwards, the first resistance area, R1, is around 0.66416. If it penetrates the R1 and keeps rallying, the next resistance area, R2, is the high of the long ledge doiji candle, around 0.66753. The top of the range, which is 0.67043, will be the next resistance area, R3, and it is another weekly high.
USD JPY 4H
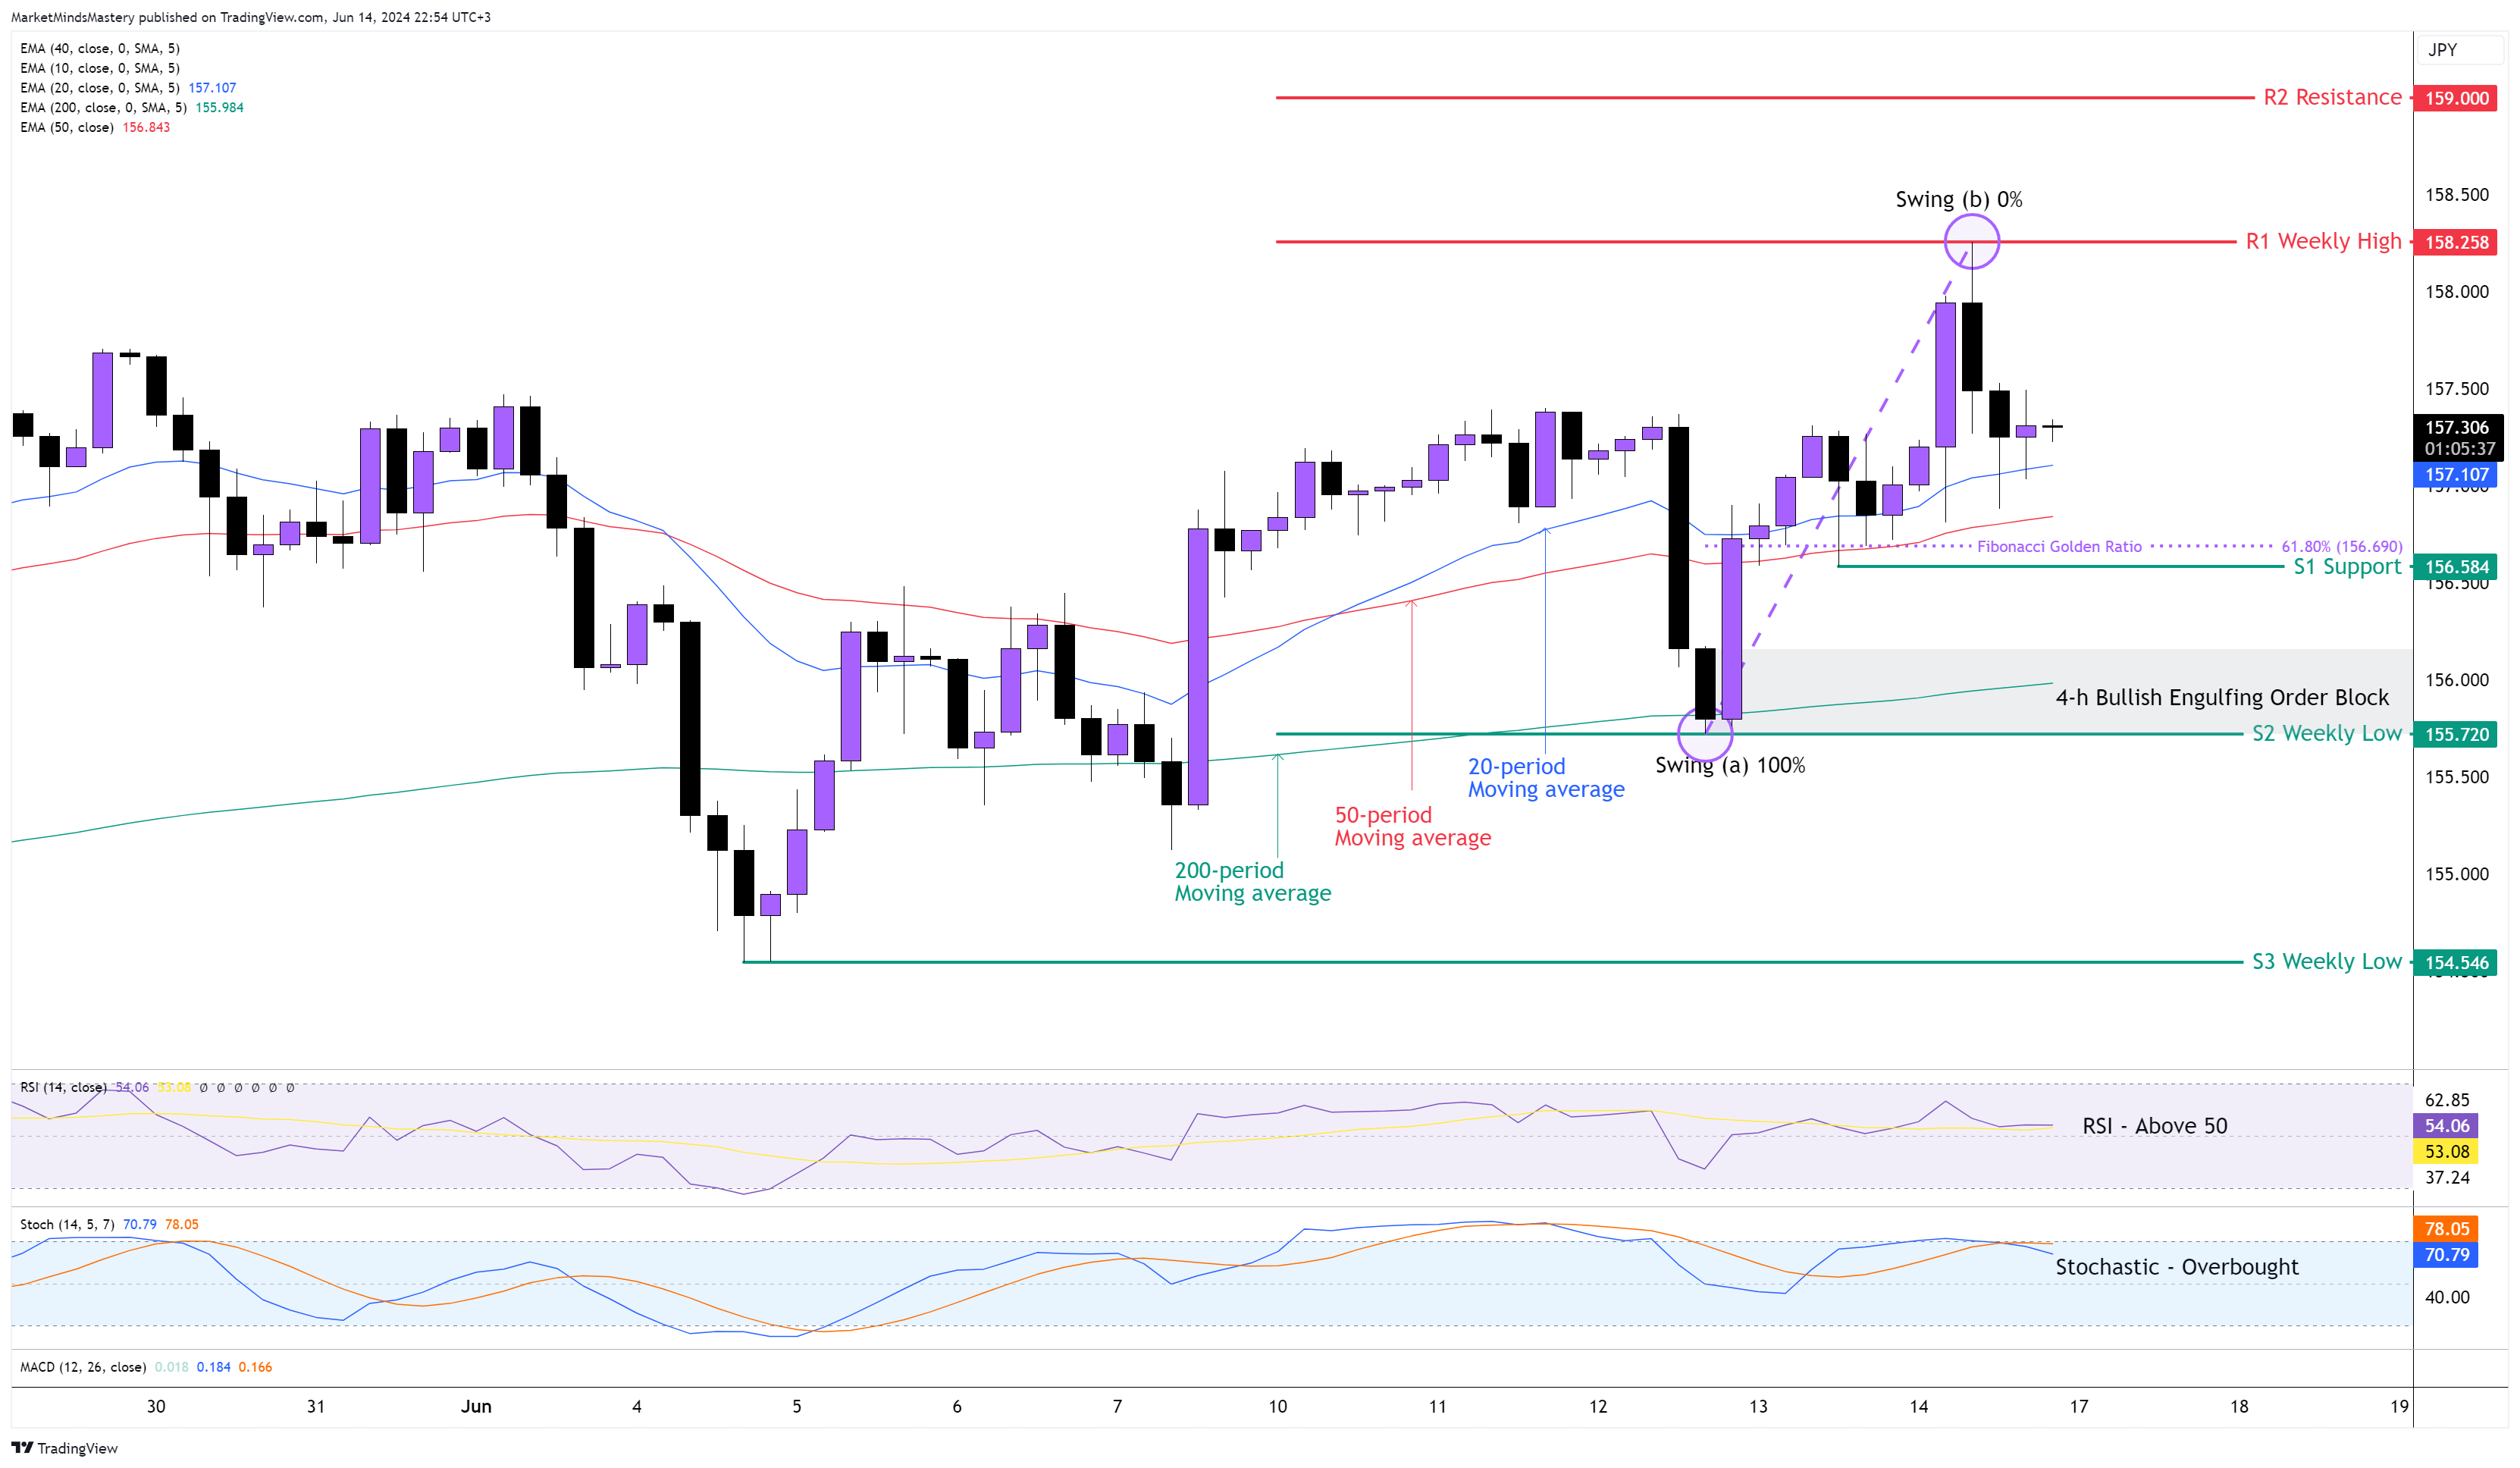
In currency trading, one of the highest probability trading set-ups is when the trader identifies a fundamentally strong currency and matches it with a fundamentally weak currency, and at the same time, the technical analysis indicates an uptrend. It is exactly what is the case with the USDJPY.
Last week, both countries reported interest rates, with the traders and investors being more optimistic about the 5.5% interest rates in the US rather than the 0% interest rates in Japan. The USDJPY has been in a major uptrend since the beginning of this year, as per the weekly chart.
On the 4H chart, the 20-period moving average is above the 50-period, and the 50-period is above the 200-period. The RSI is above 50, which is also a bullish indication, and the Stochastic Oscillator is at 70. That shows a bullish market. If the price continues moving upwards, the first resistance area, R1, will be the previous week’s high, around 158.25. If the price penetrates the R1 and moves higher, the next resistance area, R2, is approximately the 159 level.
On the other hand, if the price is rejected and moves downwards, the first support area, S1, is around 156.58. A further decline is found in the next support, S2, at approximately 155.72. In this area, a Bullish Engulfing Order Block developed last Wednesday and is clustered with the 200-period moving average.
USD CHF 4H
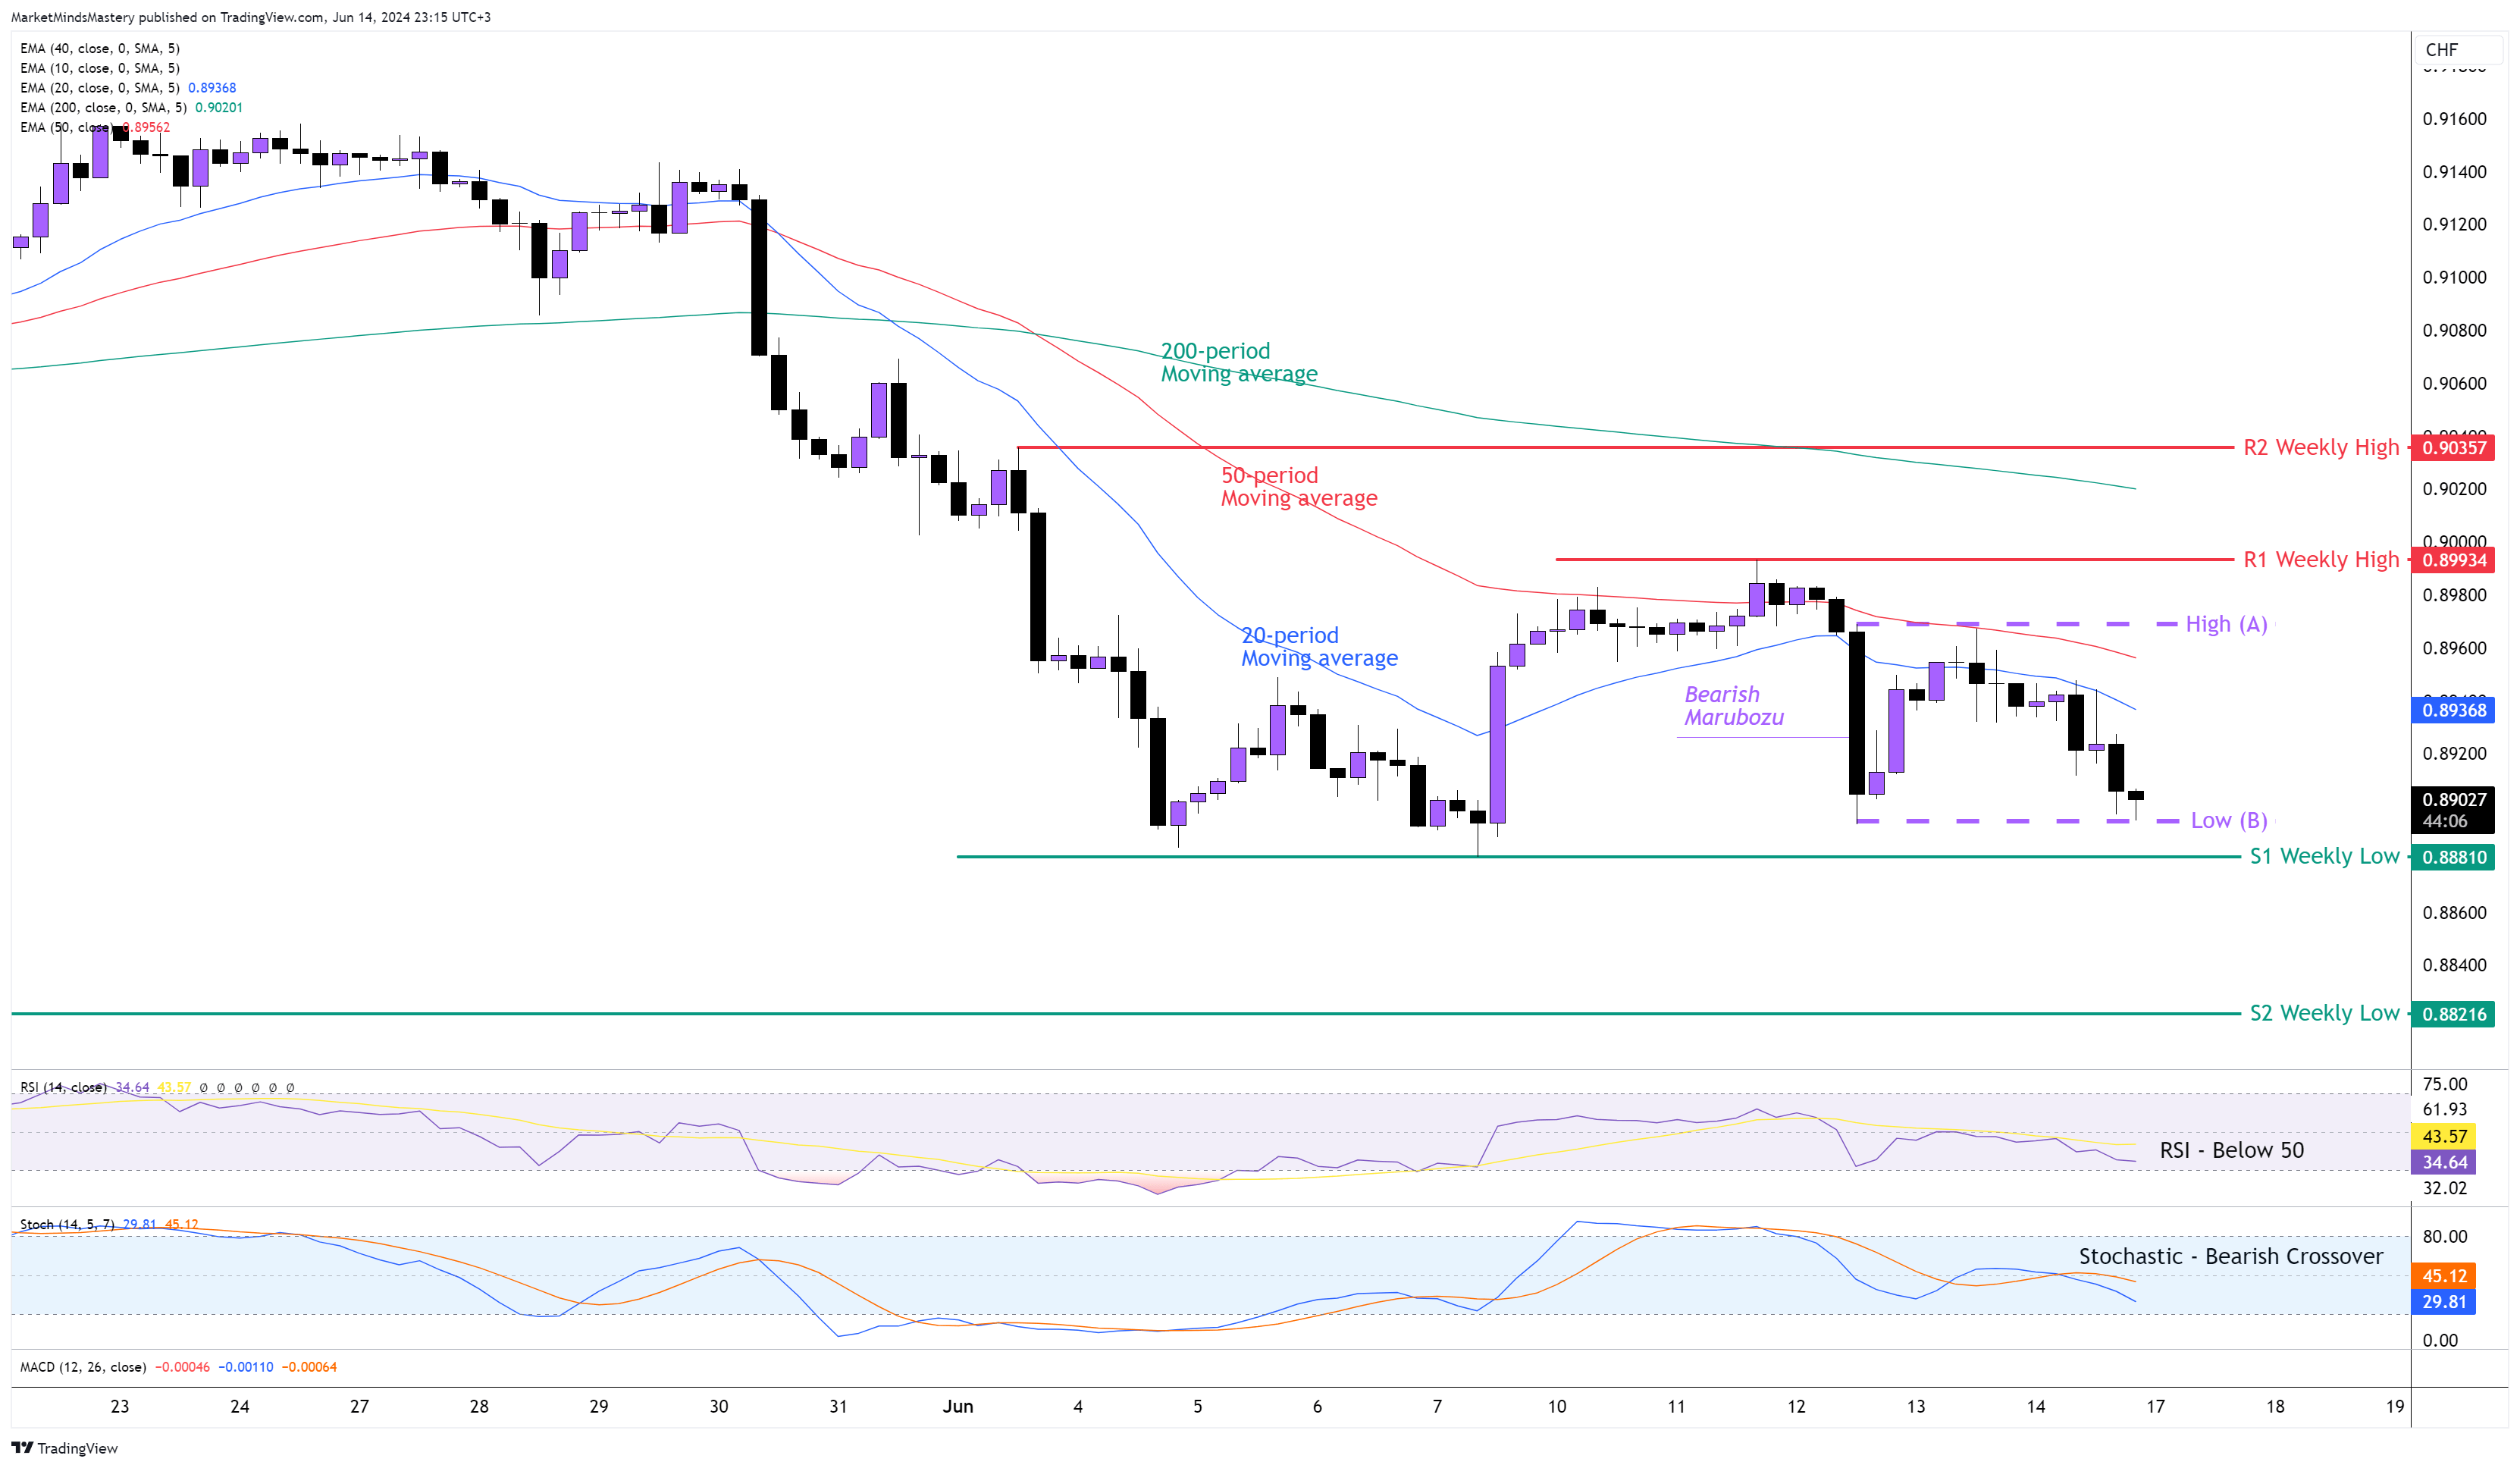
Despite the strength of the USD in the currency market, the Swissy was equally strong, and the price kept trading under the 50-period moving average last week. The price was also tested successfully in the Bullish Engulfing Order Block (which we marked on the previous week’s market outlook) and bounced off immediately.
On the weekly chart, the price remains as an inside candle, which explains the market structure we see on the 4H chart. Since last Wednesday, the price has been trading within the Bearish Marubozu candle’s High (A) and Low (B) boundaries.
The 20-period moving average is below the 50-period, and the 50-period moving average is below the 200-period moving average. The RSI Oscillator is below 50, which has bearish implications. The Stochastic Oscillator also has bearish implications because the %K Line is crossed below the %D Line.
Starting Monday, if the price breaks below the Low at (B), the first support will be the S1, which is the previous week’s low at around 0.8810. If the price penetrates the S1 and declines further, the next support, S2, will be 0.88216, which is an older weekly low. If the price finds support and moves upwards, the first resistance area, S1, will be the previous week’s high, around 0.9000. A further upward move finds the next resistance area, R2, approximately at 0.9035, marked as the R2 Weekly high on the chart.
GBP JPY 4H
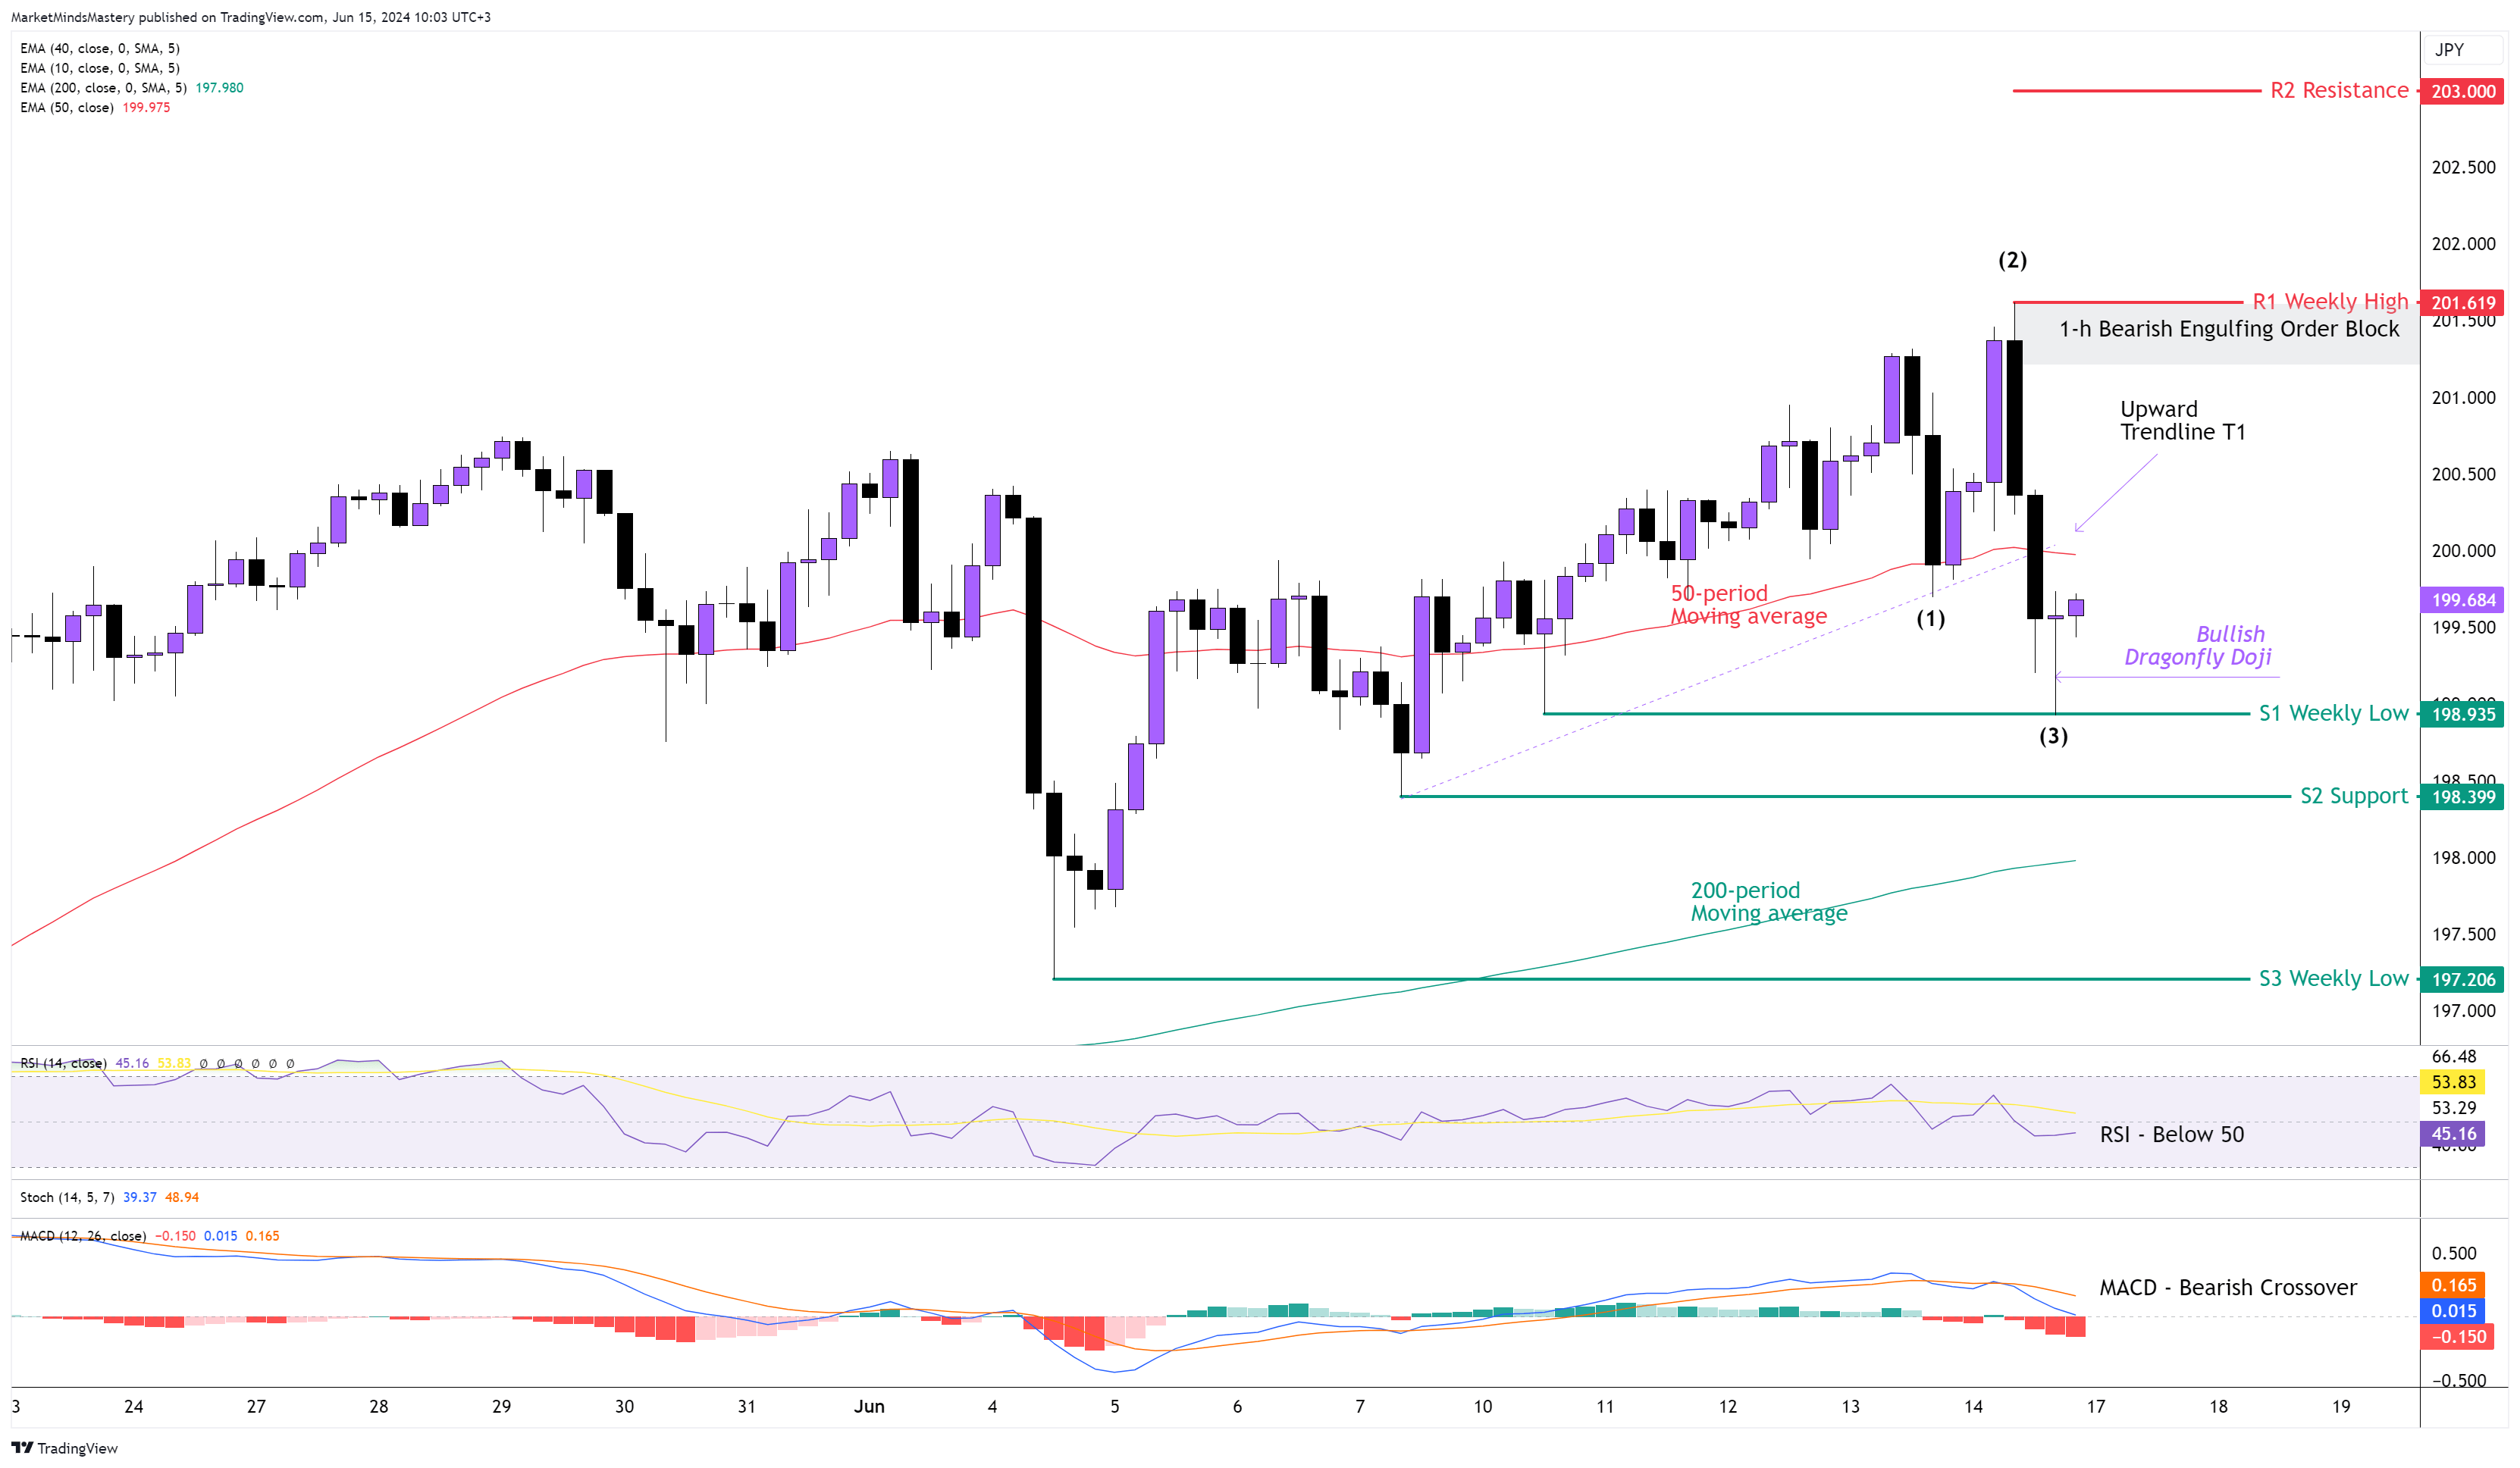
The primary uptrend, as per the weekly chart, continues, and the price of the GBPJPY still trades around the 200 area. The weekly price action ended as a Shooting Star reversal, which simply means that the price at some point during last week was traded above previous weekly candles, and by the end of the previous week, the price was rejected and closed much lower.
Based on the swing analysis on the 4H chart, the price created a low at point (3), which is lower than the low at point (1). Prior to this, an upward trendline T1 broke. This is the first evidence of a trend reversal. However, a change in the market trend will be confirmed only if the low at point (3) penetrates.
Currently, the 50-period moving average is above the 200-period, indicating bullishness. The RSI Oscillator is below 50, indicating the opposite, which is a bearish market. The MACD created a bearish crossover, which is also bearish.
If the price declines and moves lower, the first support area, S1, will be around 198.93. Further downwards, move to find the next support, S2, around 198.399 and S3, around 197.20, which is a weekly low. On the other hand, if the price moves upwards, the first resistance area, R1, is approximately 201.61, which was the previous week’s high. A further upward move is to find the next resistance R2 around 203.
GOLD 4H
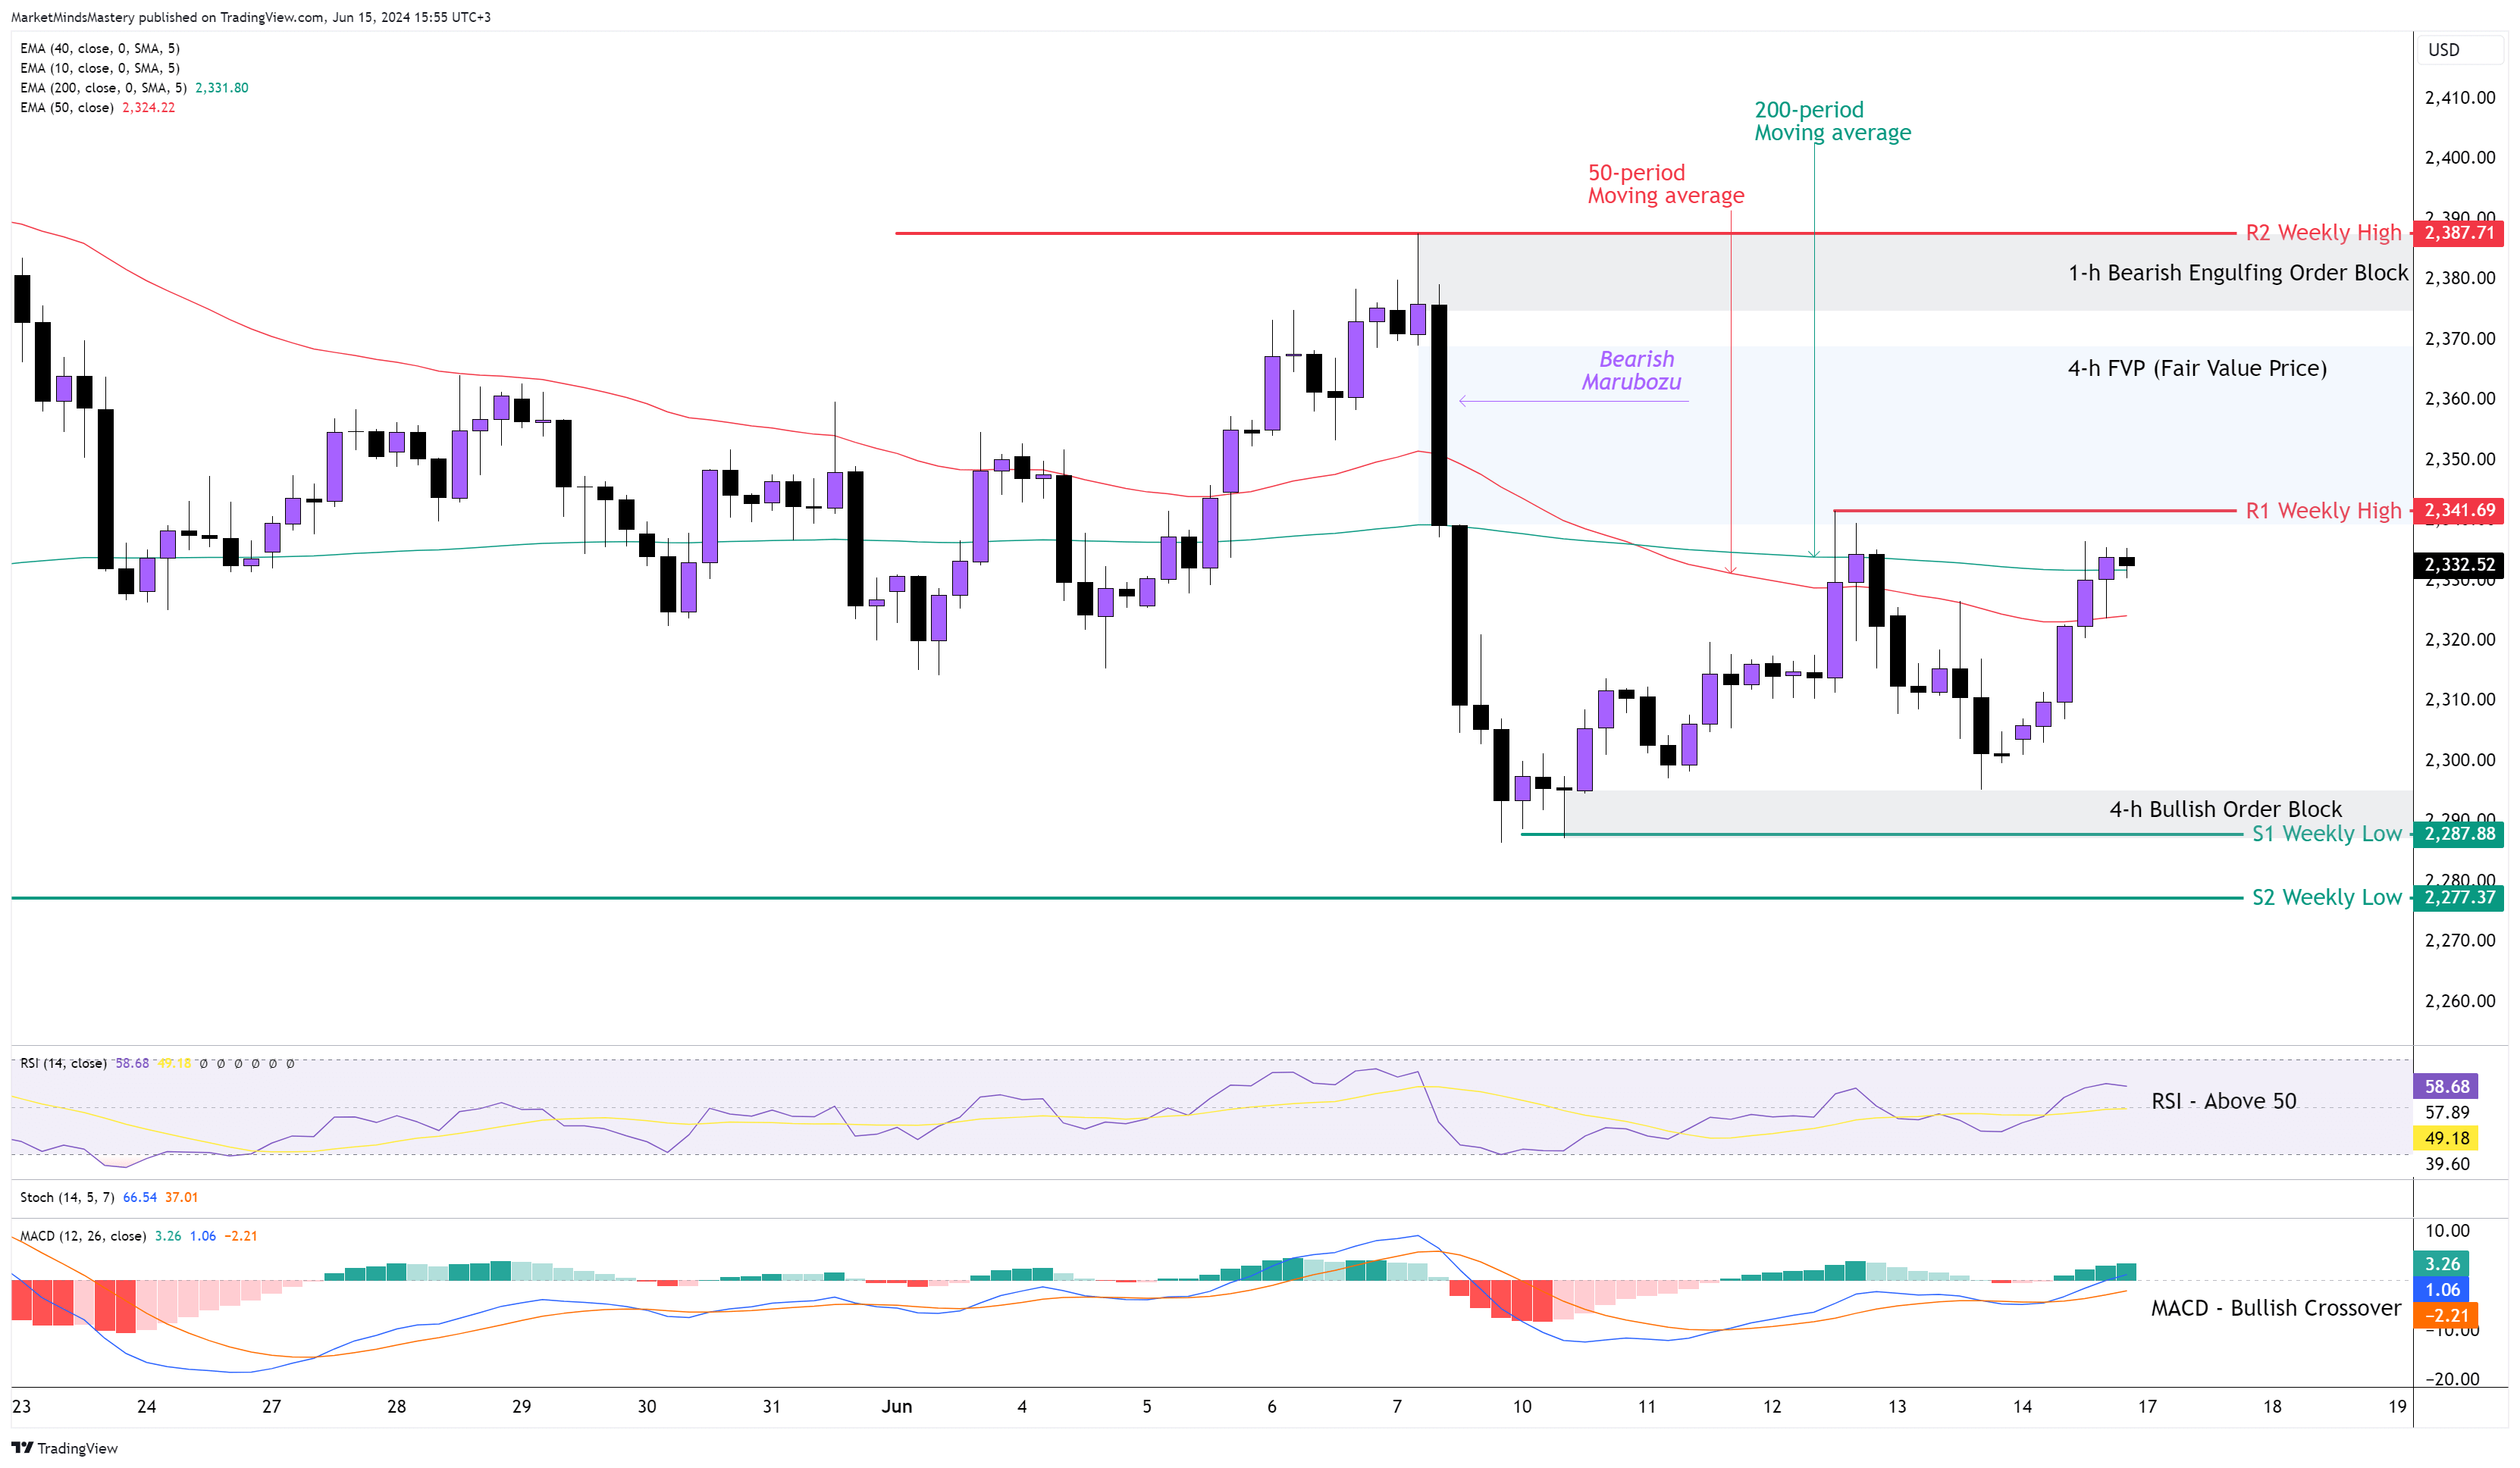
The Bearish Engulfing price action explained on the previous week’s market outlook on the weekly chart didn't follow through last week, and the price not only didn't make a lower low but also remained within the Bearish Engulfing boundaries. On the 4H chart, the price entered into the FVP area we pointed to the chart last week and rejected after the FOMC event last Wednesday.
As the 50-period is below the 200-period moving average, it has a bearish implication. As we explained, the moving averages converge last with the price, as they capture the trend after the swing analysis shows it. The RSI oscillator is above 50, and this has bullish implications. The MACD showed a bullish crossover under zero, and the indicator’s histogram moved above zero.
If the price moves upwards, the first resistance area, R1, is around $2341, which is the previous week’s high. If the price penetrates the R1 and moves higher, the next area of resistance, R2, is around $2387. Below the R2 resistance, there is an Order Block area, and the 1H chart’s Order Block is highlighted. In case the price finds resistance and declines, the first area of support, S1, is approximately $2287. A further downward move finds the next support area, S2, around $2277.
US OIL 4H
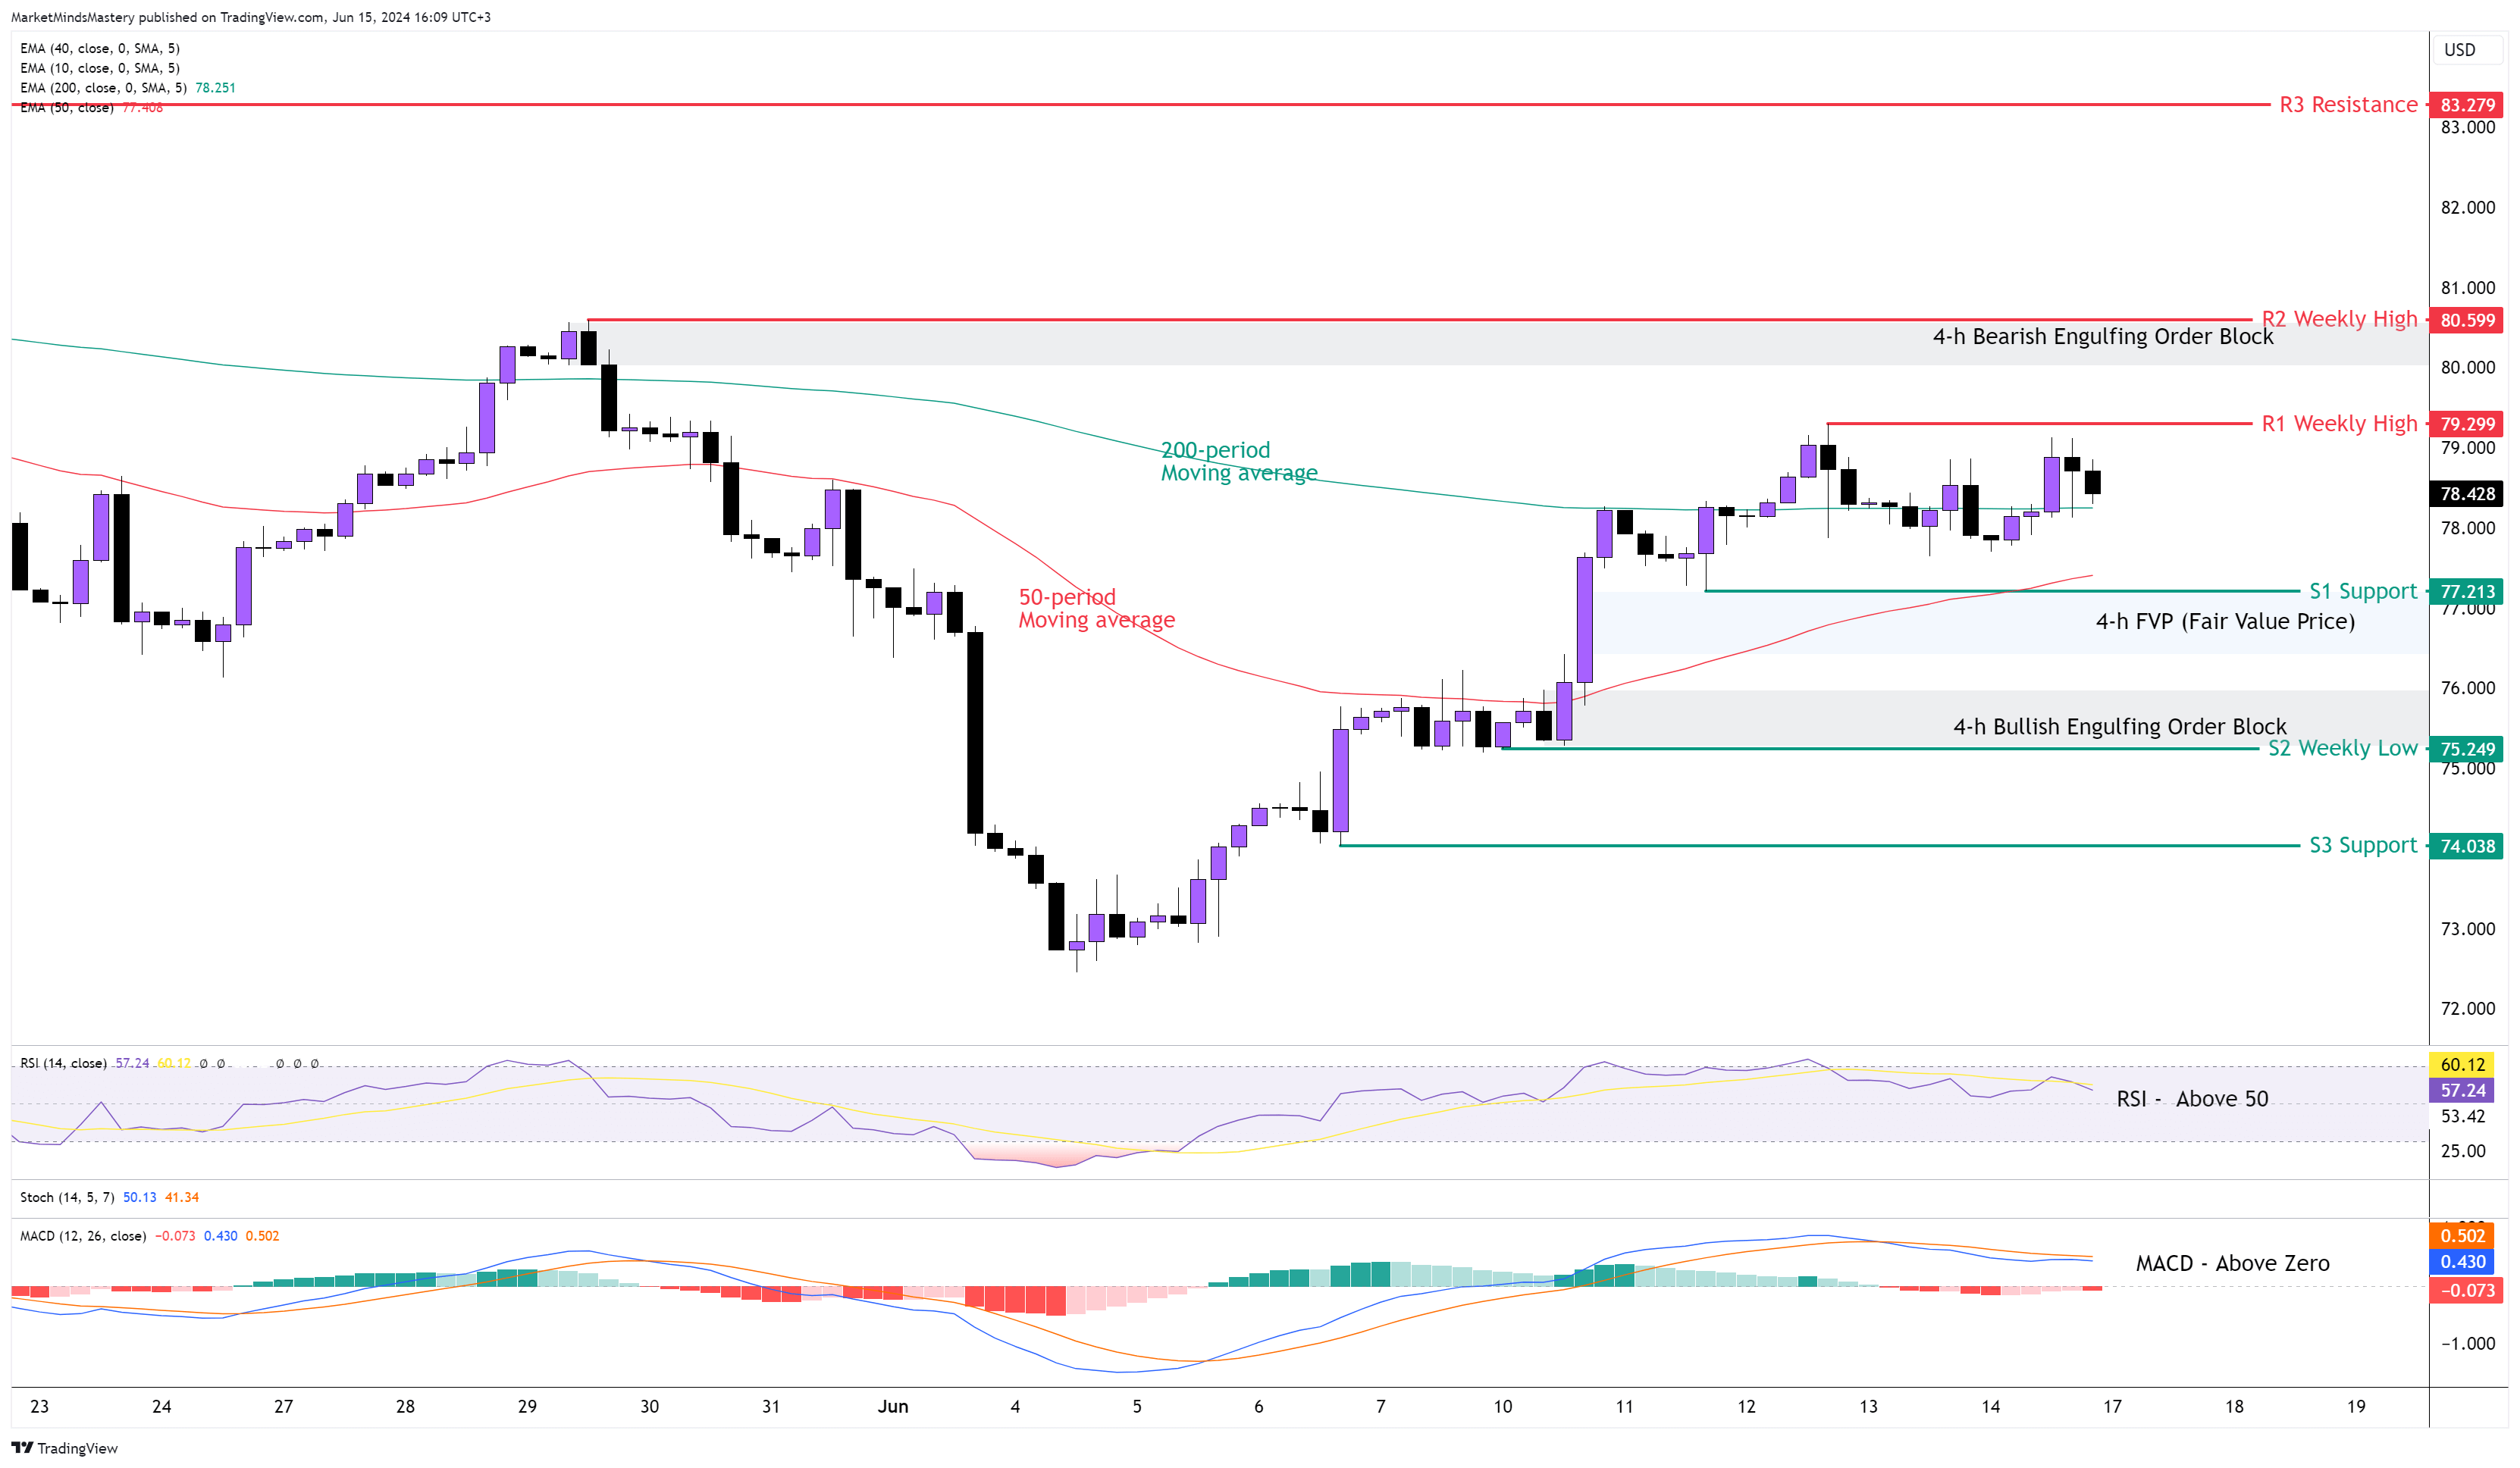
Despite the fact that the price on the weekly chart was at significant levels of resistance that cluster with the weekly moving averages, and the 4H chart was in a strong downtrend, the price last week didn't continue the downtrend. Instead, it moved upwards, creating a series of higher highs and higher lows on the 4H chart. This is as per the swing analysis.
The 50-period is below the 200-period moving average, indicating bearishness, but the price closed and now is trading above the 200-period moving average, which is bullish. The MACD is above zero, which suggests bullishness. The RSI Oscillator is above 50, which is another bullish indication.
Two weeks ago, the weekly price action was a bearish reversal candle and last week; the price didn't follow through, meaning a more bullish price may be seen.
Starting Monday, if the price moves upwards, the first resistance area, R1, is around $79.29, which is the previous week’s high. If the price penetrates the R1 and moves higher, the next resistance area, R2, is another weekly high of approximately $80.60. Oppositely, if the price moves downwards, the first support area, S1, is around $77,21. At this level, the price left an FVG last week. If the price declines further, the next support area, S2, is at $75.25, with a Bullish engulfing Order Block being formed.
BTC USD 4H
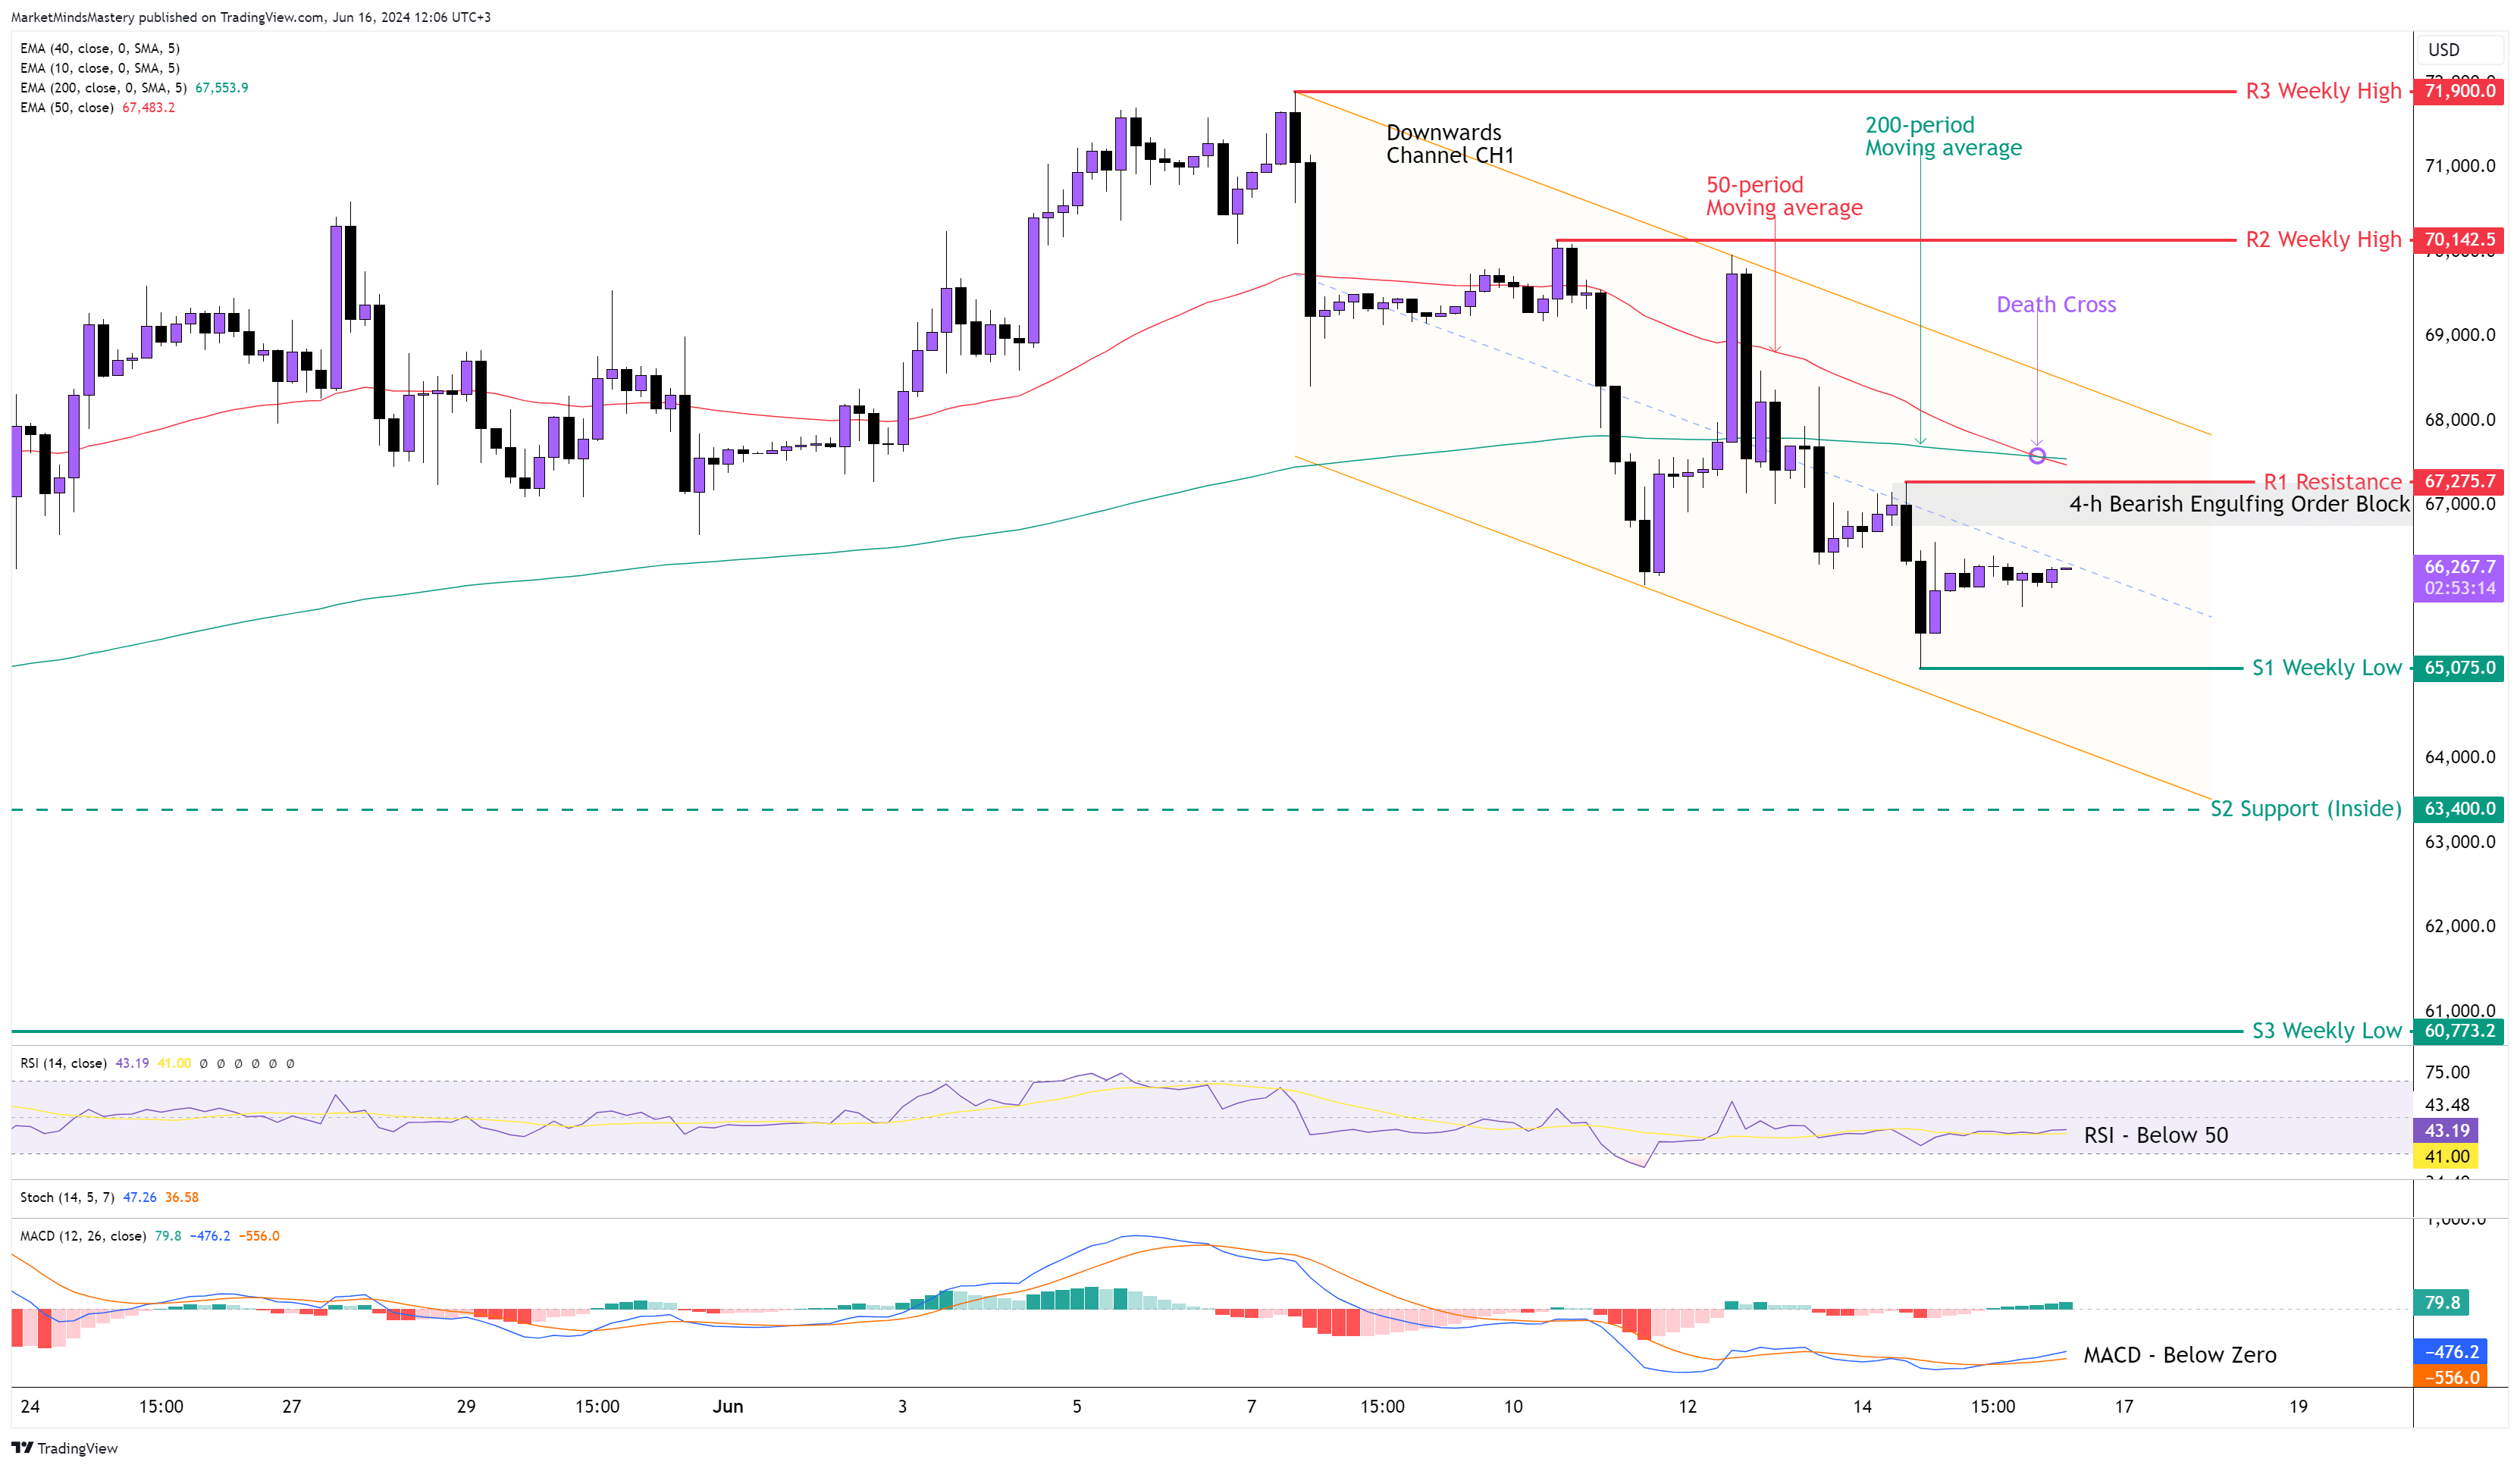
The most noticeable move on Bitcoin last week occurred during the Interest Rates announcement and the FOMC in the US. The price falsely broke (false breakout) the support level we market on the chart on to the previous market outlook, which acted as resistance after it failed, the 50-period and the 200-period moving averages. The weekly candle closed as a bearish candle. On the 4H chart, the price started a downtrend with a series of lower highs and lower lows. Currently, the price is trading within a Valid Downward Channel, CH1. The 50-period moving average crossed below the 200-period, shown as the “death cross” on the chart above. The RSI is below 50, which is bearish. The MACD created a Bullish Crossover under zero, indicating a price retracement phase may start. Therefore, if the price moves upwards, the first resistance area, R1, is around $67275. From this price level, a Bearish Engulfing Order Block was created last week. If the price penetrates the R1 and increases, the next static resistance area will be the previous week’s high, around $70142. Understand that the price can also find resistance at the upper line of the Downwards Channel CH1.
On the other hand, if the price is rejected and moves downwards in an attempt to continue the 4H downtrend, the first support area, S1, will be the previous week’s low, around $65075.
A break below the S1 and move further downwards finds the next support area, S2, around $63400. This is an inside support from an old swing high that hasn’t been tested yet.
SP 500 4H
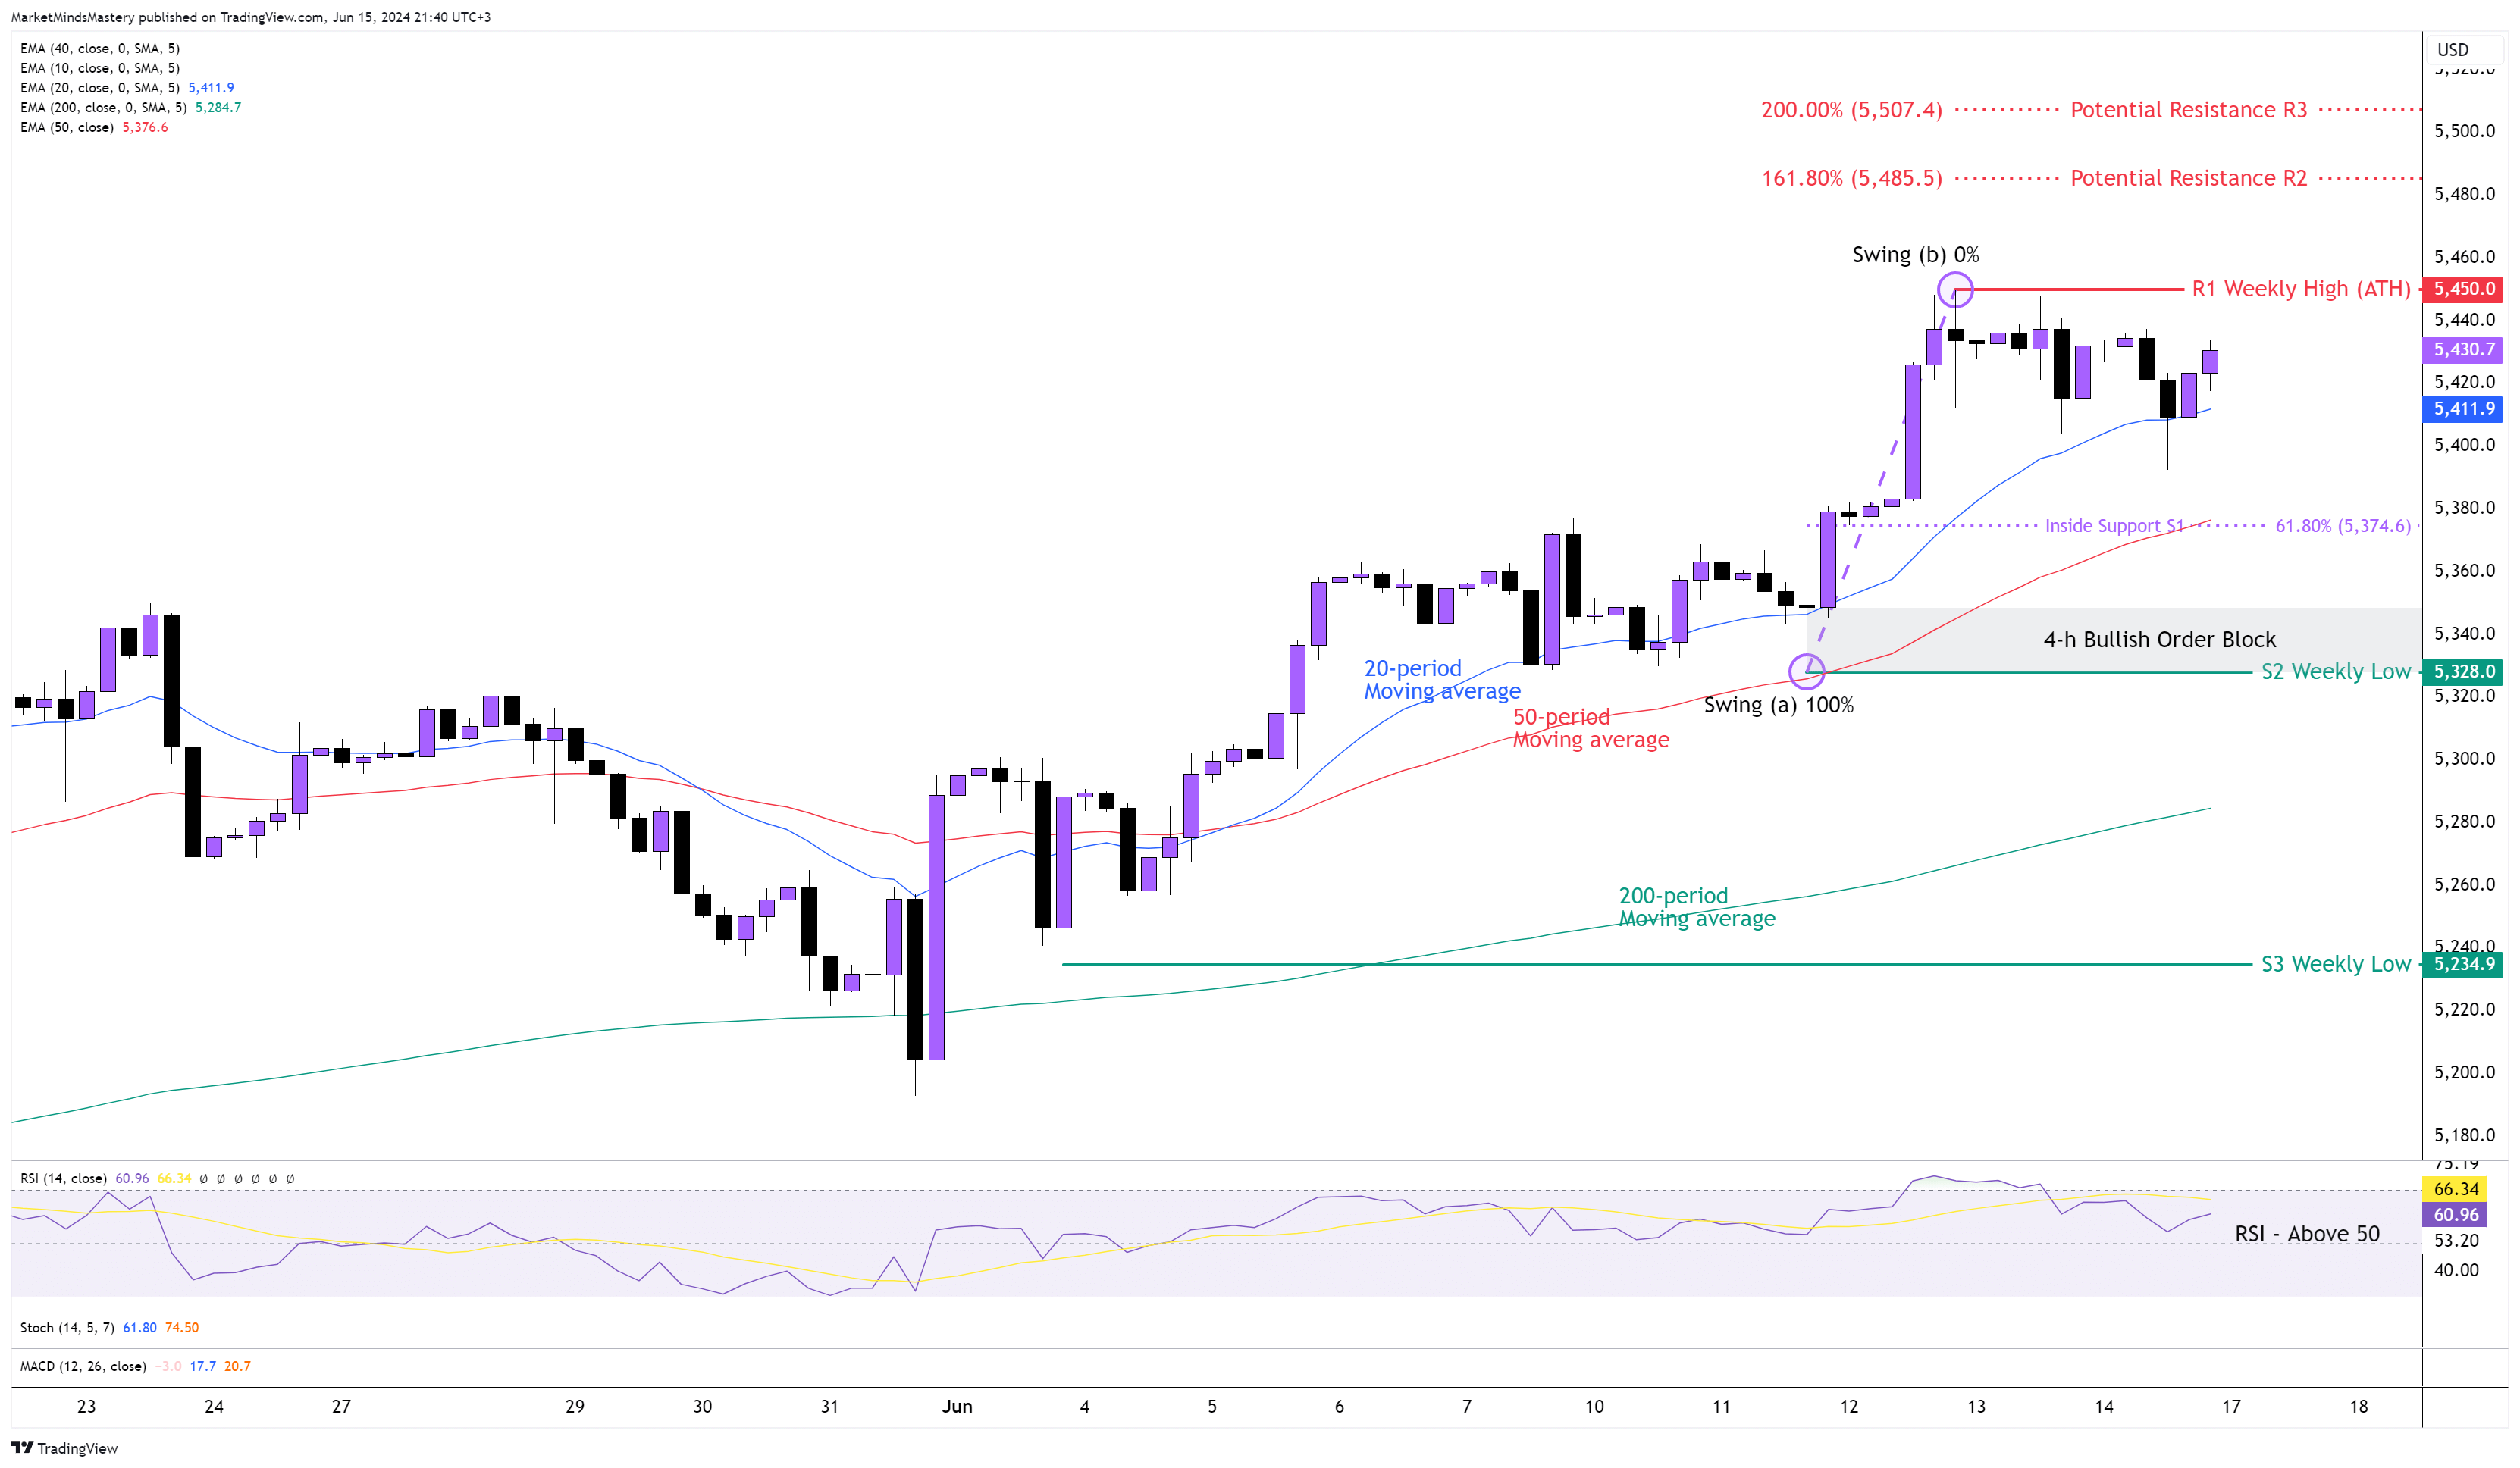
Following the previous week’s market outlook, the price on the weekly chart created a new All-Time High (ATH), with the price remaining above the 20-period moving average on the 4H chart. As per the swing analysis, the higher highs and higher lows are accompanied by convergences on the RSI Oscillator, which indicates a consistent uptrend. The 50-period is above the 200-period moving average, and this is bullish. Currently, the RSI Oscillator is above its middle line, and this has bullish implications. Last Tuesday, the price bounced off the 50-period moving average and moved upwards, creating a Bullish Order Block on the 4H chart.
Starting Monday, if the price moves upwards, the first resistance area, R1, will be the ATH around $5450. If the price penetrates the R1 and increases, the next resistance areas will be forecasted with the Fibonacci extension, with the 161.8% being the R2 resistance around $5485 and the 200% being the R3 around $5507. Conversely, if the price moves downwards, the first support area, S1, will be the inside support around $5374, which is at the same level as the Fibonacci retracement from swing (a) to swing (b). If the price doesn’t bounce off, moves upwards, and keeps declining, the next support area, S2, will be the previous week’s low, around $5328. If the price breaks below the S2, the uptrend will come to an end.
US 30 4H
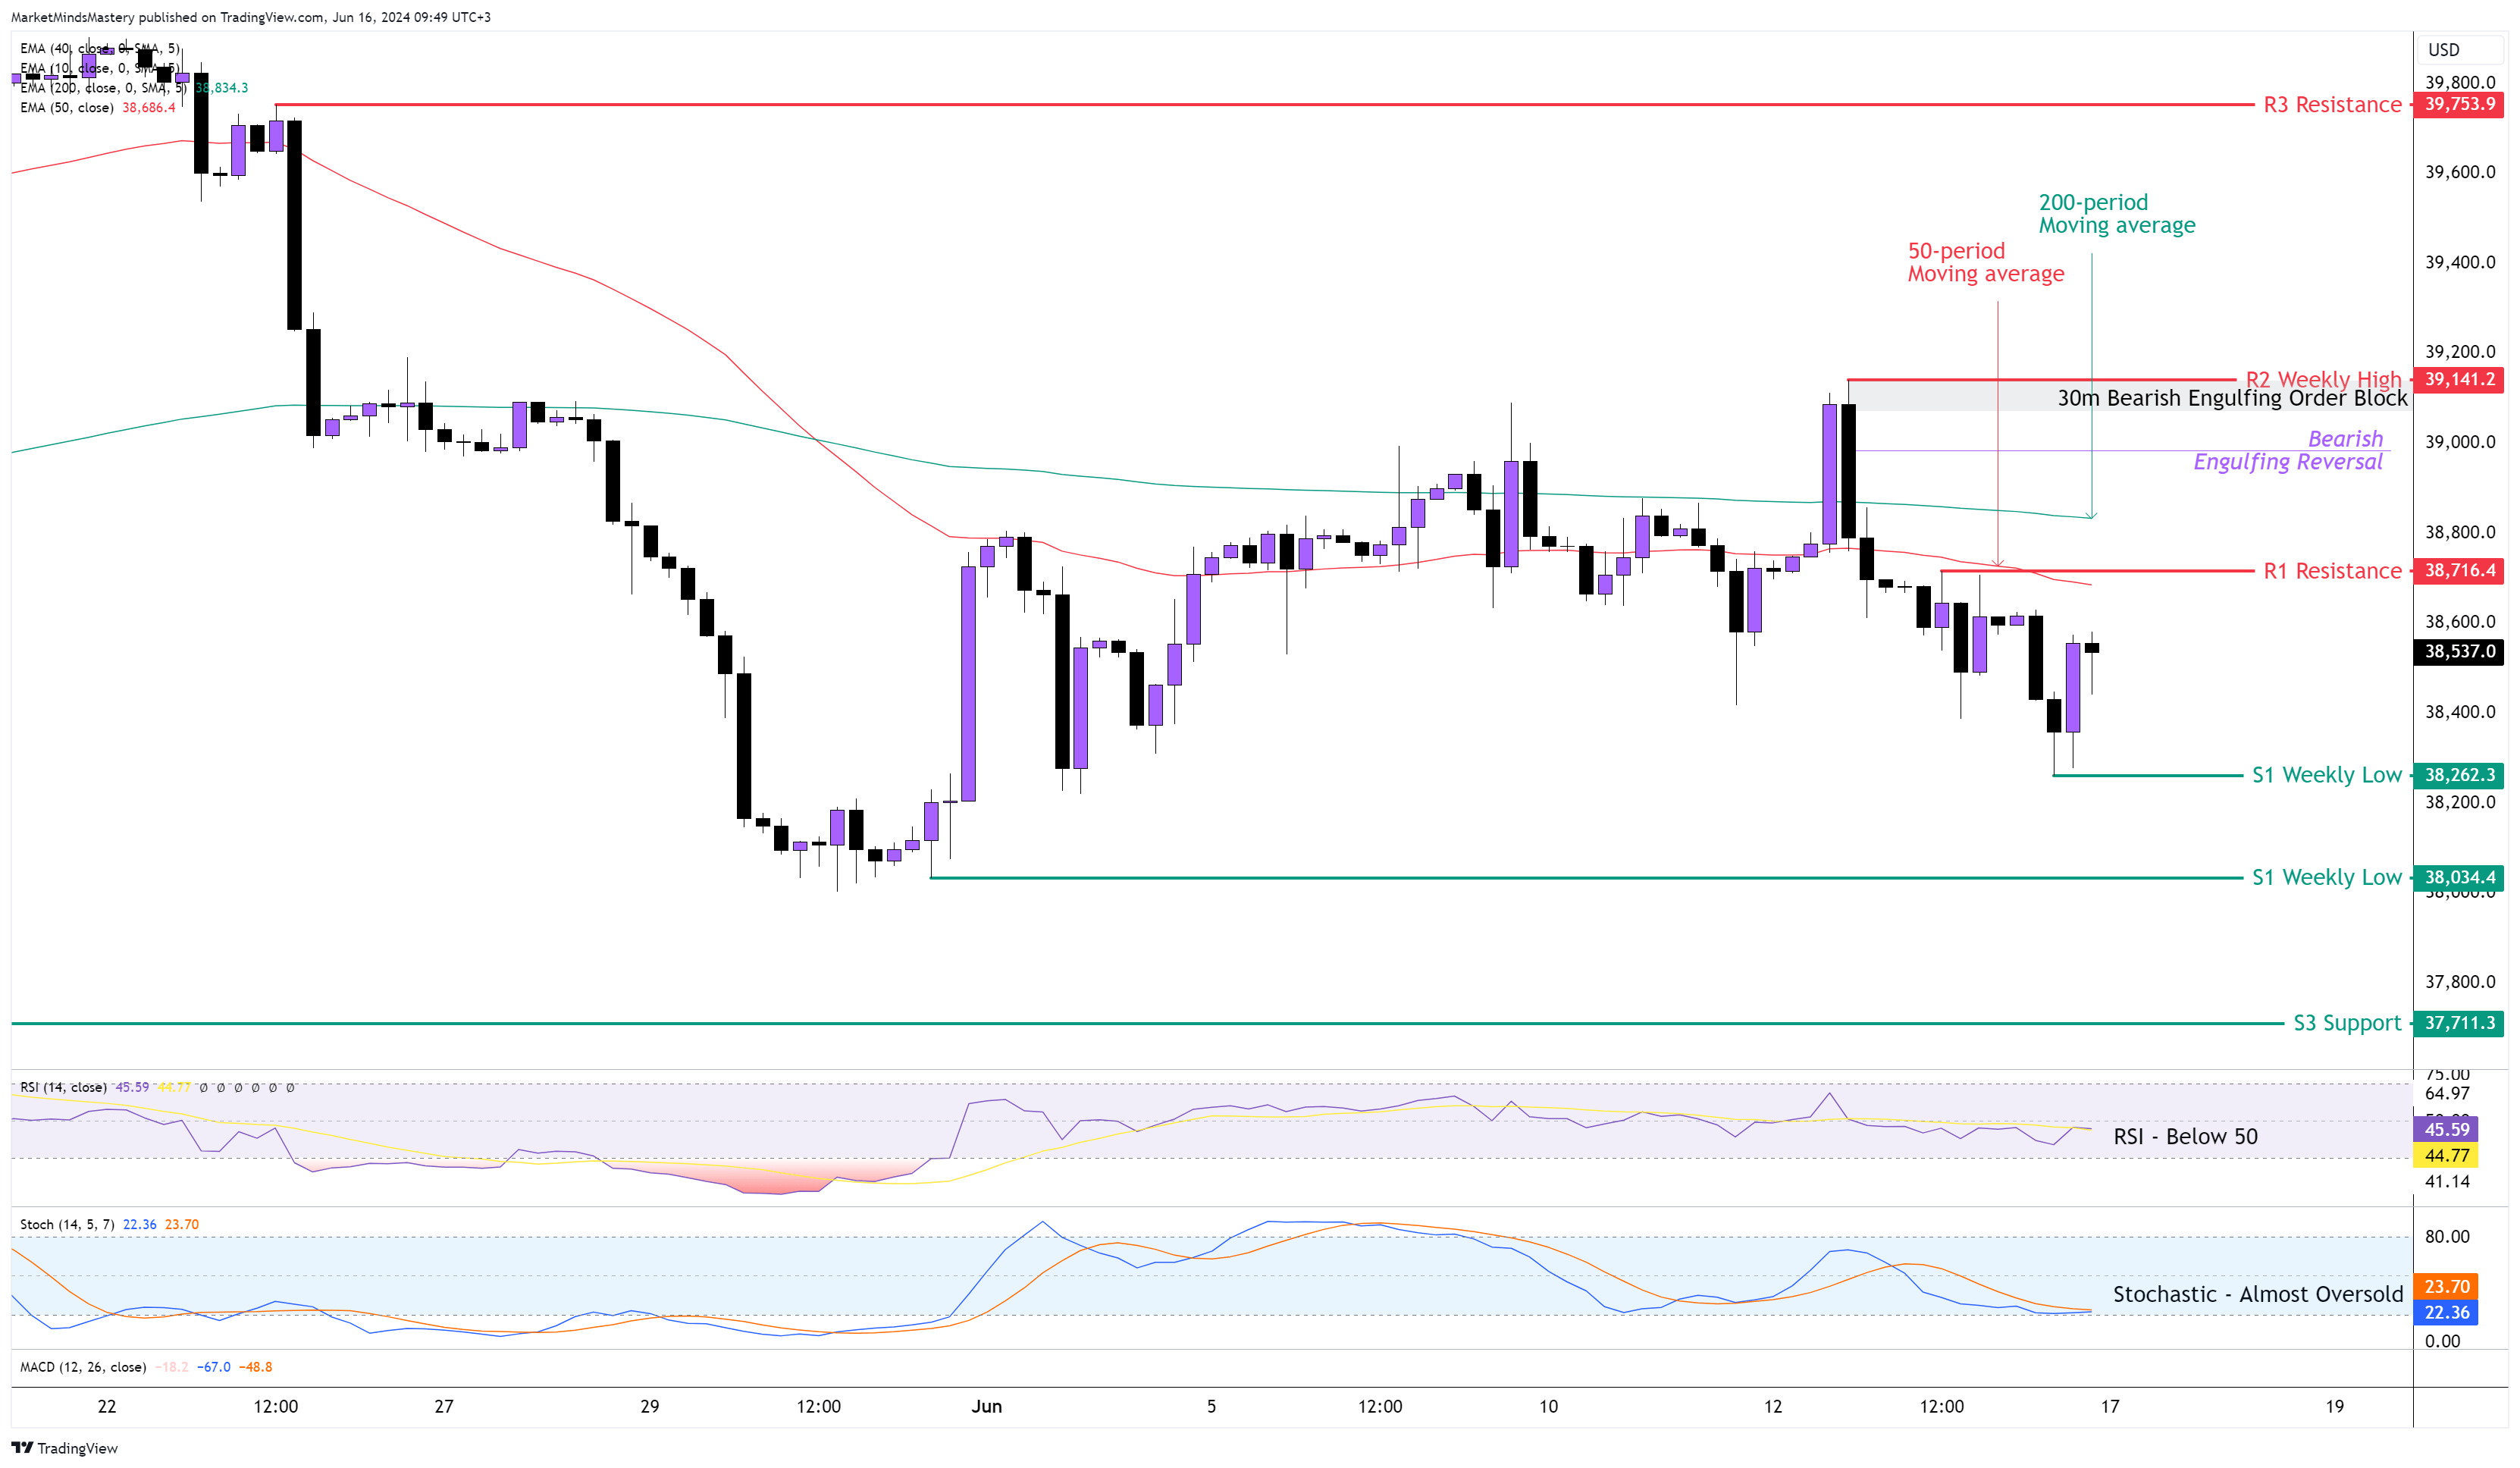
Following the previous week’s price action, the price remained within the boundaries of the weekly price, and it is what we call an “inside candle”. Therefore, the price didn’t make any directional move. On the 4H chart, the price is still under the moving averages, with the 50-period being below the 200-period, and this has bearish implications. The RSI Oscillator is under 50, which is bearish. Similarly, the Stochastic Oscillator is almost at its oversold area, which is also bearish. The 4H chart’s swings are not well established. The price tries to make a lower low, but the bearish candles (black) are neither long nor close below the previous swing low. Therefore, if the price declines and moves downwards, the first support area, S1, will be the previous week’s low, around $38262. If the price penetrates the S1 and closes below it, the next support area, S2, is another weekly low, approximately $38034. A further downward move, find the next support, S3, around $37711.
On the other hand, if the price bounces off and moves upwards, the first resistance area, R1, is approximately $38716, and it is close to the 50-period moving average. If the price penetrates R1 and moves upwards, the next resistance area, R2, will be the previous week’s high, at around $39141. On the chart, we marked the refined 30-minute Bearish Engulfidn Order Block.
GER 30, 4H
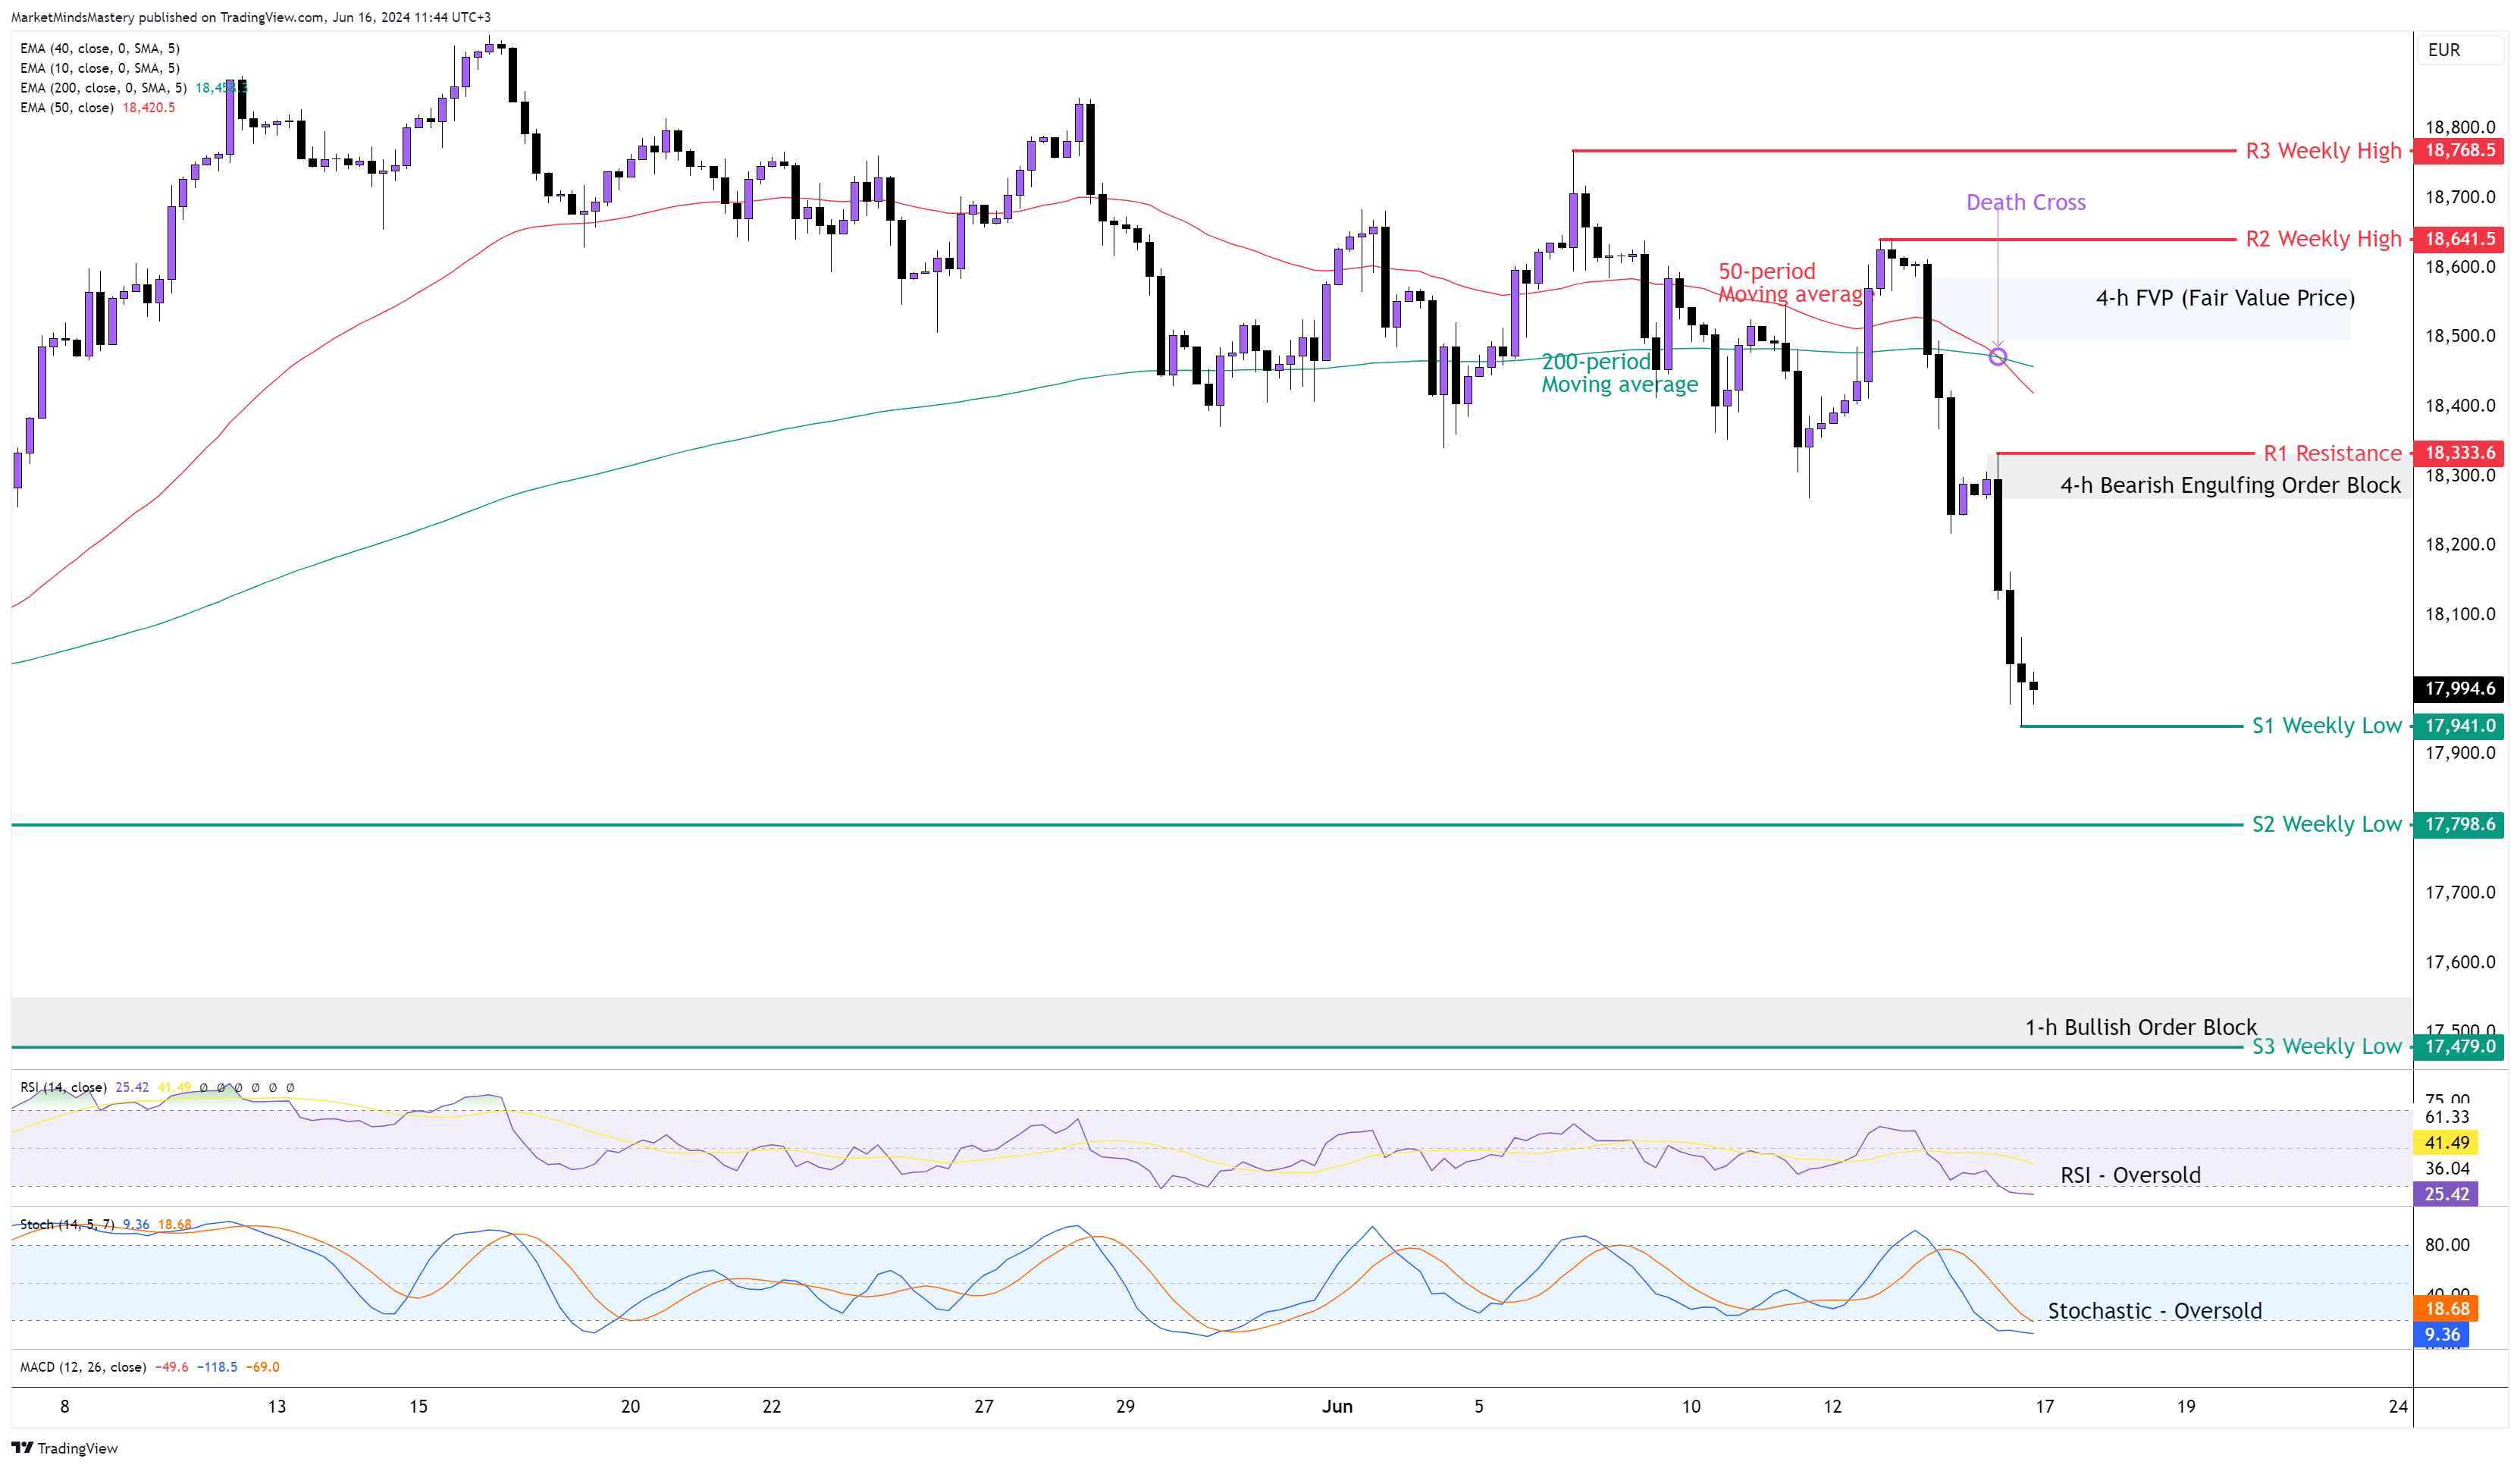
Following the retracement that started on the weekly chart a few weeks ago, the price last week declined and moved downwards, creating a series of lower highs and lower lows on the 4H chart. On the weekly chart, the price closed as a long Bearish candle, indicating an imbalance between buying orders and sell orders entered into the market. On the 4H chart, the 50-period crossed below the 200-period moving average, known as “the Death Cross”, which has bearish implications. Both oscillators, the RSI and the Stochastic, are in an oversold condition, and this is bearish. On the chart, we point to two Order Blocks: one Bearish Engulfing Order Block directly from the 4H chart and one Bullish Order Block that has been refined on the 1H chart. If the price continues to move downwards, the first area of support, S1, will be the previous week’s low, around 17941, which is a very close distance from the current price. If the S1 penetrates and the price declines further, the next support areas, S2 and S3, are both weekly lows at 17798 and 17479, respectively.
Oppositely, if the price finds support and bounces off, it can move upwards until the first resistance area, R1, approximately at 18333. In case the price penetrates the R1 and keeps increasing, the next resistance area, R2, will be the previous week’s high around 18641. A penetration of this R2 swing high will lead to the end of the existing downtrend.
👉 Click here to check our Challenges
👉 Don’t miss our Free Live Webinars
👉Join us on Discord
Risk Disclosure:
The Trading Pit offers only demo accounts to all users within the Challenges and Signal Provider Agreements (Scaling Plan). All assets and trading activities are purely virtual. Please note that we do not offer CFD (Contract for Difference) challenges to residents of Canada and the United States. All content and information on this website is for informational purposes only and should not be interpreted as financial advice. Also, remember that results achieved in the past are no guarantee of future results. It is essential to understand the risks associated with trading. If you are unsure, always consult an independent financial advisor.