Last week, the FOMC and the NFP (Non-Farm Payrolls) in the US were the most significant events in the markets. Despite that, the NFP reported higher than the forecast, the market didn't follow through on the positive outcome, and the USD weakened. Market behaviours like these are great indicators for understanding what to expect in the near future. It is worth mentioning that the CPI in Switzerland dropped, but this didn't stop the USDCHF from creating a downtrend.
The Trade Balance in Japan will be the first event this week, and the forecast estimates a further drop in the number. Currently, it is at -661.5B, and it is expected to decrease to -1182.3 B. Fundamentally and technically, the Japanese Yen has been a weak currency for a while, allowing the rest of the currencies to create significant uptrends against the JPY. The last important event for Monday will be the Eurozone’s Investors Confidence Index, which will affect the Euro’s performance, and the forecast shows a decrease from 0.3% to 0%.
Tuesday is expected to be a short day in terms of significant news events. The only event will be Fed Chairman Powell's testimony. The testimony will be in two parts, and it will be finished tomorrow. The first part will include a reading text, and the second part will be a Q&A. After this event, we will have a better understanding of where the Feds are going along with the next vote about increasing or decreasing the country’s Interest Rates.
The CPI (Consumer Price Index) in China will be the first significant event on Wednesday. Currently, the CPI is 0.3%, and the forecast shows an increase of 0.4%. This can be a bullish sign for the Chinese Yuan and can bring a lot of volatility to the relevant markets at that time. Things will get more interesting 30 minutes after this when the RBNZ (Reserve Bank of New Zealand) will report their Interest Rates. Currently, the rates are 5.5%, and they are expected to remain the same. Only as a general market observation, as few major central banks dropped their Interest Rates, we expected some other countries in the next few months to follow. Anyhow, Kiwi will be the one that will be affected the most during the event, and the volatility during the Sydney Trading Session is expected to be noticeable. The RBNZ’s Monetary Policy Statement is expected to be announced at the same time.
Last will be the Weekly Crude Stock report in the US, which currently is -12.157M.
The GDP (Gross Domestic Product) in the UK will be the first event on Thursday. Based on the forecast, the GDP is expected to increase from 0% to 0.2%. In this case, Sterling is expected to rise only if the market follows through on a positive report. This event can be a catalyst for some market trends as the EURGBP currency pair is in a downtrend, and a positive GDP in the UK can add more significance to the trend continuation, at least until 0.84000.
In the US, the CPI (Consumer Price Index) will be the next important event, and based on the forecast, a lower number than the previous report is expected. Last month, the CPI report was 3.3%, and this time, it is likely to decrease to 3.1%. If the actual number will reported equal or lower than the forecast, the USD is expected to drop significantly. The volatility is expected to reach extreme levels during the report, and any intraday positions, whether they are on the EURUSD or the USDJPY and the rest of the major currency pairs, should be treated carefully. In this case, if the US dollar's weakness continues this week, the uptrend is expected to continue in the GBPUSD, as the combined forecast of these two events will favour the currency pair’s uptrend. Also, a weak USD based on the CPi can lead to upward moves in the EURUSD and AUDUSD.
Only a few important events occurred on this Friday, which will be the last trading day of the week, all of which directly will affect the US Dollar. Hence, they will be reported during the New York Trading Session. But before this, a less significant but still important event will be the Retail Sales in Germany, and as expected, is likely to increase from -0.2% to 0%. This will directly affect the Euro and the GER30, and any continued weakness of the USD can keep lifting the EURUSD currency pair upwards.
Next, in the US, the PPI (Producer Price Index) is expected to increase from -0.2% to 0.1%. Whether the market follows through will determine the US Dollar's performance accordingly. The last event for this trading week will be the US UMich Consumer Confidence Index, and as per the forecast, a drop from 68.2 to 67 is expected, which can negatively impact the US Dollar in case that the market follows through.
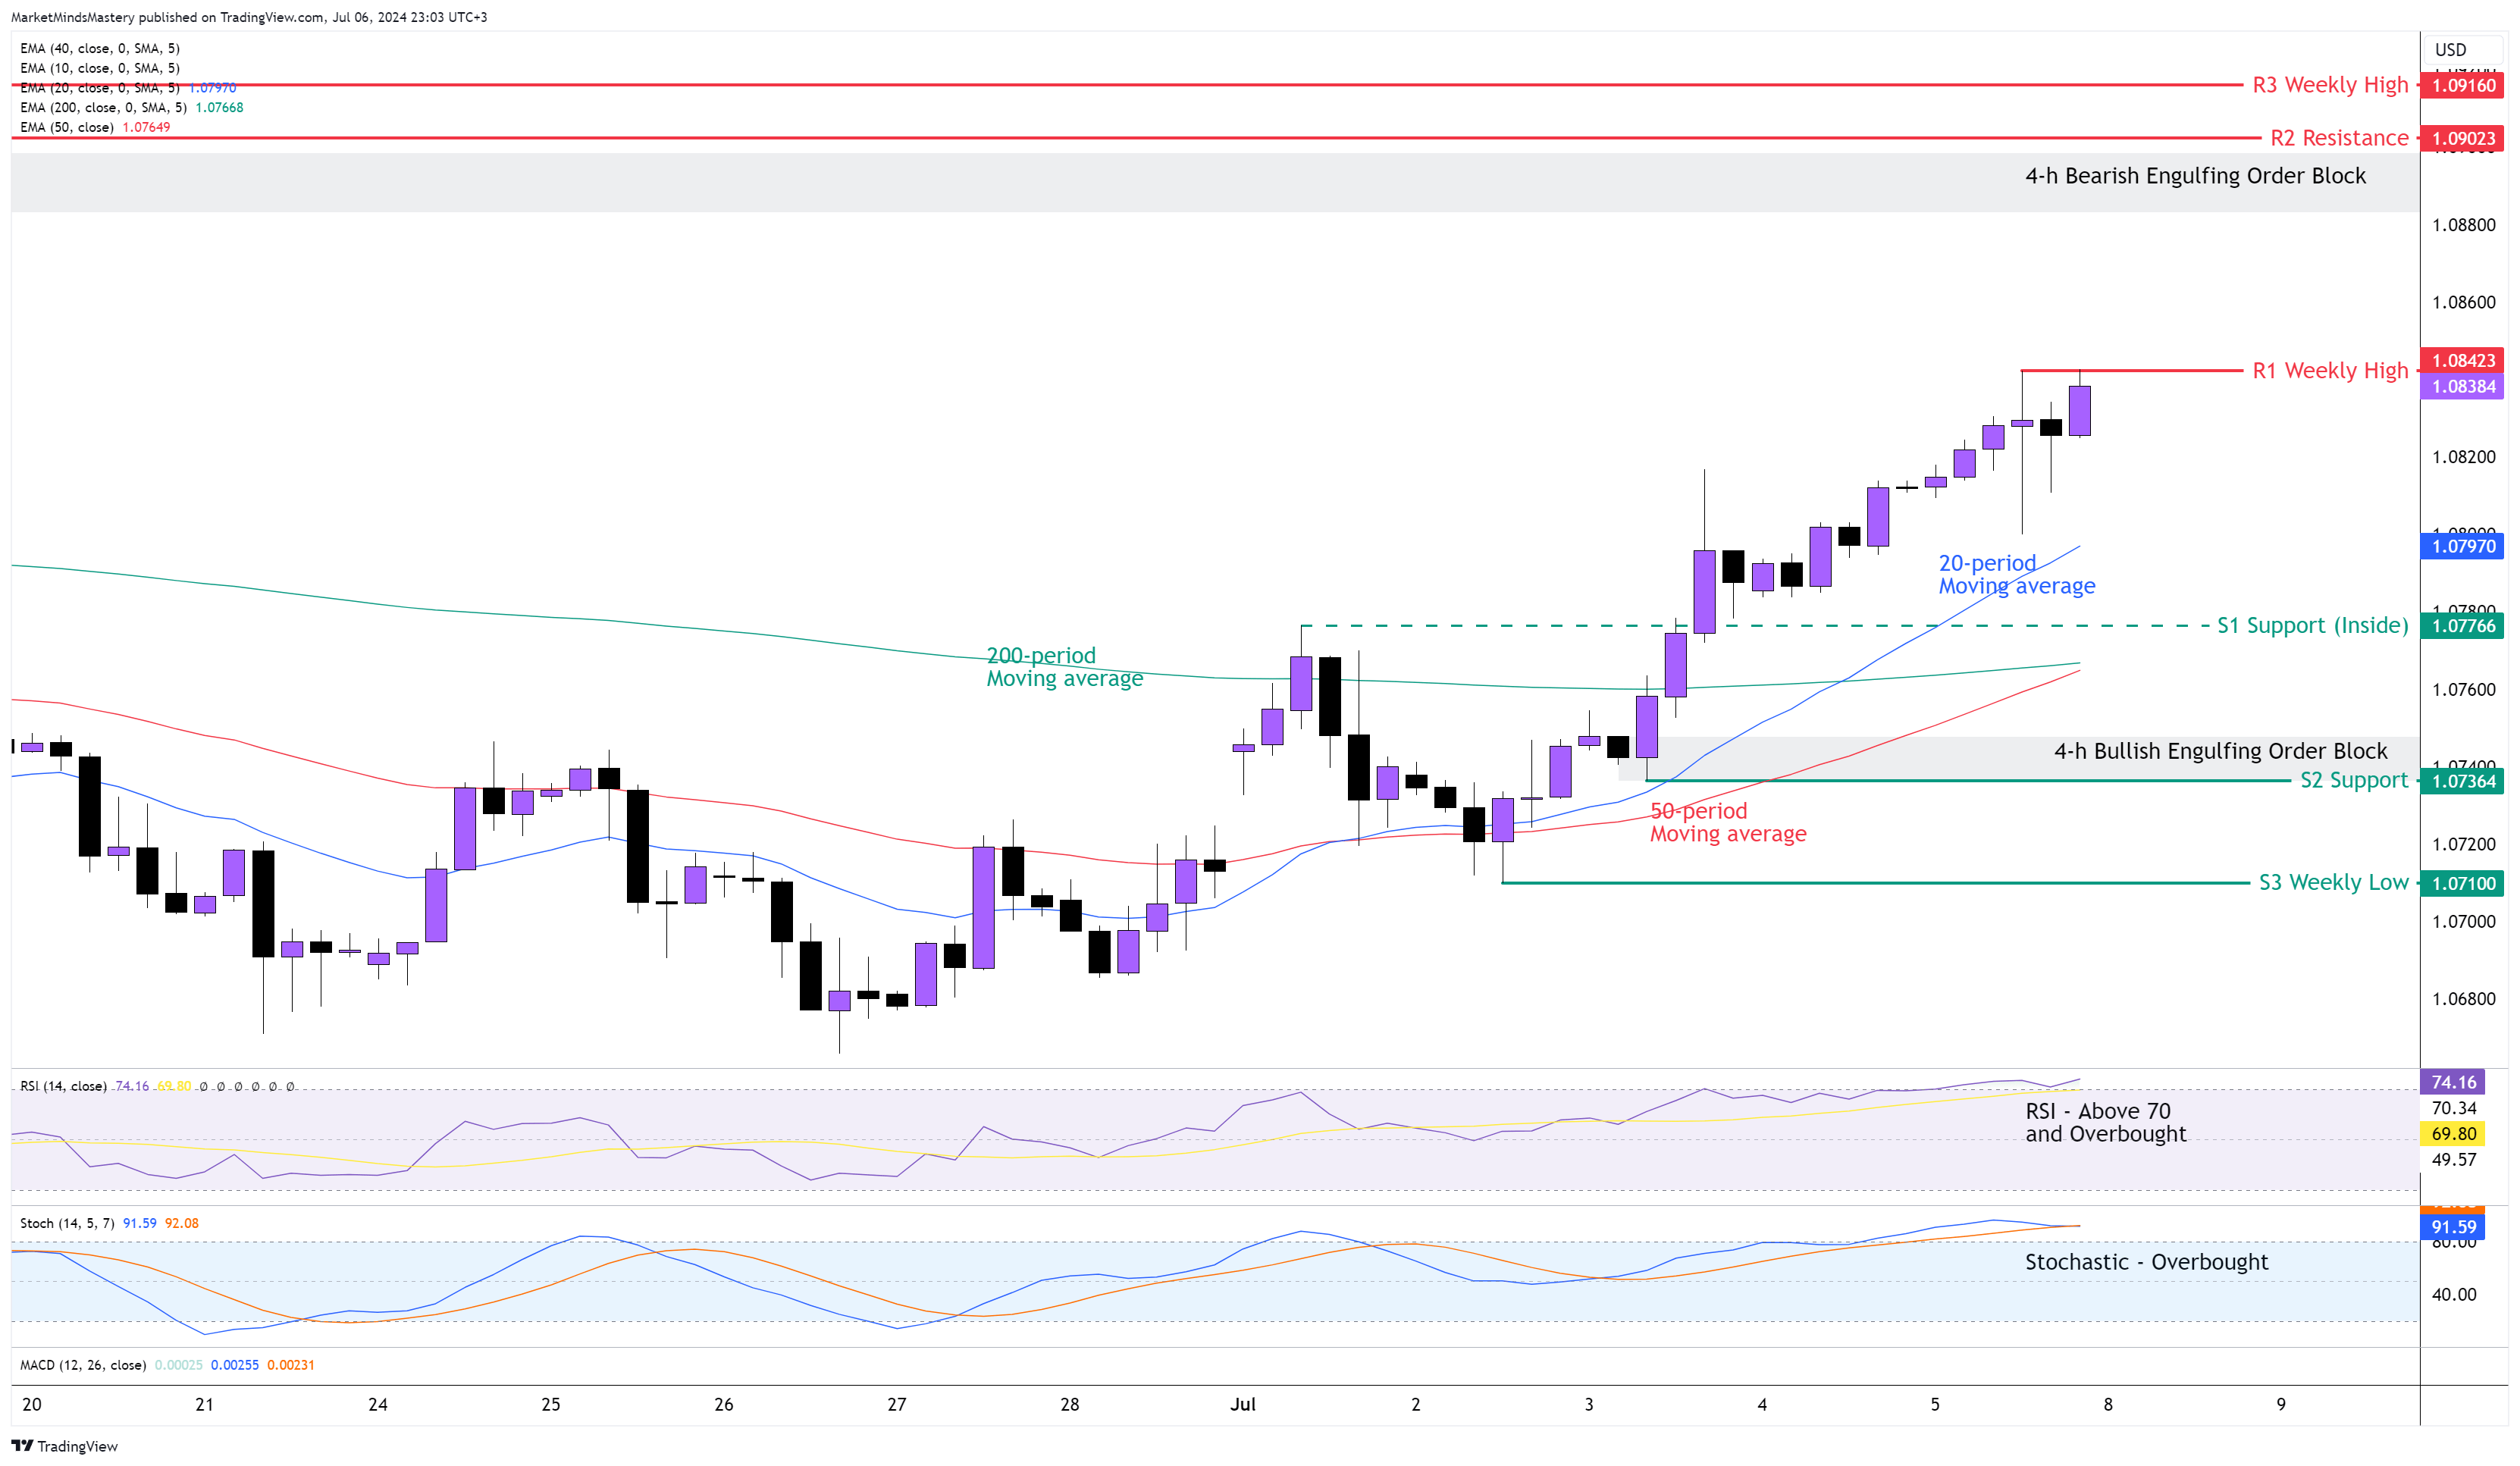
EUR USD 4H

Last week, as we explained, the weekly inside candle at that level could lead the price to move upwards. This is what happened. The market took advantage of the FOMC Minutes report last Wednesday and the NFP last Friday to depreciate the Greenback. Hence, a solid Bullish continuation candle was created on the weekly chart. On the 4-hour chart, the price successfully broke above the downward trendline T1 we pointed to the previous week’s market outlook, and the price moved upwards, creating the first sign of a new uptrend. Following the FOMC last Wednesday, the price made a series of higher highs and higher lows, creating a new uptrend. The fast 20-period moving average closely follows the price and now is above the 50-period moving average. The slower moving averages, which are the 50 and the 200, they haven’t crossed yet. The RSI Oscillator is above 70 and is pointing to a strong bullish upward move. Same with the Stochastic Oscillator, it entred into an overbought condition, which has bullish implications.
If the price continues its upward move, the first resistance area, R1, will be the previous week’s high, around 1.08423. If the price penetrates the R1 and keeps moving upward, the next resistance, R2, will be the 1.0922. On the other hand, if the price is rejected and moves downwards, the first support area, S1, will be an inside support around 1.07766. As the market didn't create a reversal candlestick, we can not refer to Fibonacci's retracement levels. In case the price keeps lowering, the next support area, S2 will be around 1.0736. A further downward move will find the S3 support, approximately 1.70100, which is also the previous week’s low.
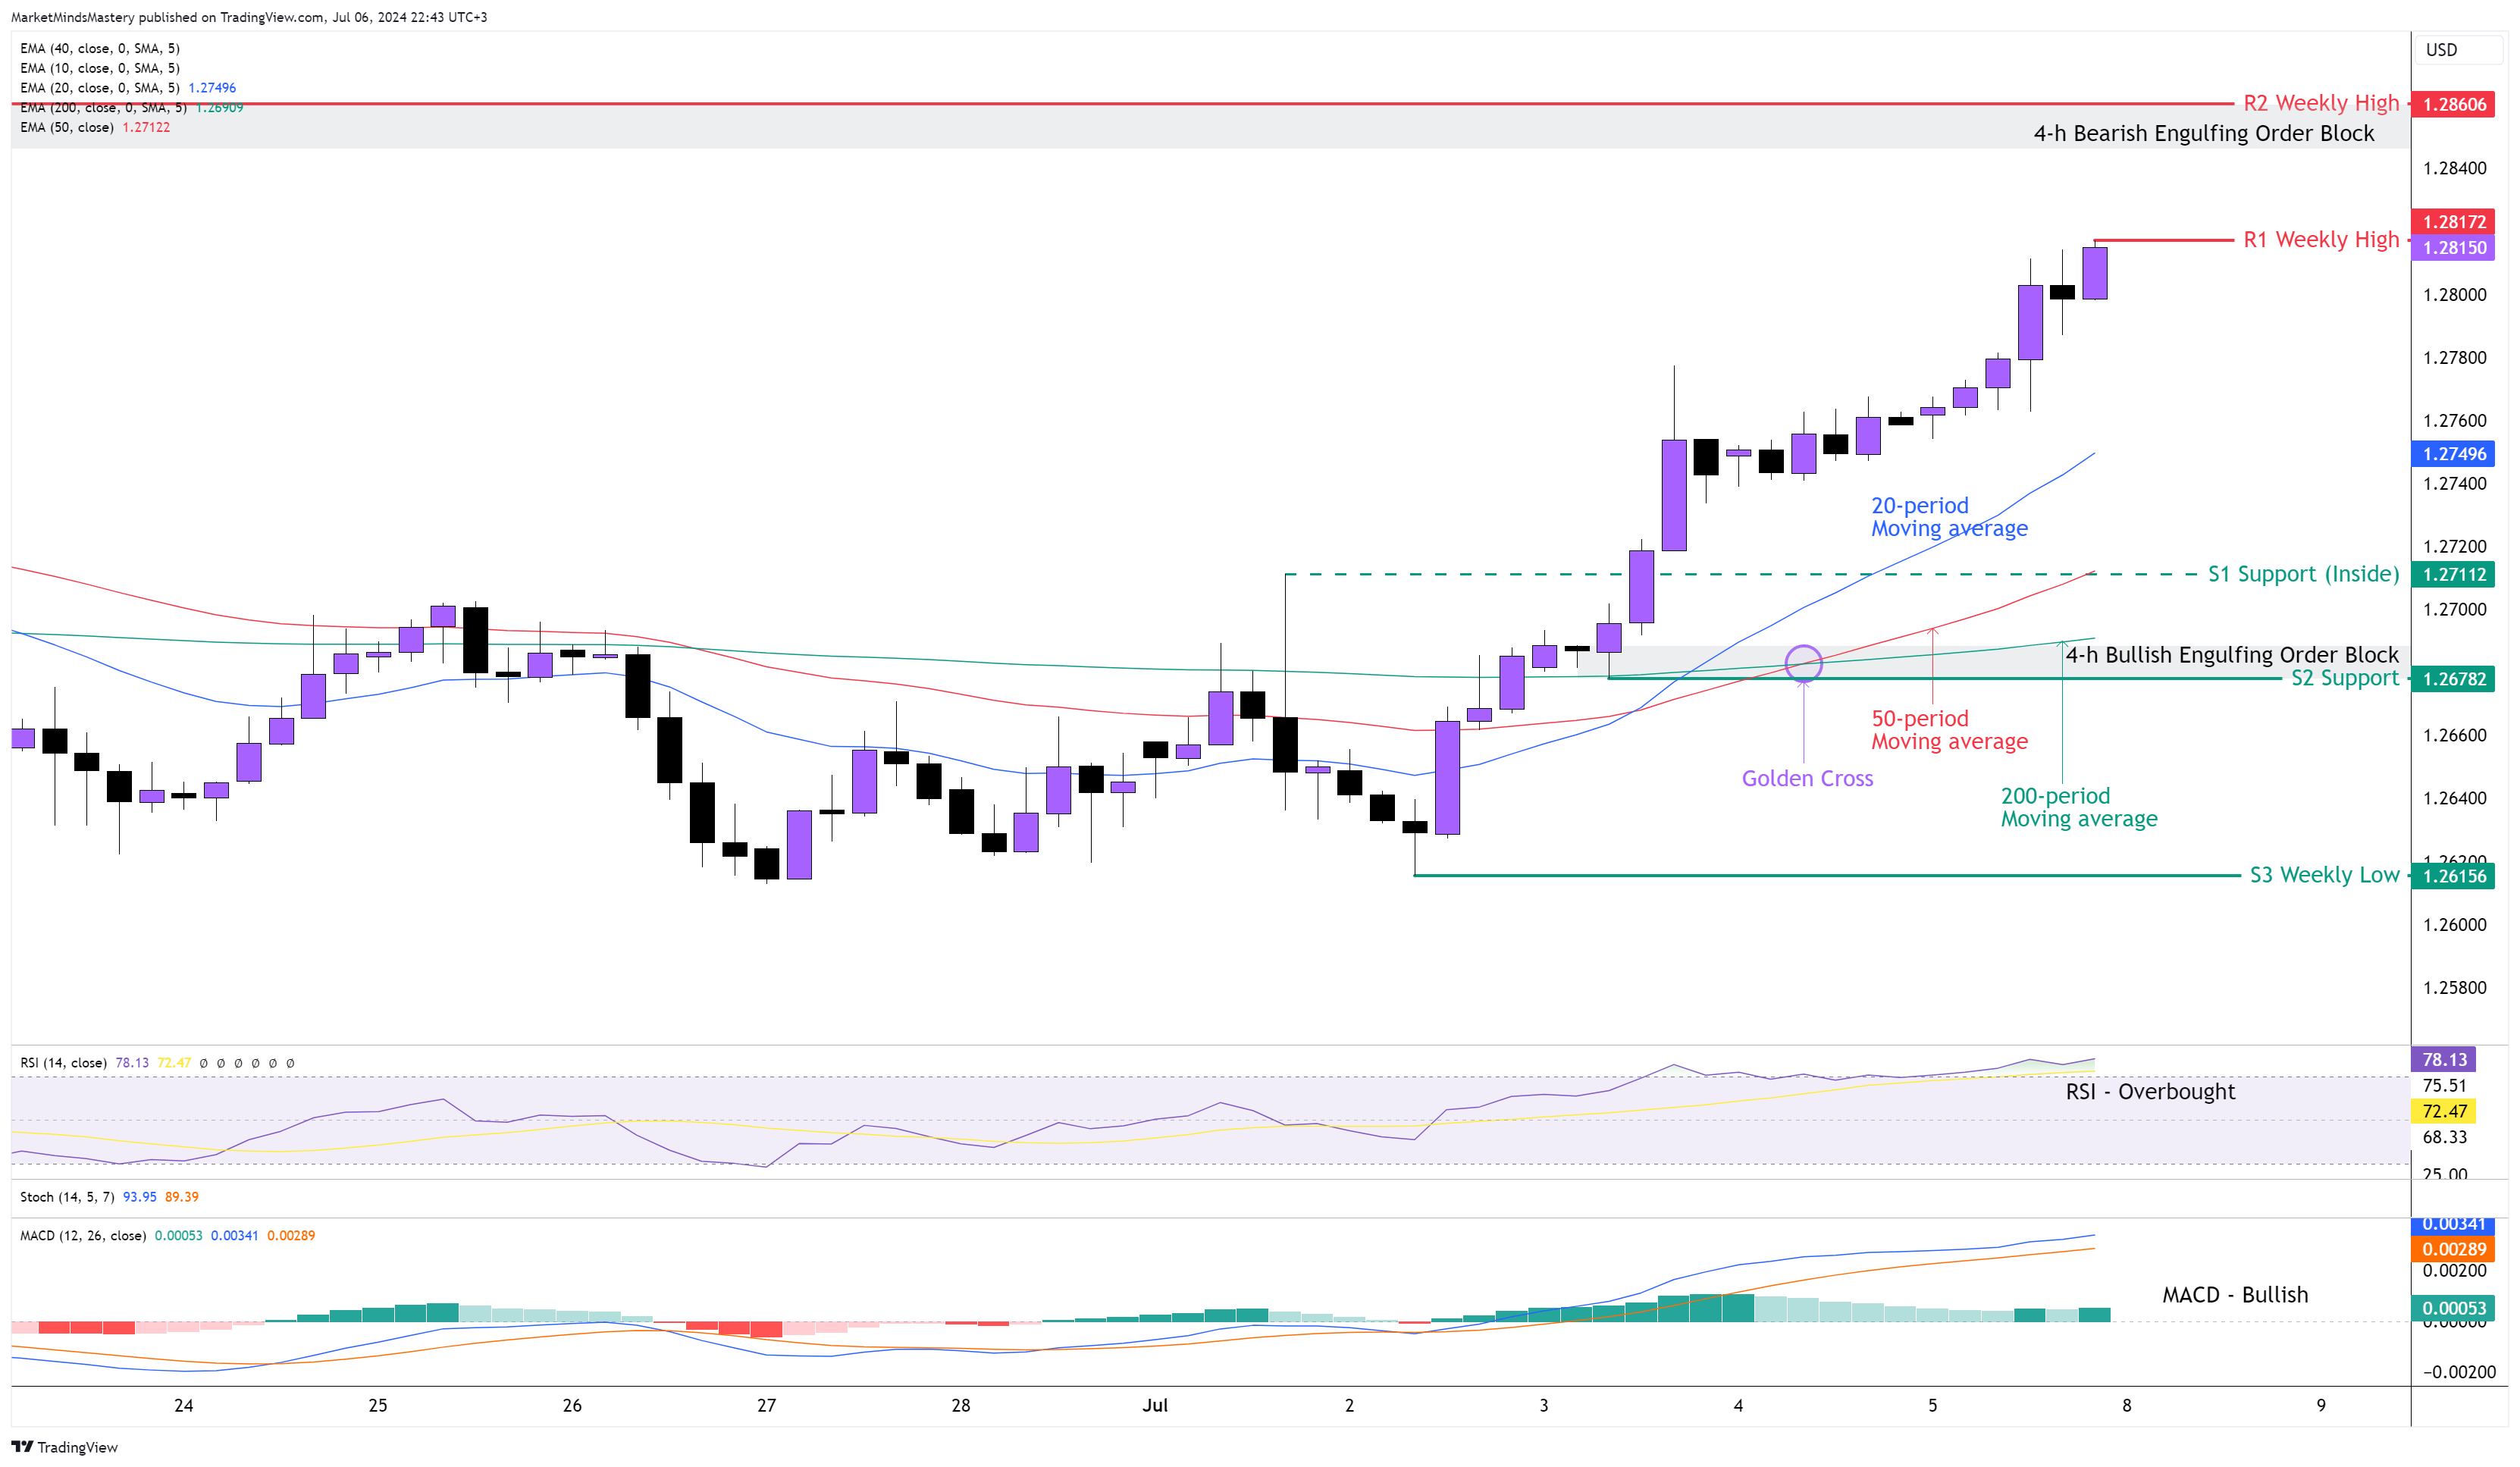
GBP USD 4H
Last week, there were two primary factors determining Sterling's positive performance: First was the FOMC minutes that caused weakness in the USD. Therefore, the GBPUSD currency pair lifted upwards, and secondly was the NFP last Friday, which, despite the positive outcome, the USD didn't follow through, resulting in more bullishness on this market. The weekly candle ended as a strong Bullish continuation candle. As the market makes higher highs and higher lows, it defines a new uptrend. The 50-period moving average crossed above the 200-period moving average, which is a bullish crossover known as the Golden Cross. The RSI shows that the market is in a strong uptrend as it entered into its overbought zone. The MACD is bullish, with the MACD line (blue) being above the Signal line (orange). The MACD’s Histogram is rising, confirming the bullish bias.
Starting Monday, if the price continues its upward move, the first resistance area, R1, will be the previous week’s high, around 1.2817, despite the fact that the price last Friday closed almost at the same level as the candle’s high. If the price penetrates R1 and moves further upwards, the next resistance area, R2, will be around 1.2860. From this level, some time ago, a Bearish Engulfing Order Block was formed, but it hasn't been tested yet. On the other hand, if the price declines and moves downwards, the first level of support, S1, will be an inside support of approximately 1.27112. A break below the S1 will find the next support area, S2, around 1.2678. This level will be considered as significant as a Bullish Engulfing Order Block, and the 200-period moving average is nearby.
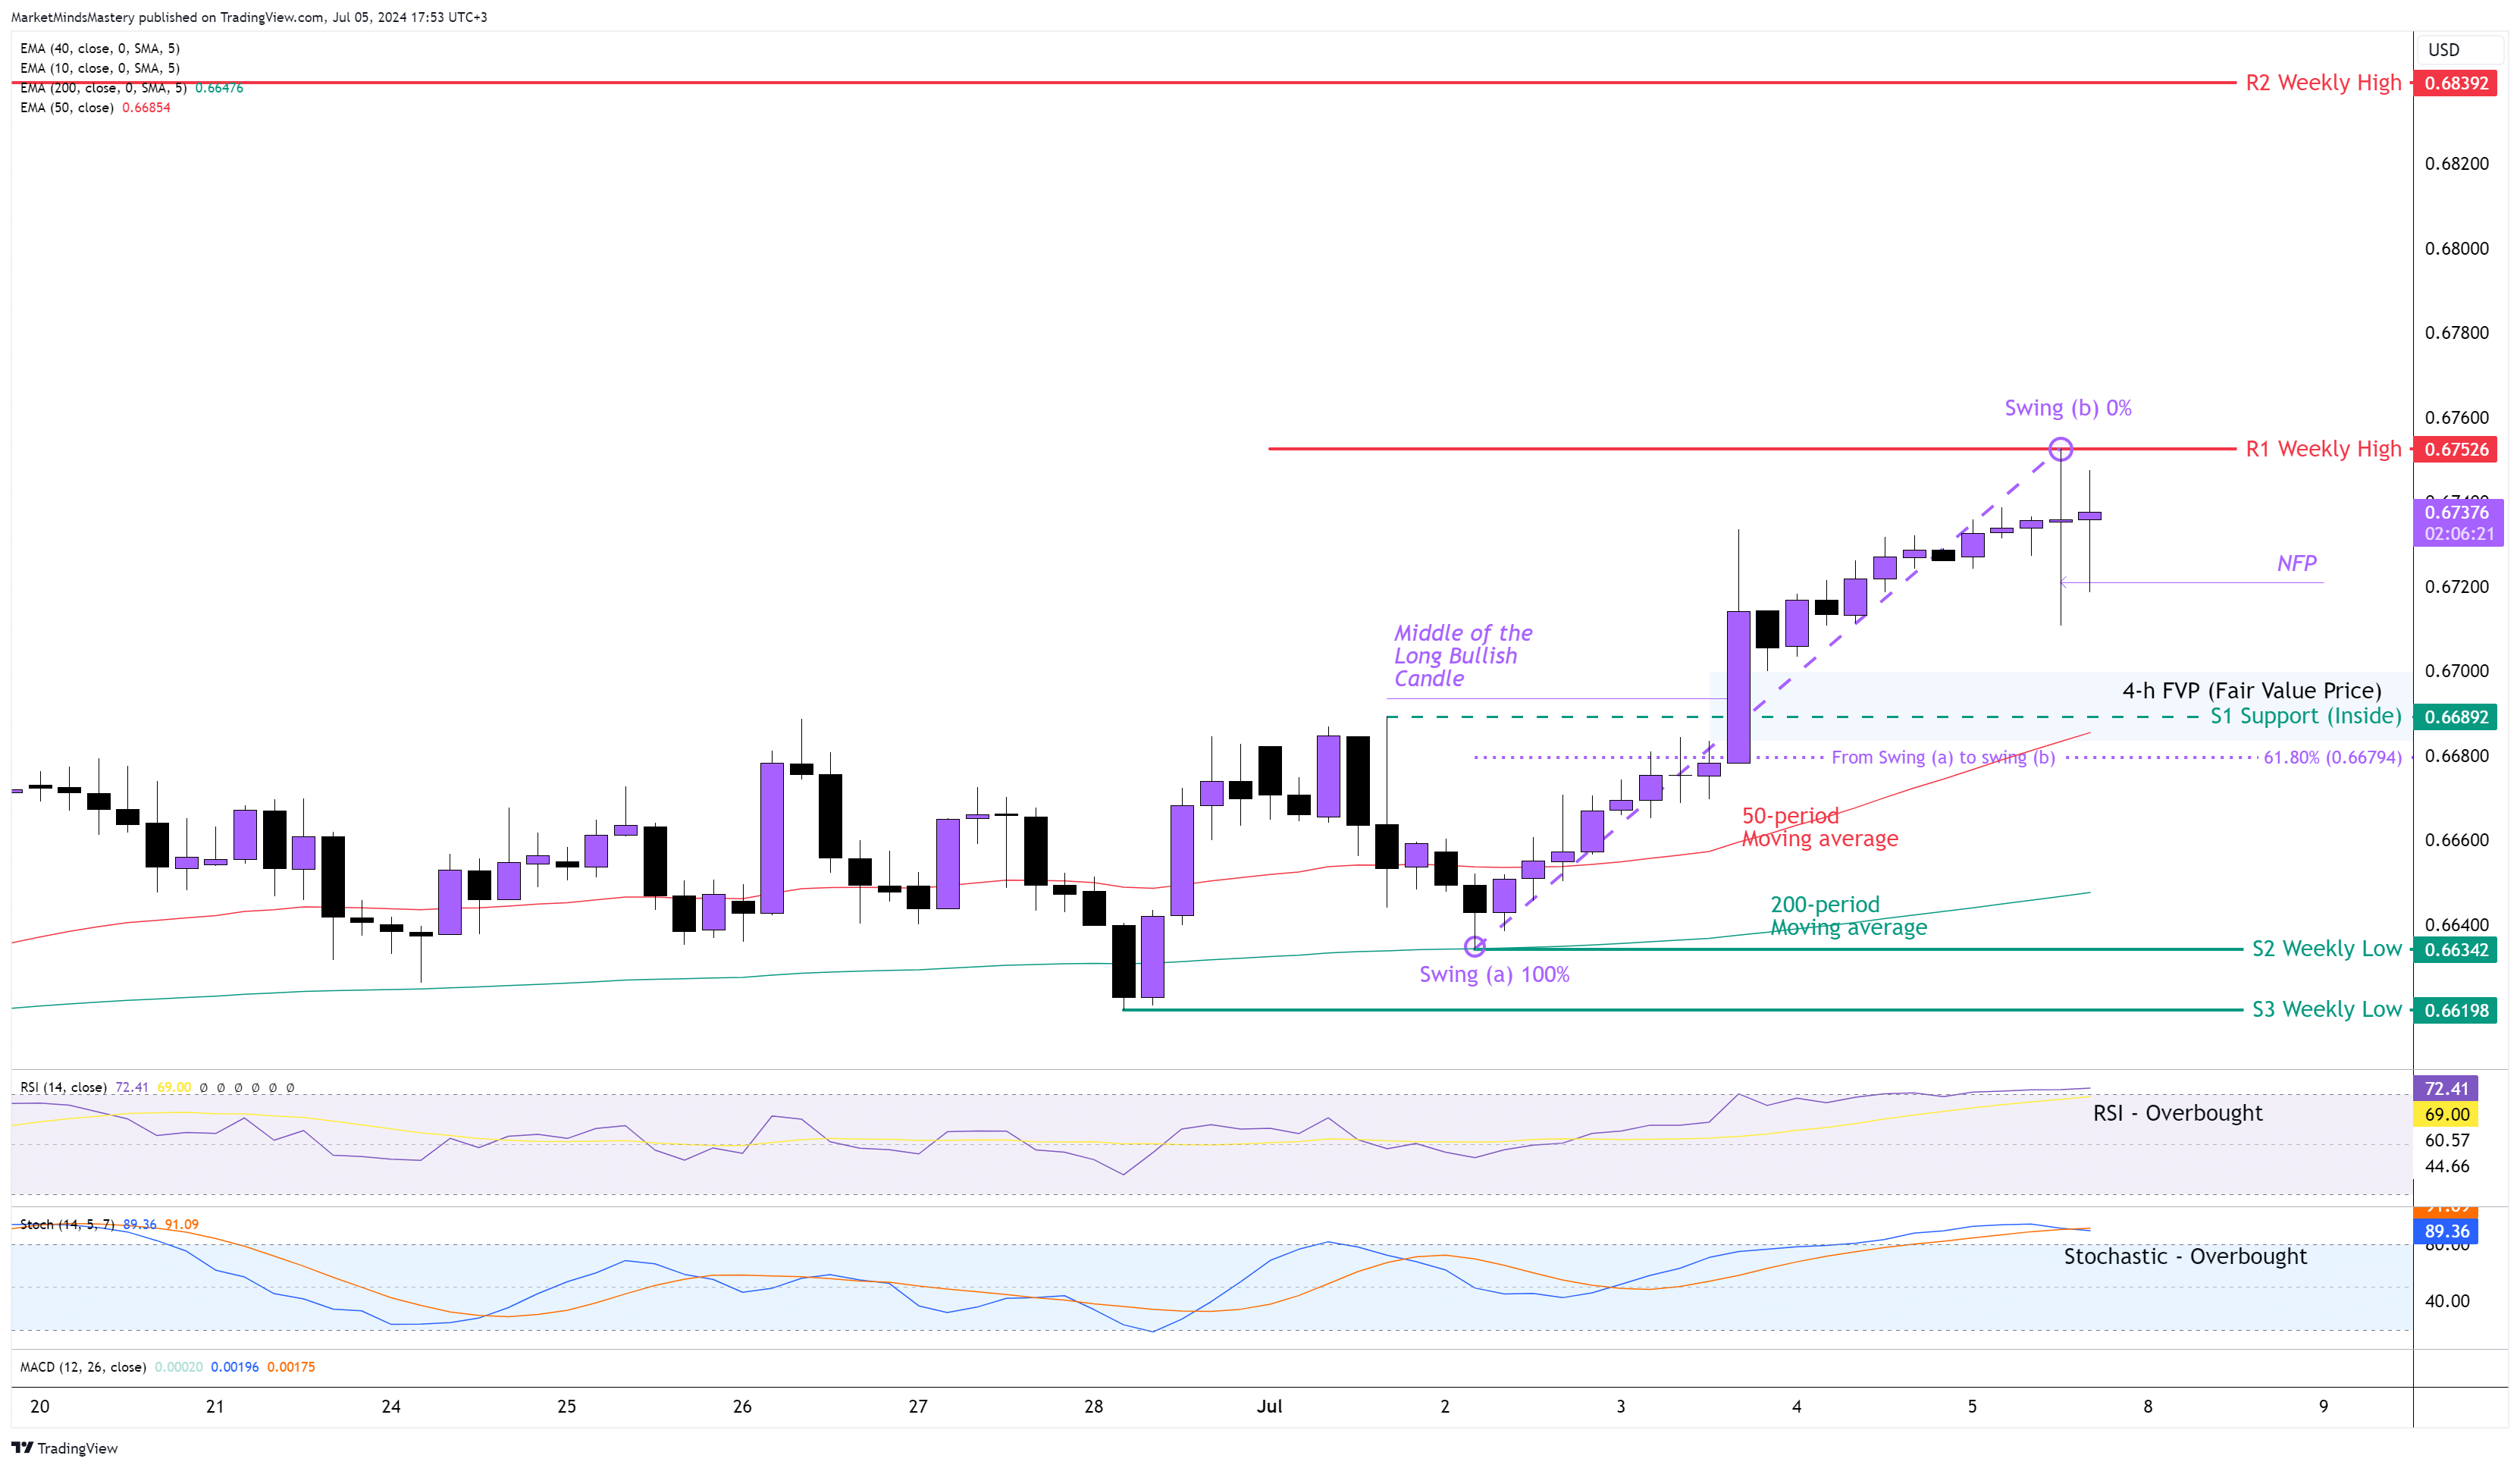
AUD USD 4H
Following the previous week’s bullish momentum, the market created an upward breakout, and the weekly chart printed a Bullish candle with a Bullish close.
On the 4-h chart, the price created a series of higher highs and higher lows, which is bullish. Despite the positive number of the NFP last Friday, the 4-hourly candle ended as an Outside Candle. The 50-period is above the 200-period moving average, indicating bullishness. Both the RSI and the Stochastic Oscillator reached their overbought areas, above 70 and 80, respectively. This is an indication of a strong, bullish market.
As the price makes higher highs and higher lows, we can use the Fibonacci Retracement tool to estimate potential retracements.
If the price moves upwards, the first resistance area, R1, will be the previous week’s high, around 0.67526. If the price penetrates the R1 and keeps moving upwards, the next resistance area, R2, is around 900 points (90 pips) away at 0.68392. The R2 is an old weekly high. Oppositely, if the price declines and moves downwards, the first support area, S1, will be an inside support of around 0.66800. This is considered a significant price level as it consists of a few different indications that can all provide support to the price. These are the Fibonacci Golden Ratio 61.8%, is the 50-period moving average, and the middle of the FVP (Fair Value Price). In case the price doesn't find support and declines further, the next support area, S2, will be the previous week’s low, around 0.66342, and the next support, S3, which is another weekly low, around 0.66198.
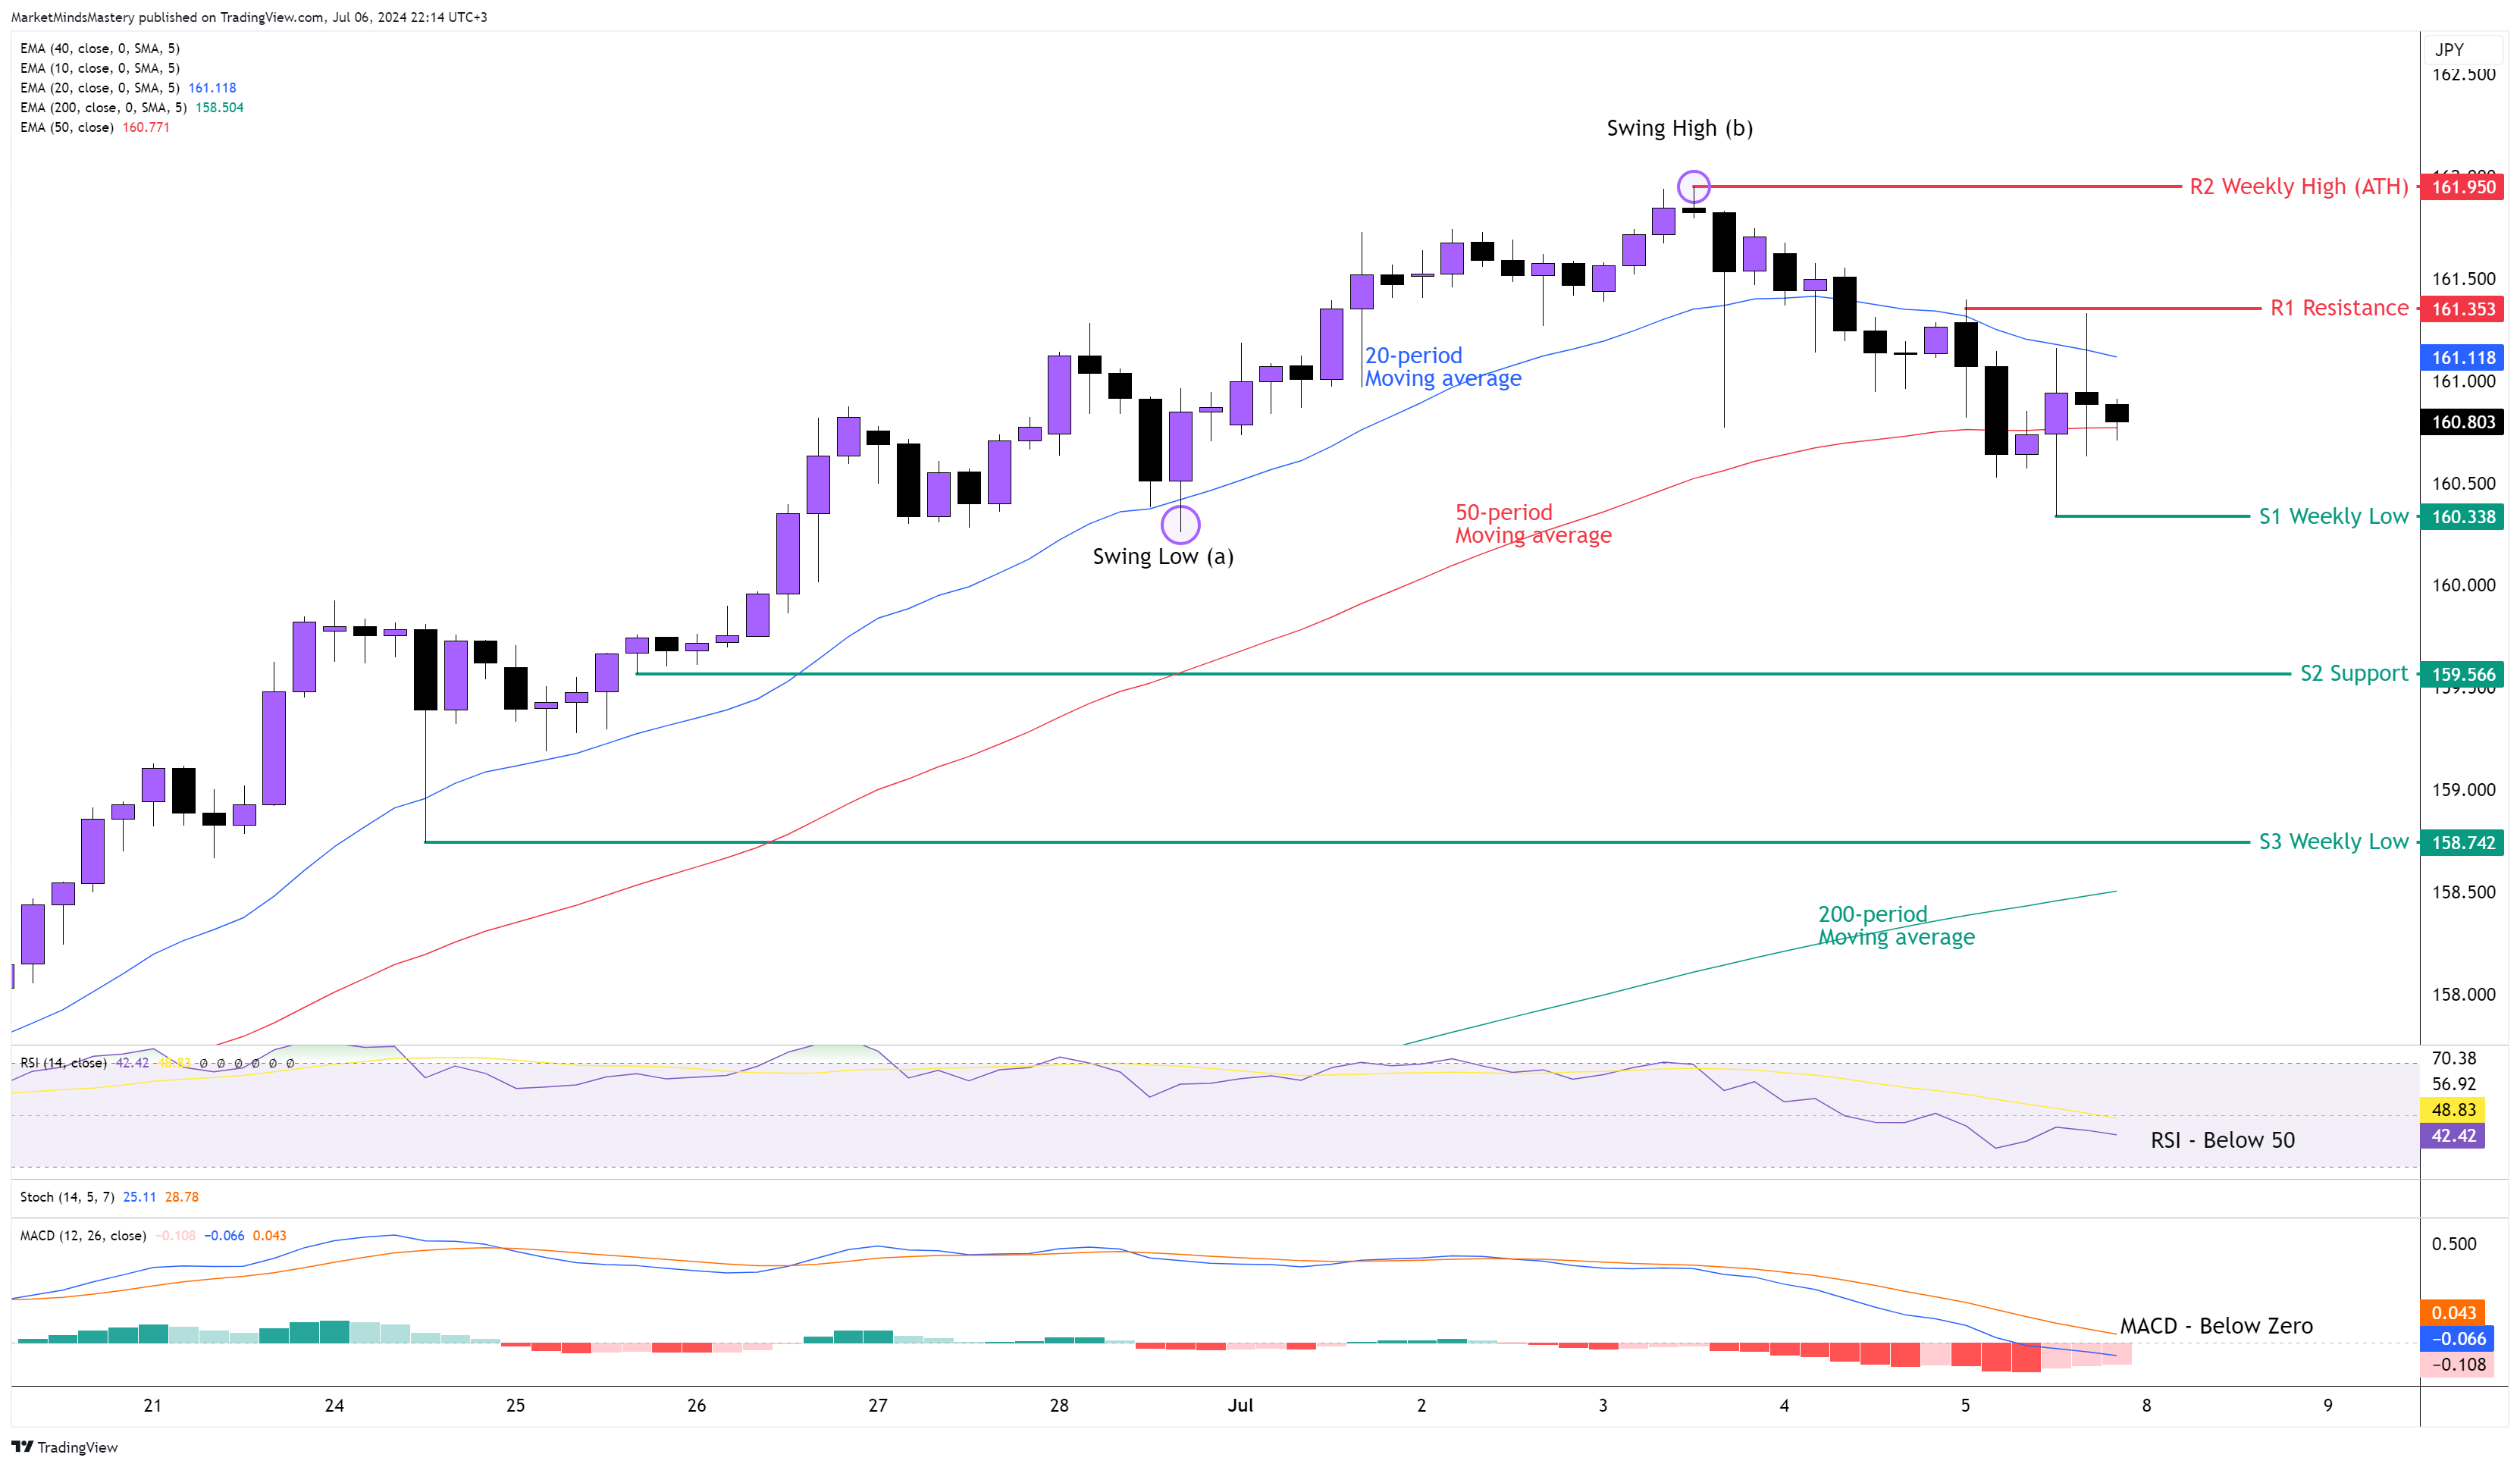
USD JPY 4H
Last week, the USDJPY currency pair continued its upward move as expected. It reached the 161.8% Fibonacci Extension around 161.96, which is the new ATH (All-Time High), and then declined. On the weekly chart, the candle ended as a Doji. A doji candle after an extensive uptrend usually leads to a price setback.
Based on the Swing Analysis, the swing low at point (a) is the determining factor for a new market structure. This means that if the swing at (a) is violated and the price closes below it, the uptrend that started in mid-June will end. But if the swing at point (b) is violated, it means that the uptrend resumes. Currently, the market is in a transition period as the price reversed 100% of its move last week.
As the 20-period remains above the 50-period, and the 50-period remains above the 200-period moving average, this market is considered as Bullish.
On the other hand, the RSI is below 50, the MACD is below zero, and there is a bearish histogram. Therefore, if the price moves downwards, the first support area, S1, will be the previous week’s low, around 160.33. If the price penetrates the S1 and the candles close below it, then a downtrend might develop. A further downward move will find the next support, S3, around 158.74, which is another weekly low.
Conversely, if the price finds support and moves upwards, the first resistance area, R1, will be the 161.35 level. If the price penetrates the R1 and keeps increasing, the next resistance area, R2, will be the previous week’s high and ATH around 161.95.
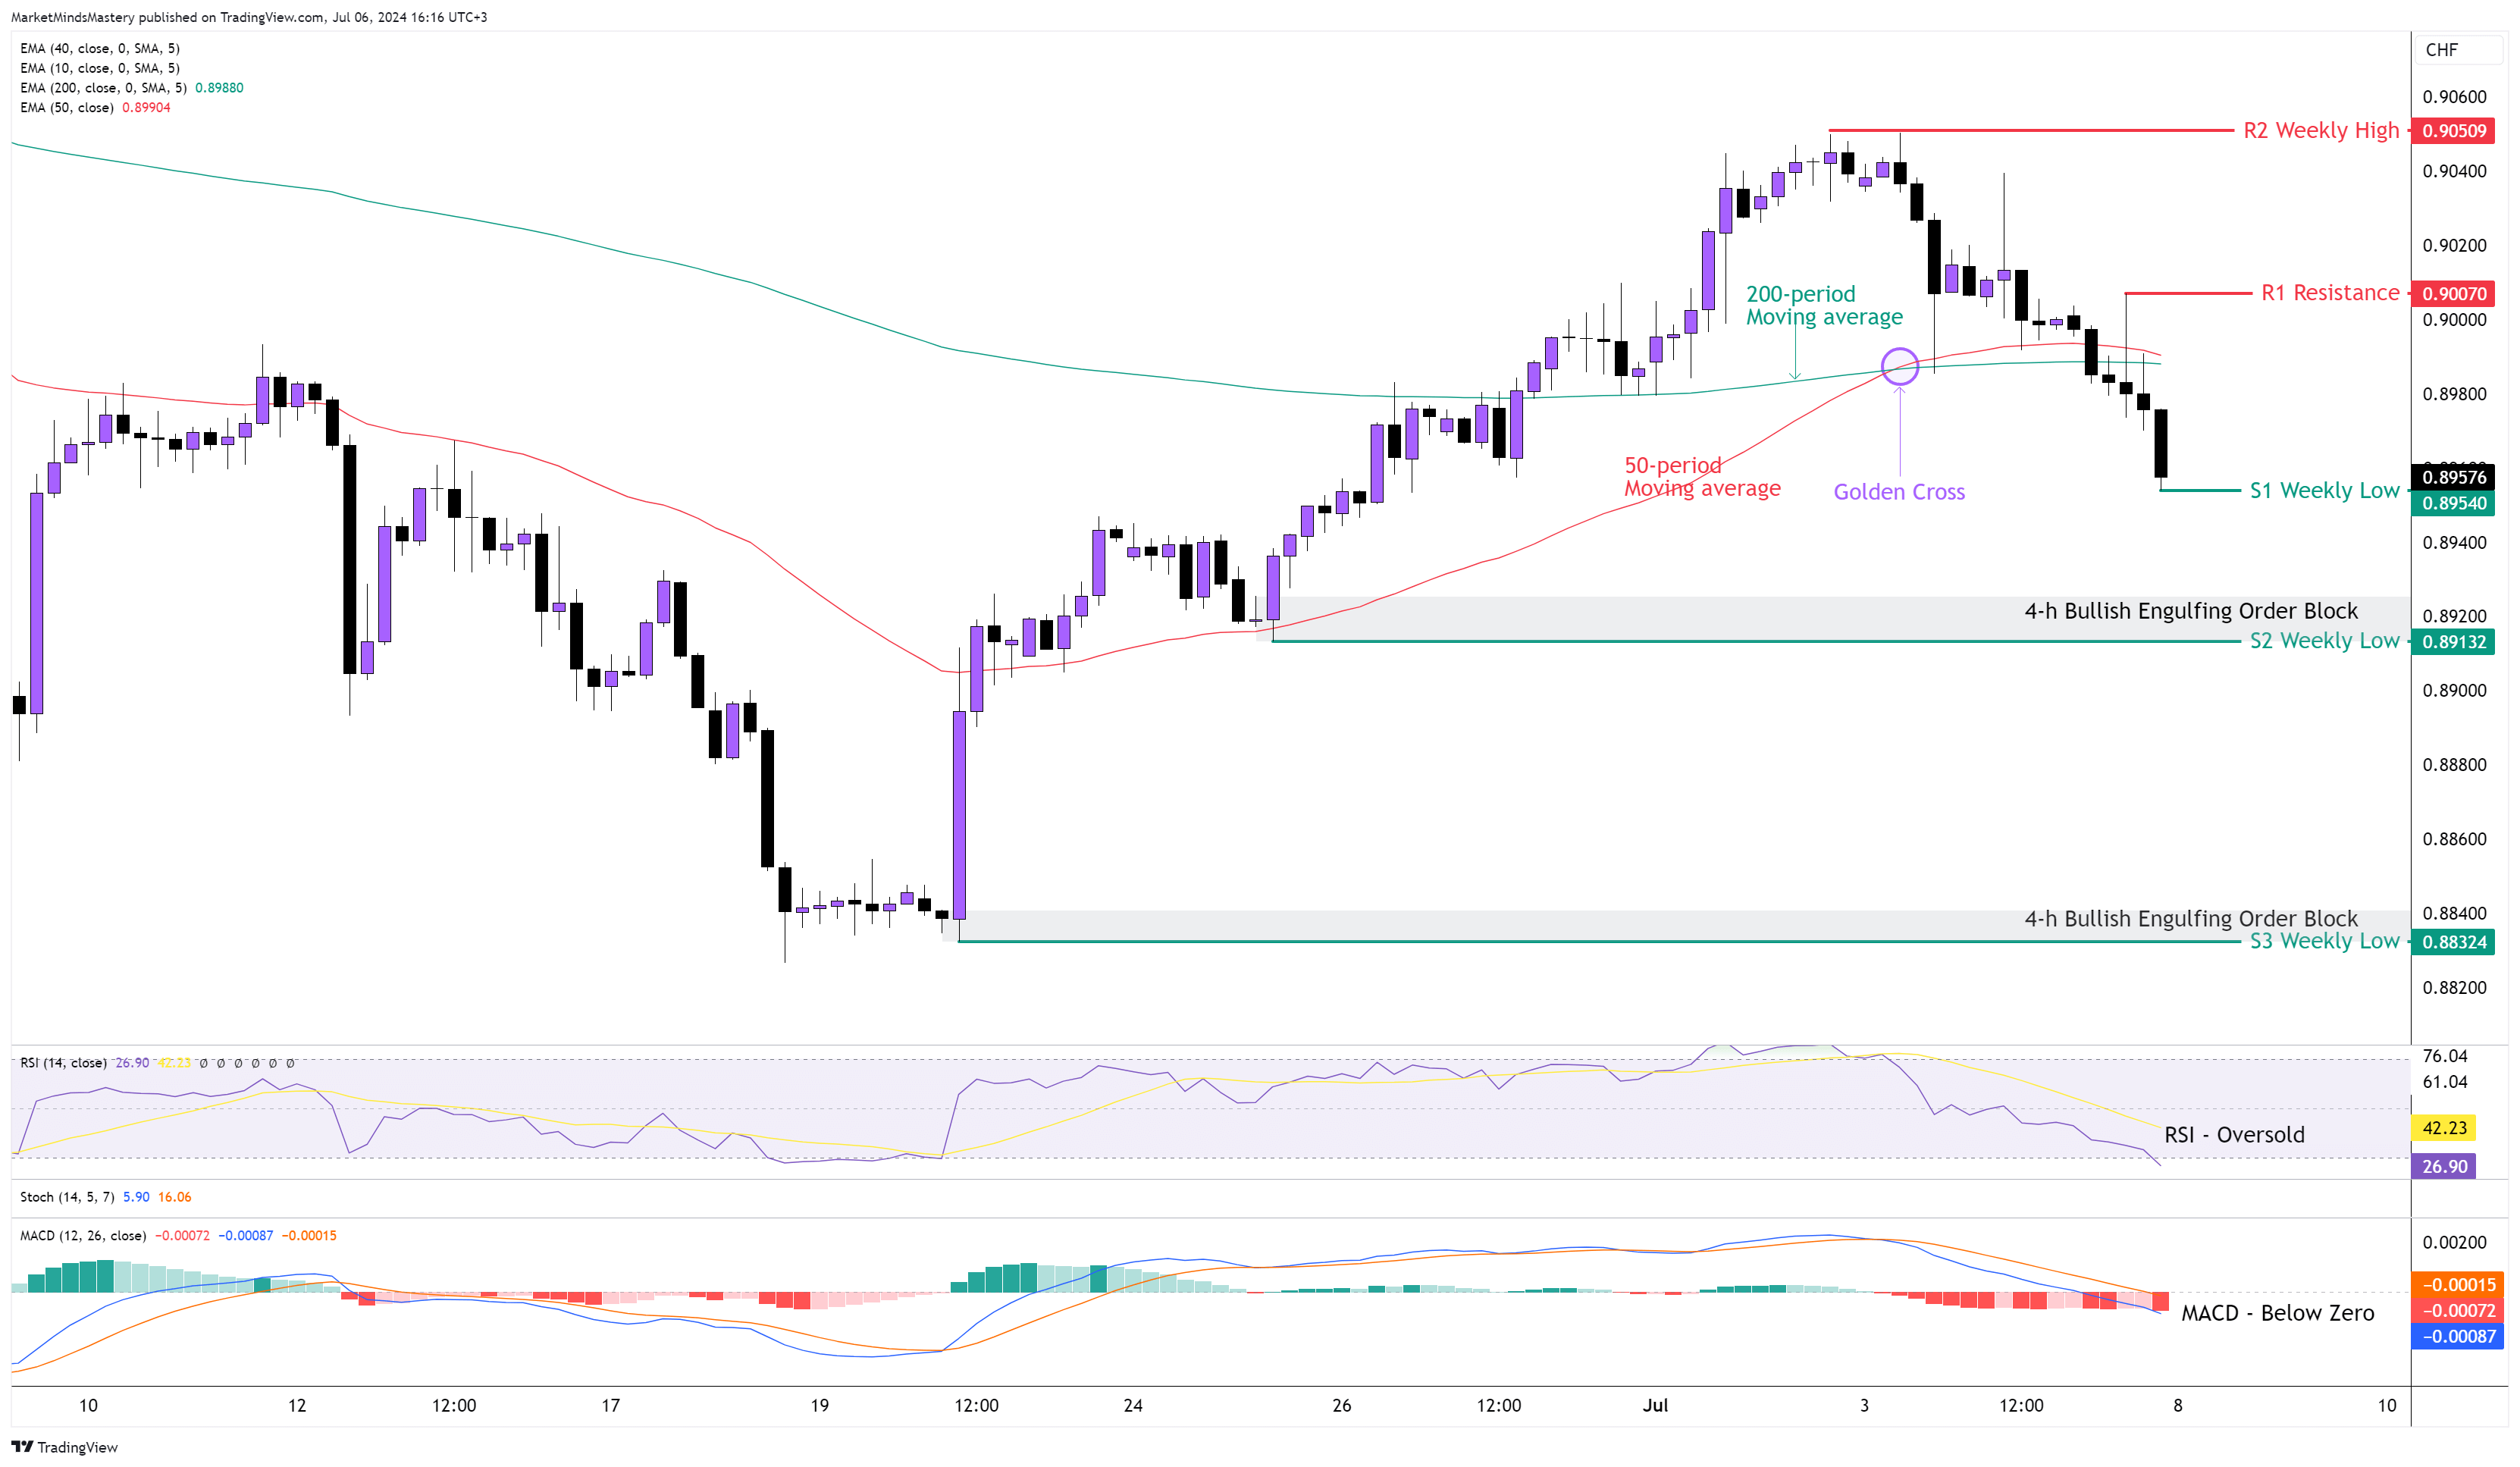
USD CHF 4H
Following the previous week’s market outlook, the price kept trading upwards as expected, but by the end of last week, it had declined, creating a Shooting Star reversal pattern on the weekly chart.
On the 4-hour chart, the market structure changed as the price made a lower high and a lower low, which indicates that the previous uptrend has ended. As the change in market structure happened last Friday, the moving averages have yet to turn out. Therefore, the 50-period is still above the 200-period, which is bullish. The RSI Oscillator is in an oversold condition, indicating the strength of the recent downward move. The MACD thought is below zero, and its Histogram is also below, and these have bearish implications.
Starting Monday, if the price keeps moving downwards, the first support area, S1, will be the previous week’s low, around 0.8954. If the price follows the weekly reversal candle, the S1 level will be penetrated, and the price will decline further. In this case, the next support area, S2, will be around 0.89132. As shown on the chart, a well-defined 4-h Bearish Engulfing Order Block formed there. A further decline will find the next support area, S3, around 0.88324.
On the other hand, if the price finds support and moves upwards, the first resistance area, R1, will be around 0.9000. This is a round number, and it is considered to be a significant price level. In case the price penetrates the R1 and keeps increasing, the next resistance area, R2, will be the previous week’s high, around 0.90509.
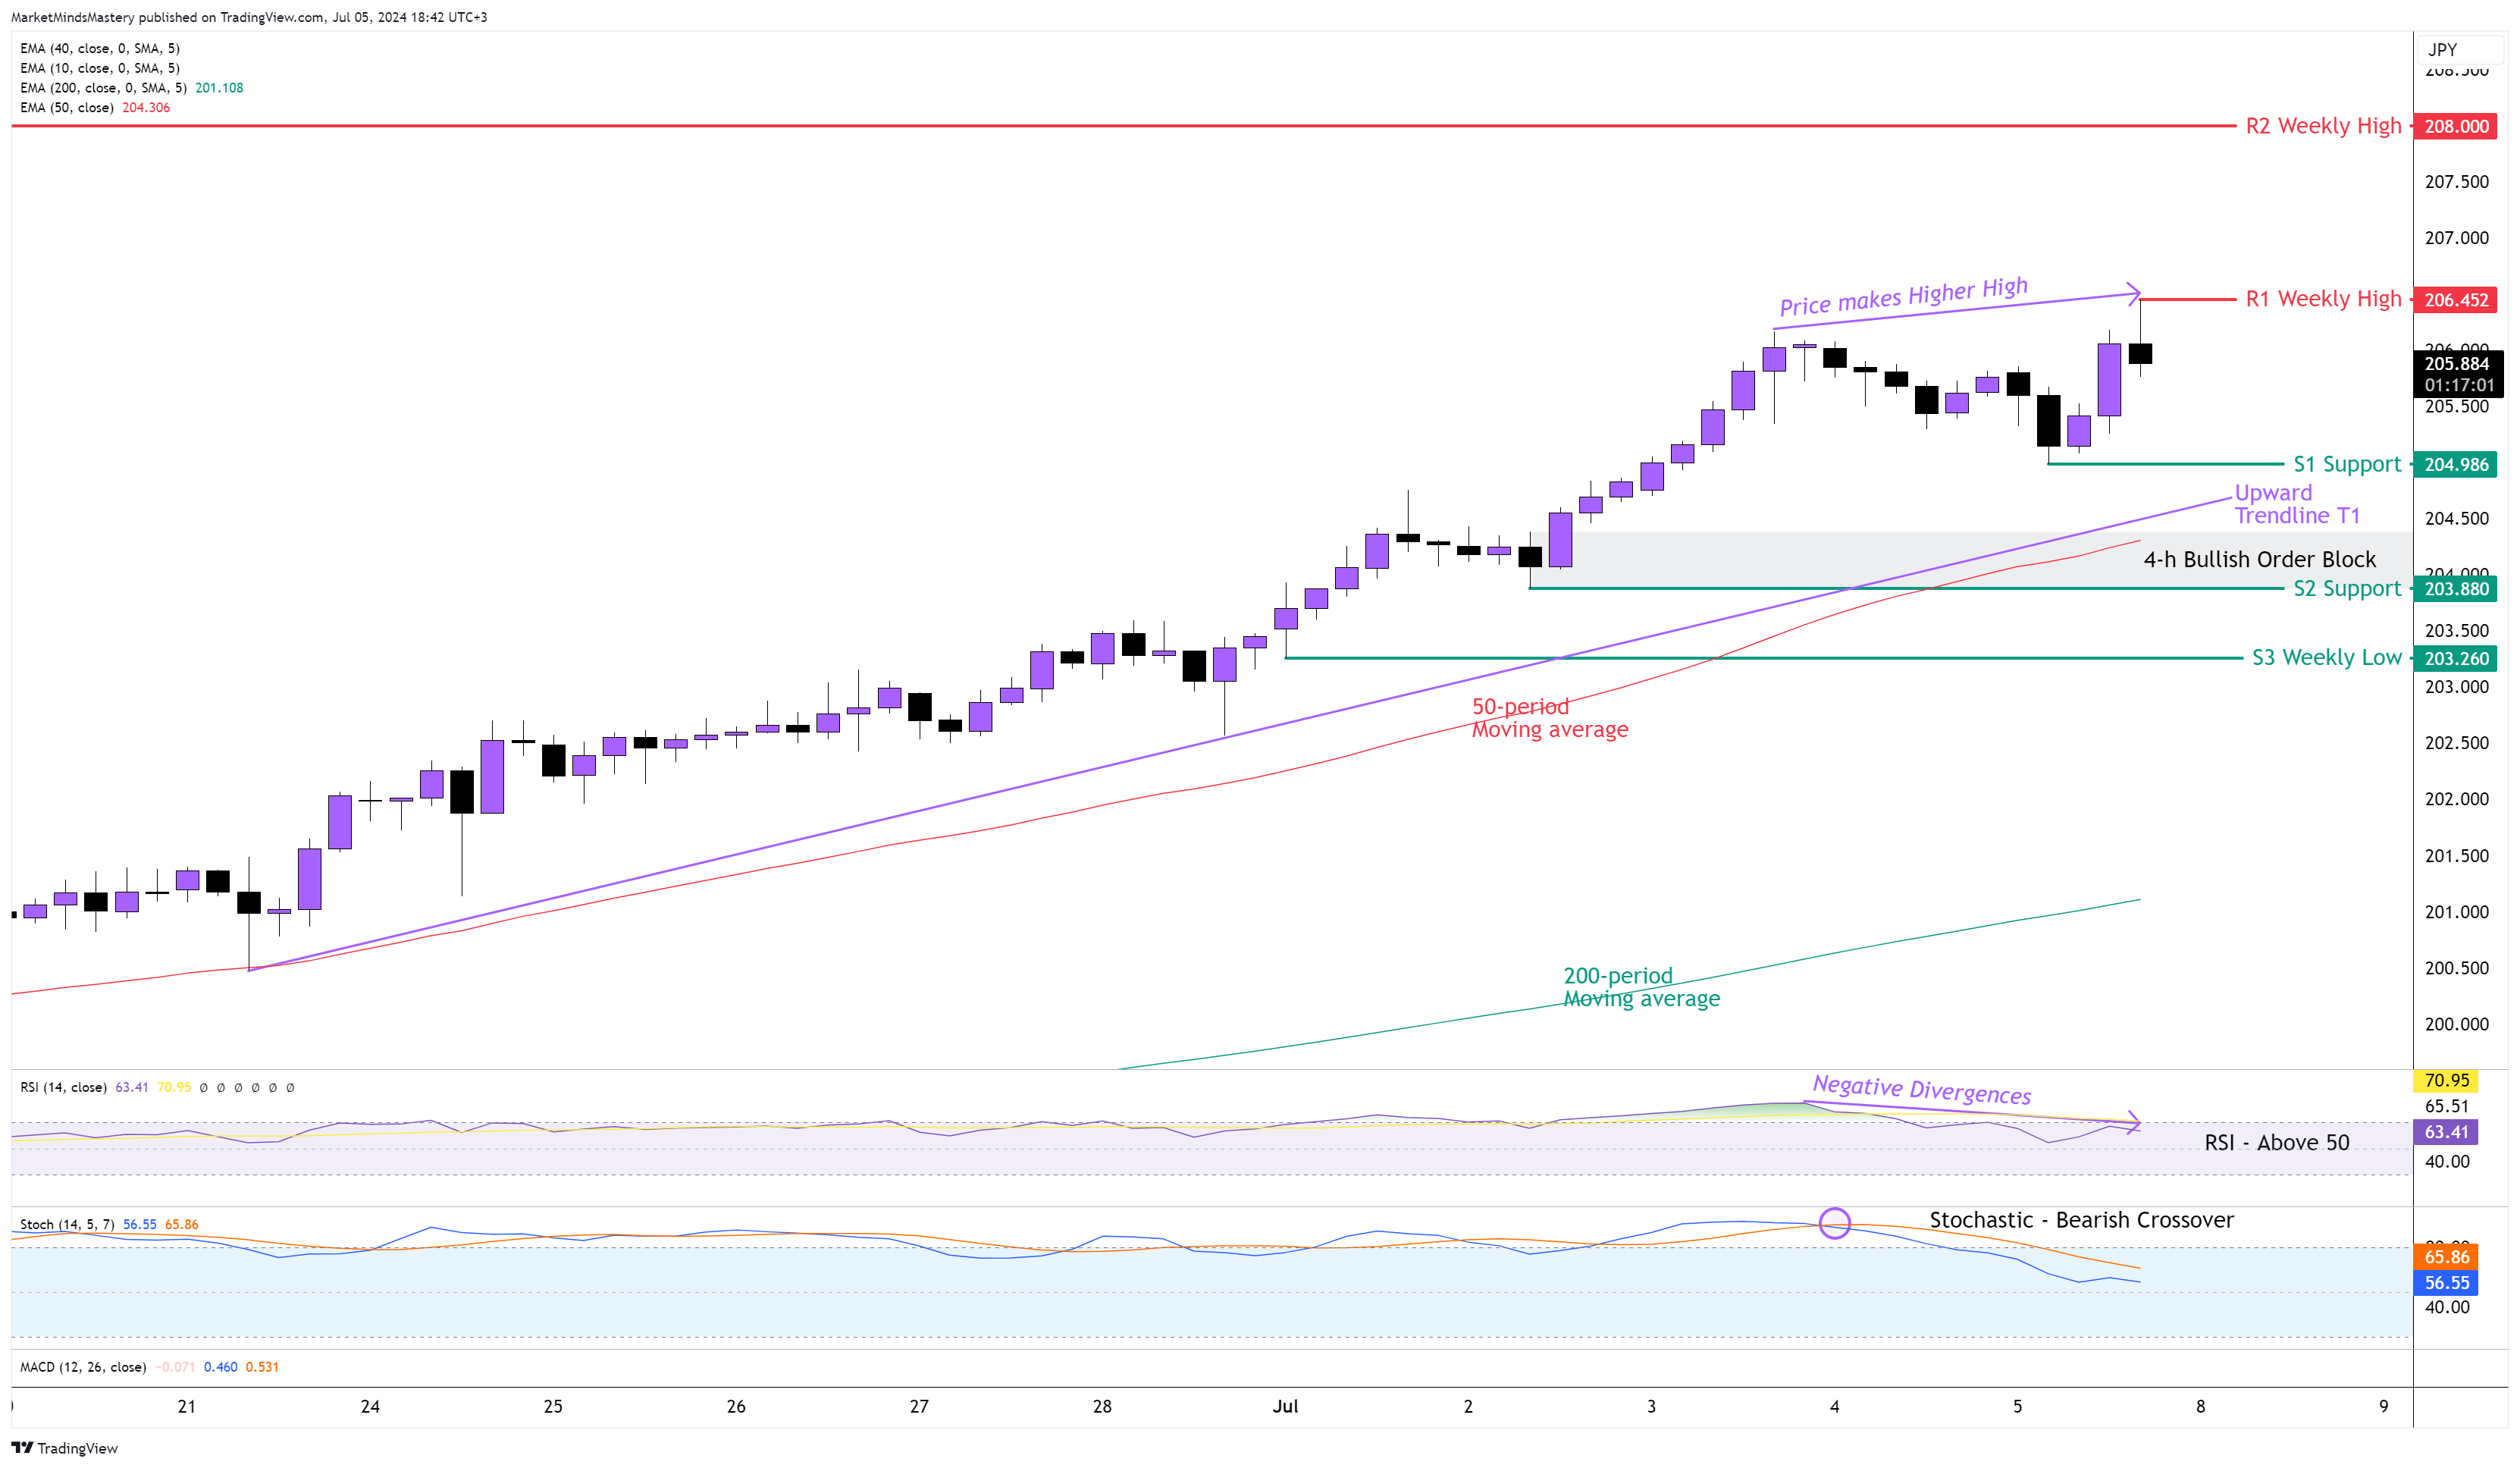
GBP JPY 4H
Following the previous week’s market outlook, the price continued moving upwards, with the uptrend making higher highs and lower lows. The weekly price action ended as a strong bullish candle for the fourth week in a row. Although it is not a common phenomenon, the RSI and the Stochastic Oscillators on the Weekly chart both became overbought, which is why it is worth mentioning. On the 4-hour chart, the price is still in a strong uptrend, with the 50-period moving average still being above the 200-period moving average. As the distance between the two widens, the uptrend becomes stronger.
Additionally, the price reached and penetrated both Fibonacci Extensions used as price targets, which is bullish. The RSI oscillator didn't follow the last price move to a higher high, and it showed Negative Divergences, which can cause the price to enter a corrective phase. Also, the Stochastic Oscillator created a Bearish Crossover as the %K line crossed below the %D line, which was in an overbought area.
Starting Monday, if the price enters a corrective phase and moves downwards, the first support area will be the swing low at S1, around 204.98. If the price penetrates the S1, closes below it and moves further downwards, the Upward Trendline T1 can act as the next support. A penetration of the T1 trendline will lead the price to the next static support, S2, which is another swing low, around 203.88. This level created a Bullish Order Block and usually became a significant support level. A further move downwards finds the S3 support area, around 203, which is the previous week’s low. On the other hand, if the price finds support, bounces off and moves upward, the first resistance area, R1, will be the previous week’s high, around 206.452, and the R2, around 208.
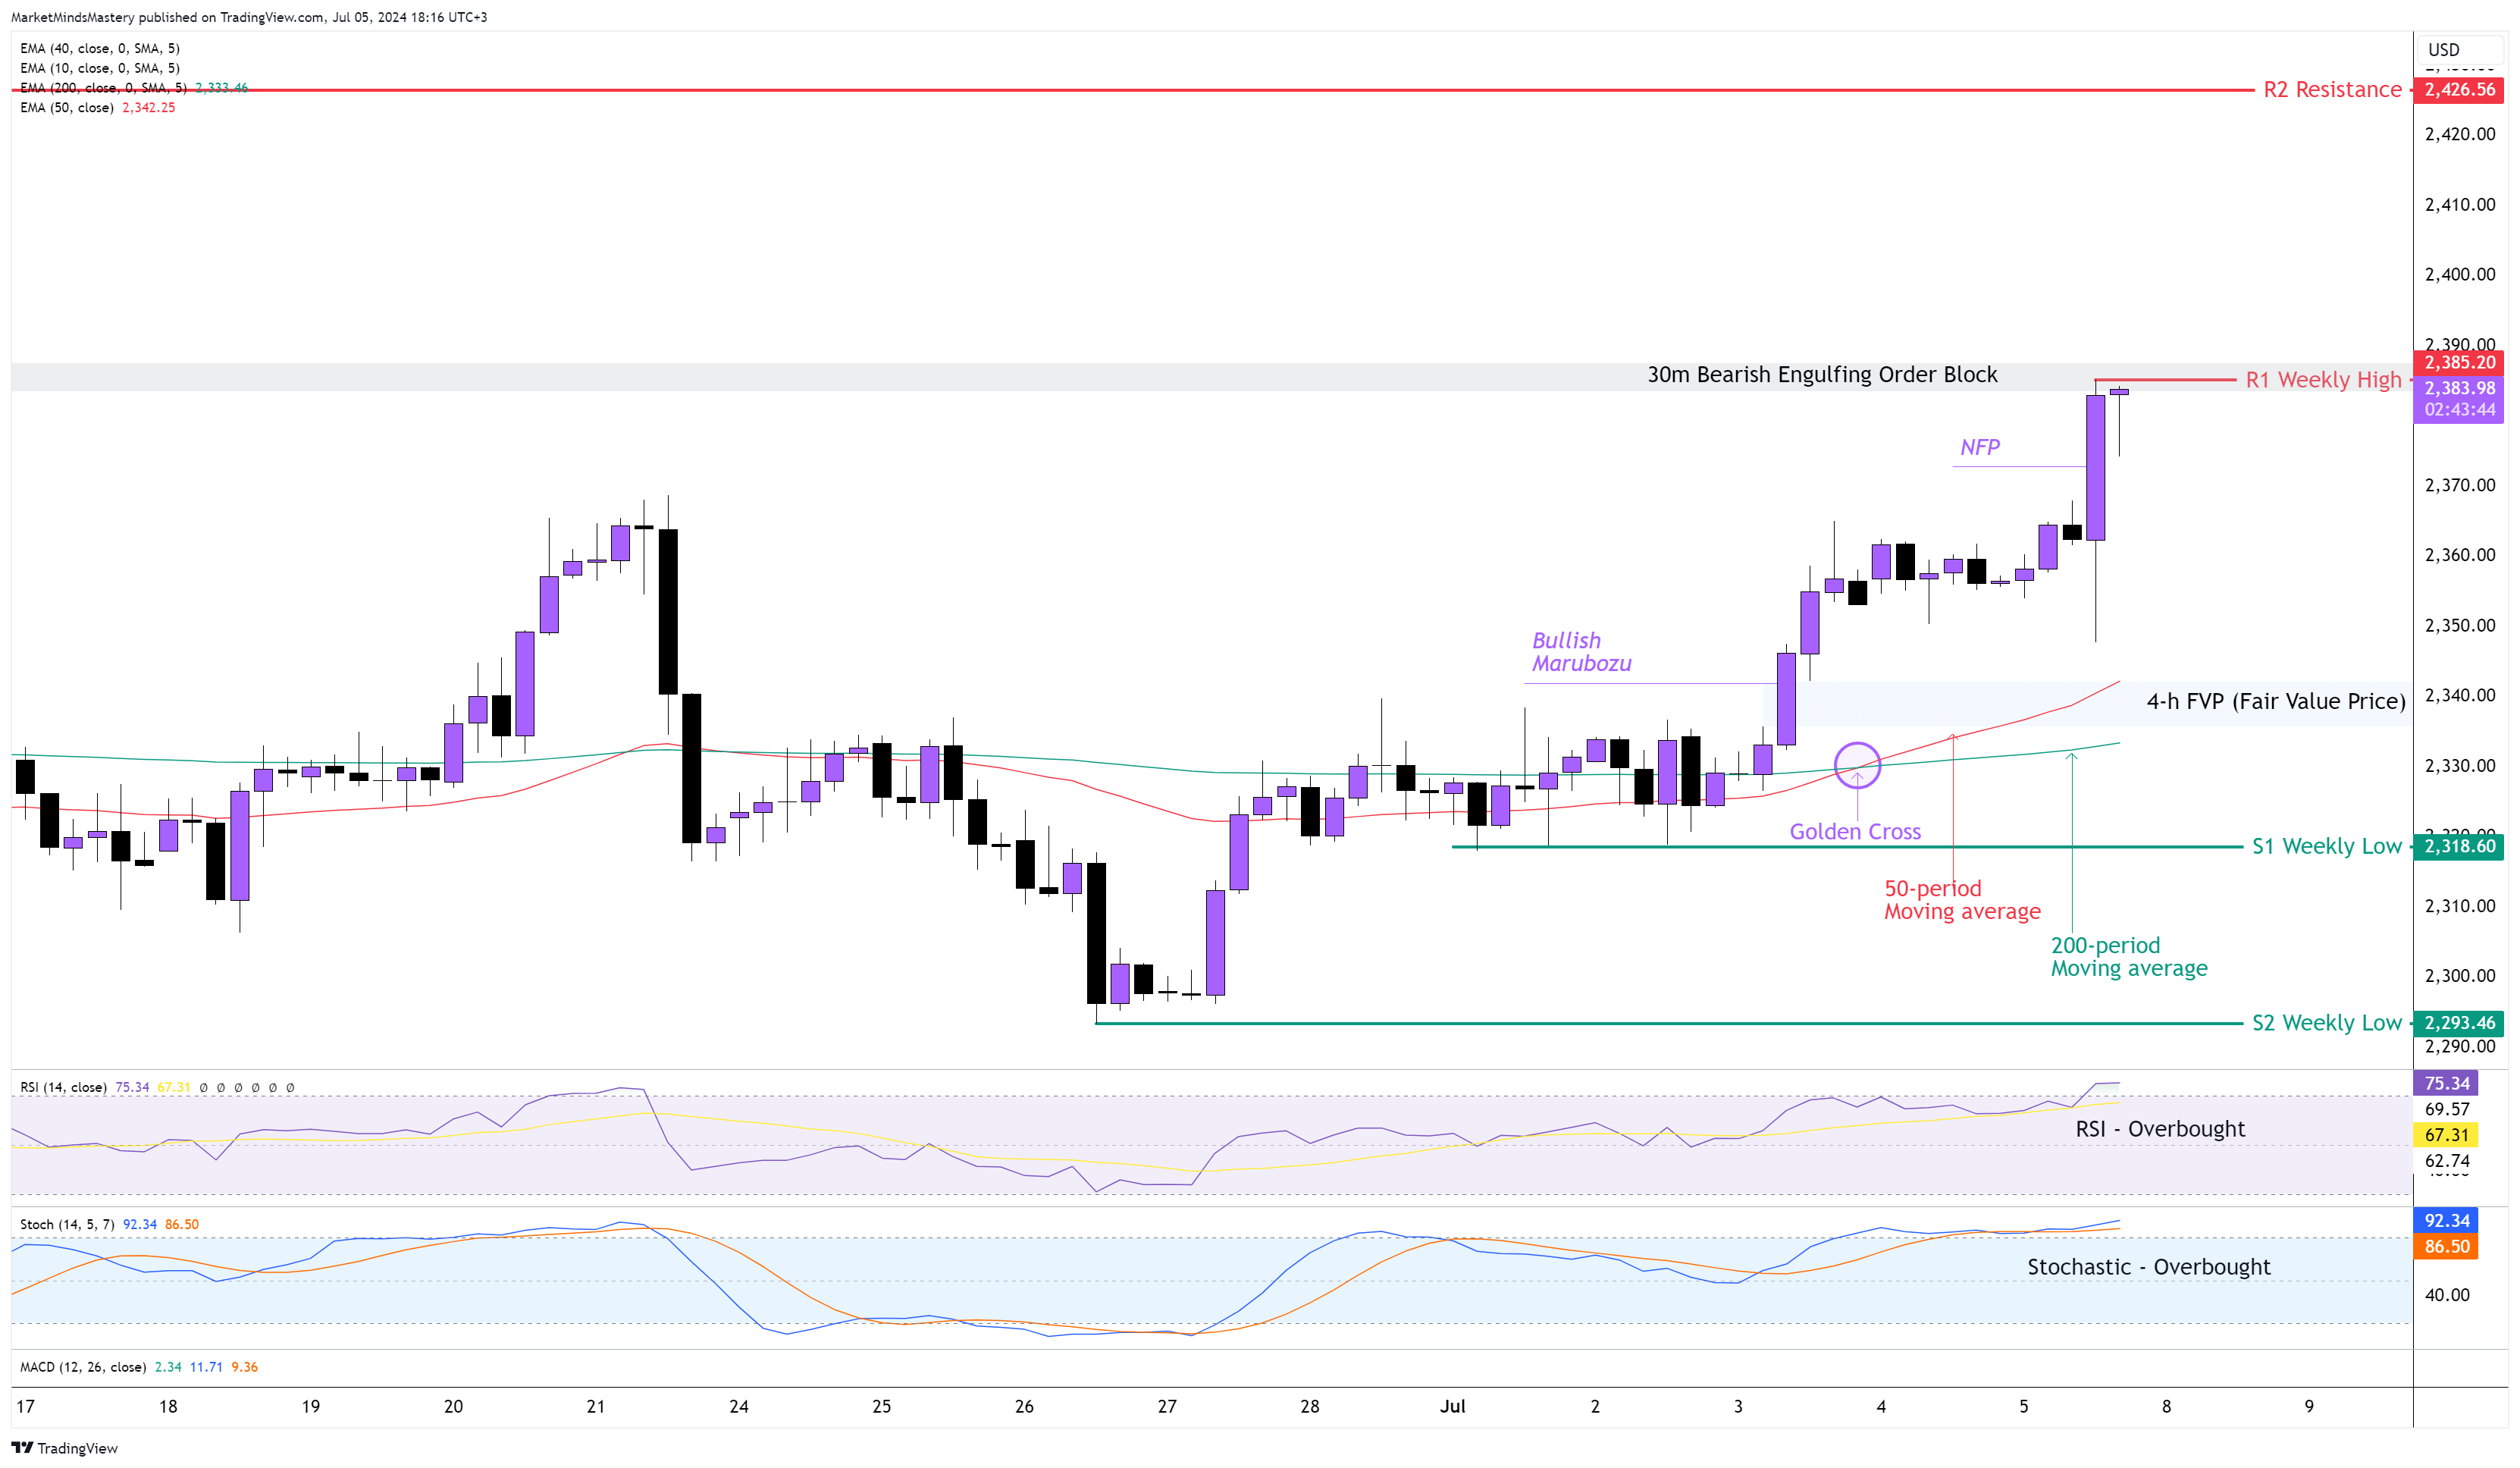
GOLD 4H
Following the previous week’s Doji candle at a weekly area of support, and as per the swing analysis, the price moved upwards. The NFP last Friday favoured the USD. However, the market didn't follow through, and the price kept increasing.
On the 4-hour chart, the price “filled up” the FVP we marked on the previous week’s market outlook. During its upward move, the market created a Bullish Marubozu candle. At the same time, the price left behind a new FVP, as shown in the chart. The price created a market uptrend with a series of higher highs and higher lows. The moving averages created a Golden Cross, which is a Bullish Crossover since the time the 50-period moving average crossed above the 200-period. The RSI and the Stochastic Oscillators are both above their upper extreme levels, making both of them Overboughts. This is an indication of a strong uptrending market. If the price continues to move upwards, the first resistance area, R1, will be the previous week’s high, around $2385. If the price penetrates the R1 and keeps increasing, the next resistance, R2, will be approximately $2426.
On the other hand, if the price is rejected and moves downwards, the first support area, S1, will be the previous week’s low, around $2318. If the price moves all the way to the S1, it means it will “fill” the FVP, and both the 50 and 200 periods will fail to provide dynamic price support. If the price declines further, the next support area, S2, will be another weekly lo, around $2293.
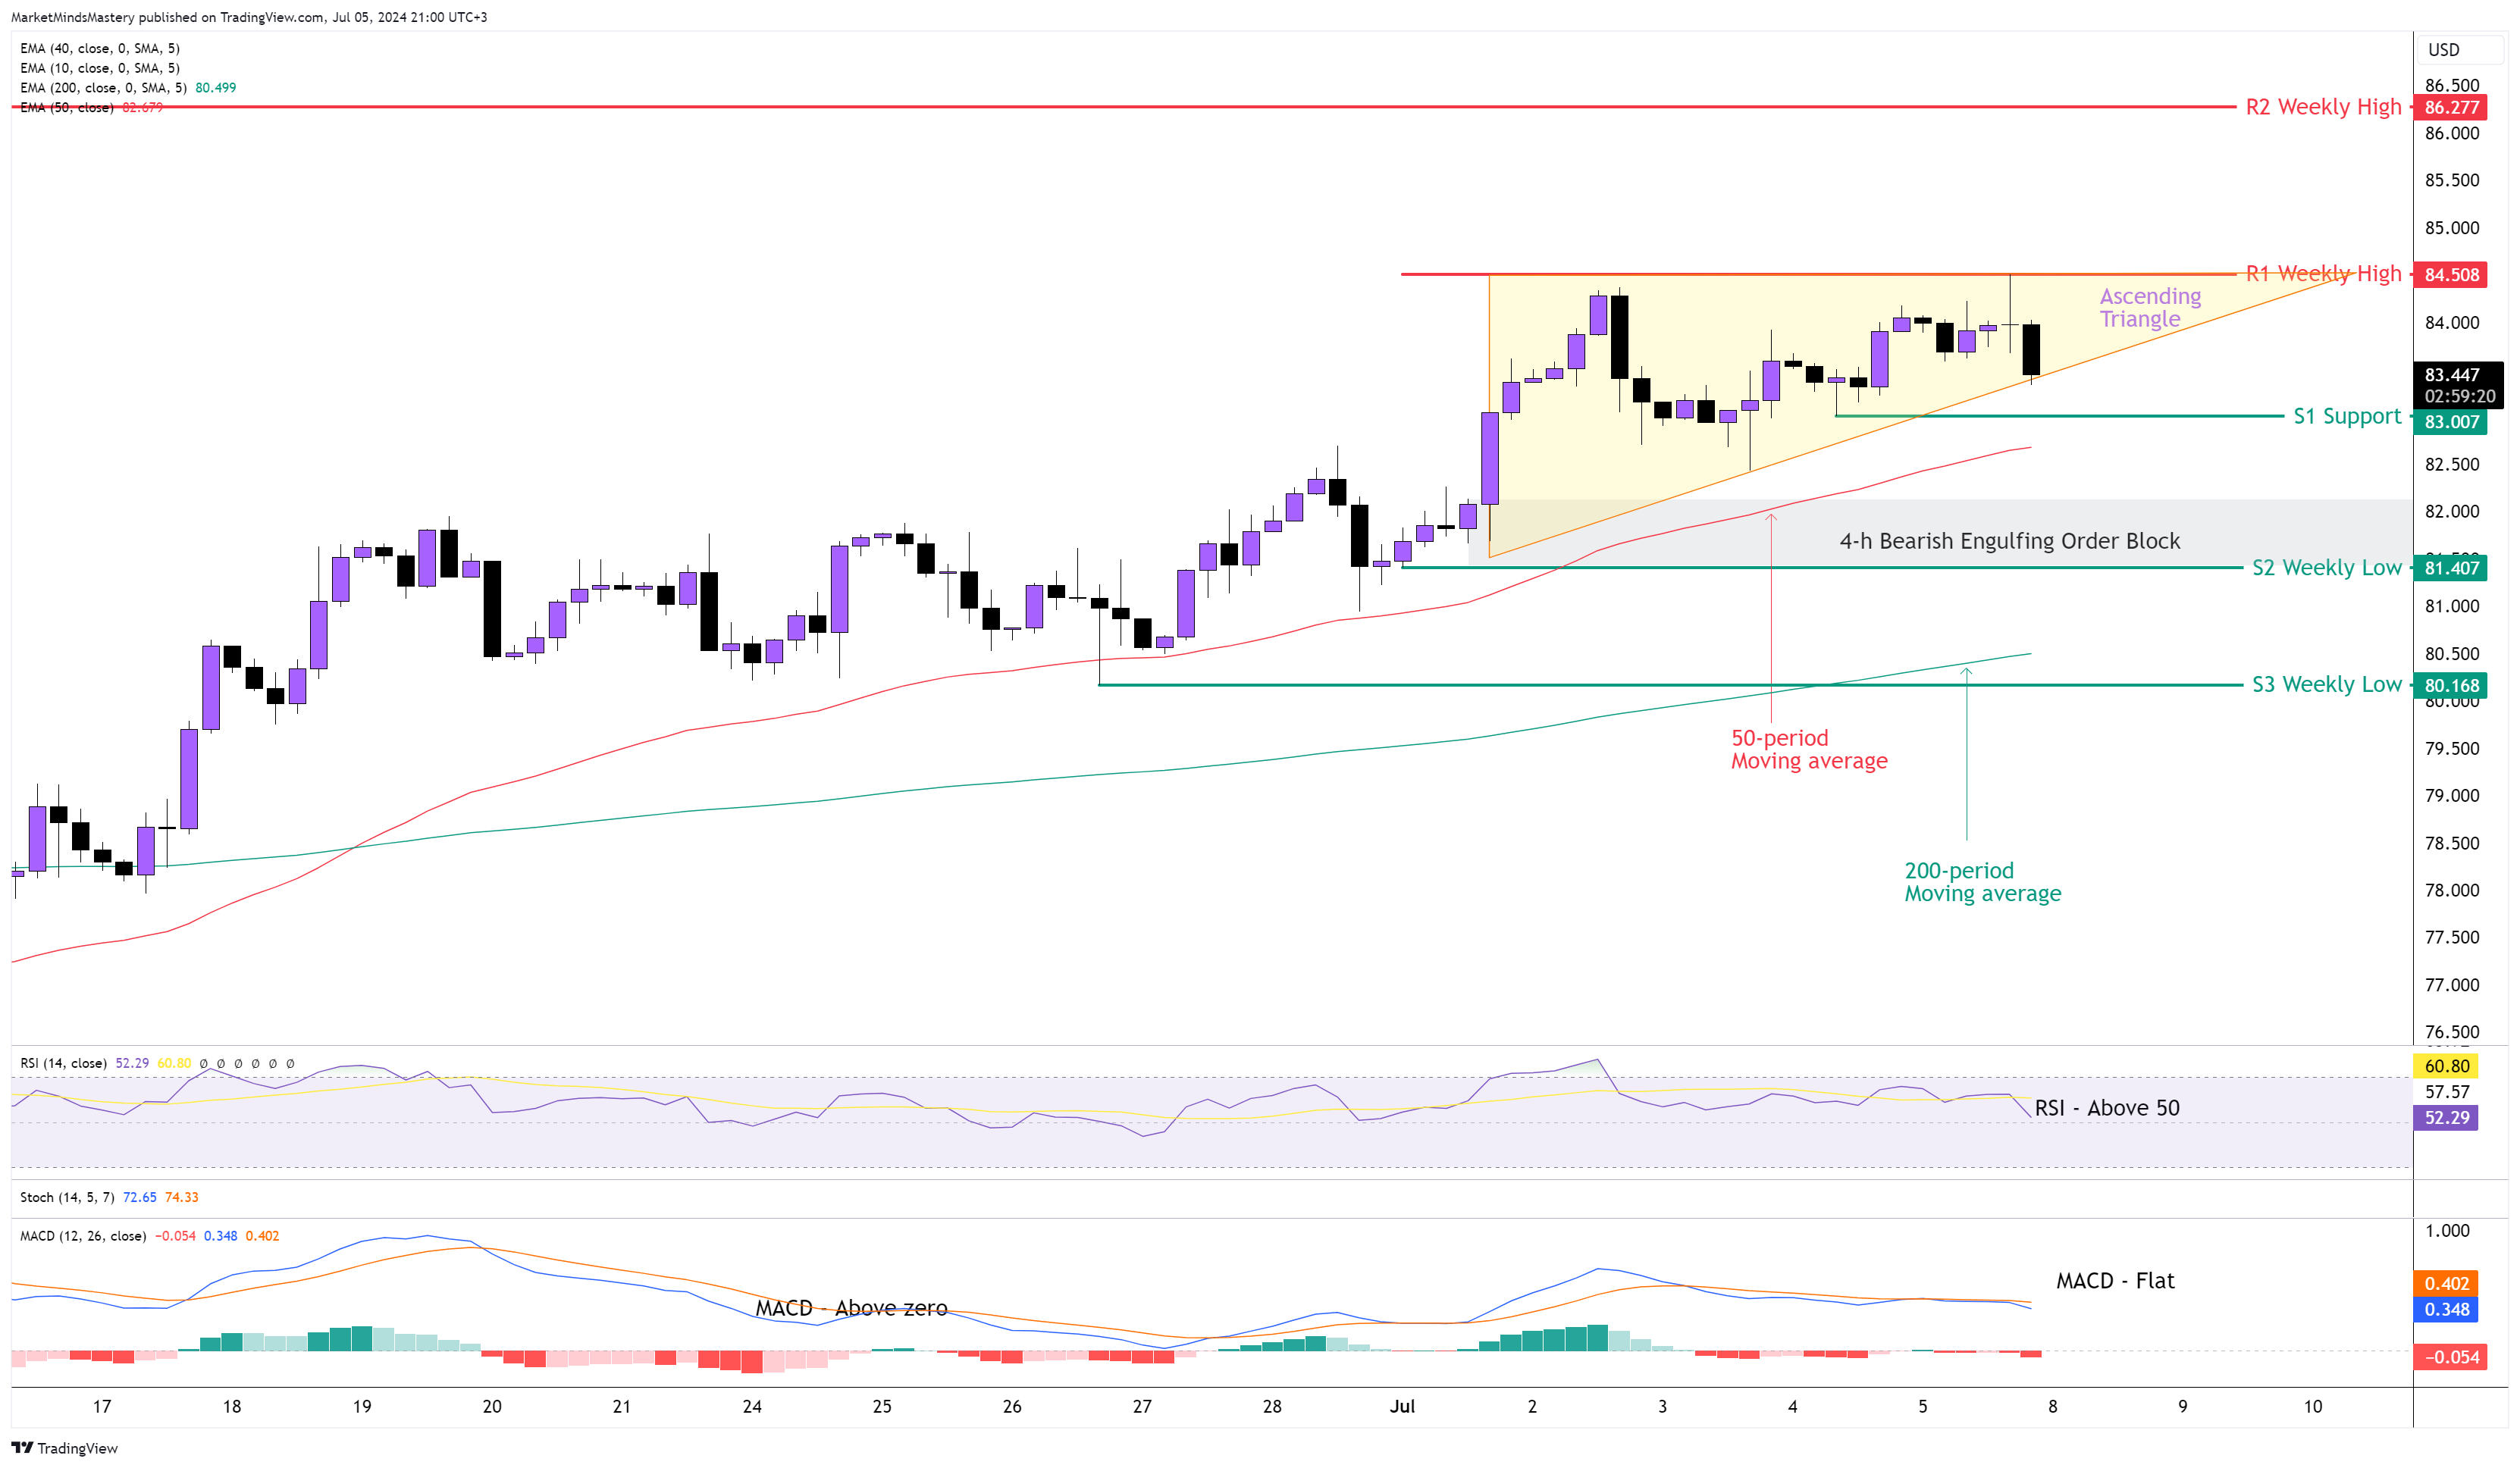
USOIL 4H
Following the successful upside breakout of the rectangle consolidation pattern last Monday, the price kept moving upward, creating a new higher high and higher low. The weekly candle closed as a Bullish Marubozu, with almost no upper and lower wicks.
Also, last week, on the 4-hour chart, the market created a Bullish Continuation pattern called an Ascending Triangle. The 50-period moving average is still above the 200-period, which is bullish. The MACD is flat and still above zero, which has bullish implications. The RSI Oscillator is above its middle line of 50, which is also bullish. If the market follows the bullish implications of the Ascending triangle and the price moves upwards, the first resistance area, R1, will be the previous week’s high, around $84.50. If the price breaks above the R1, the candle also closes above the price level, and the price keeps increasing, which means the uptrend will continue, the next resistance area, R2, will be another weekly high, approximately $86.27.
On the other hand, if the price is rejected and moves downwards, the first support area, S1, will be $83. If the price penetrates S1 and declines further, the next support, S2, will be the previous week’s low, around $81.40. This price level was created last Monday as a Bullish Engulfing Order Block, and it can provide additional price support. The fact that the 50-period moving average interacts with this price level can also add more weight to the level. If the price penetrates the S2 and keeps lowering, the next support, S3, will be around $80.16.
BTC USD 4H
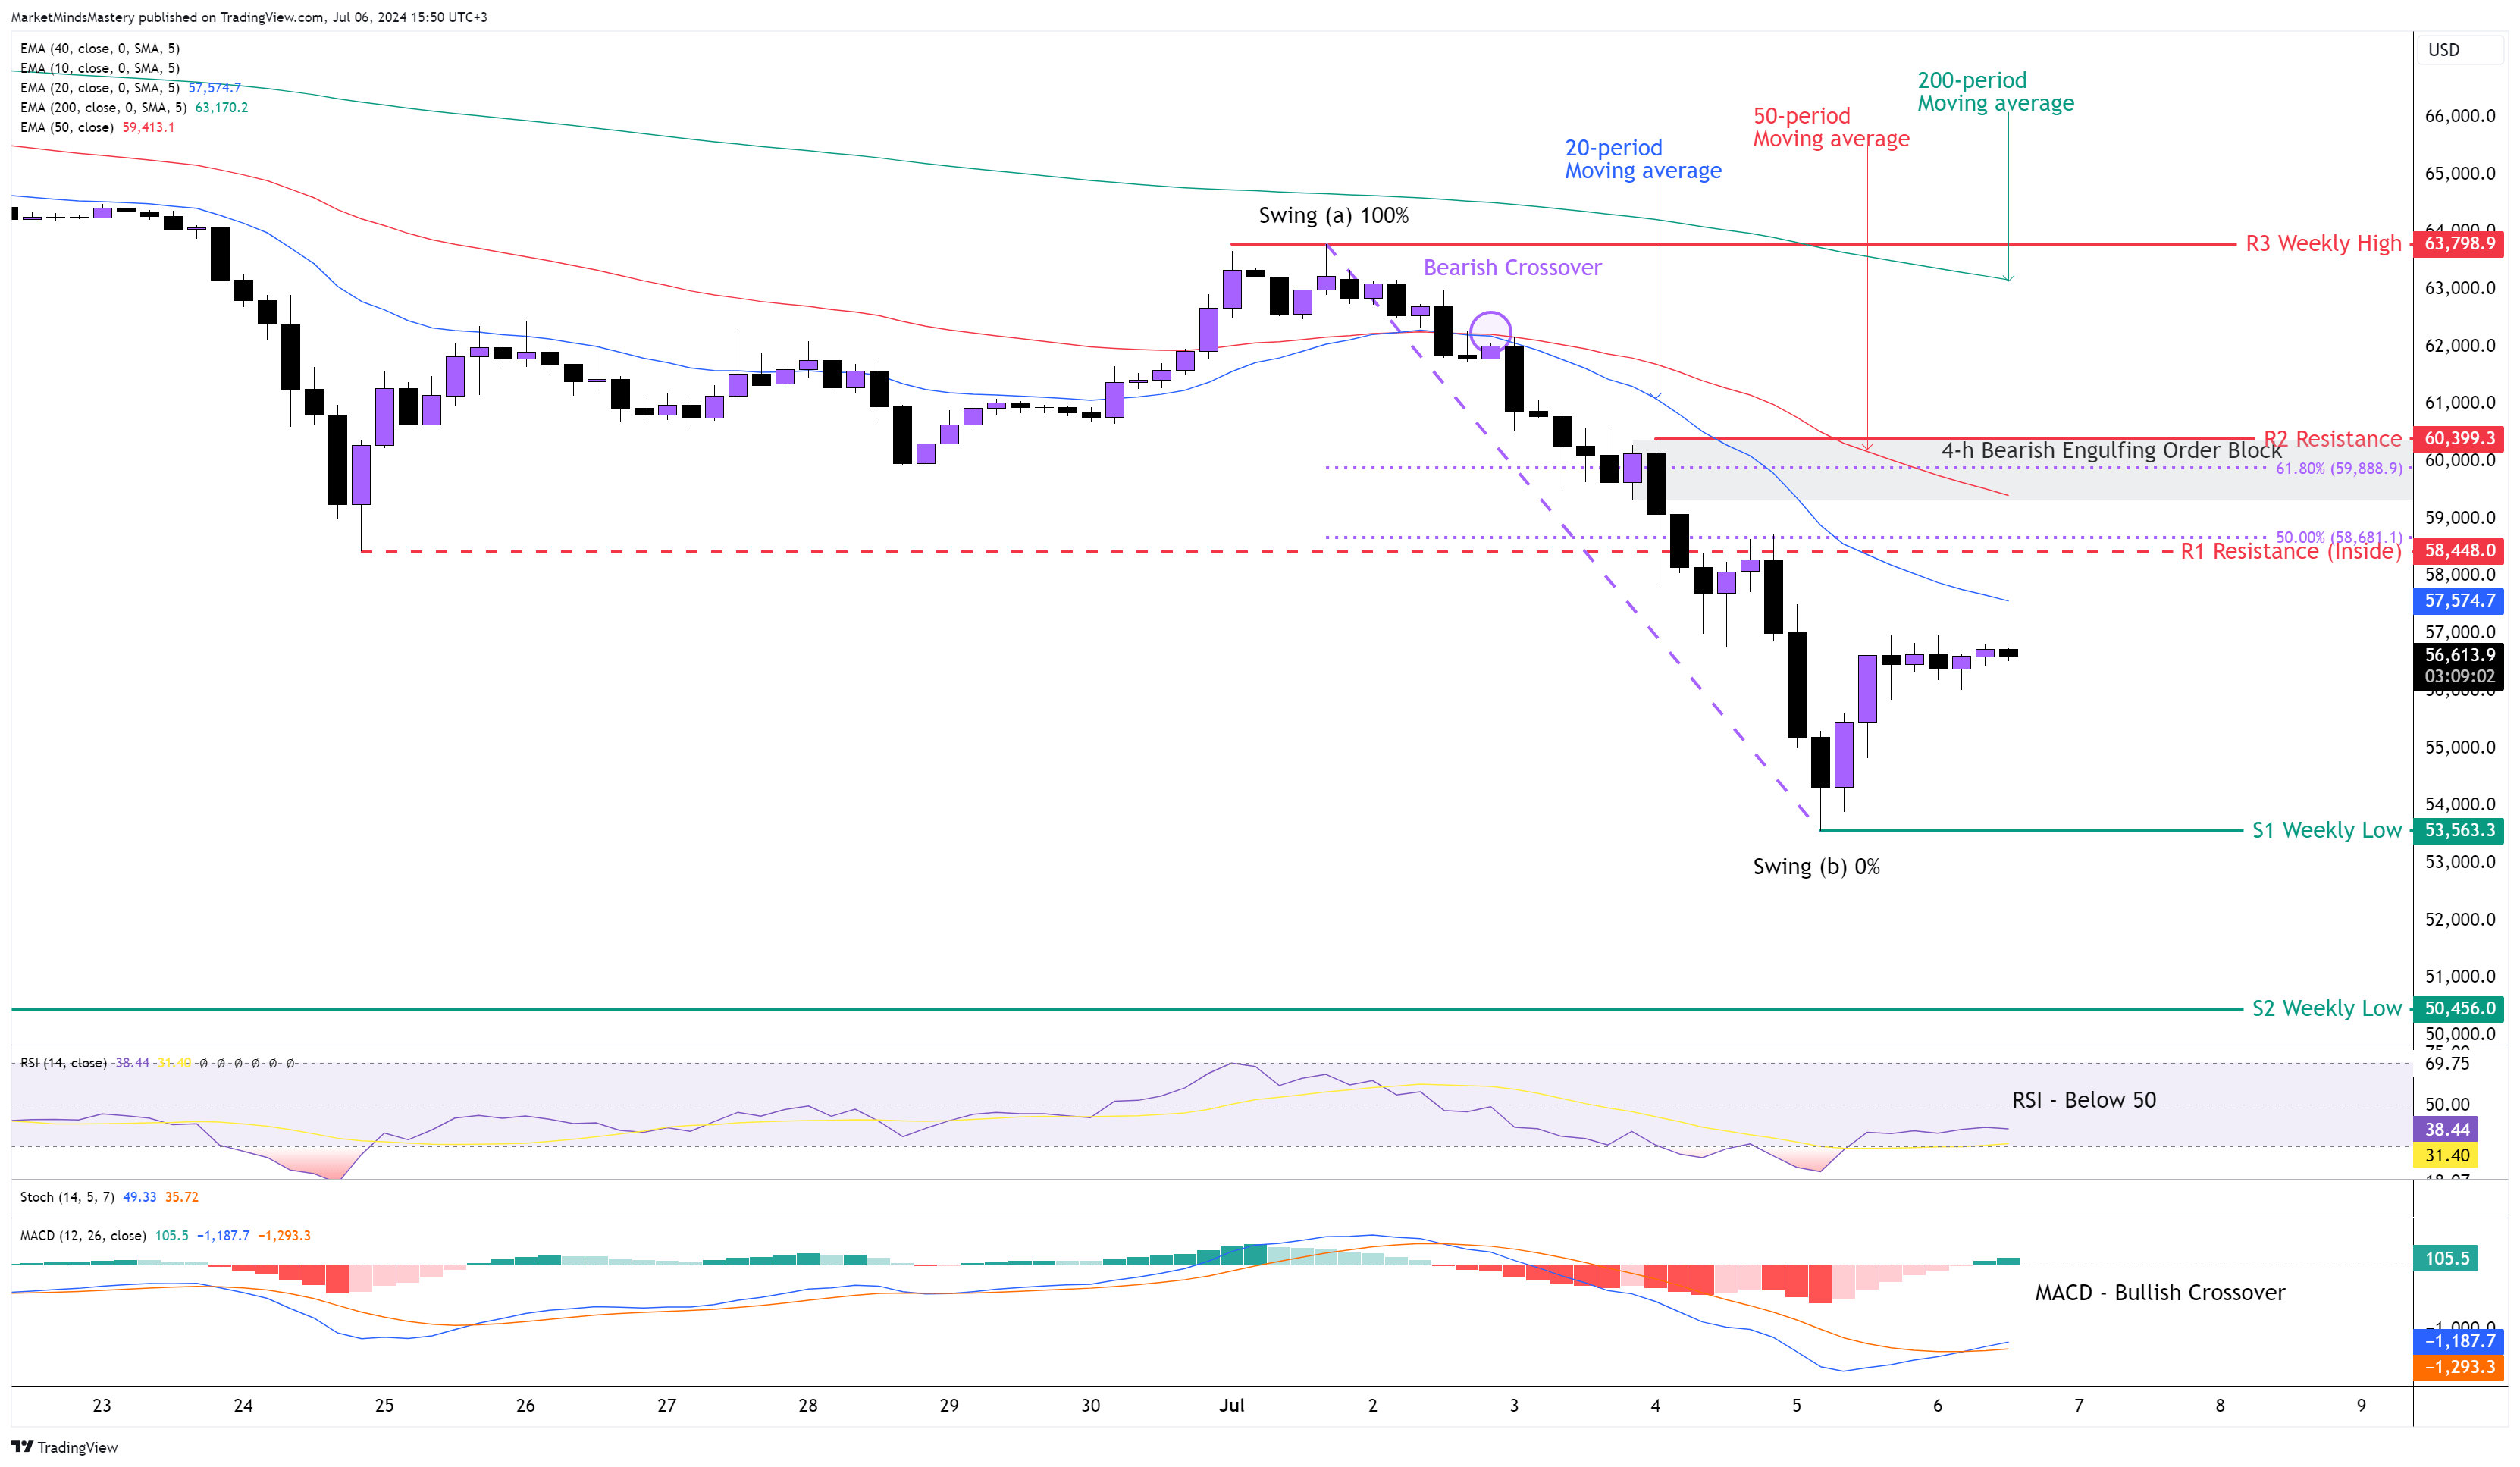
Following last week’s price move, the weekly chart ended as a Bearish Engulfing Candle. This means that the sell orders primarily dominated this market. The weekly candle has a long black body compared to the surrounding candles, indicating that the market experienced a strong sell-off.
On the 4-hour chart, the price maintained a robust downward trend, as expected, with the bearish (black) candles being much larger than the bullish candles.
The 20-period crossed below the 50-period, which is a bearish crossover. The 50-period is kept below the 200-period moving average, which is also bearish.
Following the oversold condition of the RSI last Friday, the oscillator is trading now below zero, which has bearish implications. The MACD is also below zero but with a bullish crossover as the MACD line (Blue) crosses above the Signal line (Orange).
The downtrend is still intact, so the price is expected to move downwards. In this case, the first area of support, S1, will be around $53563, the previous week’s low. If the price penetrates the S1 and keeps lowering, the next support area, S2, will be around $50456, which is also a weekly low price level.
On the other hand, if the price bounces off and moves upwards, the first resistance area, R1, will be the R1 inside resistance around $58448. This level is considered significant as it matches with the 50% Fibonacci retracement. If the price penetrates the R1 and keeps moving upwards. In that case, the next resistance, R2, will be the $60399, which is another significant level because it consists of not only the static level of resistance but also the Fibonacci Golden Ratio 61.8%, the 50-period moving average and the Bearish Engulfing Order Block.
SP 500 4H
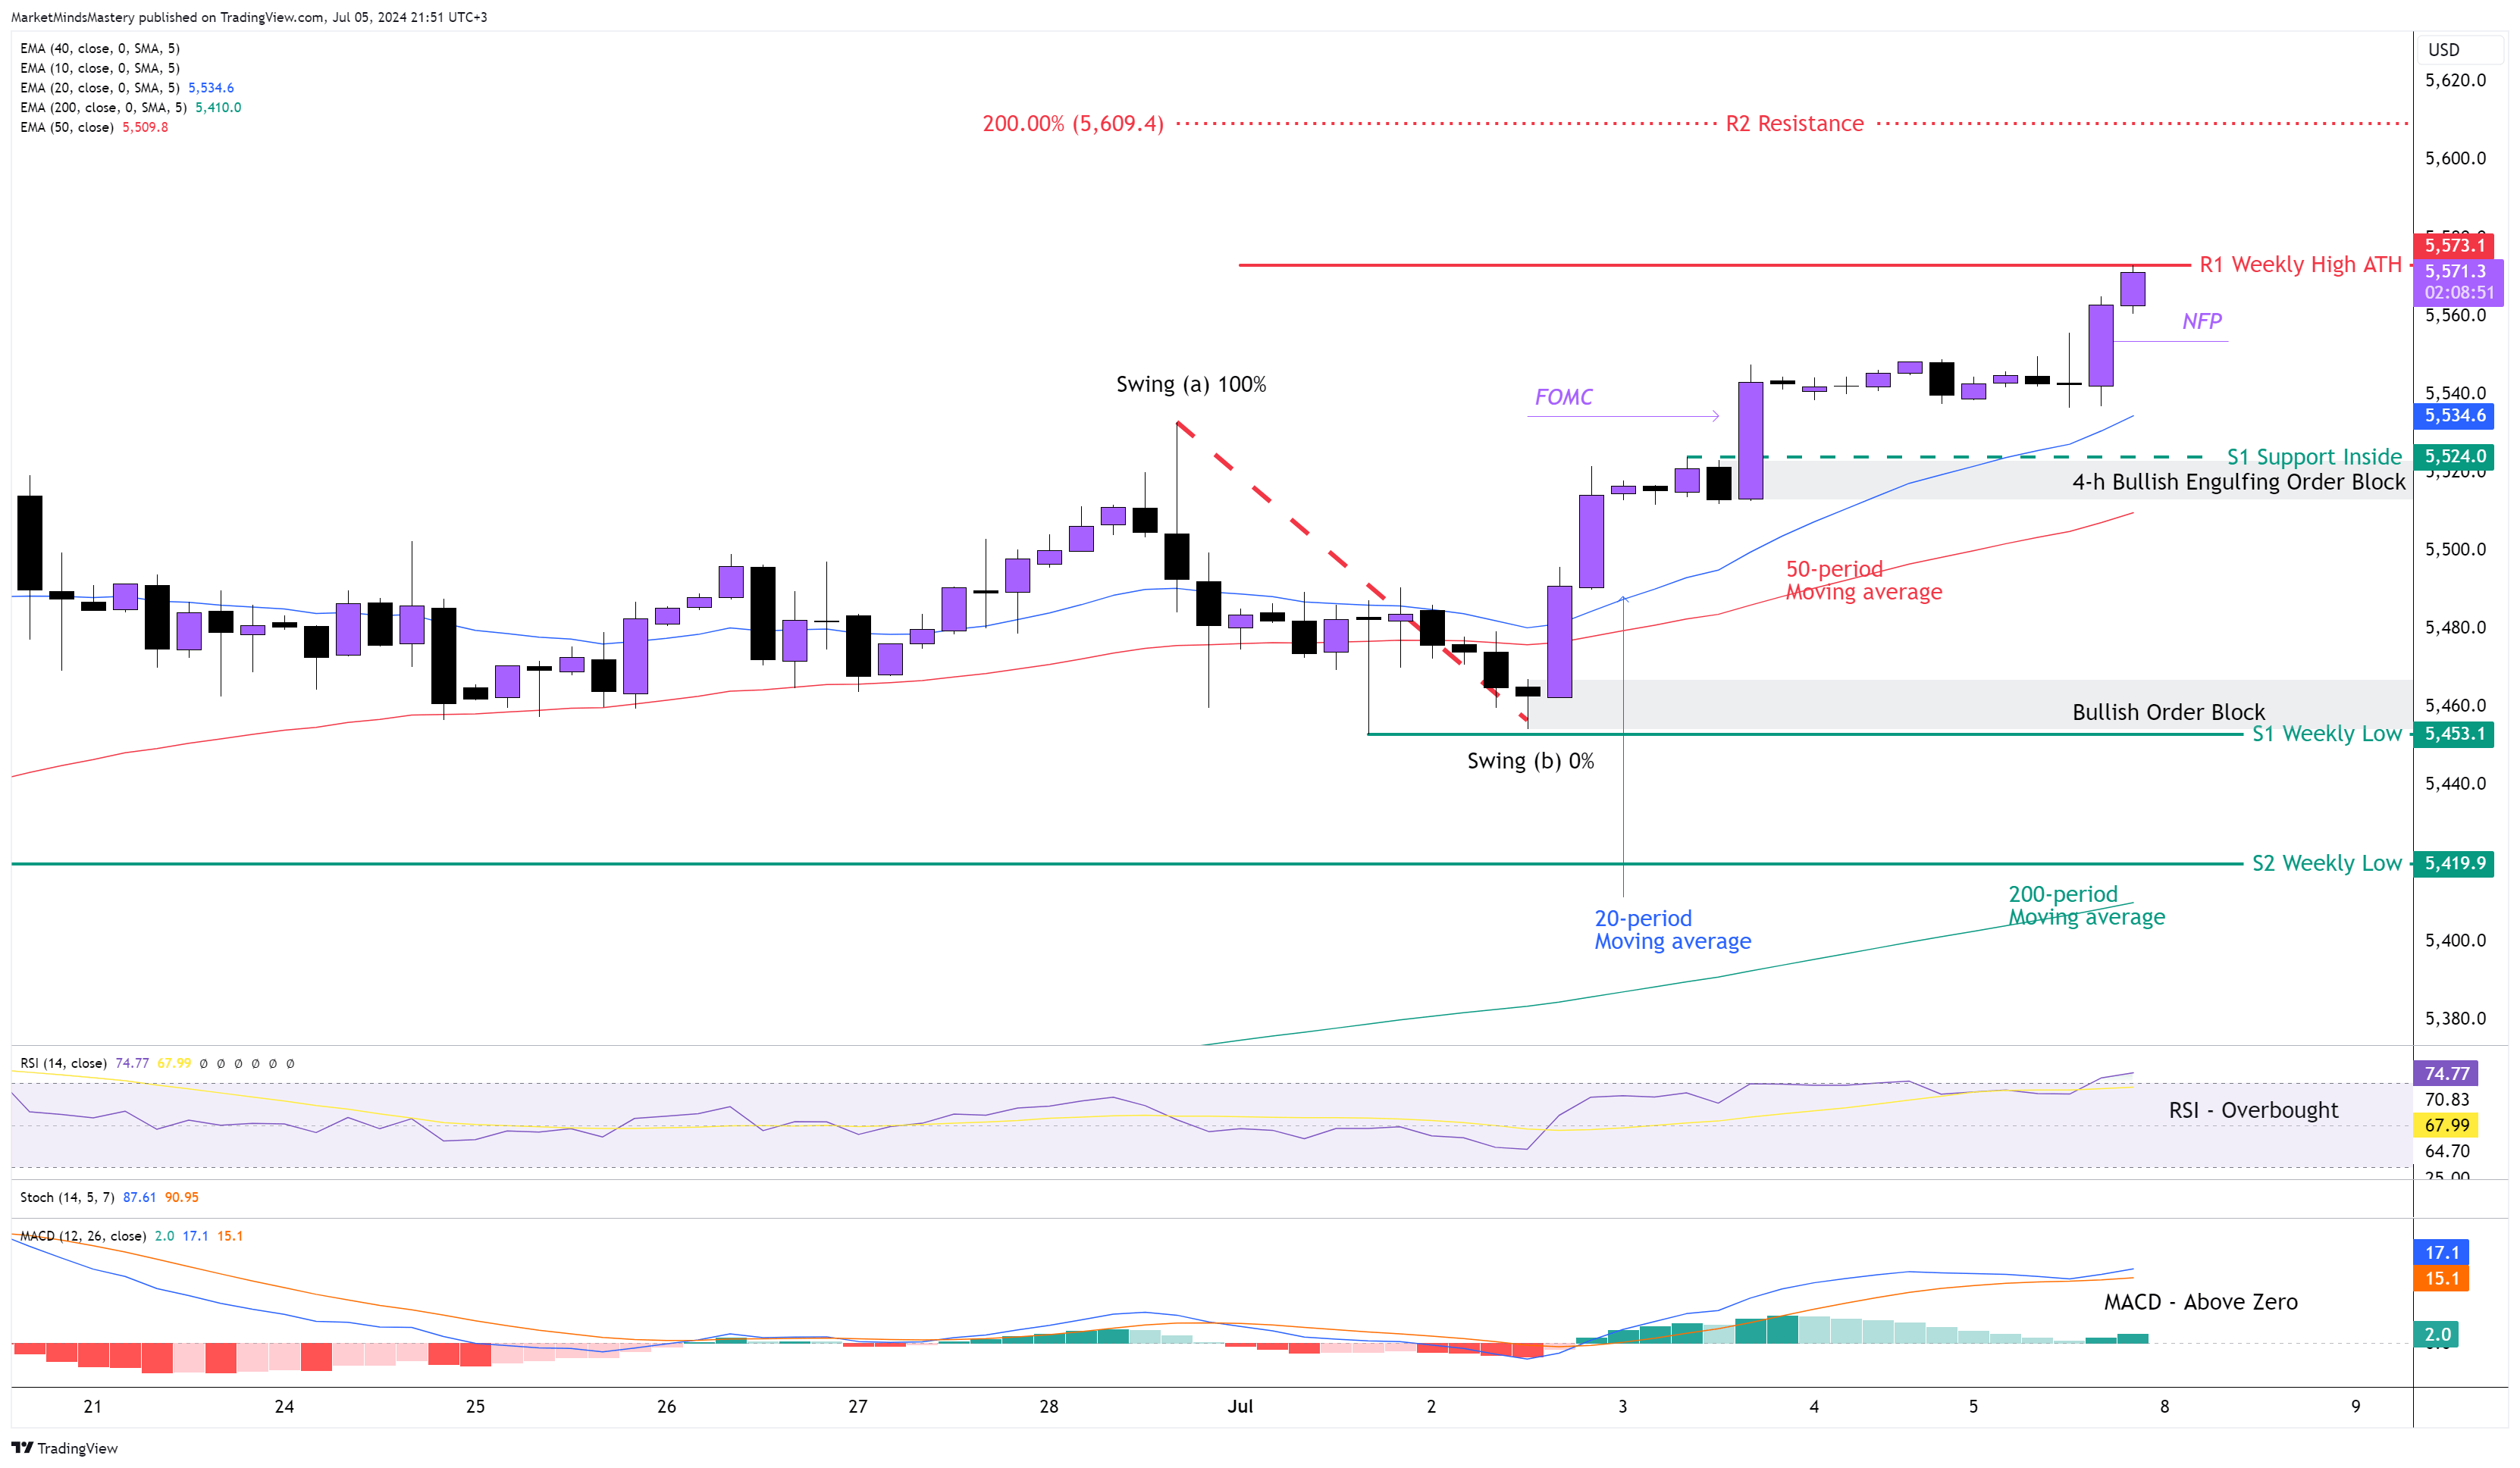
In continuation of the previous week’s market outlook, the price reached the final target, which was projected by the 200% Fibonacci Extension, and created a new ATH (All-Time High).
On the 4-hour chart, the price created a series of higher highs and lower lows, which is bullish. The 20-period moving average is well above the 50-period, and they are both above the 200-period moving average. This is an indication of a strong uptrend. The RSI Oscillator became overbought, which confirms the strong upward move. The MACD is above zero with a rising Histogram. If the price continues its upward move, the first thing it needs to do is penetrate the R1 resistance, which is not only the previous week’s high but also the ATH. If the candle closes above R1 and the price keeps increasing, the next resistance area, R2, will be estimated to be around 200% Fibonacci Extension, which is approximately $5609.
Conversely, if the price is rejected and moves downwards, the first support area, S1, will be an inside support around $5524. Just below the S1 support, there is a Bullish Engulfing Order Block. A further decline will find the next support area, S2, around $5453, which is the previous week’s low.
US 30 4H
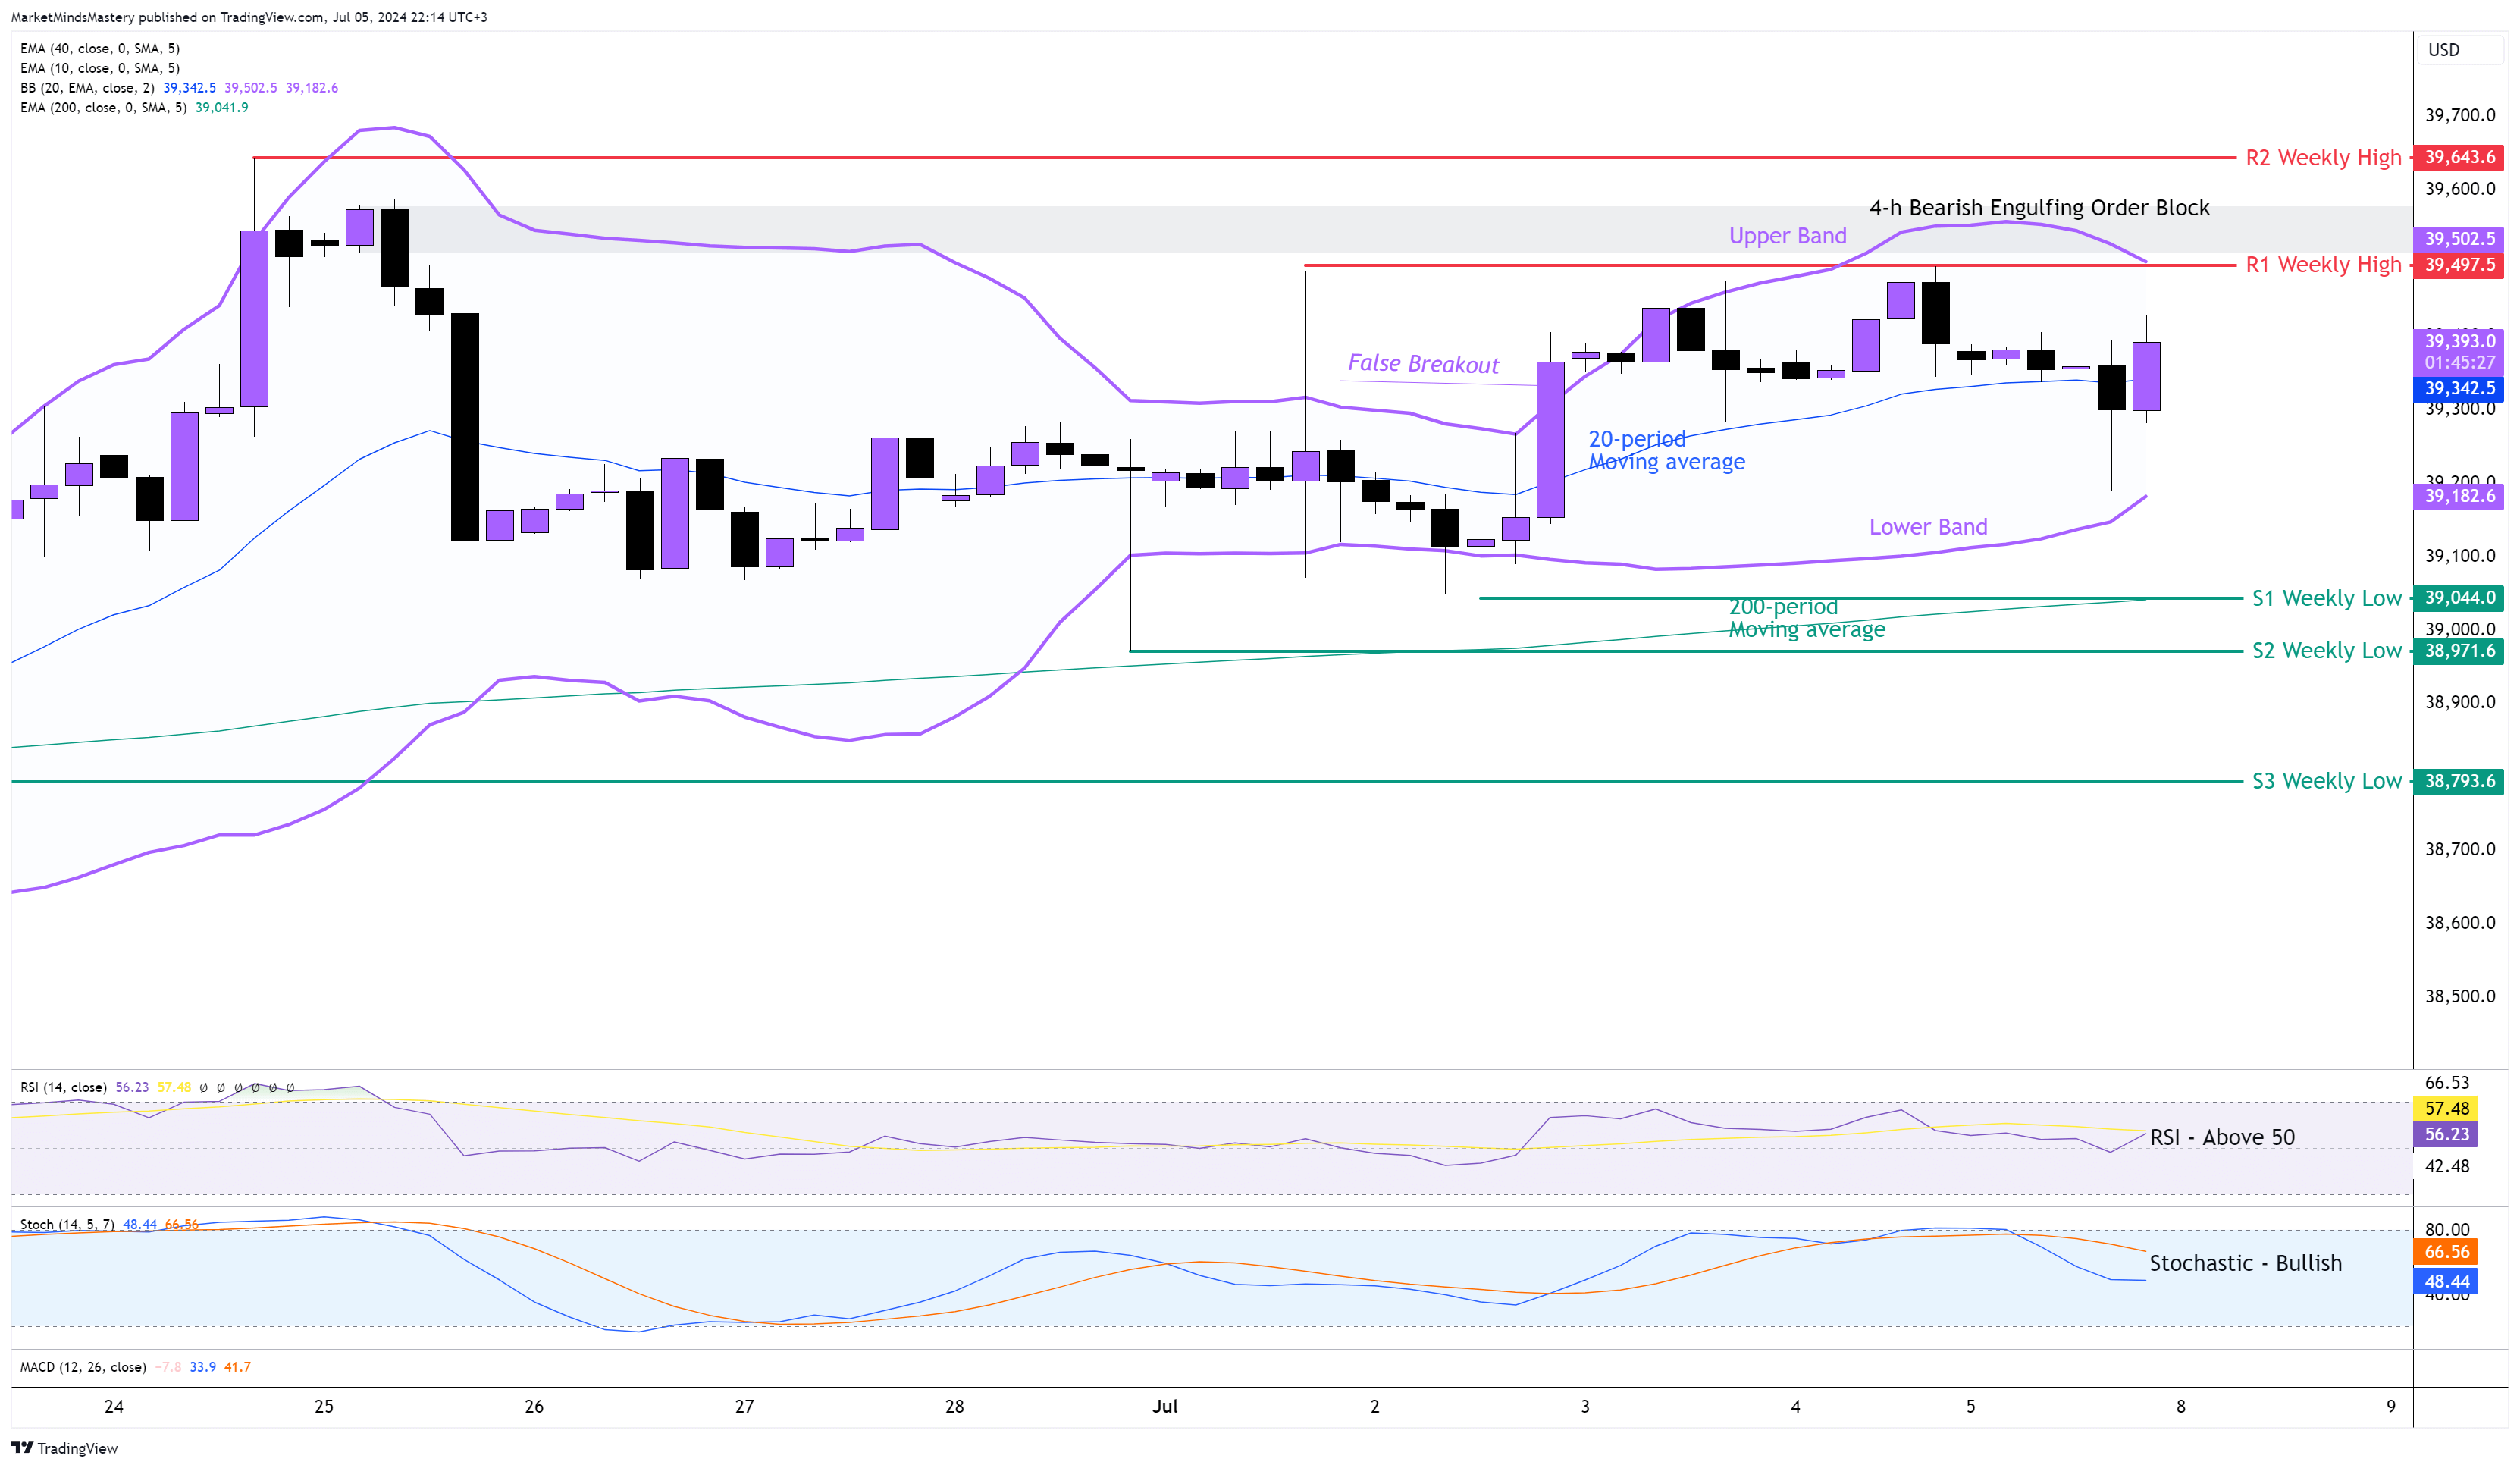
Following the previous week’s market outlook, the price did not make any directional move and ended as an Inside Weekly Candle. This is one of the rare occasions in the markets that, within a week, the market structure remains very similar to the last one. Last Tuesday, the price tried to break outside of the Upper Band and perhaps “walk the band” but immediately pulled inside the Bollinger Band. Although the price remains above the 20-period moving average, it is still considered a trendless, ranging market because no defined higher highs or lower lows were made in order to determine a trend. Therefore, in this case, the 20-period as well as the 200-period moving averages can be used primarily as dynamic support and resistance levels rather than trend filter indicators.
If the price finds support at the 20-period moving average and moves upwards, the first resistance area, R1, will be around 39497. This is the previous week’s high, and it also clusters with the Upper Band of the Bollinger Band indicator. If the price penetrates this level, the candles close above it, and the market rallies, the next resistance area will be the R2 at around 39643. This level is not only a weekly high level, but it is also below the Bearish Engulfing Order Block, which can add weight to the resistance area. In case the price declines and moves downwards, the S1 support around 39044 will be the first support level, which is close to the lower Band. If the price penetrates the S1 and declines further, the next support area, S2, will be around 38971.
GER 30, 4H
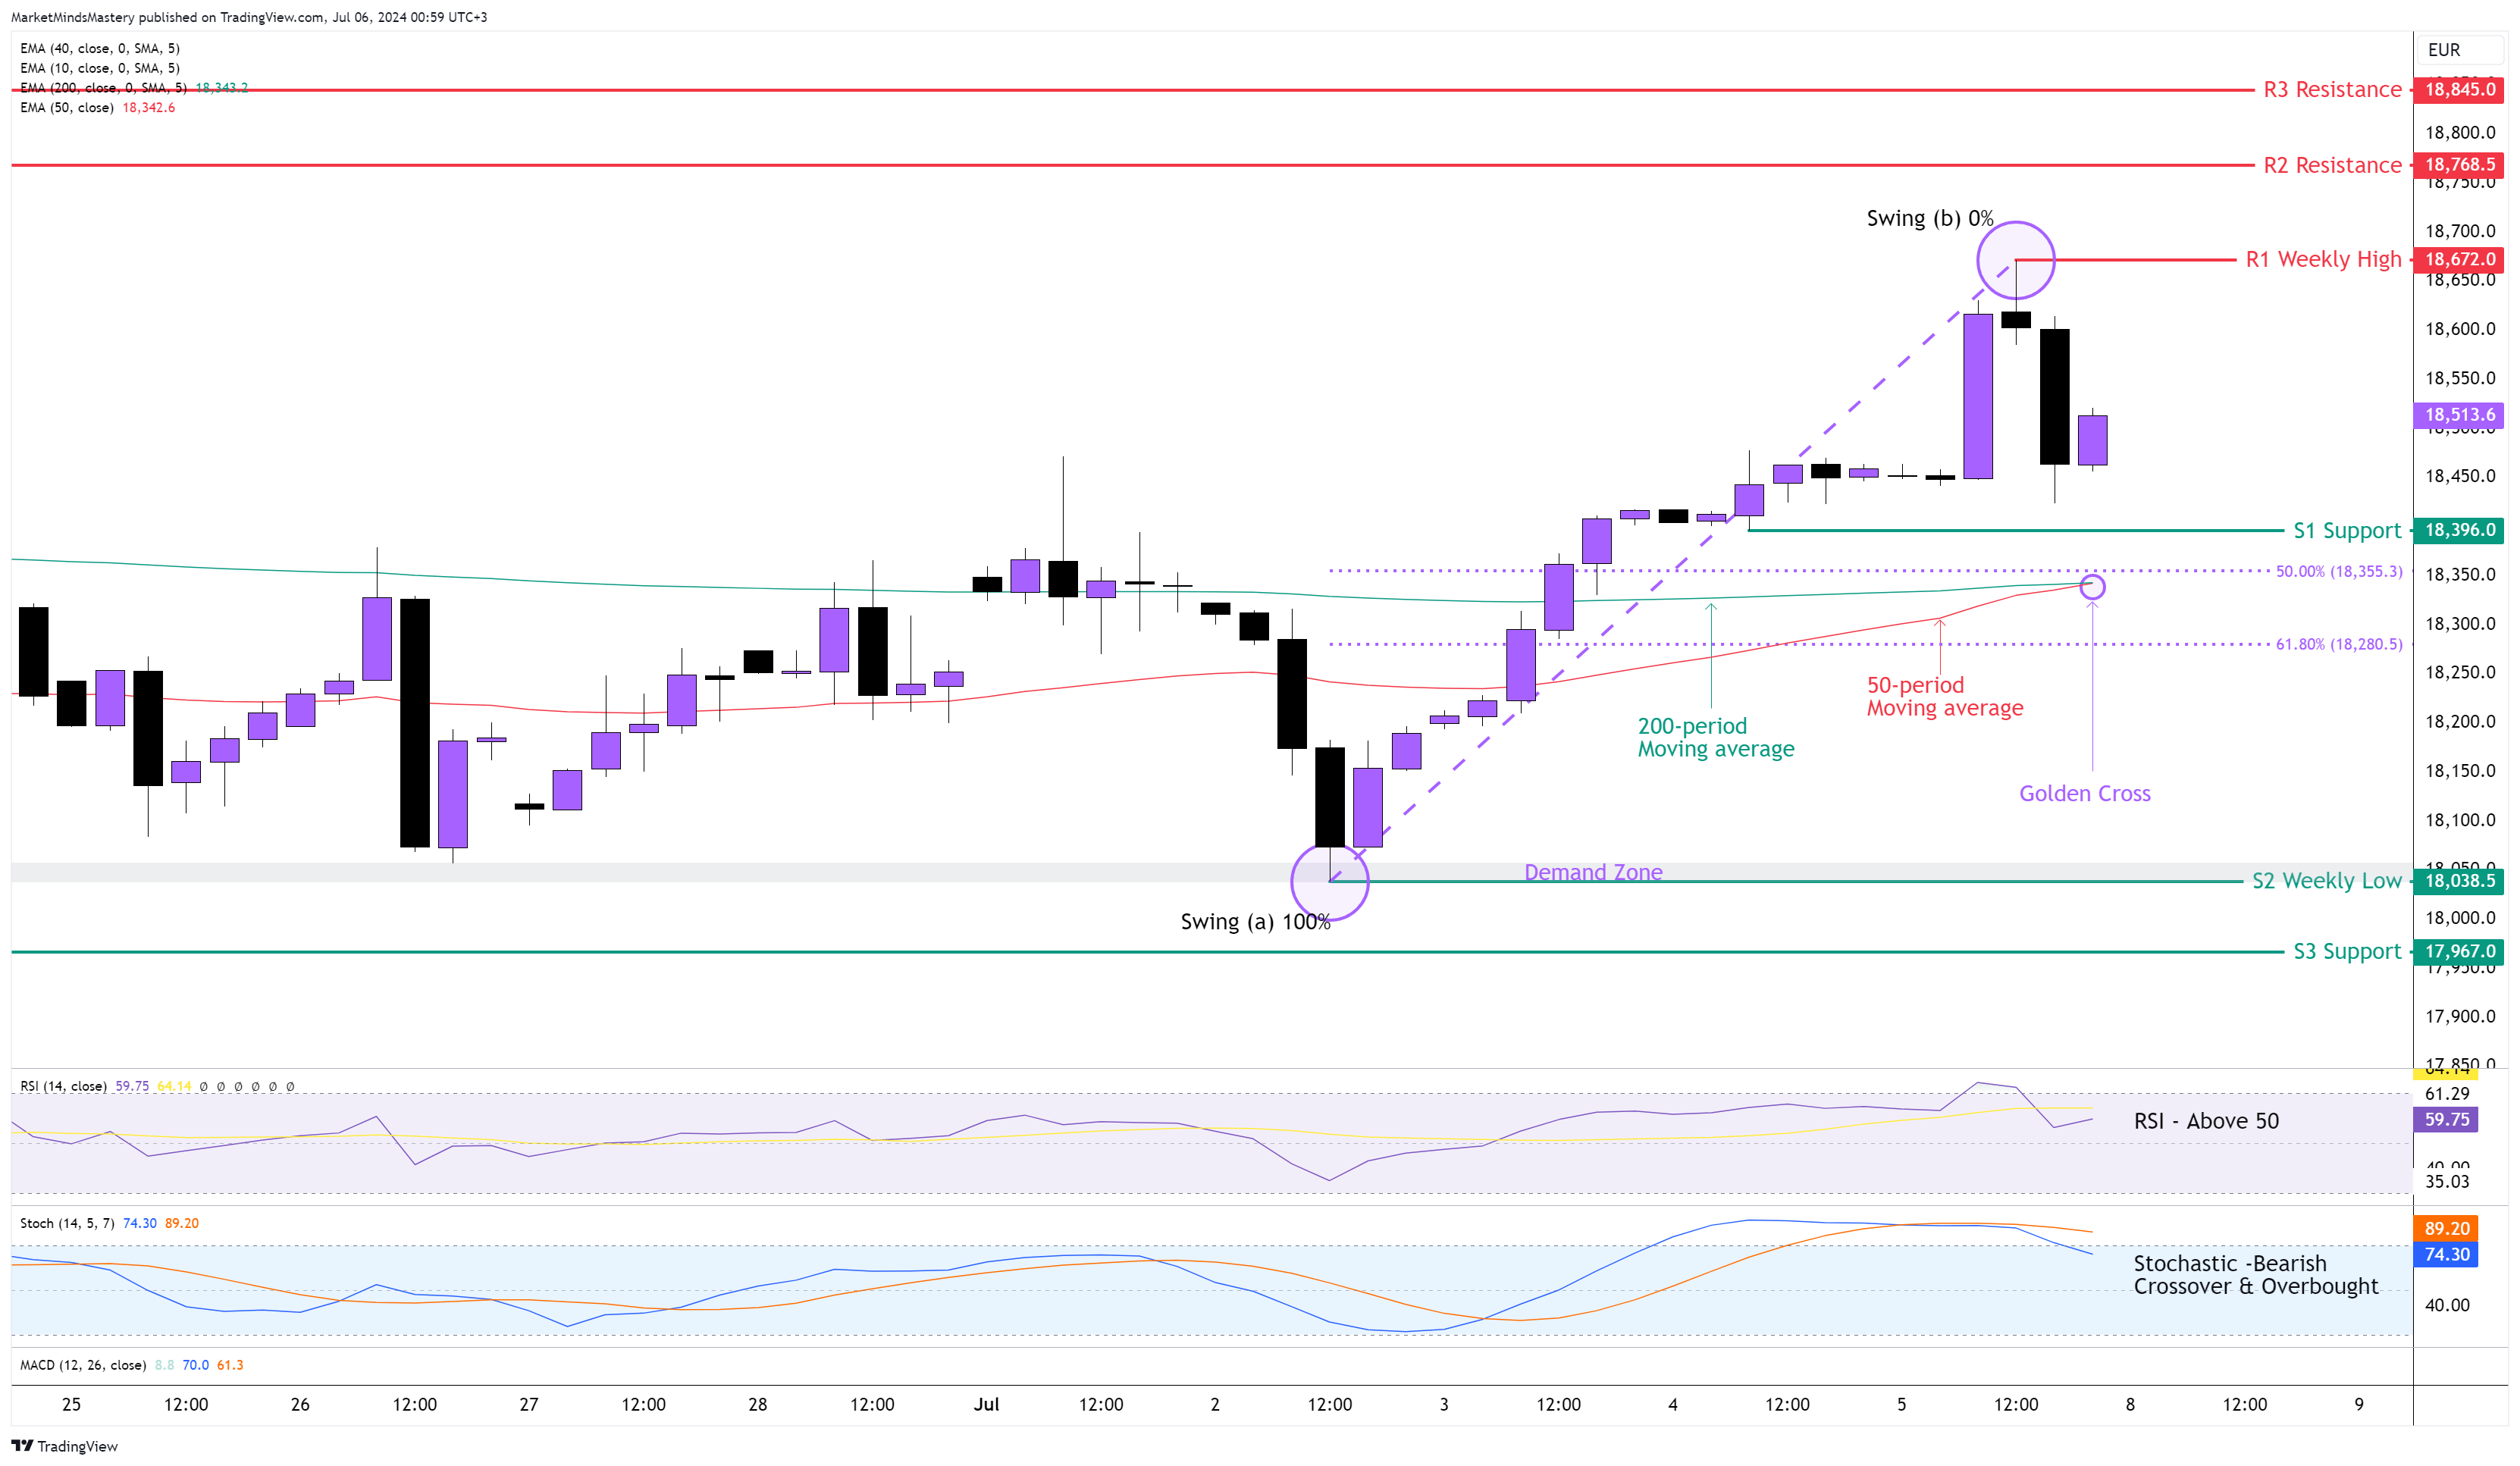
The price of the major Indicy GER30 broke above the range consolidation last week, creating a directional upward move. Obviously, the weekly candle ended up being a bullish candle with a close above the previous weekly candle high. The higher high on the 4-hour chart caused the Stochastic Oscillator to become Overbought, confirming the market’s Bullishness. The 50-period just crossed above the 200-period moving average, which is called “The Golden Cross”, and it has bullish implications. The RSI is above 50, and it is considered bullish. The Stochastic created a Bearish Crossover in an overbought area, which means that the %K line (blue) crossed below the %D line (orange), and it has bullish implications.
Currently, the price found resistance and was rejected at an old weekly high around 18641. Therefore, if the price enters a corrective phase, the first expected support is the S1 around 18396, which is very close to the Fibonacci 50% price level. In this area, both moving averages can add additional support. If the price penetrates the S1 and declines further, the next support area, S2, will be the previous week’s low, around 18038. A further downward move finds the next S3 support, approximately 17967.
On the other hand, if the price finds support, bounces off, and moves upwards, the first resistance area, R1, will be the previous week's high around 18672. If the price penetrates the R1 and increases more, then the next resistance areas, R2 and R3, will be around 18768 and 18845, respectively. Both these Resistance areas are old weekly highs.