Out of all major currencies, the Australian dollar was the strongest in the market last week. That was primarily due to the interest rates a few weeks ago, and also, the boost in confidence came from the increase in the CPI (Consumer Price Index) last Wednesday. It is worth saying that the forecast estimated a 0.2% increase, which, in the end, the CPI increased by 0.5%, reaching 4%. Despite the rise in the CPI in Japan from 2.25%, it rose to 2.3%. The Japanese Yen remained one of the weakest currencies in the markets. On Monday, we expected to see some increased volatility in the Greenback, primarily due to the presidential debate last Friday.
Monday is the first of July, and the markets will get active again. Volatility is expected to start picking up during the London Trading Session. Starting from the Asian session, the Tankan Large Manufacturing Index for the second quarter will be reported in Japan and is expected to remain above 0. Currently, it is at 11, and a positive number can be bullish for the Yen as it shows that the large manufacturing companies in Japan are performing well, which positively impacts the Japanese economy. The Caixin Manufacturing Index PMI in China is expected to remain above 50, which will be positive for the Chinese Yuan. The banks will be closed in Canada due to the Canada Day bank holidays.
Next, in Germany, the CPI (Consumer Price Index) will be reported, and it is expected to increase from 0.1% to 0.2%. As we mentioned a few times, a rise in the Consumer Price Index is favourable for the currency, but at the same time, the consumers end up spending more to buy the same stuff they used to buy previously. The last significant event for the Euro will be the speech of the European Central Bank’s President Lagarde. It will be a two-day speech.
The last significant event for the day will be the ISM Manufacture PMI in the US. The consensus shows a small increase from 48.7 to 49. Although the number can remain below 50, the volatility around the event is expected to be noticeable.
On Tuesday, the RBA (Reserve Bank of Australia) will report the Meeting Minutes, and we will find out how they see the future of Australia’s economy. Based on the Interested Rates report a few weeks ago and the CPI last week, there is positivity around the Aussie. The Euro is expected to experience its highest volatility around midday, and during the London trade session, the Harmonized Index of Consumer Prices is expected to drop. As it currently is at 2.6%, the forecast shows a drop to 2.5%. If this happens and the market follows through, there is a high probability of weakness in the Euro. This means that any strength that comes from the Australian dollar or the US dollar can push the Euro in both pairs, the EURAUD and EURUSD, respectively, lower. Last will be the Fed’s Chairman Powell speech during the New York Trading Session.
The Retail Sales in Australia will be the first significant event on Wednesday. The forecast shows overall positivity. The previous month’s report was 0.1%, and this time, the consensus forecast is 0.3%. If the actual number confirms the forecast number and the market follows through, then the Australian Dollar might appreciated by traders and investors. The markets will become more active during the New York trading session as the ADP Employment Change will be reported in the US. An increase from 152K to 170K is given in the forecast. This will be an early indication of what the NFP on Friday will be. Lately, we noticed that based on the actual reported numbers, there is a very low correlation between the ADP and the NFP. Therefore, traders need to be aware of this, as it does not necessarily mean that a positive ADP will automatically guarantee a positive NFP. A few hours later, the ISM Services PMI will be reported, and the forecast shows a small drop from 53.8 to 52.5. The fact that the number may remain above 50 will be an overall bullish indication for the USD despite the intraday volatility and price fluctuation during the event. Today will be the last day of ECB’s President Lagarde speech, and the day will end with the FOMC Minutes in the US. This time, due to the intense political activity in the US, the markets may react in a not-expected way around these events. Perhaps the charts will spike with an increased amount of volatility. Therefore, a careful risk approach is good to consider when trading around these events.
The Sterling will be on the scope for Thursday as the Parliamentary elections will be happening for the whole day. Usually, trading carefully with a calculated risk around these events is good to consider. In Australia, the trade balance is expected to increase from 6.548 B to 6.678 B. Usually, this event causes increased volatility in the Australian dollar as Australia has intense importing and exporting activity. The next event will be the CPI in Switzerland. The forecast shows a change of 1.4%. If this will follow the weakness of the Swissy from last month’s Interest Rates, it might going to send the Swiss Frank lower. Lastly, the Baniks in the US will be closed due to the country's Independence Day. This means that low volatility and perhaps low liquidity are expected during the New York trading session.
The markets and the market participants will be more interested in this day. As it is the first Friday of July, the NFP (Non-Farm Payrolls) will be the single most important event traders are writing about. But before that, the Retail Sales in the Eurozone are currently 0%, and the forecast shows an increase to 0.6%. At this stage, despite the outcome, the EURUSD is usually most likely to be traded within a range in anticipation of the NFP outcome before it takes direction. Next, the Unemployment Rate in Canada is expected to increase from 6.2% to 6.3%. Usually, an increase in unemployment leads to a weak currency as the government has to pay more to those seeking unemployment benefits.
Last, in the US, hourly earnings are expected to increase from 0.3% to 0.4%, which can be good for the USD, but the NFP is forecasted to drop significantly from 272K to 180K. The price will move significantly if the actual number deviates considerably from the forecast number. After the actual number report of the NFP, the major currency pairs that are in trading ranges generally get a direction and develop trends.
EUR USD 4H

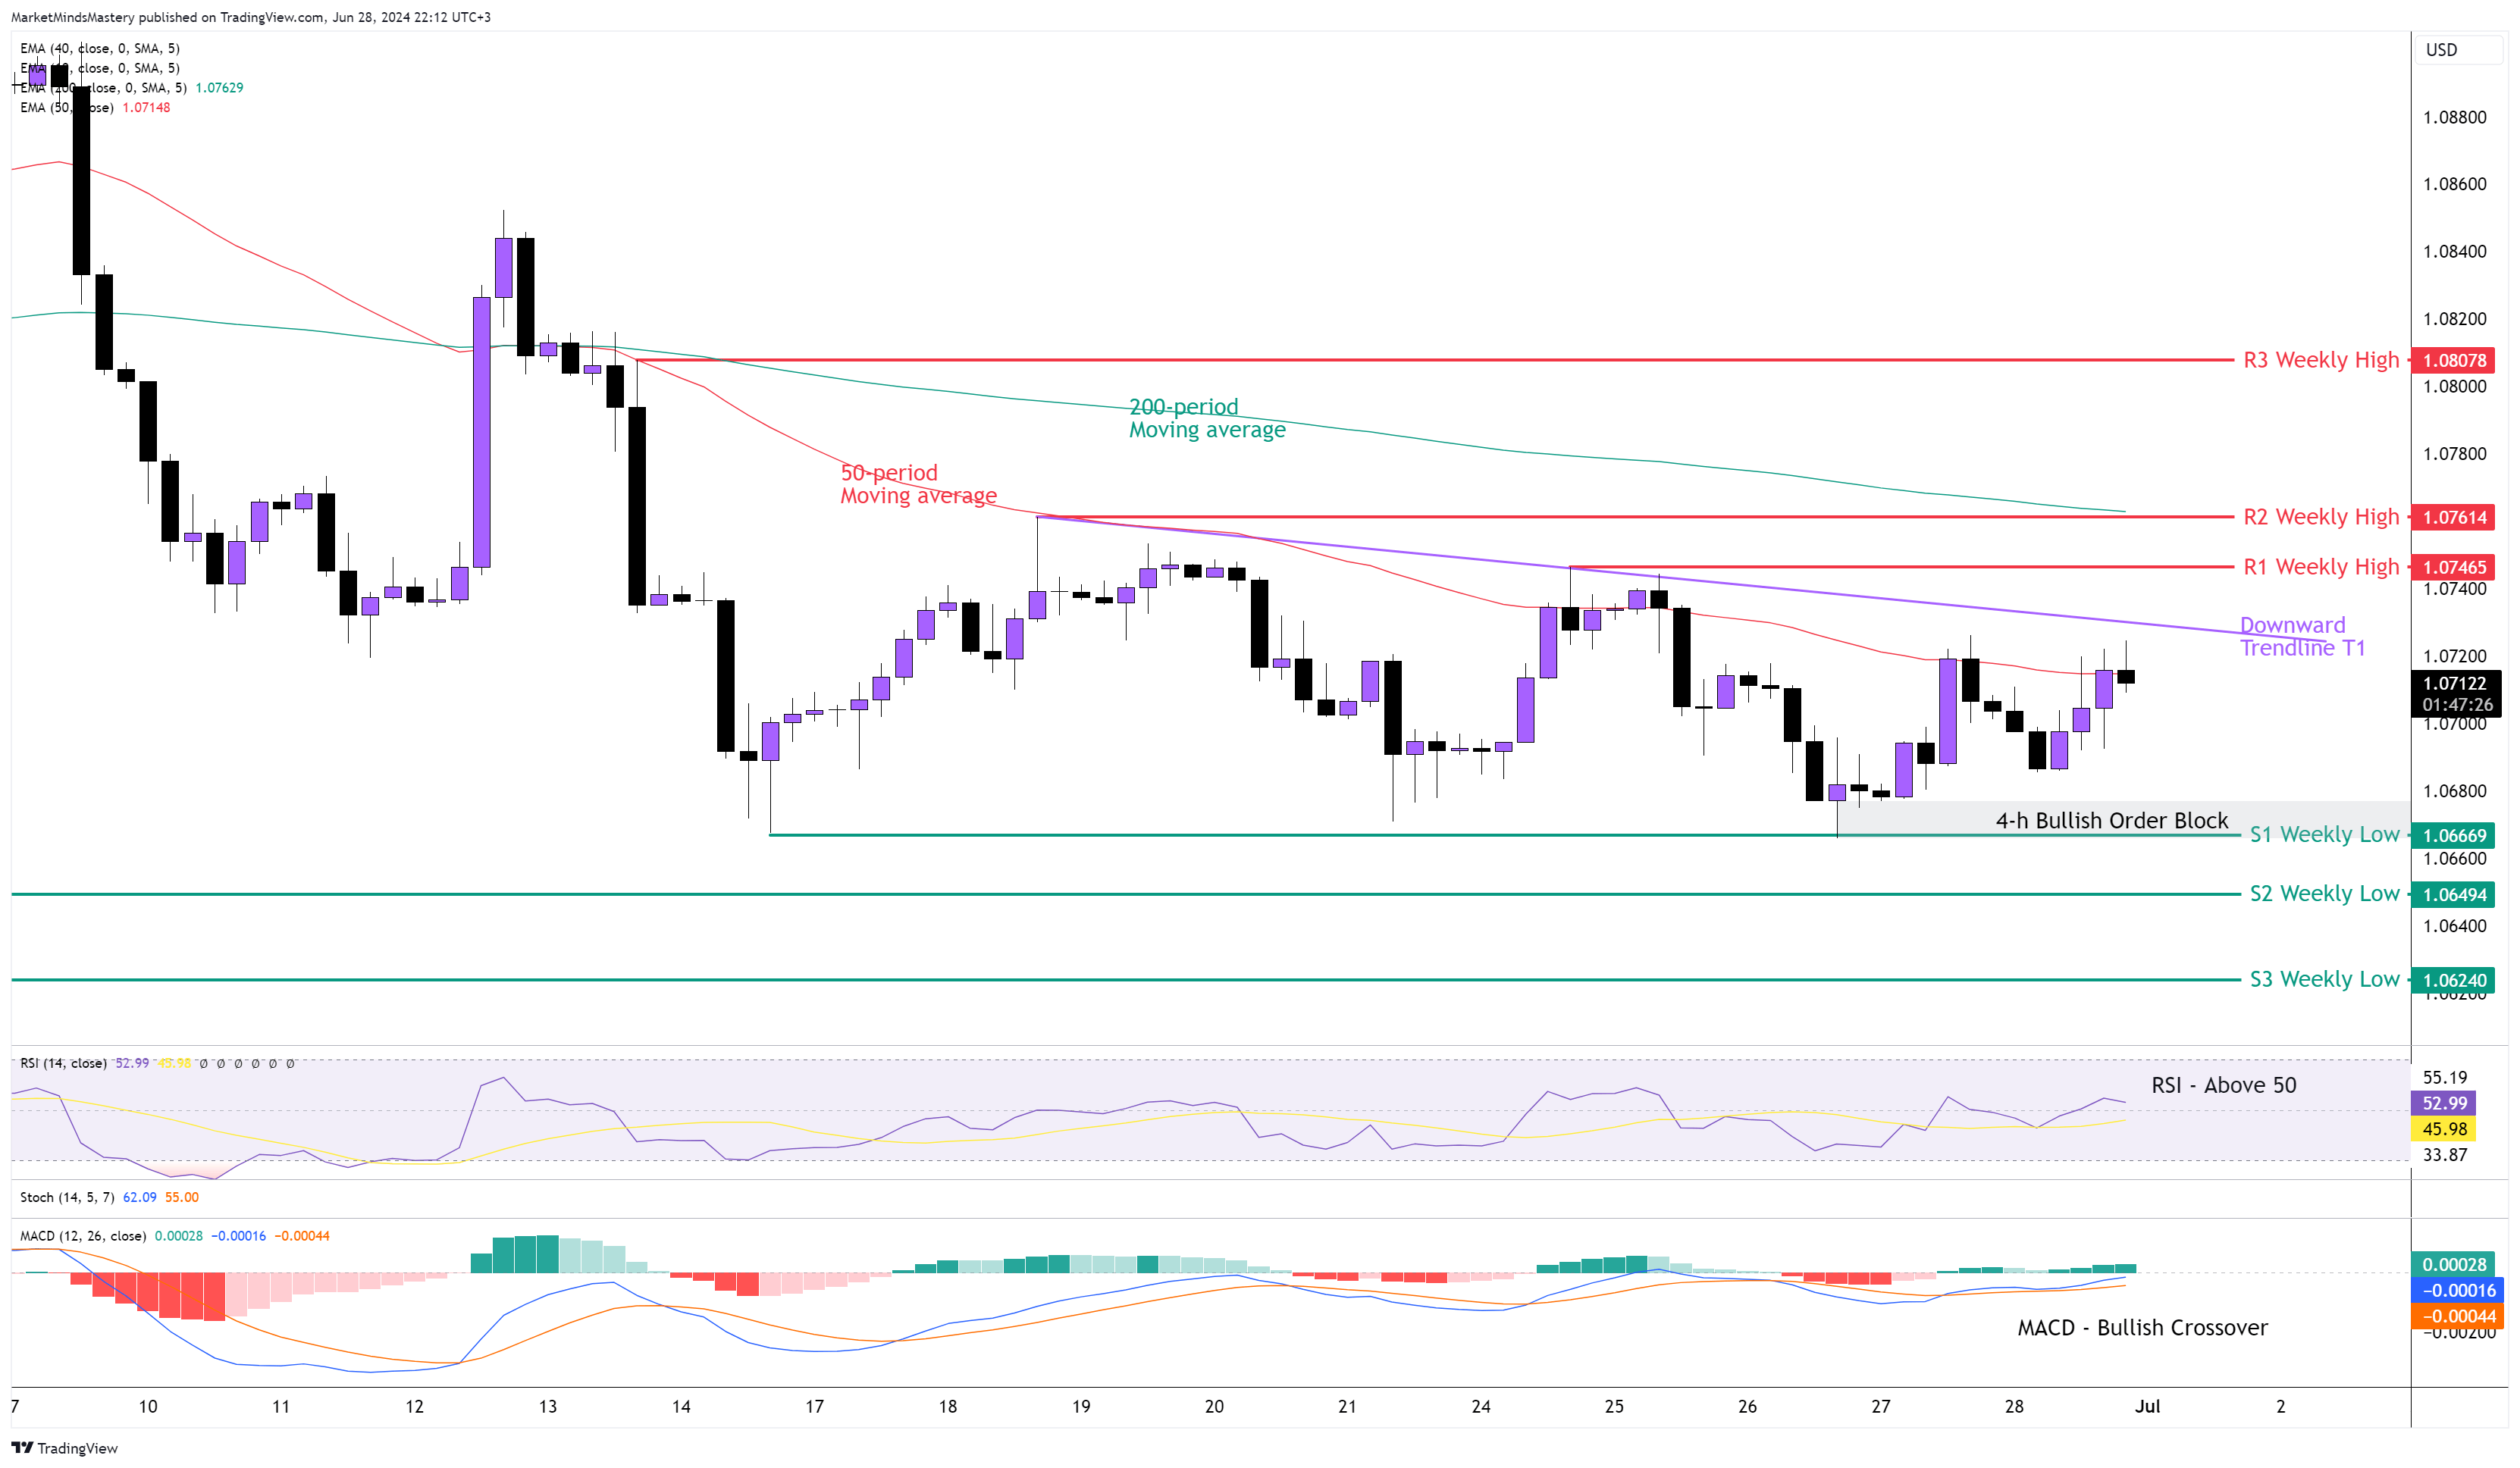
In a continuation of the previous week’s moves, the price on the weekly chart ended as an inside candle, leaving the trades trading in a 4-hour trading range of the EURUSD last week.
On the 4-hour chart, the price interacted with the 50-period moving average, declined a few times and moved downwards until the previous week’s lows, as was mentioned on the chart last week as support.
The 50-period is still below the 200-period, which is bearish. The price is trading below the Downwards Trendline T1, which indicates a downtrend.
The market makes lower highs and, at the same time, equal lows. This means that there is a bearish pressure in this market. At the same time, the RSI is above the middle line 50, and the MACD shows bullish accumulation as a bullish crossover occurs below the zero line.
If the price continues to move lower, the first support area, S1, will be the previous week’s low, around 1.06669. If the price penetrates the S1 and declines further, the next support area, S2, is around 1.06494. A further downward move finds the S3 support around 1.0624, which is another weekly low.
On the other hand, if the price moves upwards, the first resistance area, R1, will be the previous week’s high, approximately 1.07465. If it penetrates the R1 and moves upwards, the next resistance, R2, is at 1.07614 and the R3 around 1.08078. Both the R2 and R3 resistance levels are weekly highs.
GBP USD 4H
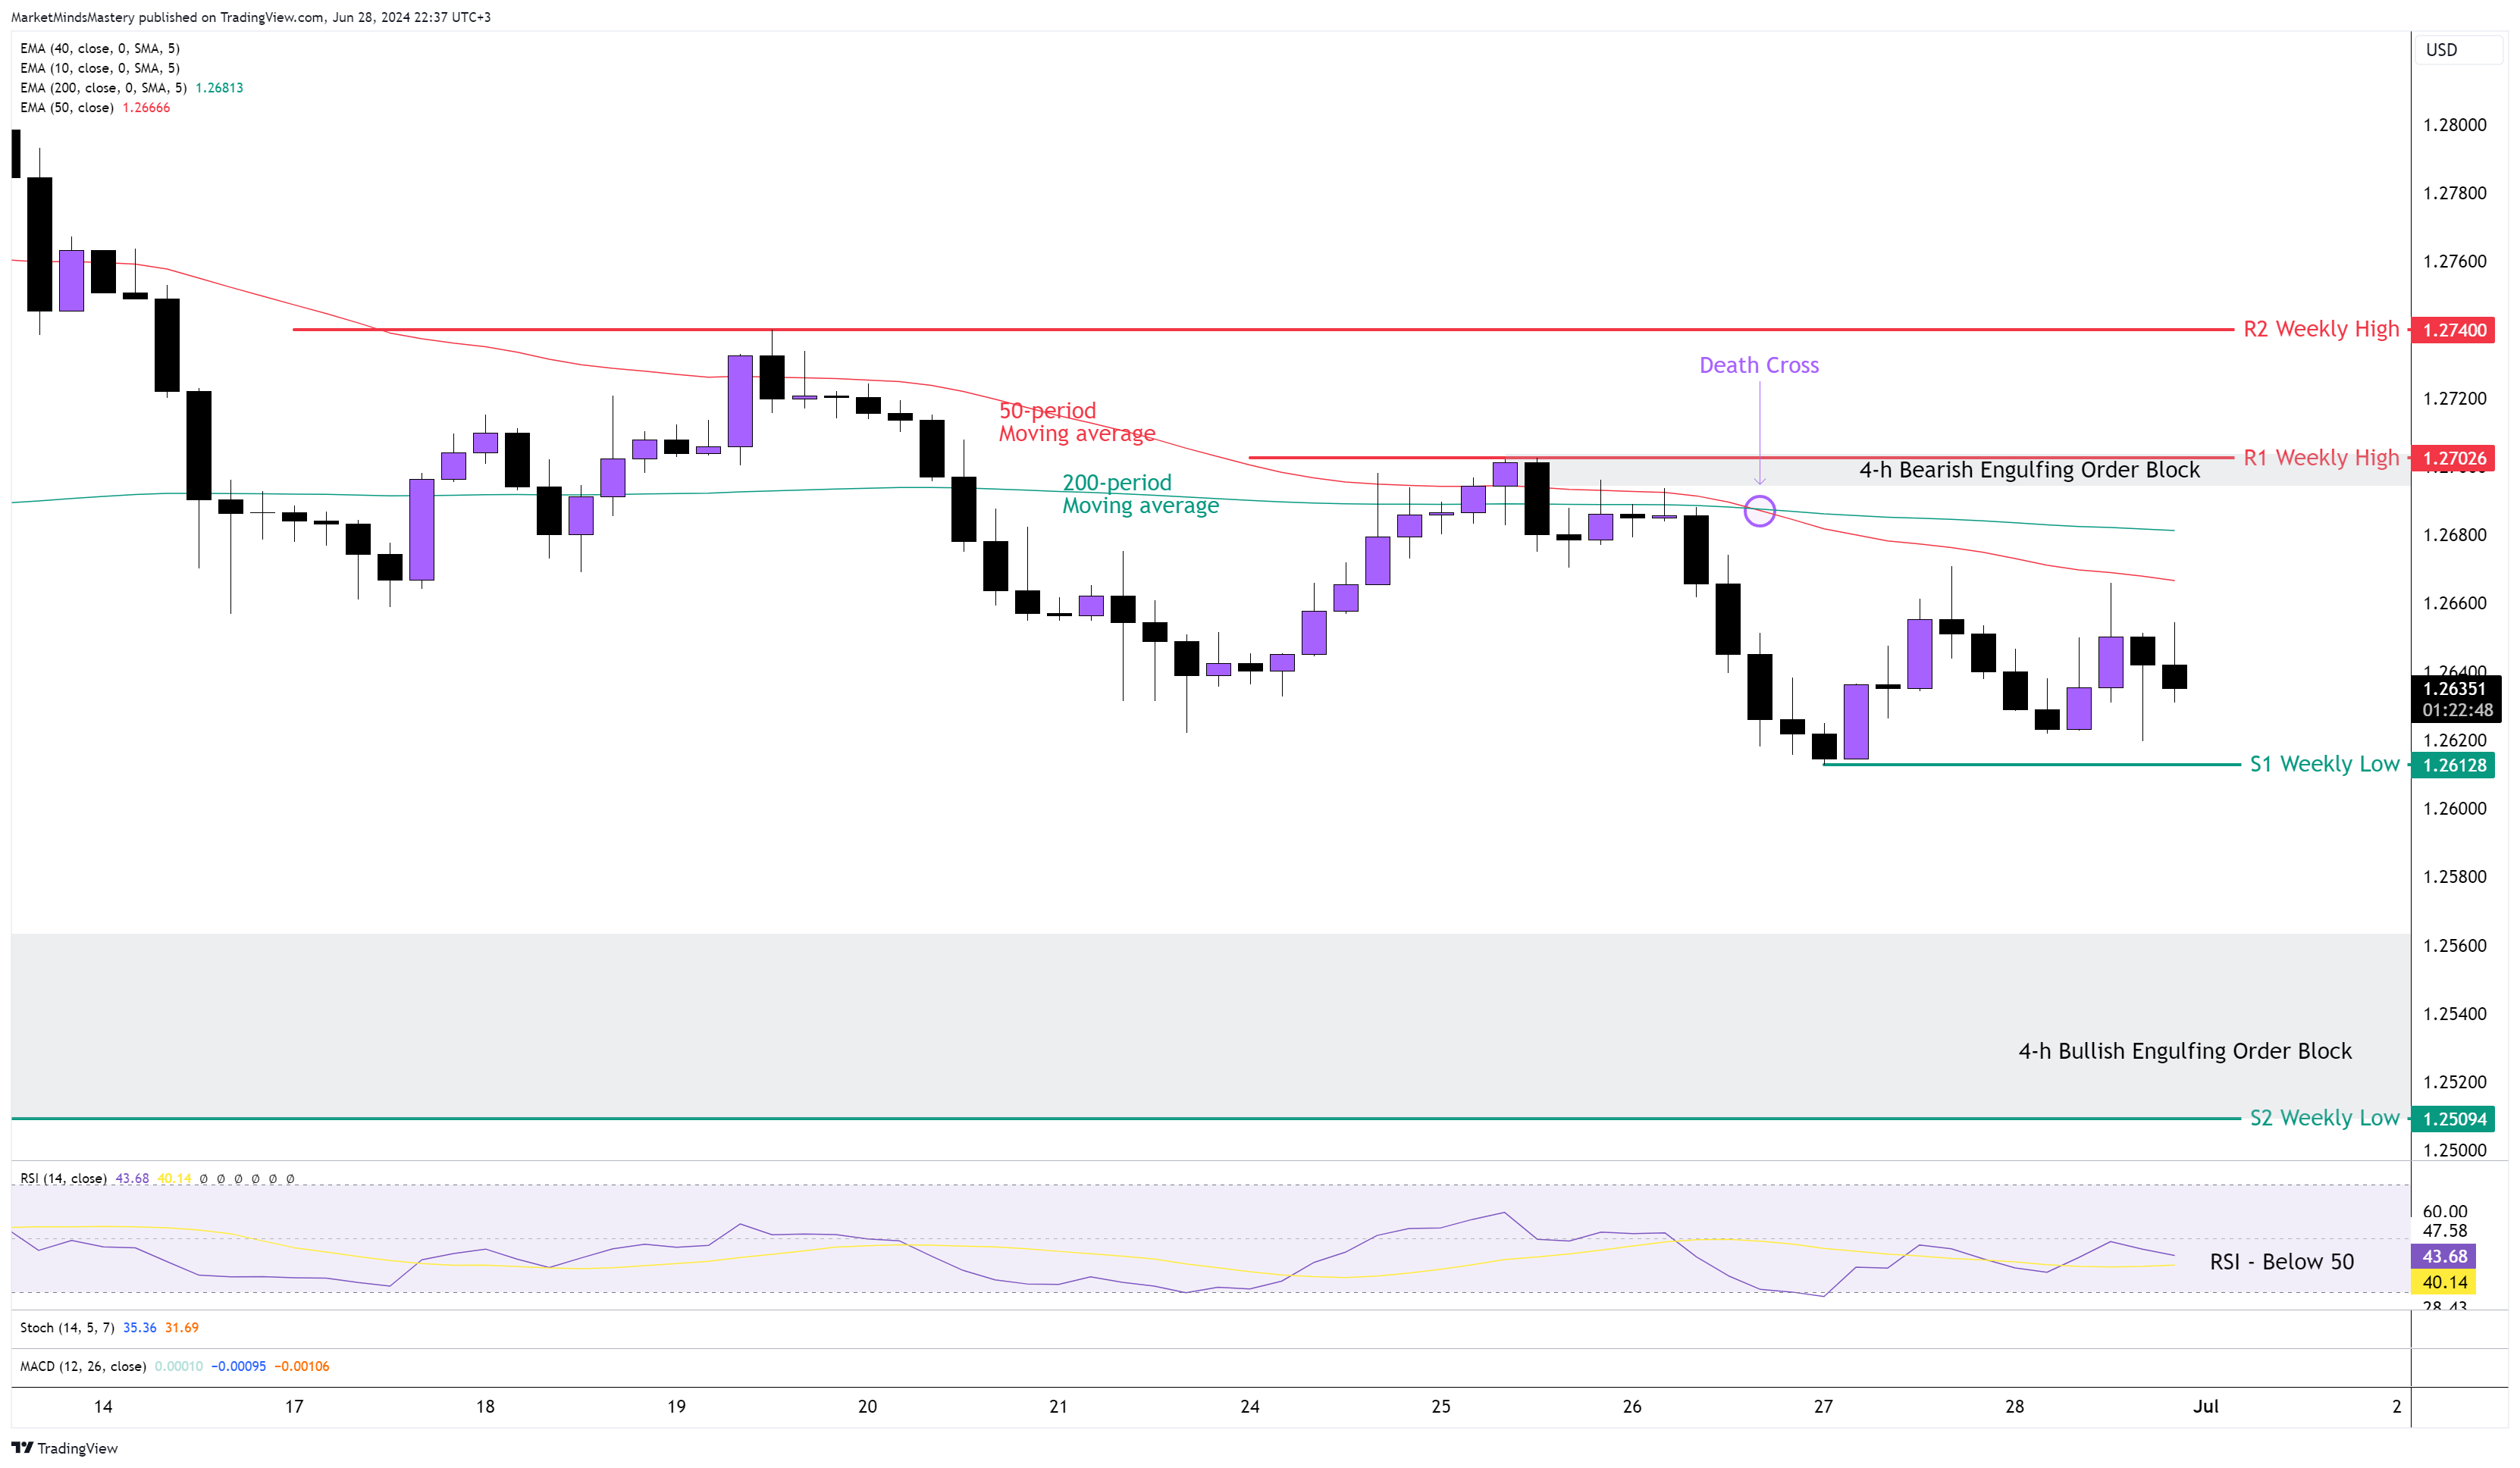
Following the previous week’s market outlook, the price retraced back to the 61.8% Golden Ratio, and the 50-period moving average was rejected and moved downwards as expected.
The weekly candle ended as a doji candle with a very small body and noticeable upper and lower wicks.
The price maintains the lower highs and lower lows and, therefore, is bearish. The 50-period crossed below the 200-period moving average, and this has bearish implications. This crossover is called “Death Cross”. The RSI Oscillator is below 50, which means that in the previous 14 trading periods, the price was declining.
If the price moves downwards to continue the downtrend, the first support area, S1, is the previous week’s low, approximately 1.26128. A break below S1 will signal the continuation of the downtrend. If this happens and the price declines further, the next support area, S2, will be another weekly low of around 1.25094.
On the contrary, if the price finds support and moves upwards, the first resistance area, R1, will be the previous week’s high, around 1.27026. Last week, a Bearish Engulfing Order Block formed below it. If the price penetrates R1 and keeps moving upwards, the next resistance area, R2, will be around 1.27400.
AUD USD 4H
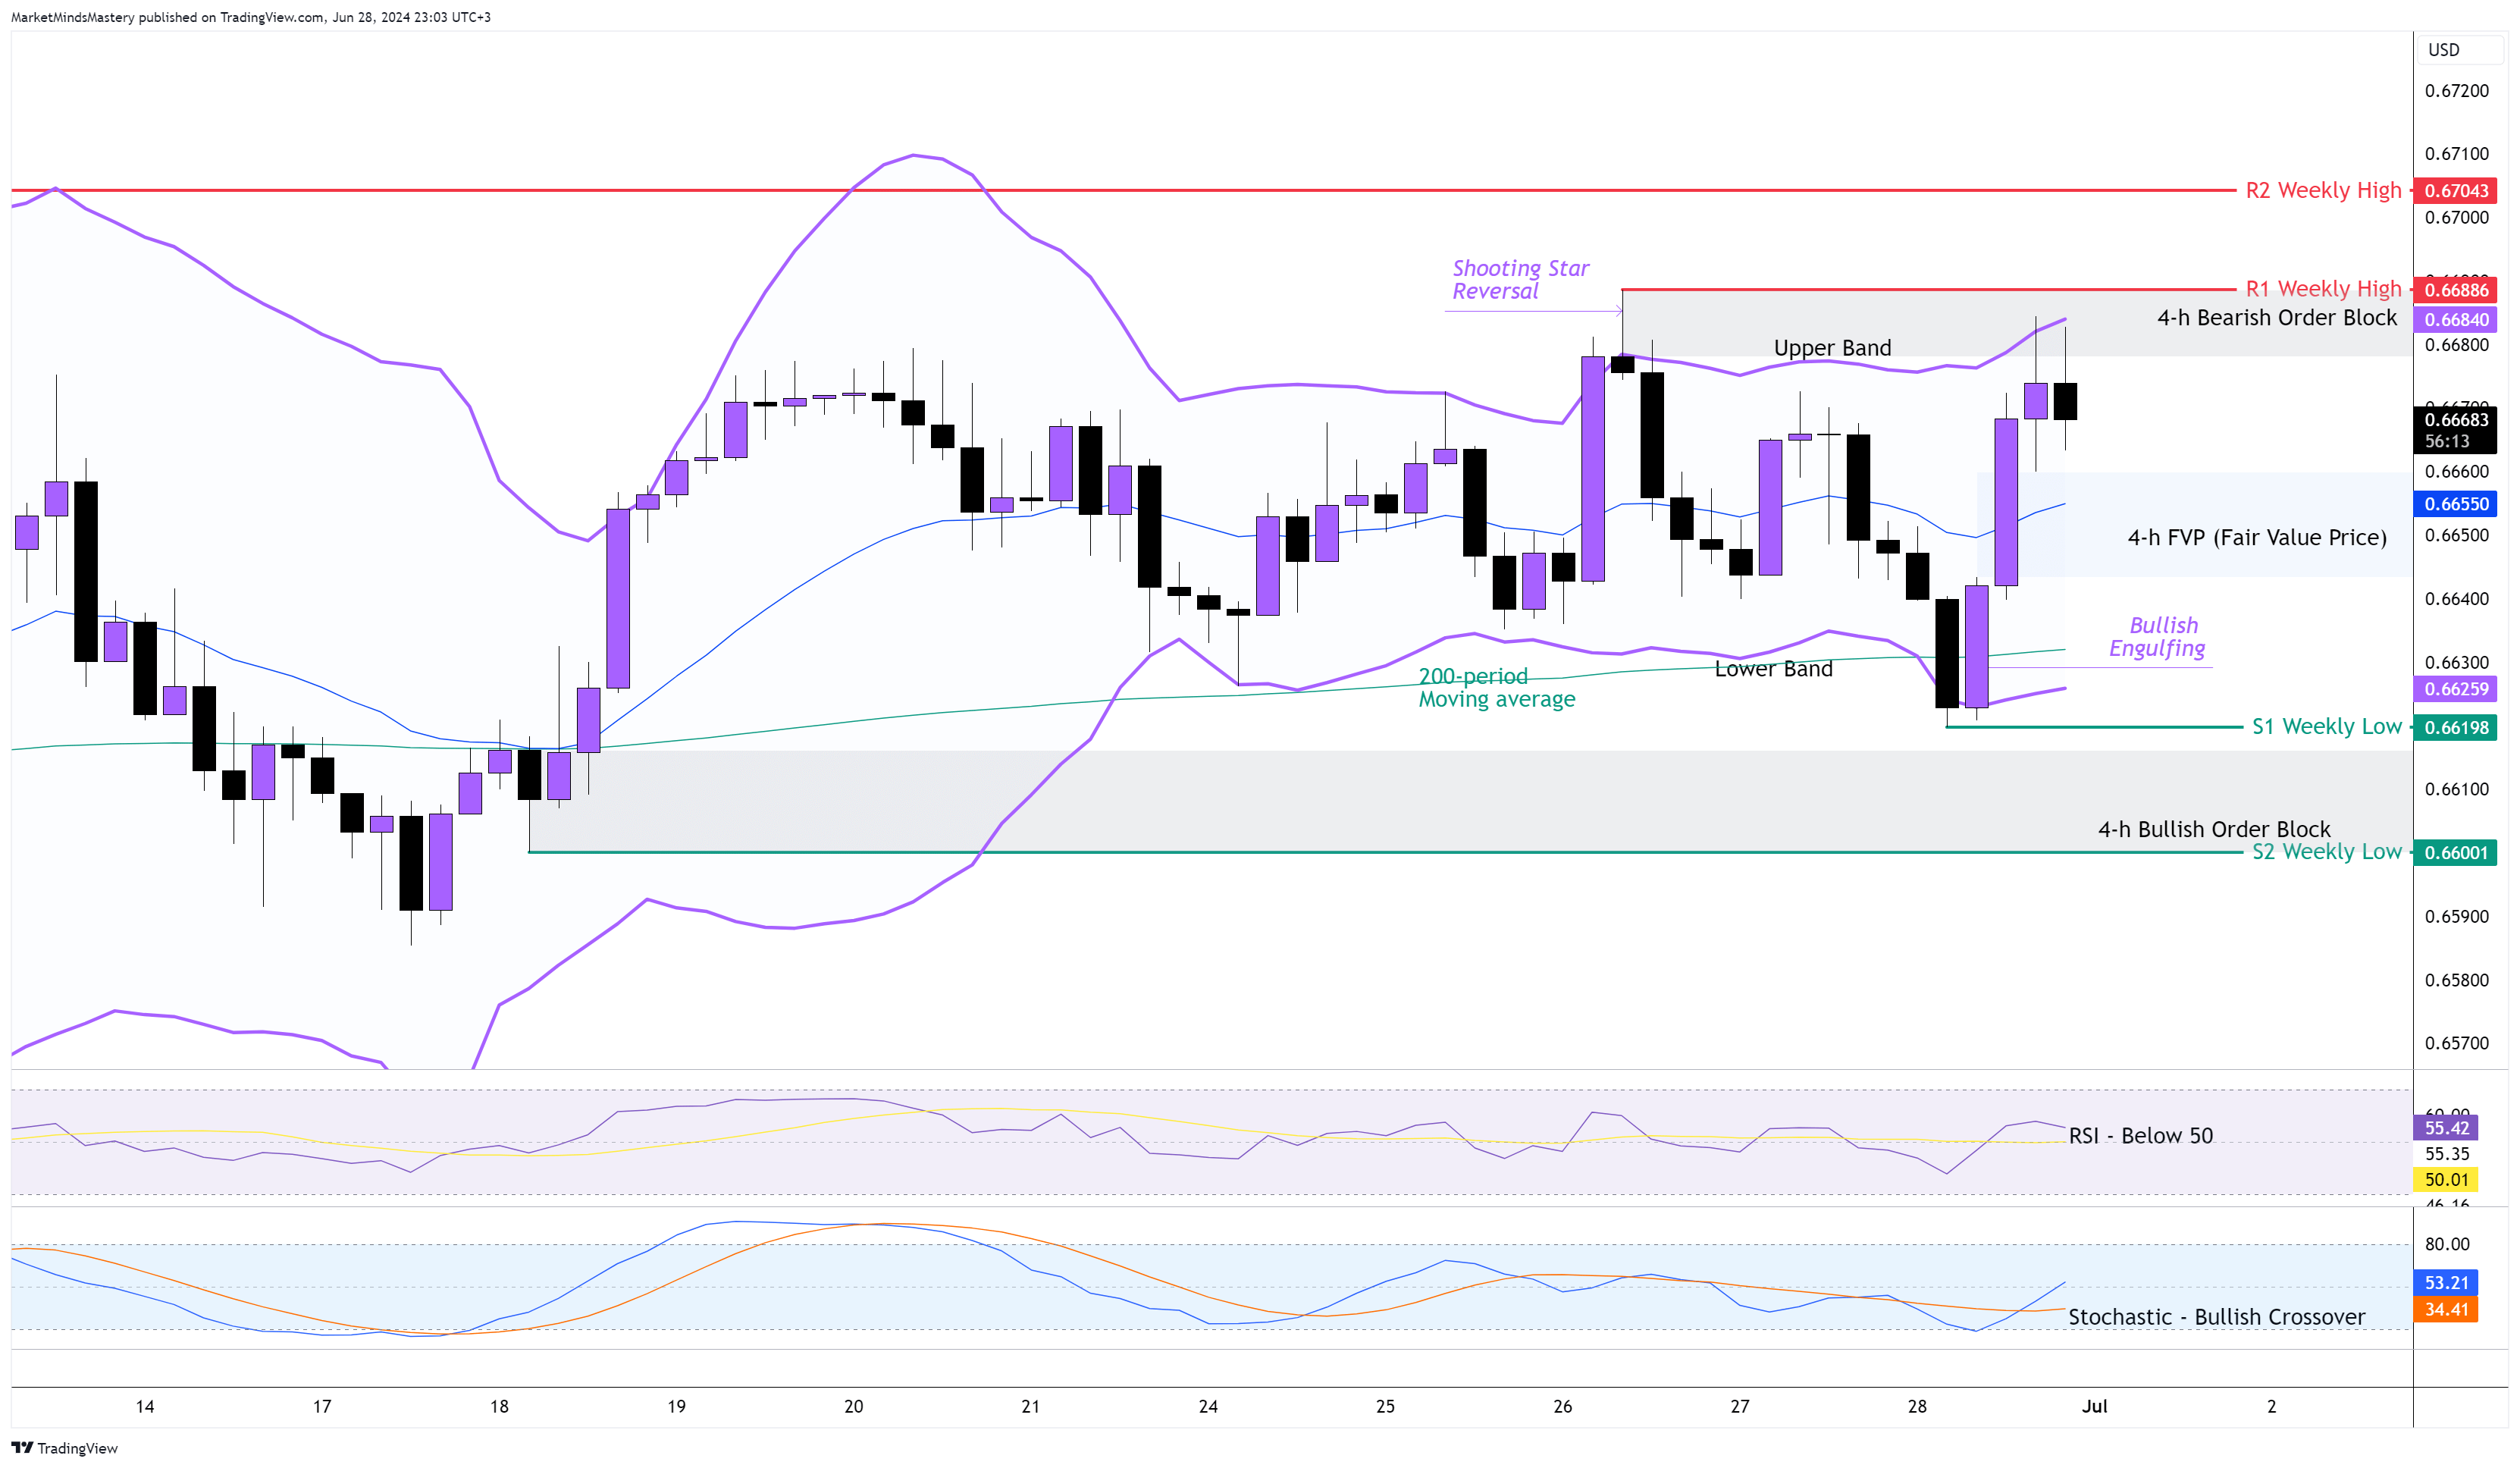
Last week, the price tested twice the R1 Weekly high we marked on the chart and declined, moving lower until the 200-period moving average, which acted as a dynamic support. Although the Australian dollar was one of the strongest currencies last week, it had to compete with a strong US dollar. This is the main reason the AUDUSD pair stayed within a trading range without developing a trend.
Currently, the price is testing the Bearish Order Block created by the Shooting Star reversal candle. Looking at the RSI Oscillator, the line is above 50, which indicates a bullish market. However, as the market is ranging, it's more beneficial to look at the bounded oscillators at their extremes. Last Friday, the Stochastic Oscillator became overbought, and a Bullish crossover followed. The price during the previous week was trading between the lower and the upper bands of the Bollinger Bands indicator.
If the price declines from the Order Block area and moves downwards, the first support area, S1, will be approximately 500 points (50 pips) away, around 0.66198. If the penetrates the S1 and moves lower, the next support area, S2, remains at the weekly low of around 0.66000. If the price finds support and moves upwards, the first resistance area, R1, will be the previous week’s high, around 0.66886. If it breaks and closes above the R1, the next resistance area, R2, will be 0.67043.
USD JPY 4H
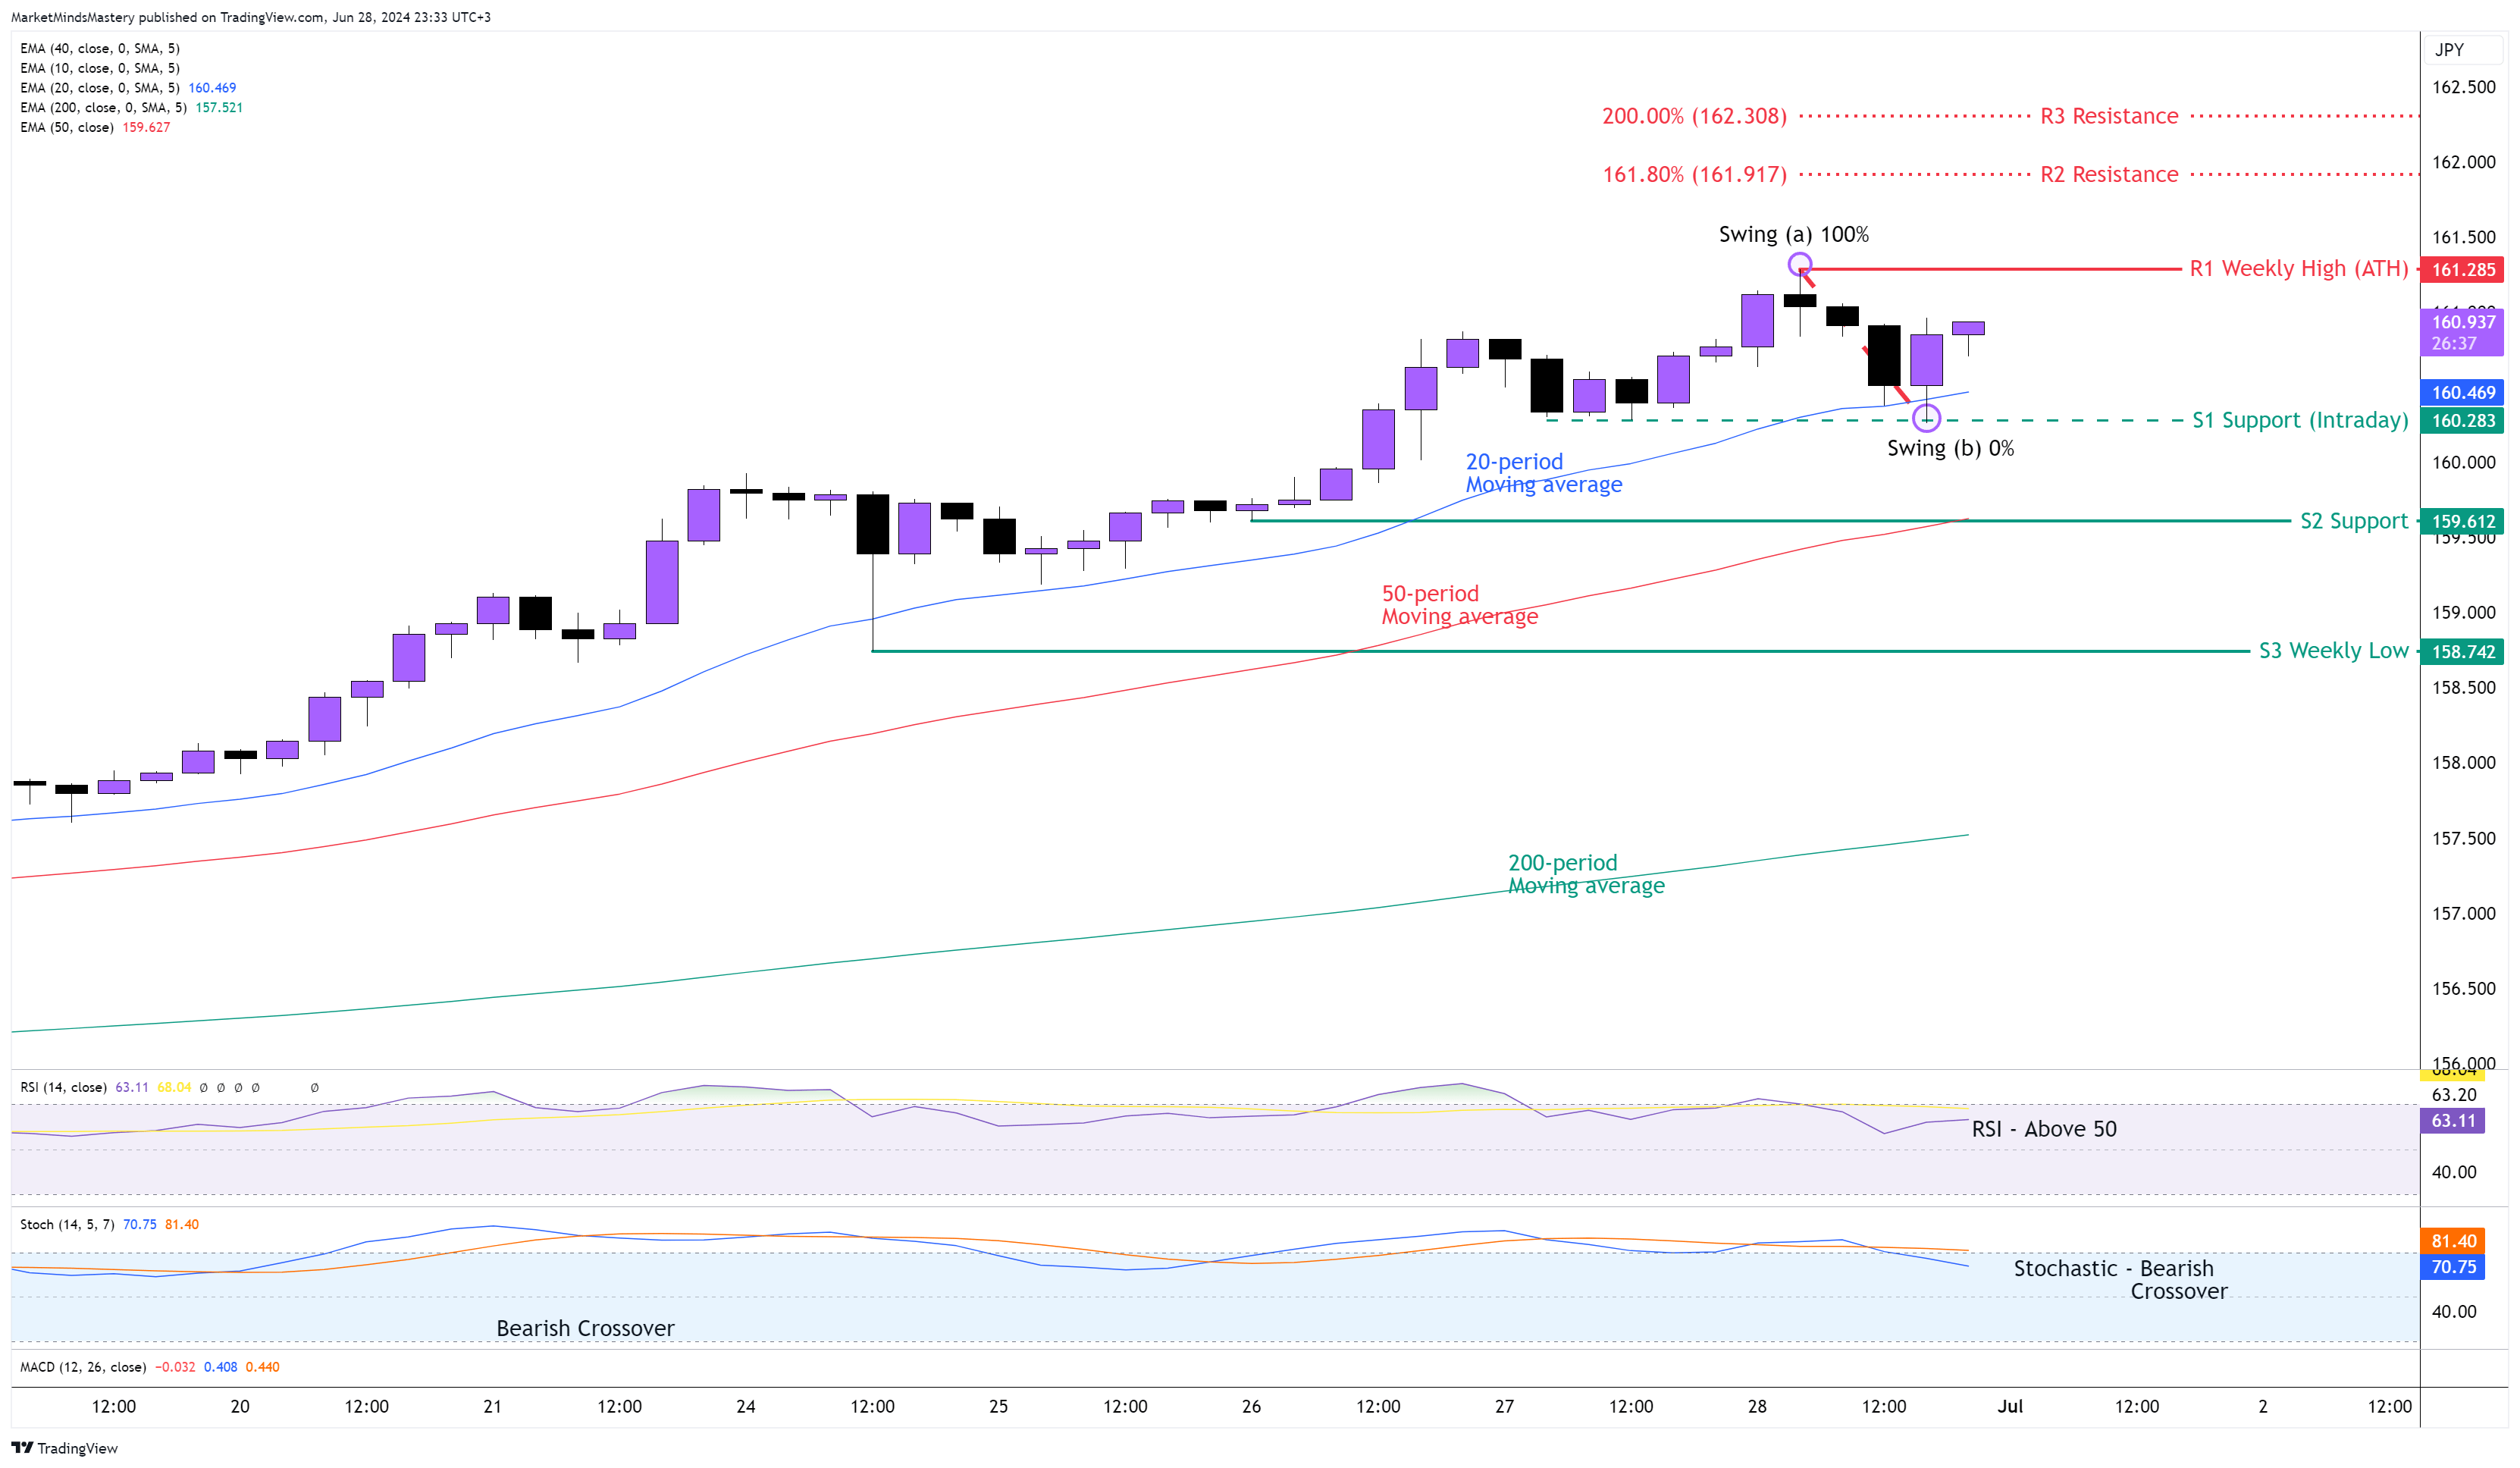
The 0.1% increase in the CPI in Japan last week wasn't enough to strengthen the Japanese Yen. Therefore, the USD kept dominating the battle on the USDJPY. The price kept rising, registering a new ATH (All-Time High). As a consequence, the 4-hour chart’s uptrend continued with a series of higher highs and higher lows. The 20-period moving average is still above the 50-period, with the distance between the two widening more. The RSI is still above 50, indicating a strong bullish move. The Stochastic Oscillator created a Bearish Crossover in an oversold area, which means that the price is likely to enter a corrective phase.
Last Friday, the price touched the 20-period moving average, bounced off and moved upwards. Starting Monday, if the price continues to move upwards, the first resistance area, R1, will be the previous week’s high, around 161.285, which is also the ATH. If the price closes above the R1, the next resistance area, R2, will be calculated using the Fibonacci Extension and specifically the 161.8% and 200% levels, which are the 162 and 162.300 levels, respectively, as we don’t have a reference of an old resistance area where the price declined in the past.
Conversely, if the price starts moving downwards, the first support area, S1, will be the intraday support around 160.283. If the price breaks below S1 and declines further, the next support area, S2, will be around 159.612. This level clusters with the 50-period moving average, which can also act as dynamic support and push the price upwards. If the price keeps lowering, the next support area, S3, being the previous week’s low, around 158.742.
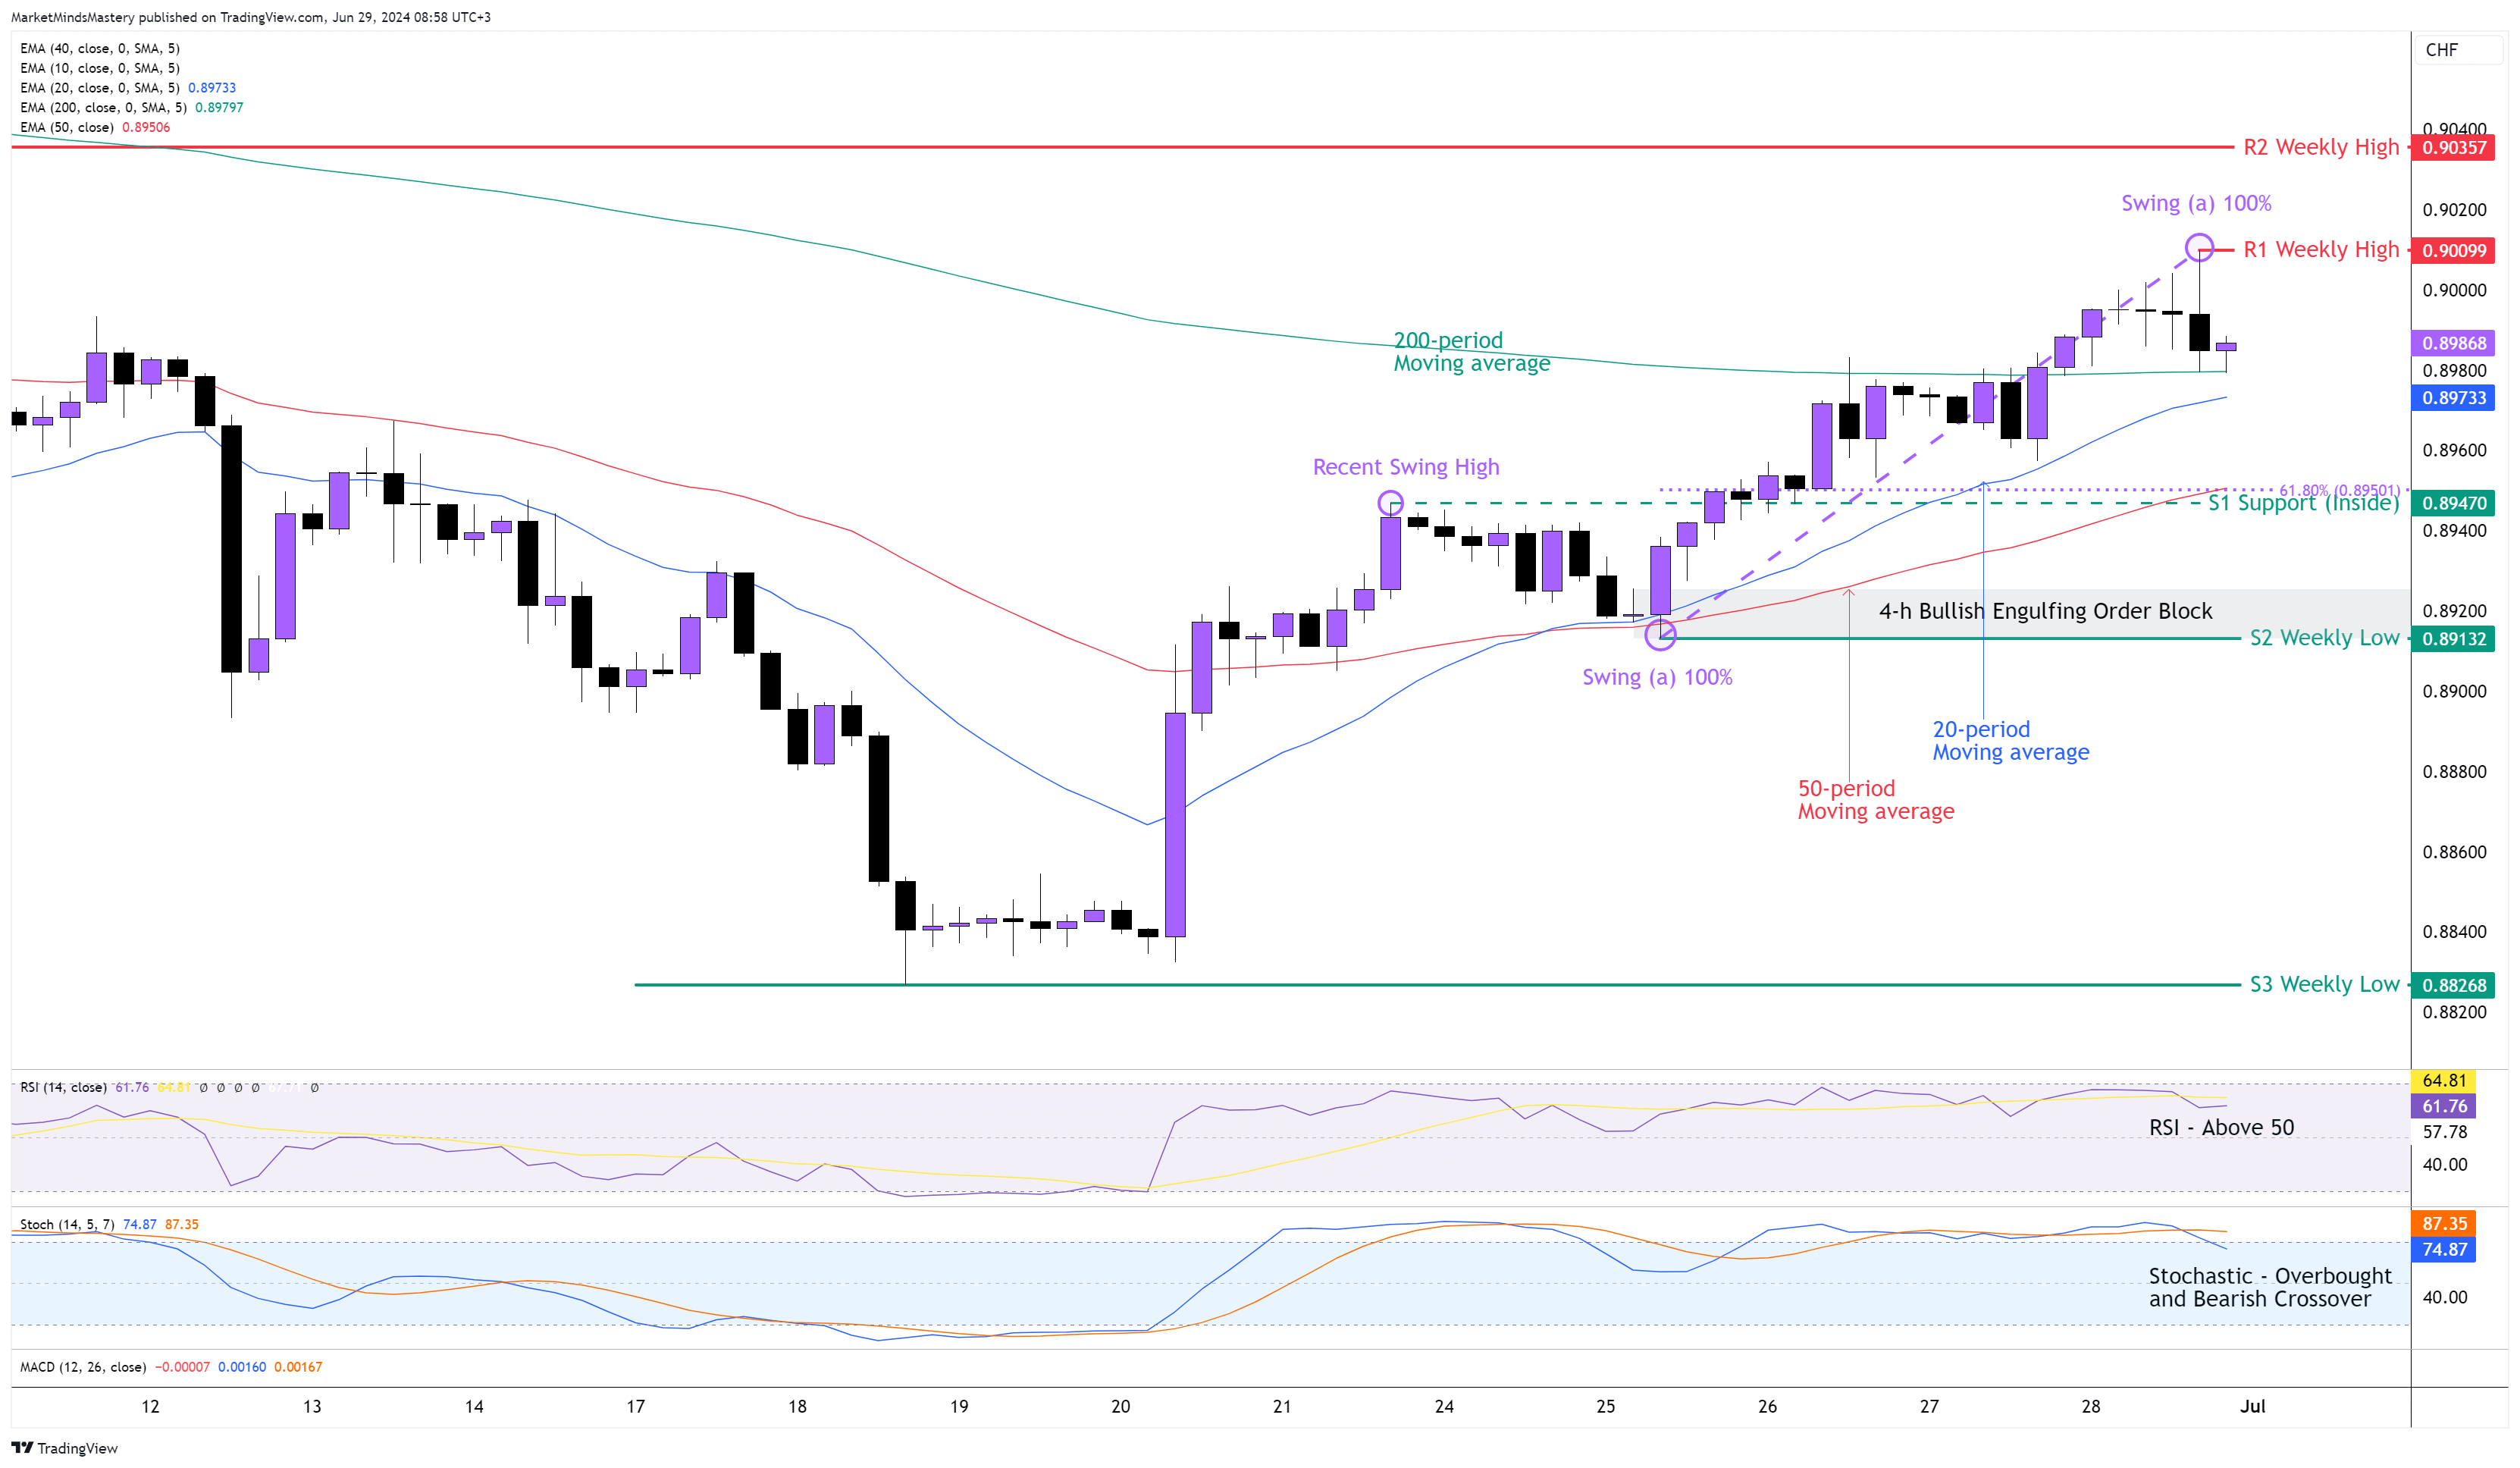
USD CHF 4H
Following last week’s market outlook, the price kept moving upward as expected after the weekly reversal hammer candle. On the 4-hour chart, the price is making higher highs and higher lows, which indicates an uptrend. The 20-period moving average is above the 50-period moving average, which is bullish.
Despite the slow 200-period moving average being above 20 and 50, the price penetrated it, closed, and remains above it, acting as a dynamic support.
At the beginning of the previous week, the price on the price created a Bullish Engulfing Order Block, as shown on the chart.
The RSI Oscillator is above 50, which has bullish implications. The Stochastic Oscillator, though, is in an overbought condition, which is bullish. However, the %K line crossed below the %D line in the overbought area, which is a bearish indication. In this case, the first indication is that the price will most likely enter a corrective phase, which means a move against the prevailing trend.
If the price keeps moving upwards, the first resistance area, R1, will be the previous week’s high, around 0.90099. A further upward move finds the R2t resistance area, around 0.90357, which is another weekly high price.
On the other hand, if the price declines and moves downwards, the first support area, S1, will be the inside support around 0.89470. This level also consists of the 61.8% Fibonacci and the 50-period moving average, which makes the level more significant. If the price penetrates the S1 and moves downwards, the next support area, S2, will be the previous week’s low, around 0.89132.
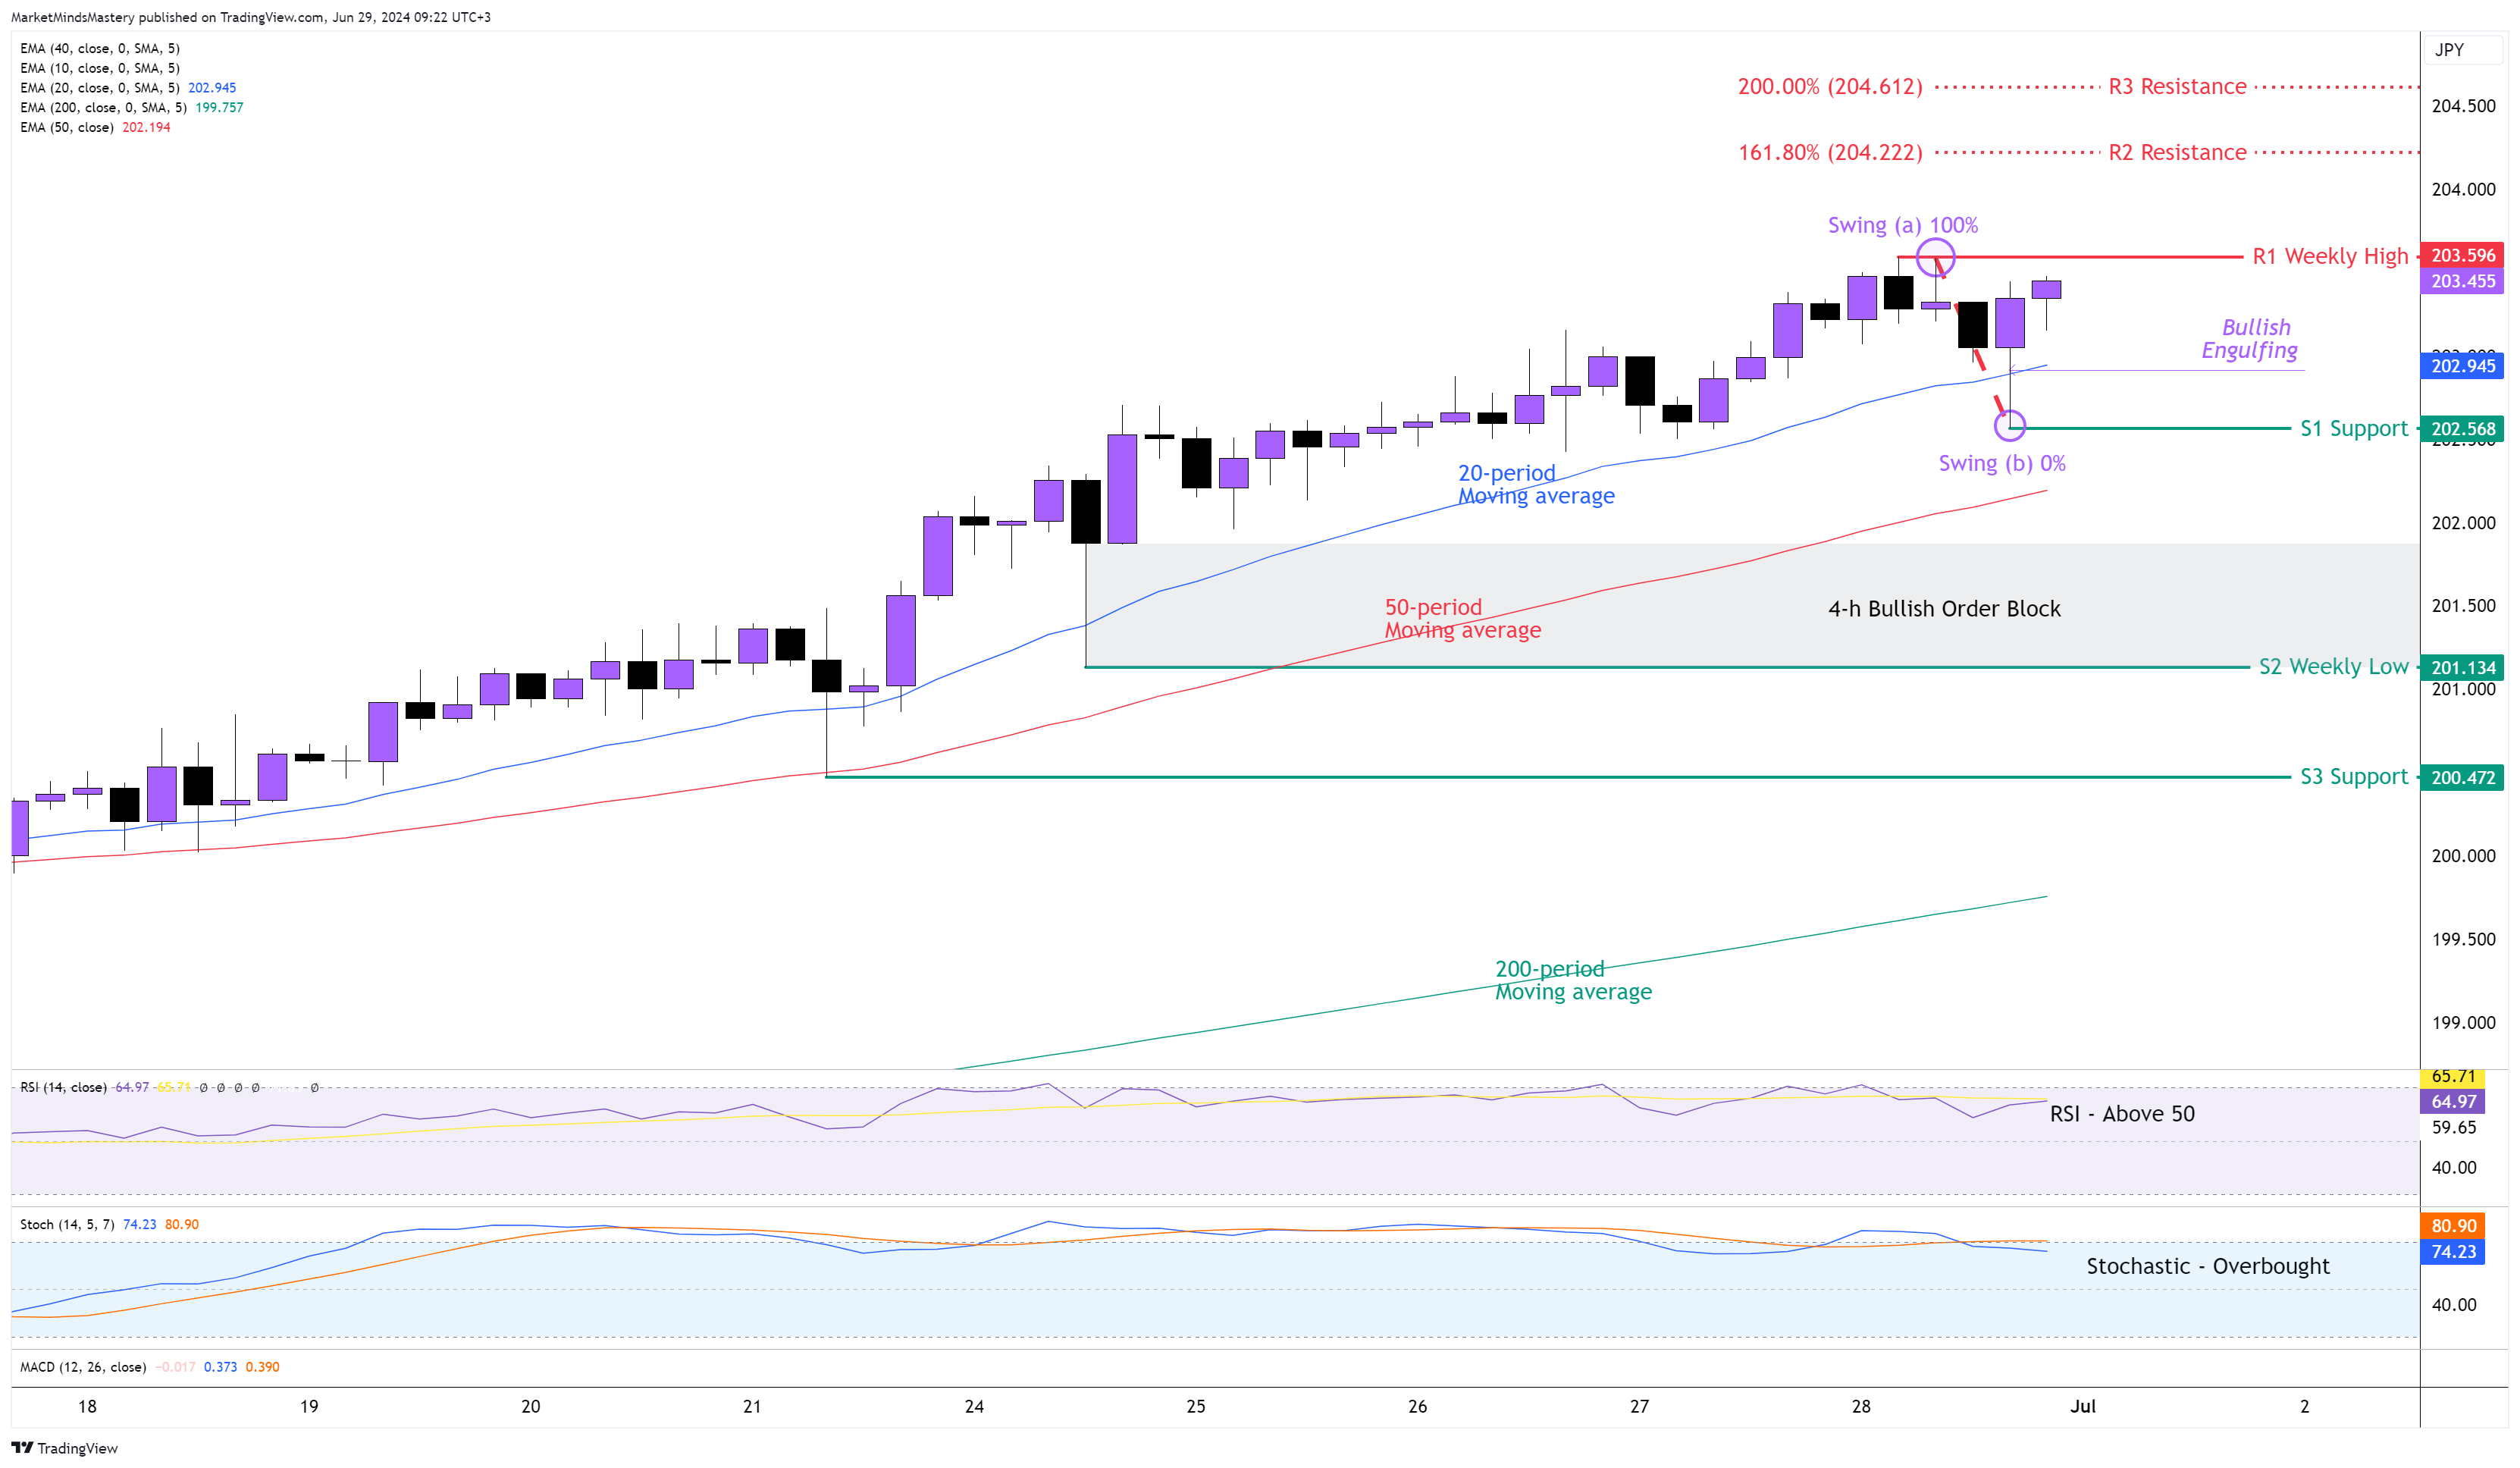
GBP JPY 4H
Following the Japanese Yen’s weakness, Sterling continued dominating the market last week, continuing the series of higher highs and higher lows. The weekly chart printed a bullish continuation candle. On the 4-hour chart, the price interacted with the 20-period moving average only two times and immediately bounced off, indicating a strong bullish market.
The 20-period is still above the 50-period, and both are above the 200-period moving average.
The RSI is above 50, indicating bullishness. The Stochastic Oscillator is in an overbought condition, which is another bullish indicator.
At the beginning of last week, the price created a Bullish Order Block, and since then, it has traded above it.
Last Friday, the Bullish Engulfing candle bounced off the 20-period moving average. If the price continues to move upwards, the first resistance area, R1, is only a few pips above the current market price, which was the previous week’s high, around 203.596. If it penetrates the R1 and moves above it, the next resistance areas will be projected using the Fibonacci Extension tool. The 161.8% and the 200% Fibonacci Extensions are around 204.222 and 202.612 respectively.
Conversely, if the price is rejected and moves downwards, the first area of support, S1, will be the low of the Bullish Engulfing candle around 202.568. If it declines further and moves below S1, the next support area, S2, will be the previous week’s low, around 201.134.
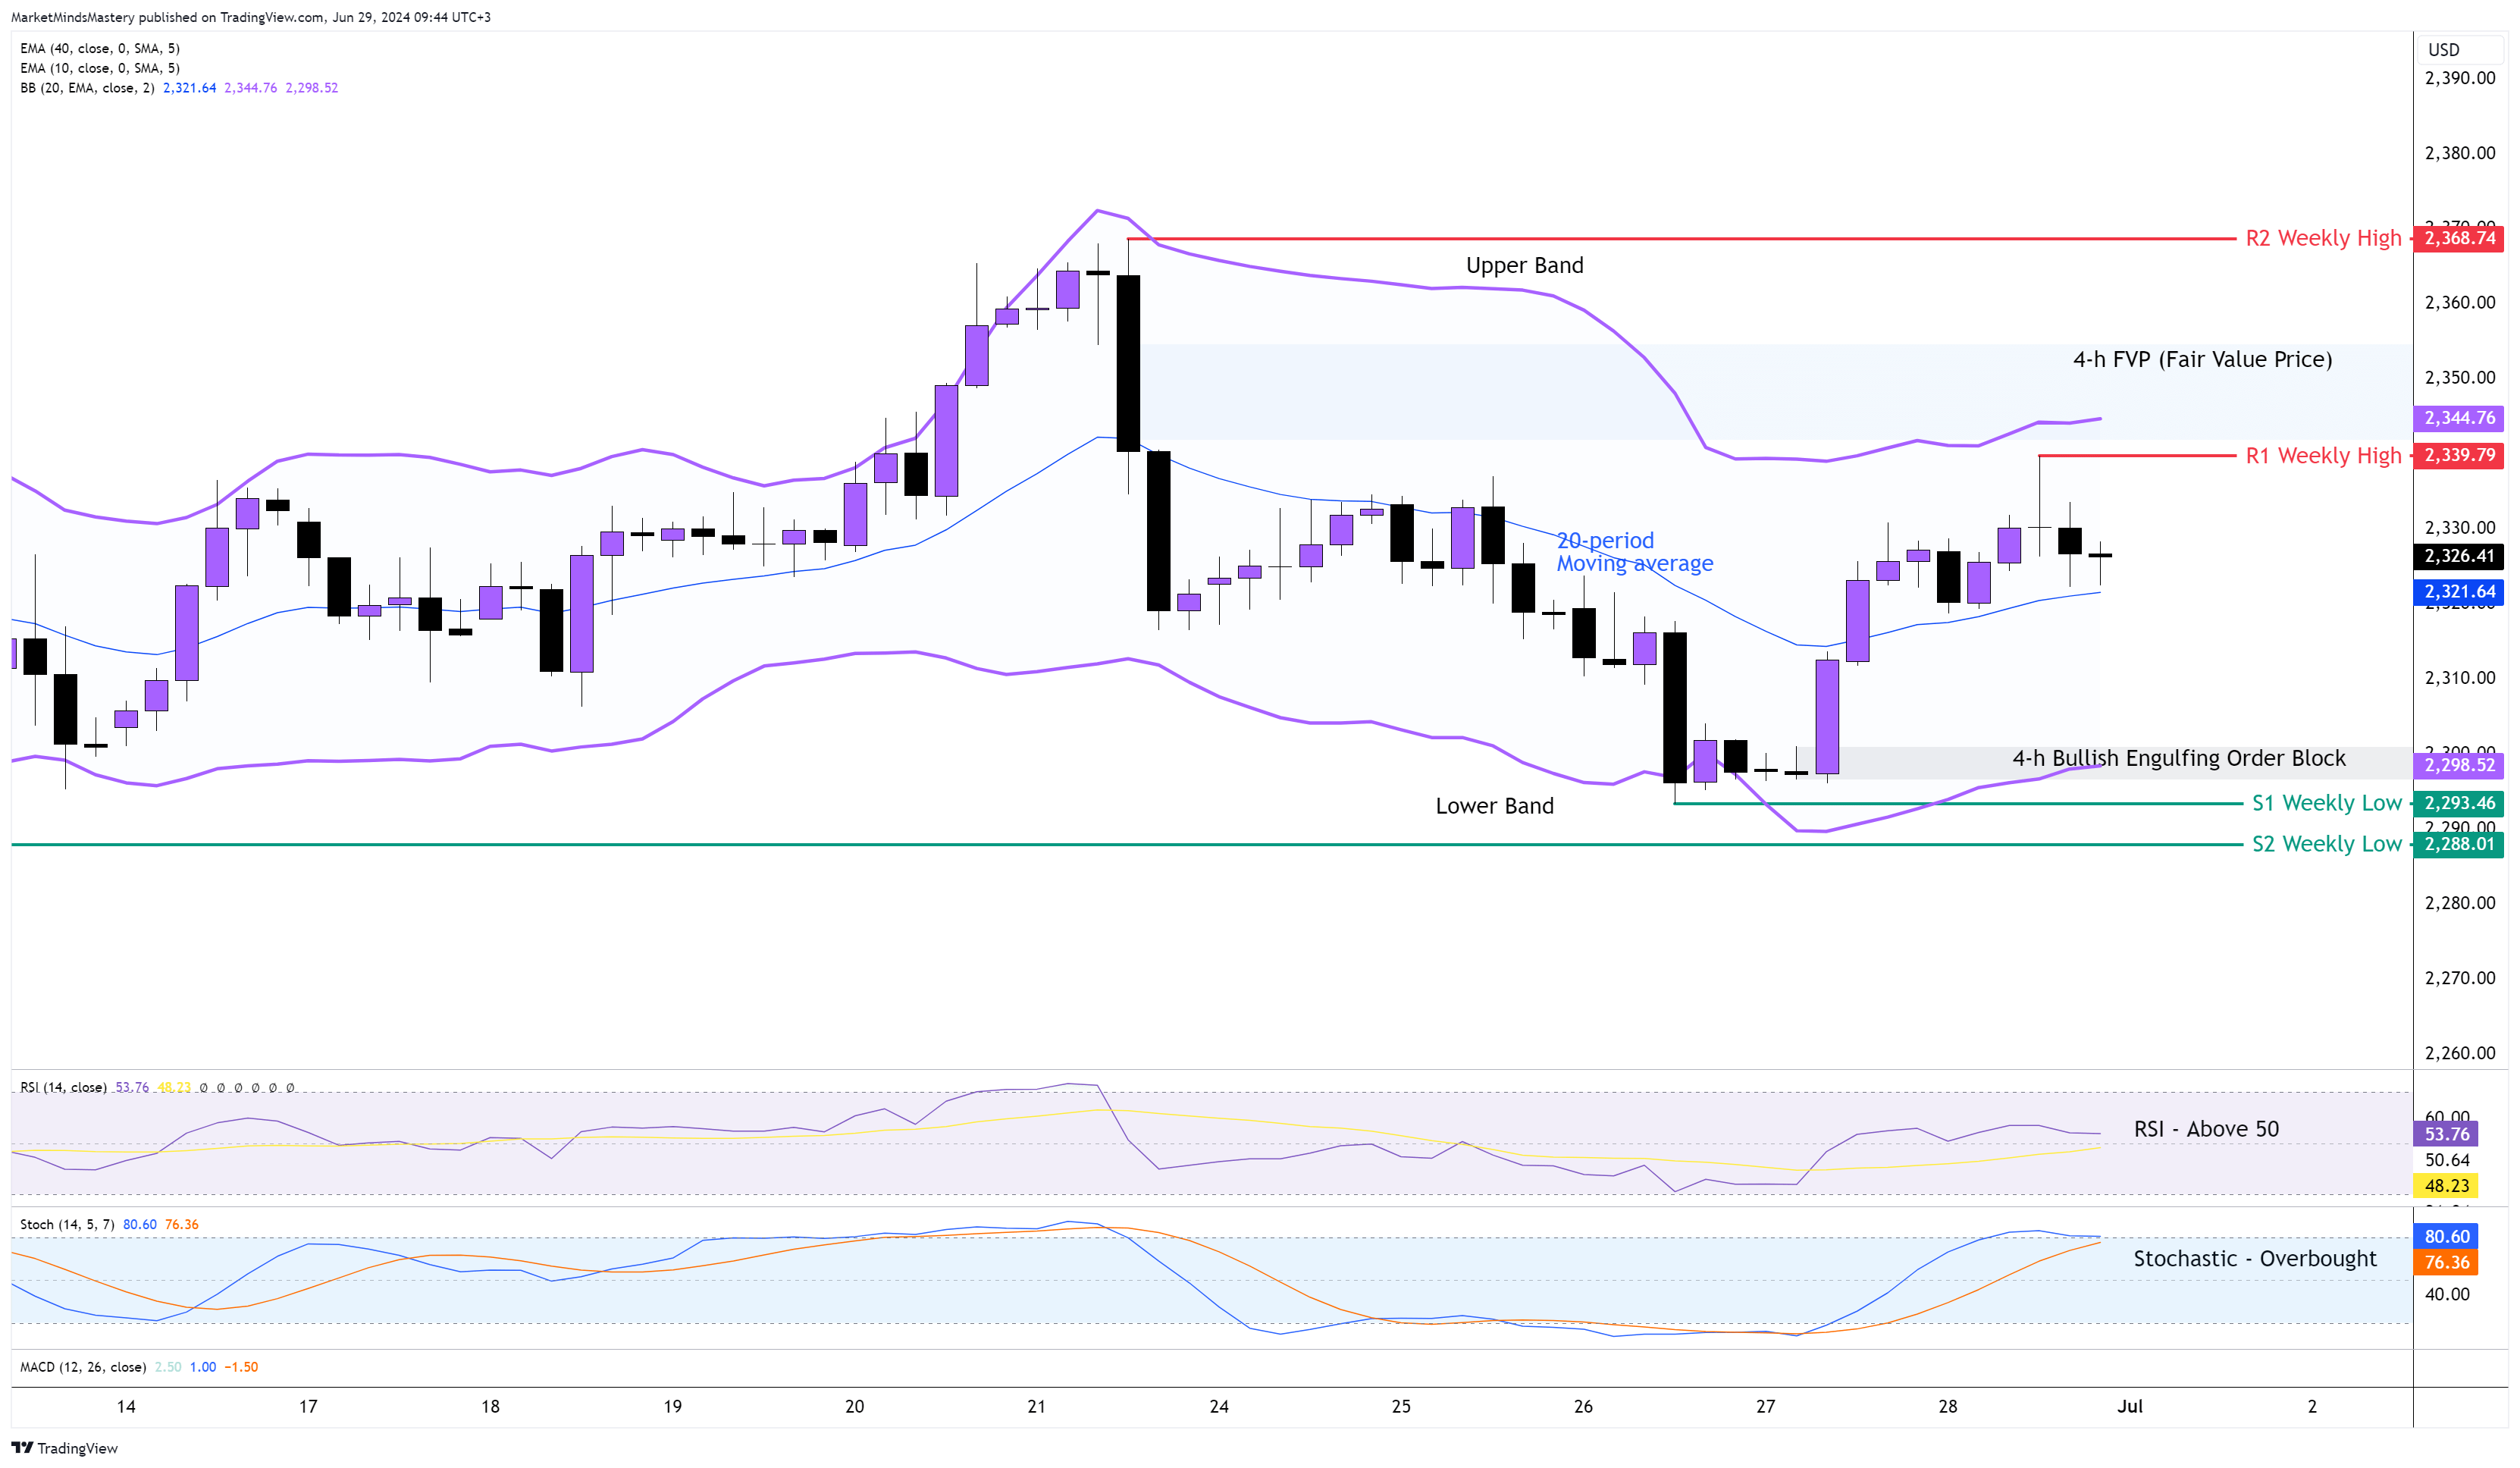
GOLD 4H
The sideways move continued on the Gold last week, and the weekly candle ended as a doji candle. Therefore, no directional move occurred, and the trendless market behaviour can clearly be seen in the 4-hour chart.
Continually using the Bollinger Band indicator this week, the price remains within the upper and lower bands. A few times last week, the price interacted with the lower band but didn't break out to move downwards. The price immediately retraced back and moved upwards towards the upper band, leaving behind a Bullish engulfing Order Block as shown on the chart.
Currently, the price is above the middle line, which is the 20-period moving average. The RSI oscillator is above 50, and this is bullish. The Stochastic Oscillator is in an overbought condition, indicating bullishness. The FVP (Fair Value Price) is still valid.
Starting Monday, if the price remains above the 20-period and moves upwards, the first resistance area, R1, will be around $2339 and is the previous week’s high. If the price penetrates the R1 and keeps moving upwards, the next resistance area, R2, will be another weekly high at $2368. On the other hand, if the price declines and moves downwards, the first support area is expected to be the previous week’s low, around $2393. The importance of this price level is that it consists of the Lower Band and the 4-h Bullish Engulfing Order Block. A further decline finds the S2 support around $2288.
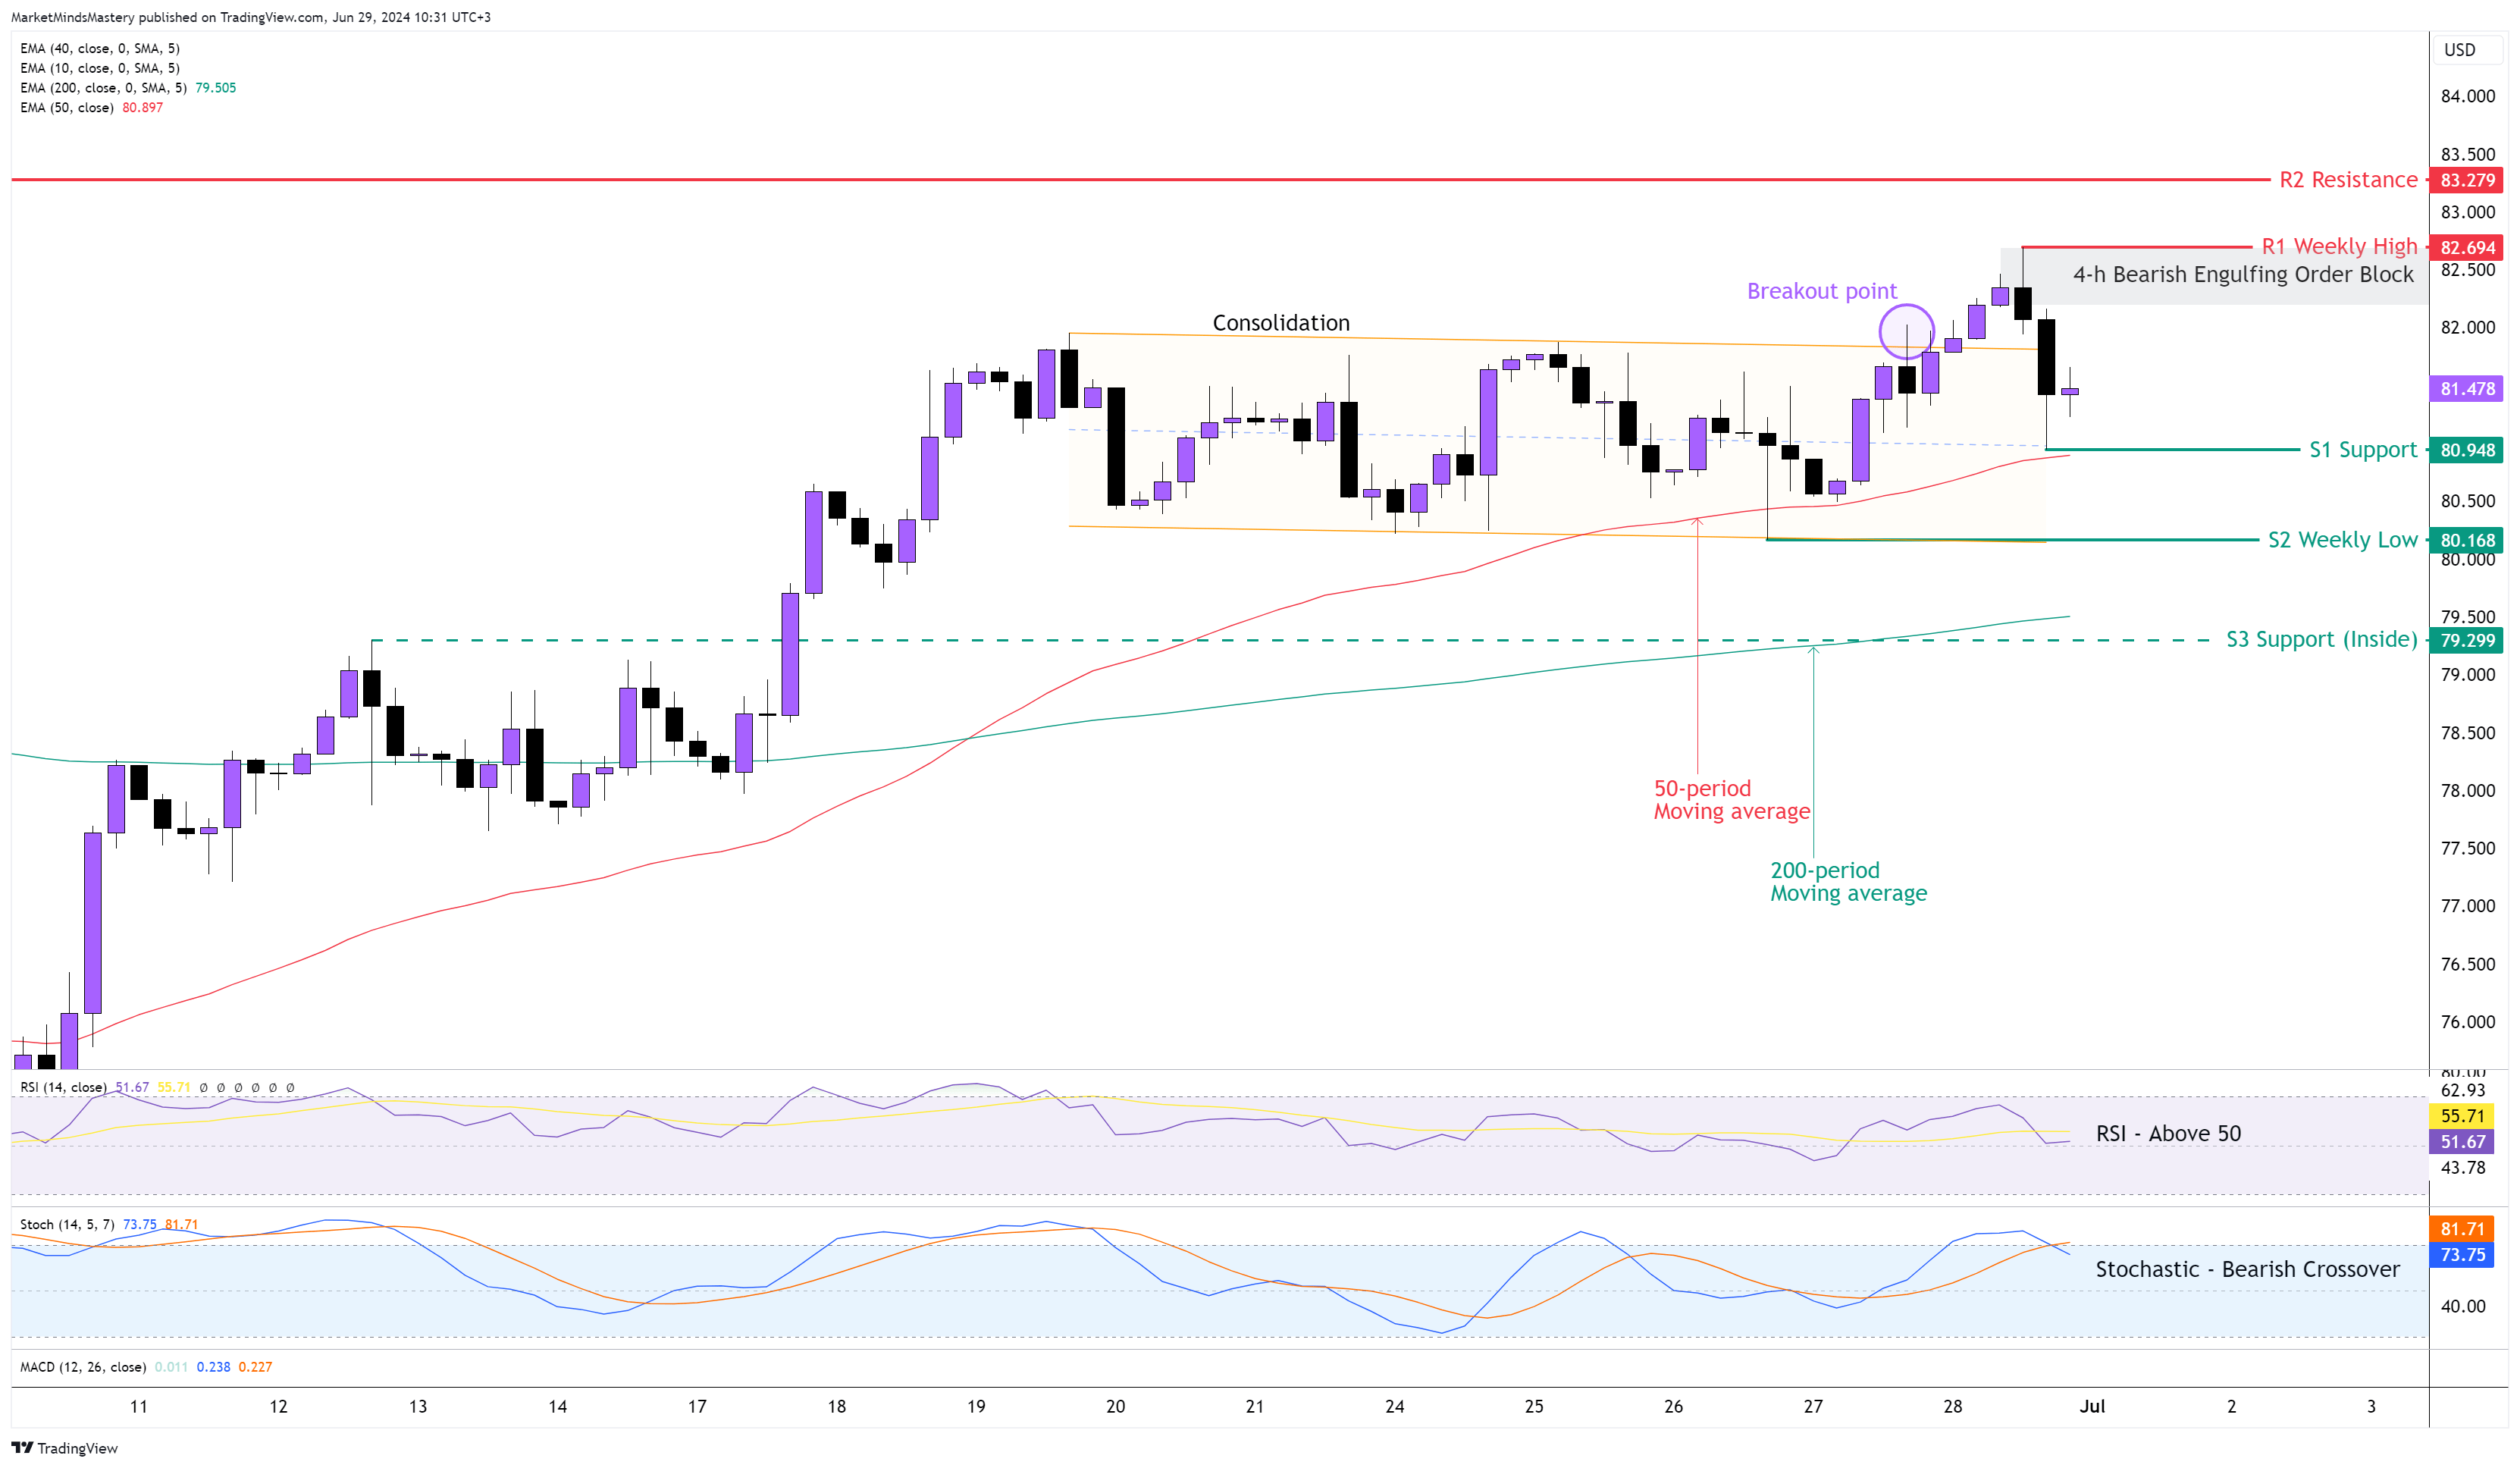
USOIL 4H
Last week, the price made a new high on the weekly chart, but it failed to close above the previous week’s high. The bullish weekly candle has a relatively small body compared to the recent bullish candles, which indicates market weakness.
The 4-hour chart made a new high last Friday, establishing a new market structure of a higher high. As this new higher high formation preceded a consolidation breakout, the price needs to maintain a higher low formation for the market to remain in an uptrend.
The 50-period is above the 200-period, which is bullish. The RSI is above 50, indicating bullishness. The Stochastic Oscillator created a Bearish Crossover while it was in an overbought condition, which suggests that the price might start a corrective phase.
Currently, the price is around the 50-period moving average. If it bounces off and moves upwards, the first resistance area, R1, will be the previous week’s high, around $82.69. Last Friday, a Bearish Engulfing Order Block formed at this level. If the price penetrates the R1 and moves up, the next resistance area, R2, will be at $83.27.
On the other hand, if the price is rejected and moves downwards, the first support area, S1, is around $80.94. If the price moves below the S1 and keeps lowering, the next support area, S2, is the previous week’s low at $80.16.
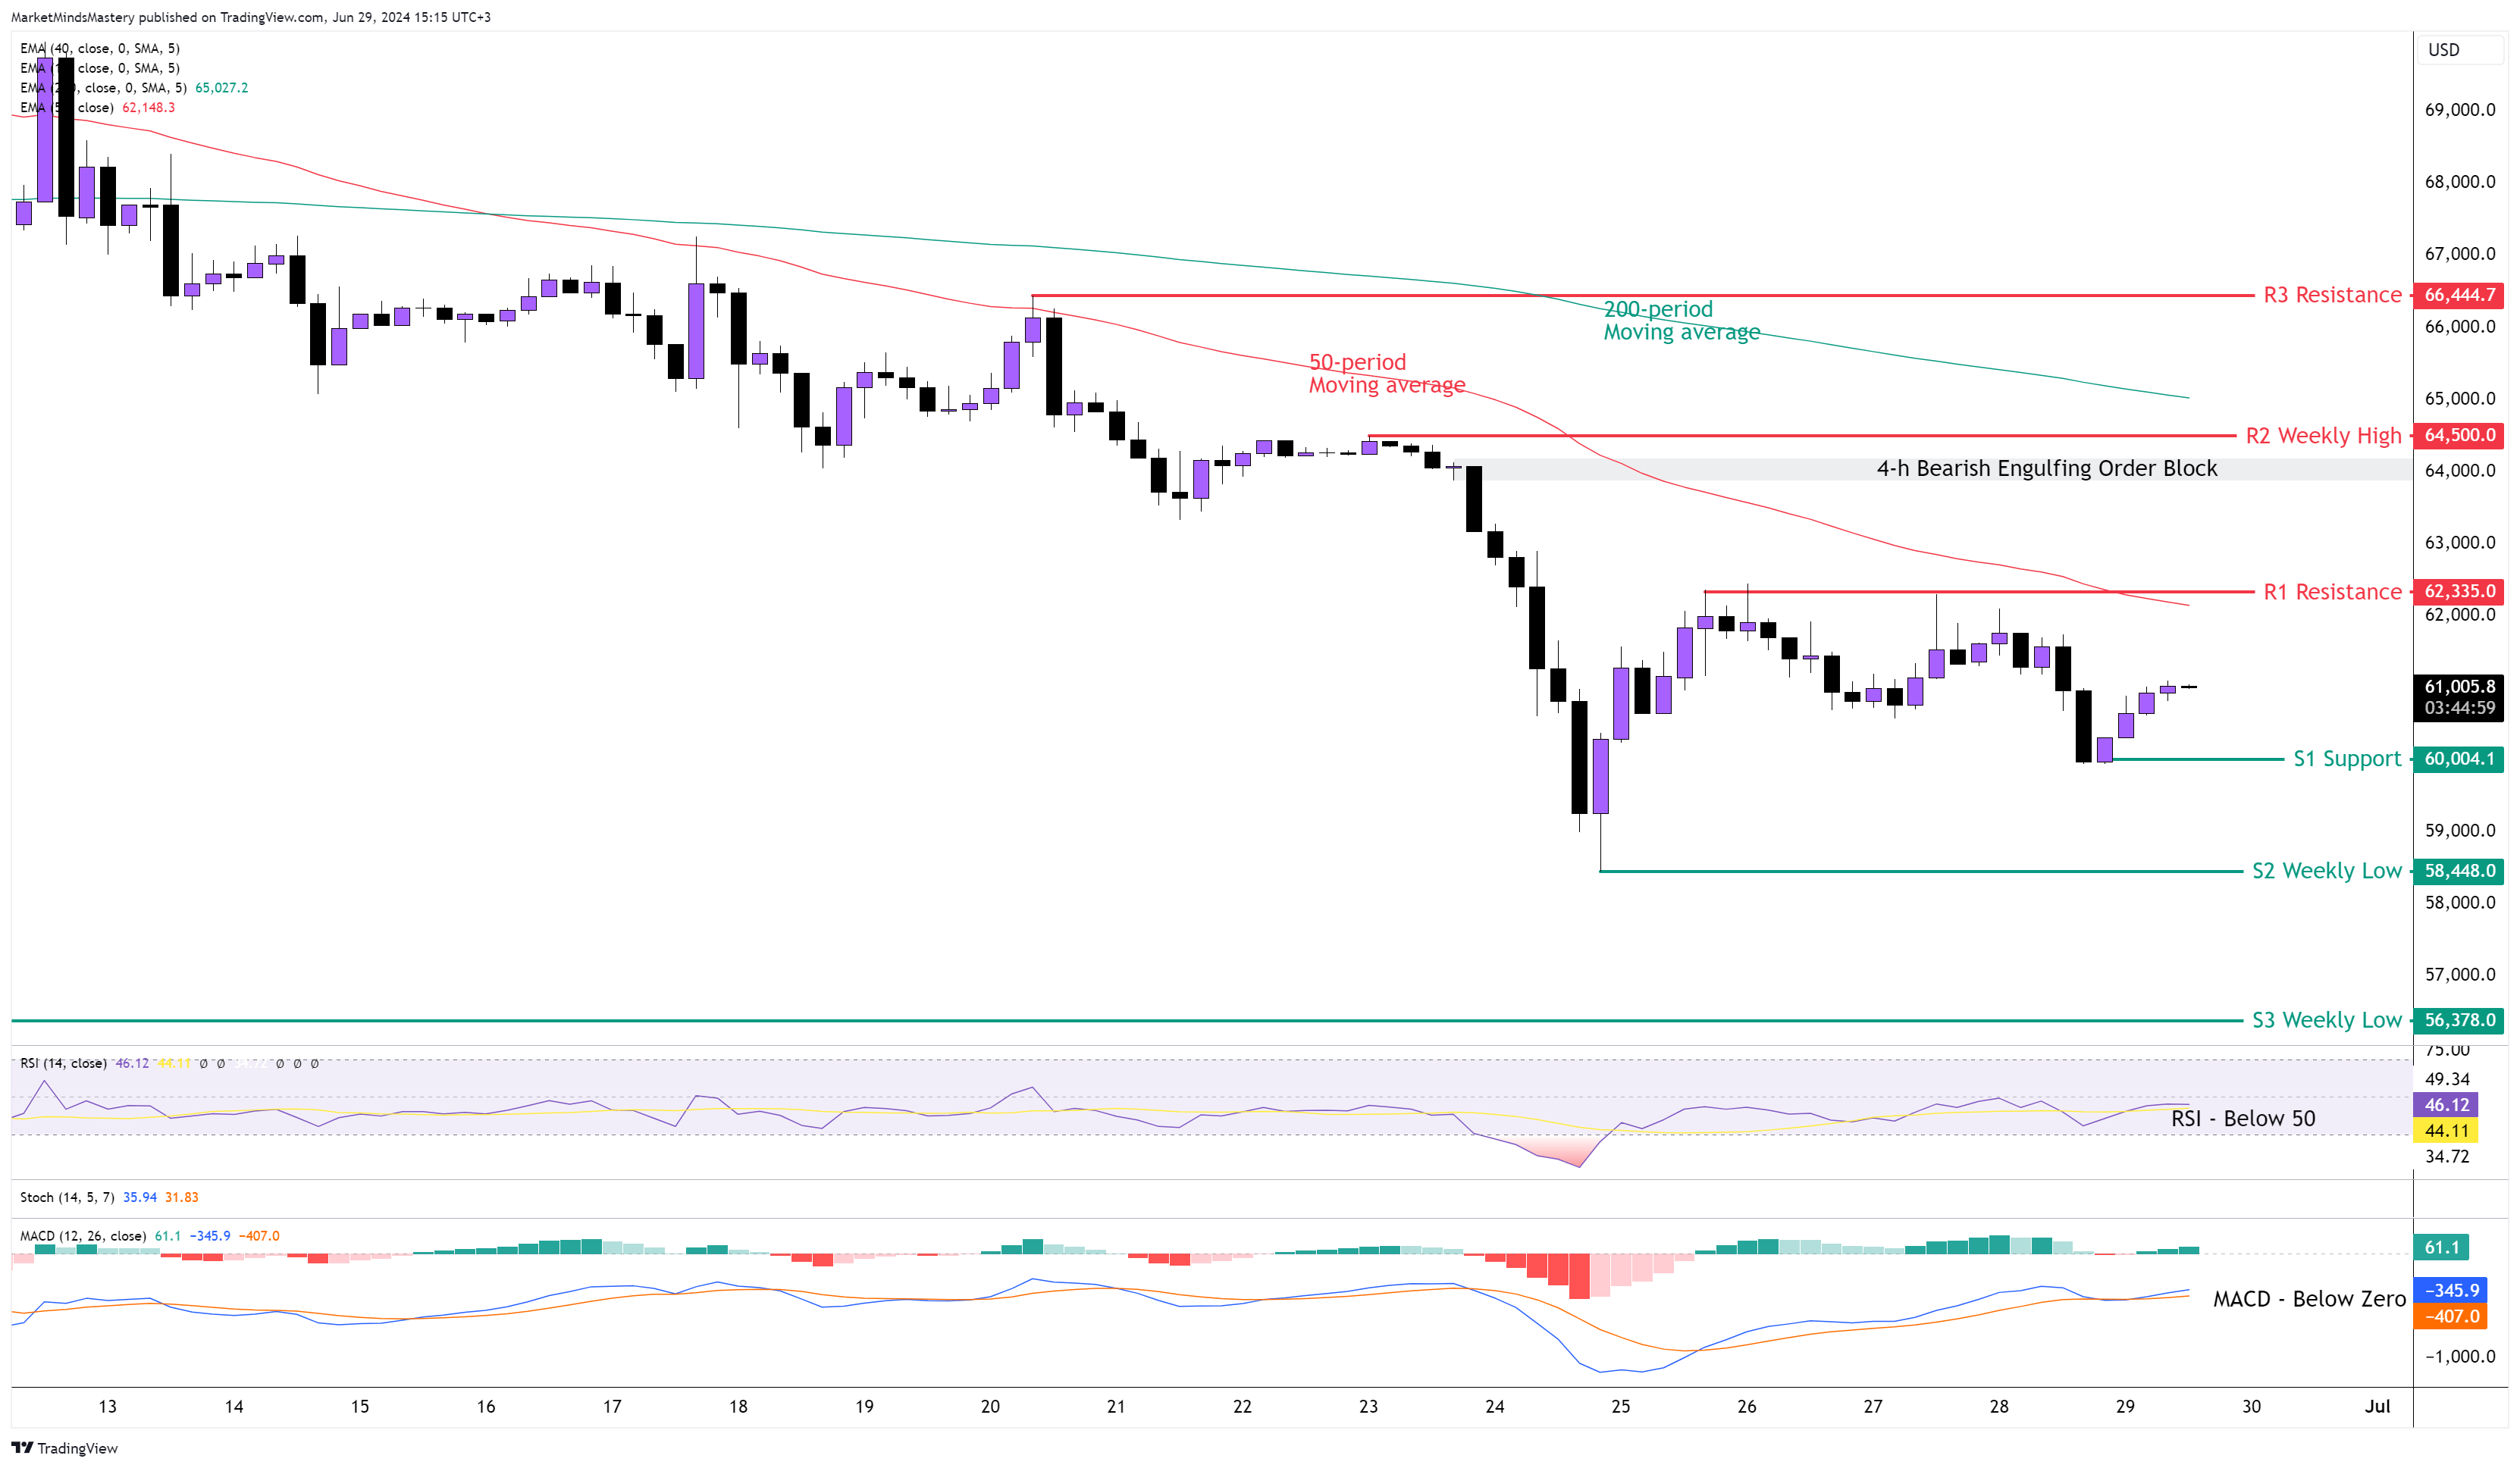
BTC USD 4H
The intense sell-off on Bitcoin continued last week, and last Monday, its price set the RSI and the Stochastic Oscillator in oversold conditions.
The price makes low highs and lower lows, which is bearish. The 50-period moving average is well below the 200-period moving average, with the distance between the two getting wider, which has bearish implications. The RSI Oscillator is below the middle line 50, which is bearish. The MACD is below the zero line, which also has bearish implications.
Currently, the price is in a corrective phase. As long as the market keeps forming lower highs and lower lows, it will be in a downtrend.
If the price continues to move downwards, the first support area, S1, is around $60000. If the price penetrates S1 and moves lower, the next support area, S2, will be the previous week’s low, around $58448. If the price moves below the S2, the next support area, S3, is around $56378.
On the other hand, if the price keeps moving upwards for a deep correction, the first resistance area, R1, is around $62335. This level clusters with the 50-period moving average. In case the price penetrates the R1 and increases, the next resistance area, R2, will be $64500, which is the previous week’s highest price. Below this level, as shown on the chart, there is a Bearish Engulfing Order Block, which can also be a determining factor in this market. A movie above the R2 will signal the end of the downtrend, and the next resistance, R3, is around $66444.
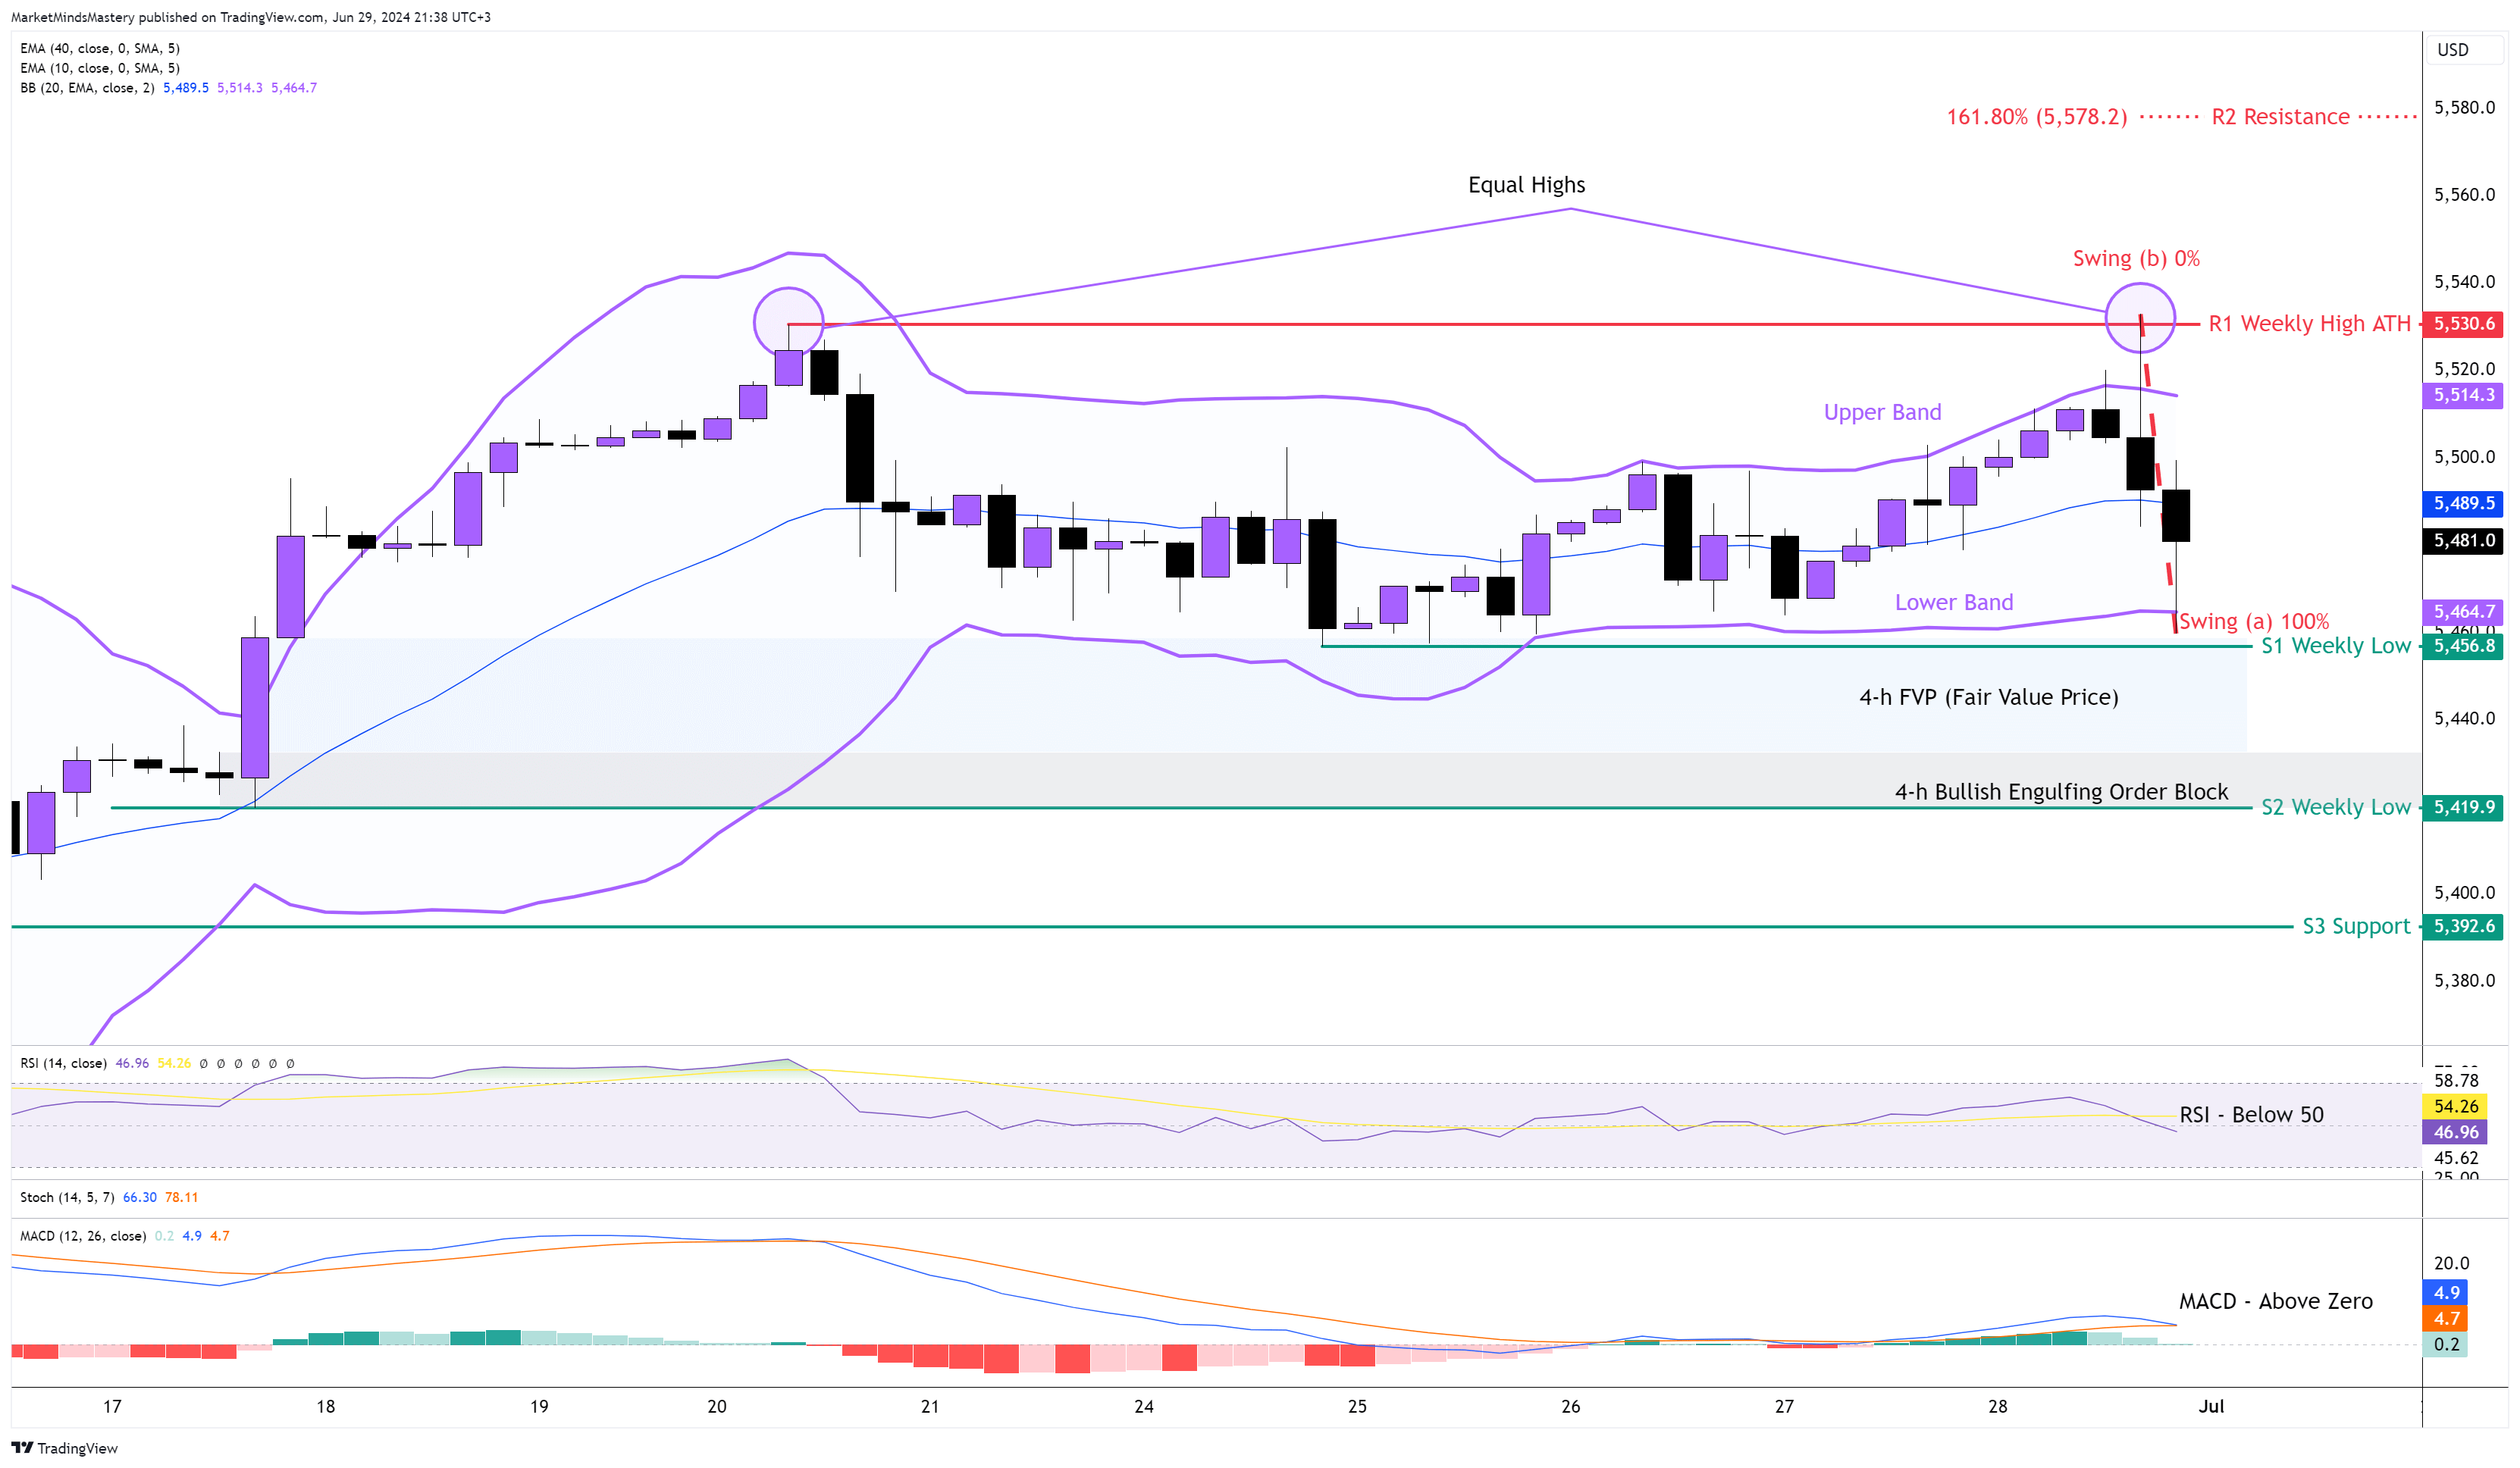
SP 500 4H
Following the previous week’s market outlook, the price tested the ATH we marked on last week’s analysis and declined, creating a doji candle on the weekly chart. Usually, a doji candle preceding a bullish candle in an uptrend signals the end of the upward move, and the market might enter into a corrective phase.
On the 4-hour chart, last Friday, the price created a Bearish Engulfing candle with a long upper wick. The price trades within the upper and lower bands of the Bollinger Band indicator. Last Friday’s Bearish Engulfing candle interacted with the upper band, and before the end of the 4-hour trading session, the candle closed below the upper band, creating a false breakout. The RSI Oscillator below 50 indicates bearishness despite the fact that the price touched the lower band and closed above it. The MACD is above zero, which is bullish. Based on these, the price currently is in an equilibrium phase within a trading range. Therefore, if the price moves downwards, the first support area, S1, will be the previous week’s low, around $5456. Below the S1, there is an “unfilled” FVP. If the price penetrates the S1 and keeps lowering, the next support area, S2, is another weekly low at $5419.
On the other hand, if the price finds support, bounces off, and moves upwards, the first resistance area, R1, will be the previous week’s high at $55309, which happens to be the ATH (All-time High). If the price penetrates the R1 and keeps increasing, the next resistance area, R2, will be estimated to be the 161.8% Fibonacci Extension, around $5578.
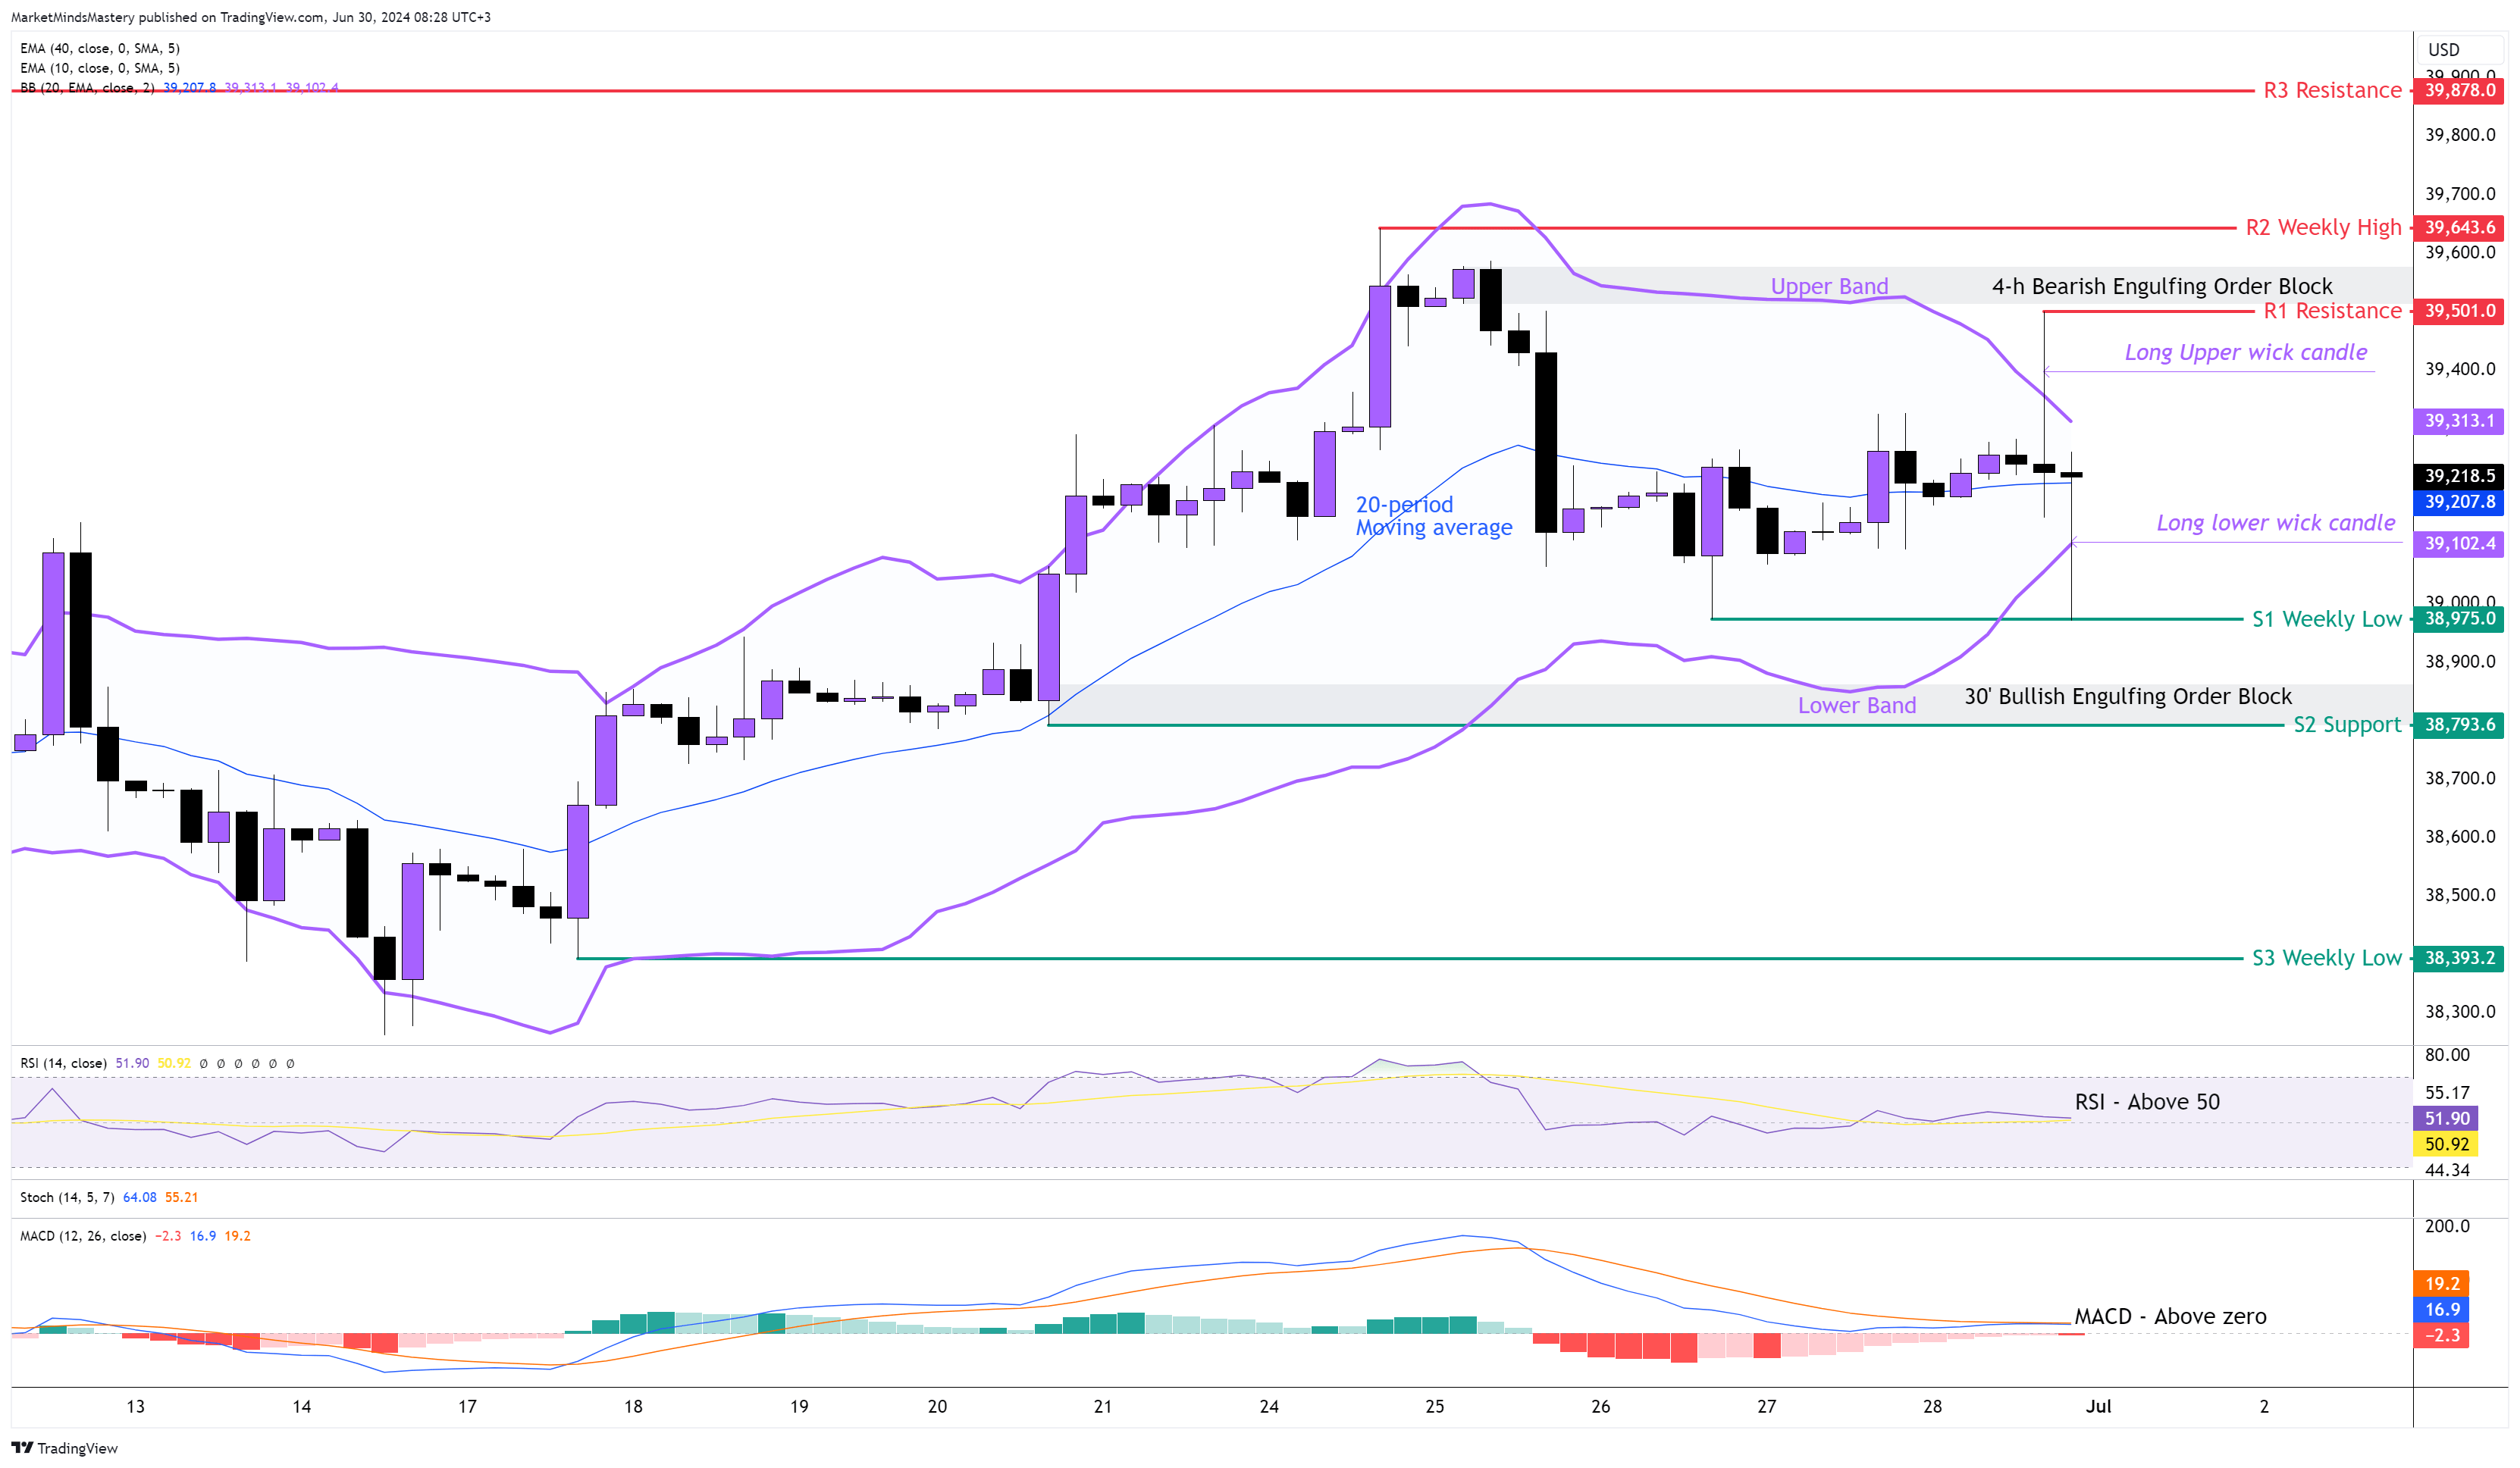
US 30 4H
Last week, the US30 moved upwards as expected, entered into the Bearish Engulfing Order Block we pointed on the previous week’s market outlook, declined and moved downwards until the FVP (Fair Value Price), from where it bounced off and moved away. On the weekly chart, the candlestick formed is a well-defined doji candle.
Based on the swing analysis, the price is still in an uptrend but lagging in momentum. It maintains higher lows but does not make higher highs. We will use the Bollinger Band to examine the market better. The RSI is above 50, which indicates bullishness, and the MACD is above zero, which also indicates bullishness. The Upper and Lower Bands of the Bollinger Band indicator point to each other, which means contracting volatility. Usually, a breakout can lead the price outside of the bands, and the volatility is expected to be noticeable. Last Friday, during the New York Trading session, the price created a Long Upper Wick candle and right after a Long Lower Wick candle.
Currently, the price is above the 20-period moving average. If the price continues to move upwards, the first area of resistance will be the Long Upper Wick’s high, which is around 39643. If the price penetrates the R1 and keeps moving upwards, the next resistance area will be around 39643, which is the previous week’s high. If the R1 and the Bearish Engulfing Order Block below the R1 won’t hold, then the price can move to the next resistance area, R3, around 39878.
On the contrary, if the price moves downwards, the first support area, S1, will be the previous week’s low, around 38975. A further downward move finds the next support area, S2, around 38793.
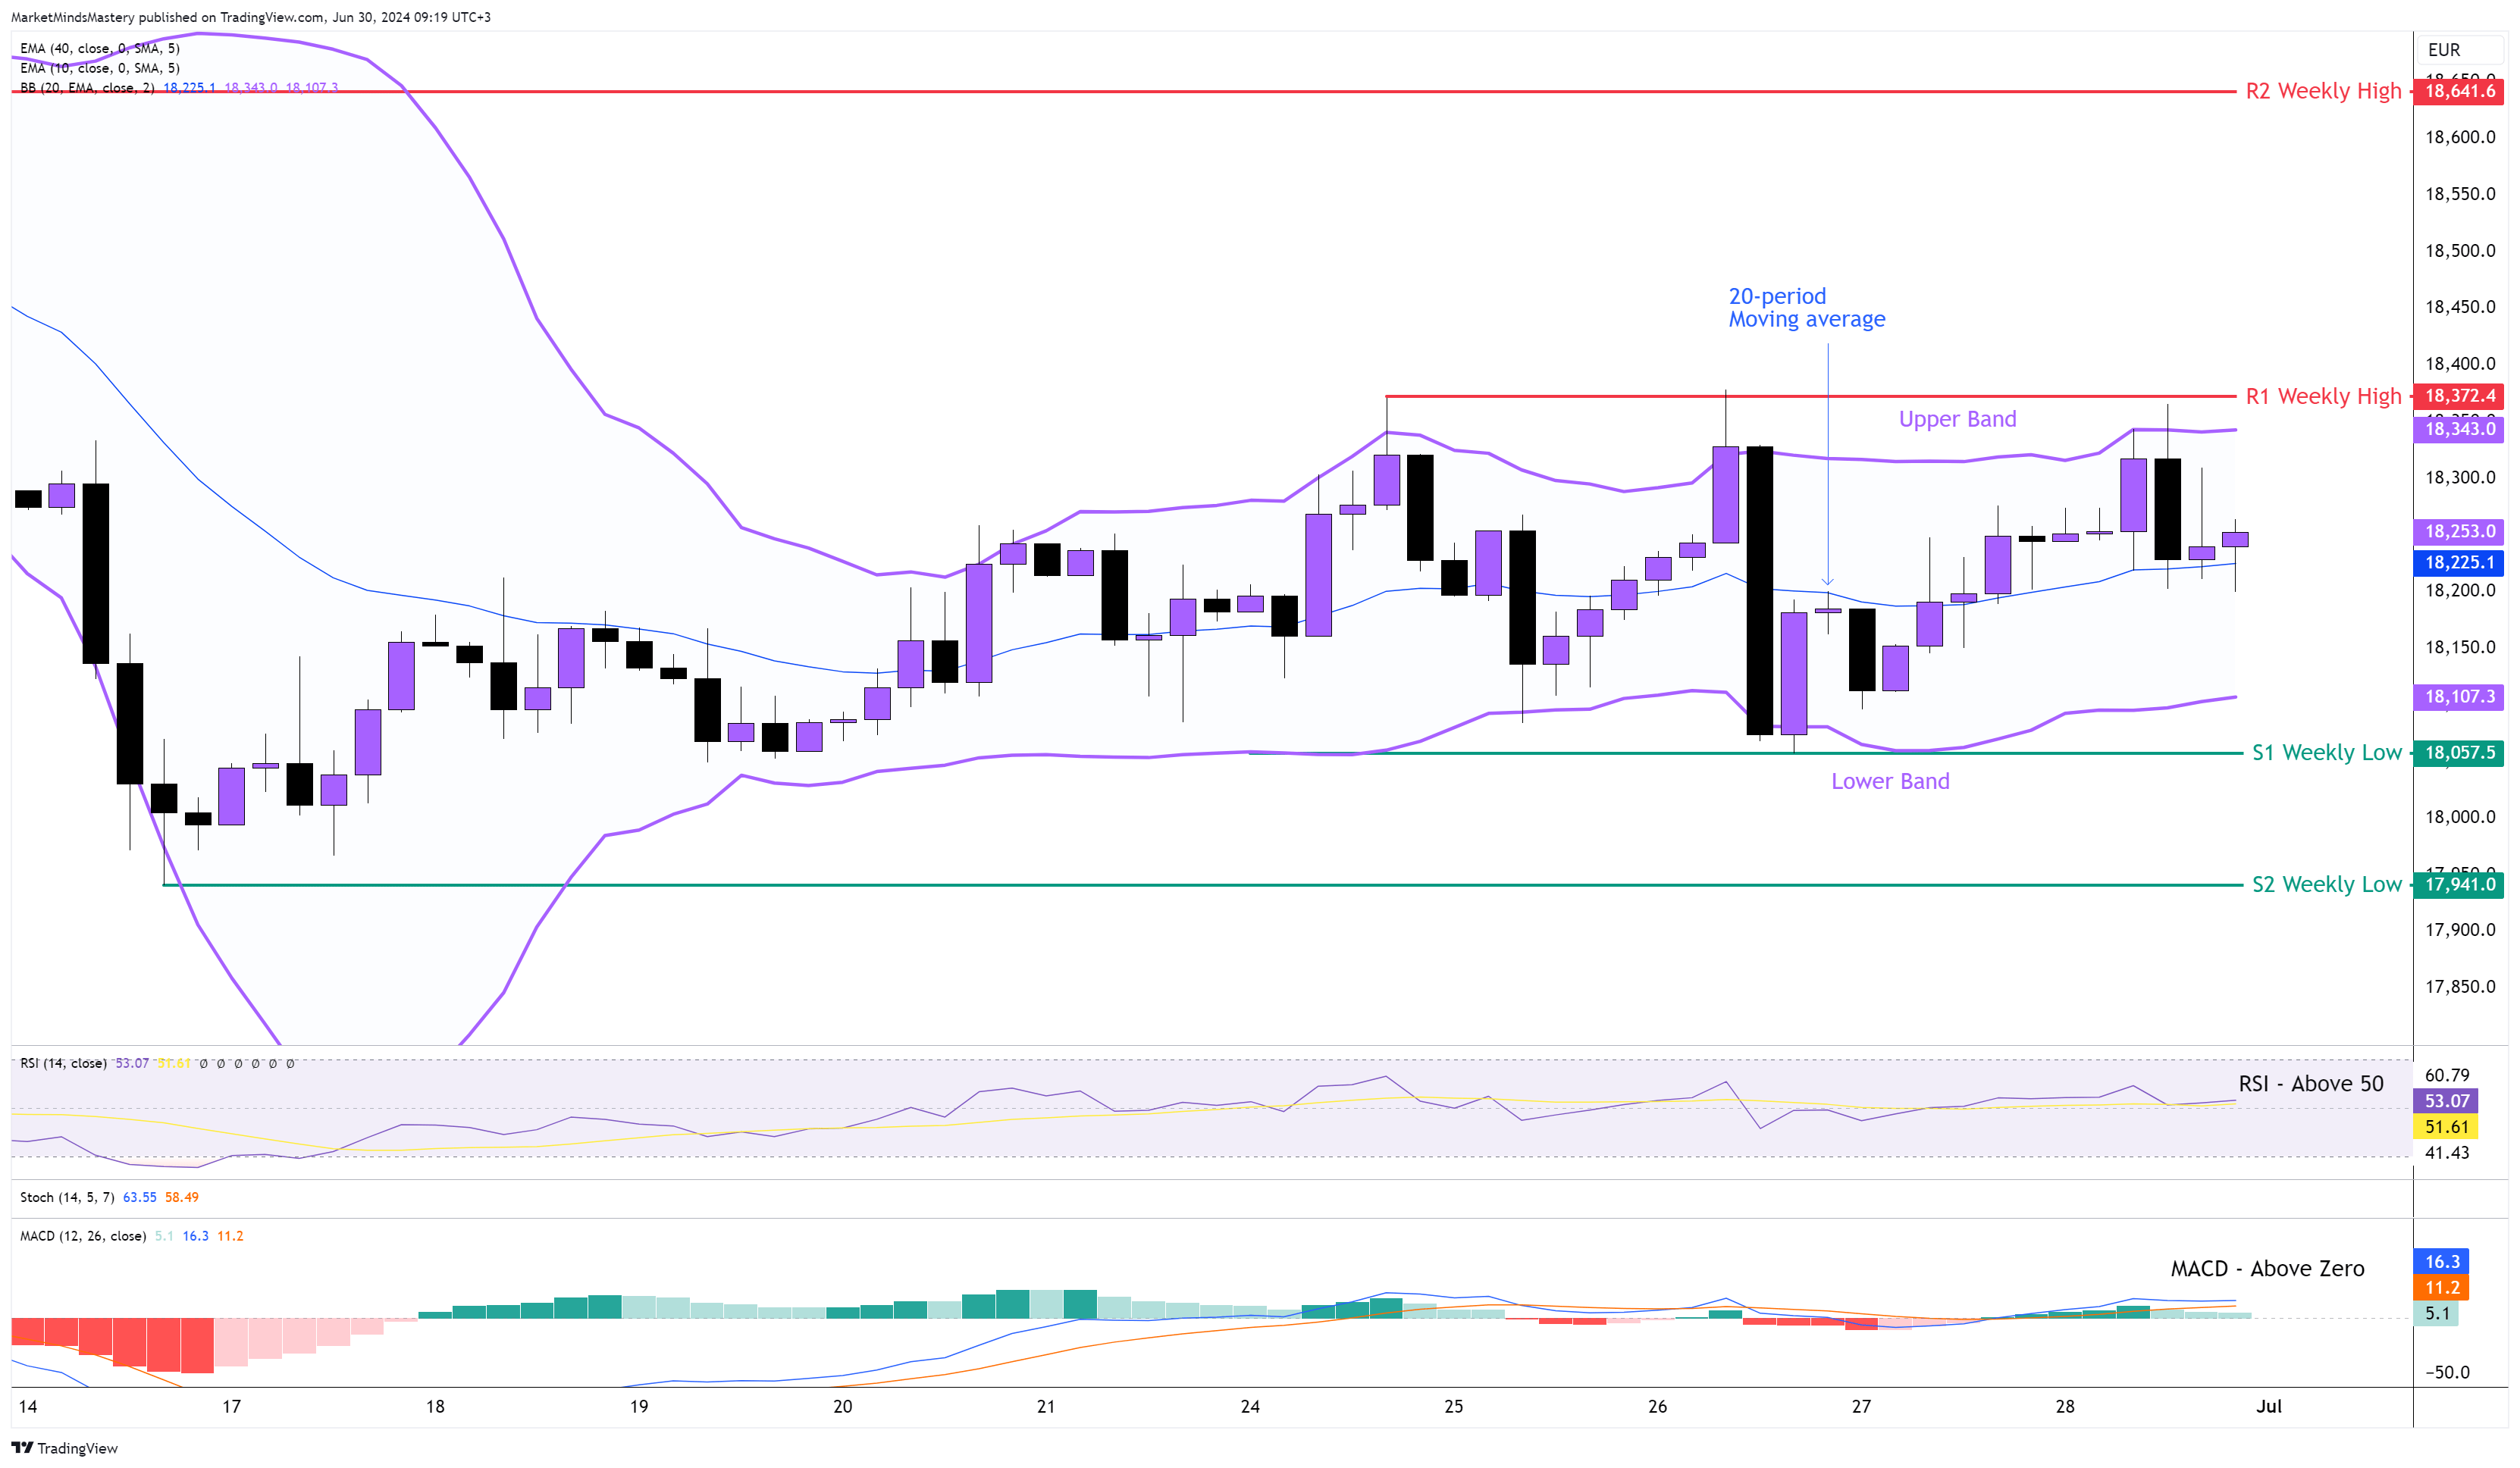
GER 30, 4H
The 4-h Bearish Engulfing Order Block we pointed out on the previous week’s market outlook was tested four times by the price and hold. The weekly candle made a higher high, but it failed to close above the previous weekly candle high and instead remained within its boundaries.
On the 4-hour chart, the price created a range market structure.
Although the Bollinger Band indicator is a trend filter indicator, when the market is ranging, the use of the Bollinger Bands can show if a real breakout occurred after the price takes direction or if the breakout will be a fakeout.
The RSI Oscillator is above 50, and is a bullish indication. The MACD is above zero and flat.
The Upper and Lower bands moving in parallel indicate that the GER30 market is in equilibrium. In this case, we don't use the 20-period moving average as a determining factor of a trending market but rather as an indication of whether the price will move towards the upper or lower band. As the price is above the 20-period moving average, which is the middle line of the Bolling Band indicator, if it continues to move upwards, the first area of resistance R1 will be the previous week’s high, around 18372. In case it penetrates the R1 and keeps moving upwards, the next resistance area, R2, will be another weekly high around 18641. On the other hand, if the price is rejected and moves downwards, the first support area, S1, will be the previous week’s low, around 18057. If the price penetrates the S1 and keeps lowering, the next support area, S2, will be approximately 17941.