Despite the FED keeping Interest Rates in the US higher than any other major Central Bank, the US Dollar was undoubtedly the weakest currency across the Board last week. Gold registered a new ATH (All-Time High), and Sterling, for the second week in the raw, outperformed compared to most of the other currencies. It broke the barrier of the "historical 1.30 level" in the price chart of the GBPUSD and kept rallying.
Additionally, all three major US indices, the SP500, NASDAQ, and the US30, advanced on Friday afternoon during the New York trading session, during the Fed Chairman Powell's speech.
Moving into this week's important events, and as it is the last trading week of August, the news events are less compared to the news during the middle of each month. On Monday, Sterling is expected to have low trading volatility as the banks in the UK will be closed due to the Summer bank holidays. Usually, for day trading, we avoid choosing cross pairs, including the GBP, under this condition. The only significant event for the Euro today is the German IFO Business Climate, which is expected to drop from 87 to 86.2. In the last three months, the actual reported number has decreased. It is not the type of event that causes a change in market structure in the price charts, but traders trading on small time frames may experience some temporarily different market conditions. Moving into the New York trading Session, the Durable Goods Order will be reported, and the forecast estimates a significant increase compared to the previous report. Currently, the number is -6.7% and the forecast shows a positive of 3.8%. If the actual forecast is confirmed and there is agreement on the market orders, the strength of the US dollar may seem possible afterwards.
On Tuesday, the markets are expected to trade normally volatile, as there will be no significant news events during the Tokyo and London trading sessions. We expect some noticeable moves during the New York trading session, as the US Consumer Confidence report will be released, and the expected number is around 100. We won't expect intense price spikes on the charts, but it will always be good to be alert around these events. This is one of the Tuesdays they are short on new events in the markets.
Moving into the middle of the trading week and on Wednesday, the volatility will pick up early during the Asian trading session. In Australia, the CPI (Consumer Price Index) will be reported, and the forecast estimates a drop from 3.8% to 3.6%. It's been three weeks in a row, and the Australian dollar dominates the AUDUSD currency pair. It's almost on its way to a significant resistance level. If the CPI is confirmed as a lower number based on the forecast, and if by that time the price reaches the key level of resistance, as we will point out in the charts below, there might be a good confirmation by both the technical side and the macroeconomic side as where the price is likely to move to.
Additionally, currency parts like AUDJPY, EURAUD, and GBPAUD can also offer trading opportunities based on the possible weakness of the Australian Dollar. The next and last significant event for the day will be the Crude Oil Inventories in the US. Recent reports show there are more crude oil barrels held in inventories, which means there is more supply than demand. This usually affects the Canadian dollar negatively despite this being a US indicator.
Moving into Thursday events in Japan, in the early morning, they will report the Consumer Confidence. The consensus estimates an increase from 36.7 to 37.1.
The next significant event will be the CPI (Consumer Price Index) in Germany. It will be very critical to see whether the Euro will decline and enter into a corrective phase if the actual number drops as per the forecast, which estimates the drop from 0.3% to 0%. Last week, the Euro penetrated the important 1.10 level against the US Dollar and kept rallying. If the market participants confirm the actual number in a negative report, it might create some setback for the EURUSD. Moving into the New York trading session, in the US, the GDP (Gross Domestic Product) is expected to be reported at the same 2.8%. This is always a significant event that attracts a lot of traders and general market participants' attention as the volatility usually escalates and offers trading opportunities for traders, particularly to day traders. At the same time, the Unemployment Claims in the US will be reported, and the forecast estimates an increase in the number from 232K to 234K. Usually, a rising number is not good for the US Dollar as it shows that more people claim government benefits than in the last report.
The trading day will end with Switzerland's National Bank Chairman Jordan's speech. The SNB will report their new interest rate number on September 26. So, until then, during his following speeches, we will find clues about the health of Switzerland's economy.
On Friday, which is the last trading day of this week and of August, the markets will become active from the Asian trading session. In Japan, they will report the CPI (Consumer Price Index). The forecast estimates the same number as the last report, which was 2.2%. As this is forecasted as an unchanged number, it might weaken the Japanese Yen. Still in Japan, and the next important event will be Retail Sales. The forecast estimates a drop from 3.7% to 2.8%. Next, in Australia, Retail Sales are expected to drop from 0.5% to 0.4%. If the Australian dollar becomes one of the weak currencies, this event can add some more weakness to the Aussie, in case the actual number and the forecast number agree.
Moving on to the European and London trading Sessions, in the Eurozone, they will report the CPI (Consumer Price Index). The forecast estimates a significant drop from 2.6% to 2.2%. If the actual reported number confirms the forecast, and if the market follows through, we can see a decline in the Euro. As we explained earlier, if the Euro reaches the next key level of resistance and then declines, a weak CPI number will add more to the downside move. The last significant event for the day, the week and the month will be the GDP (Gross Domestic Product) in Canada. The forecast shows a drop from 0.2% to 0.1%. This can cause weakness in the Canadian Dollar. In terms of high time frames and based on the primary trends, the EURCAD and the GBPCAD are generally rising. If the Canadian Dollar weakens and the market follows through, the uptrend on these two might continue.
EUR USD 4H

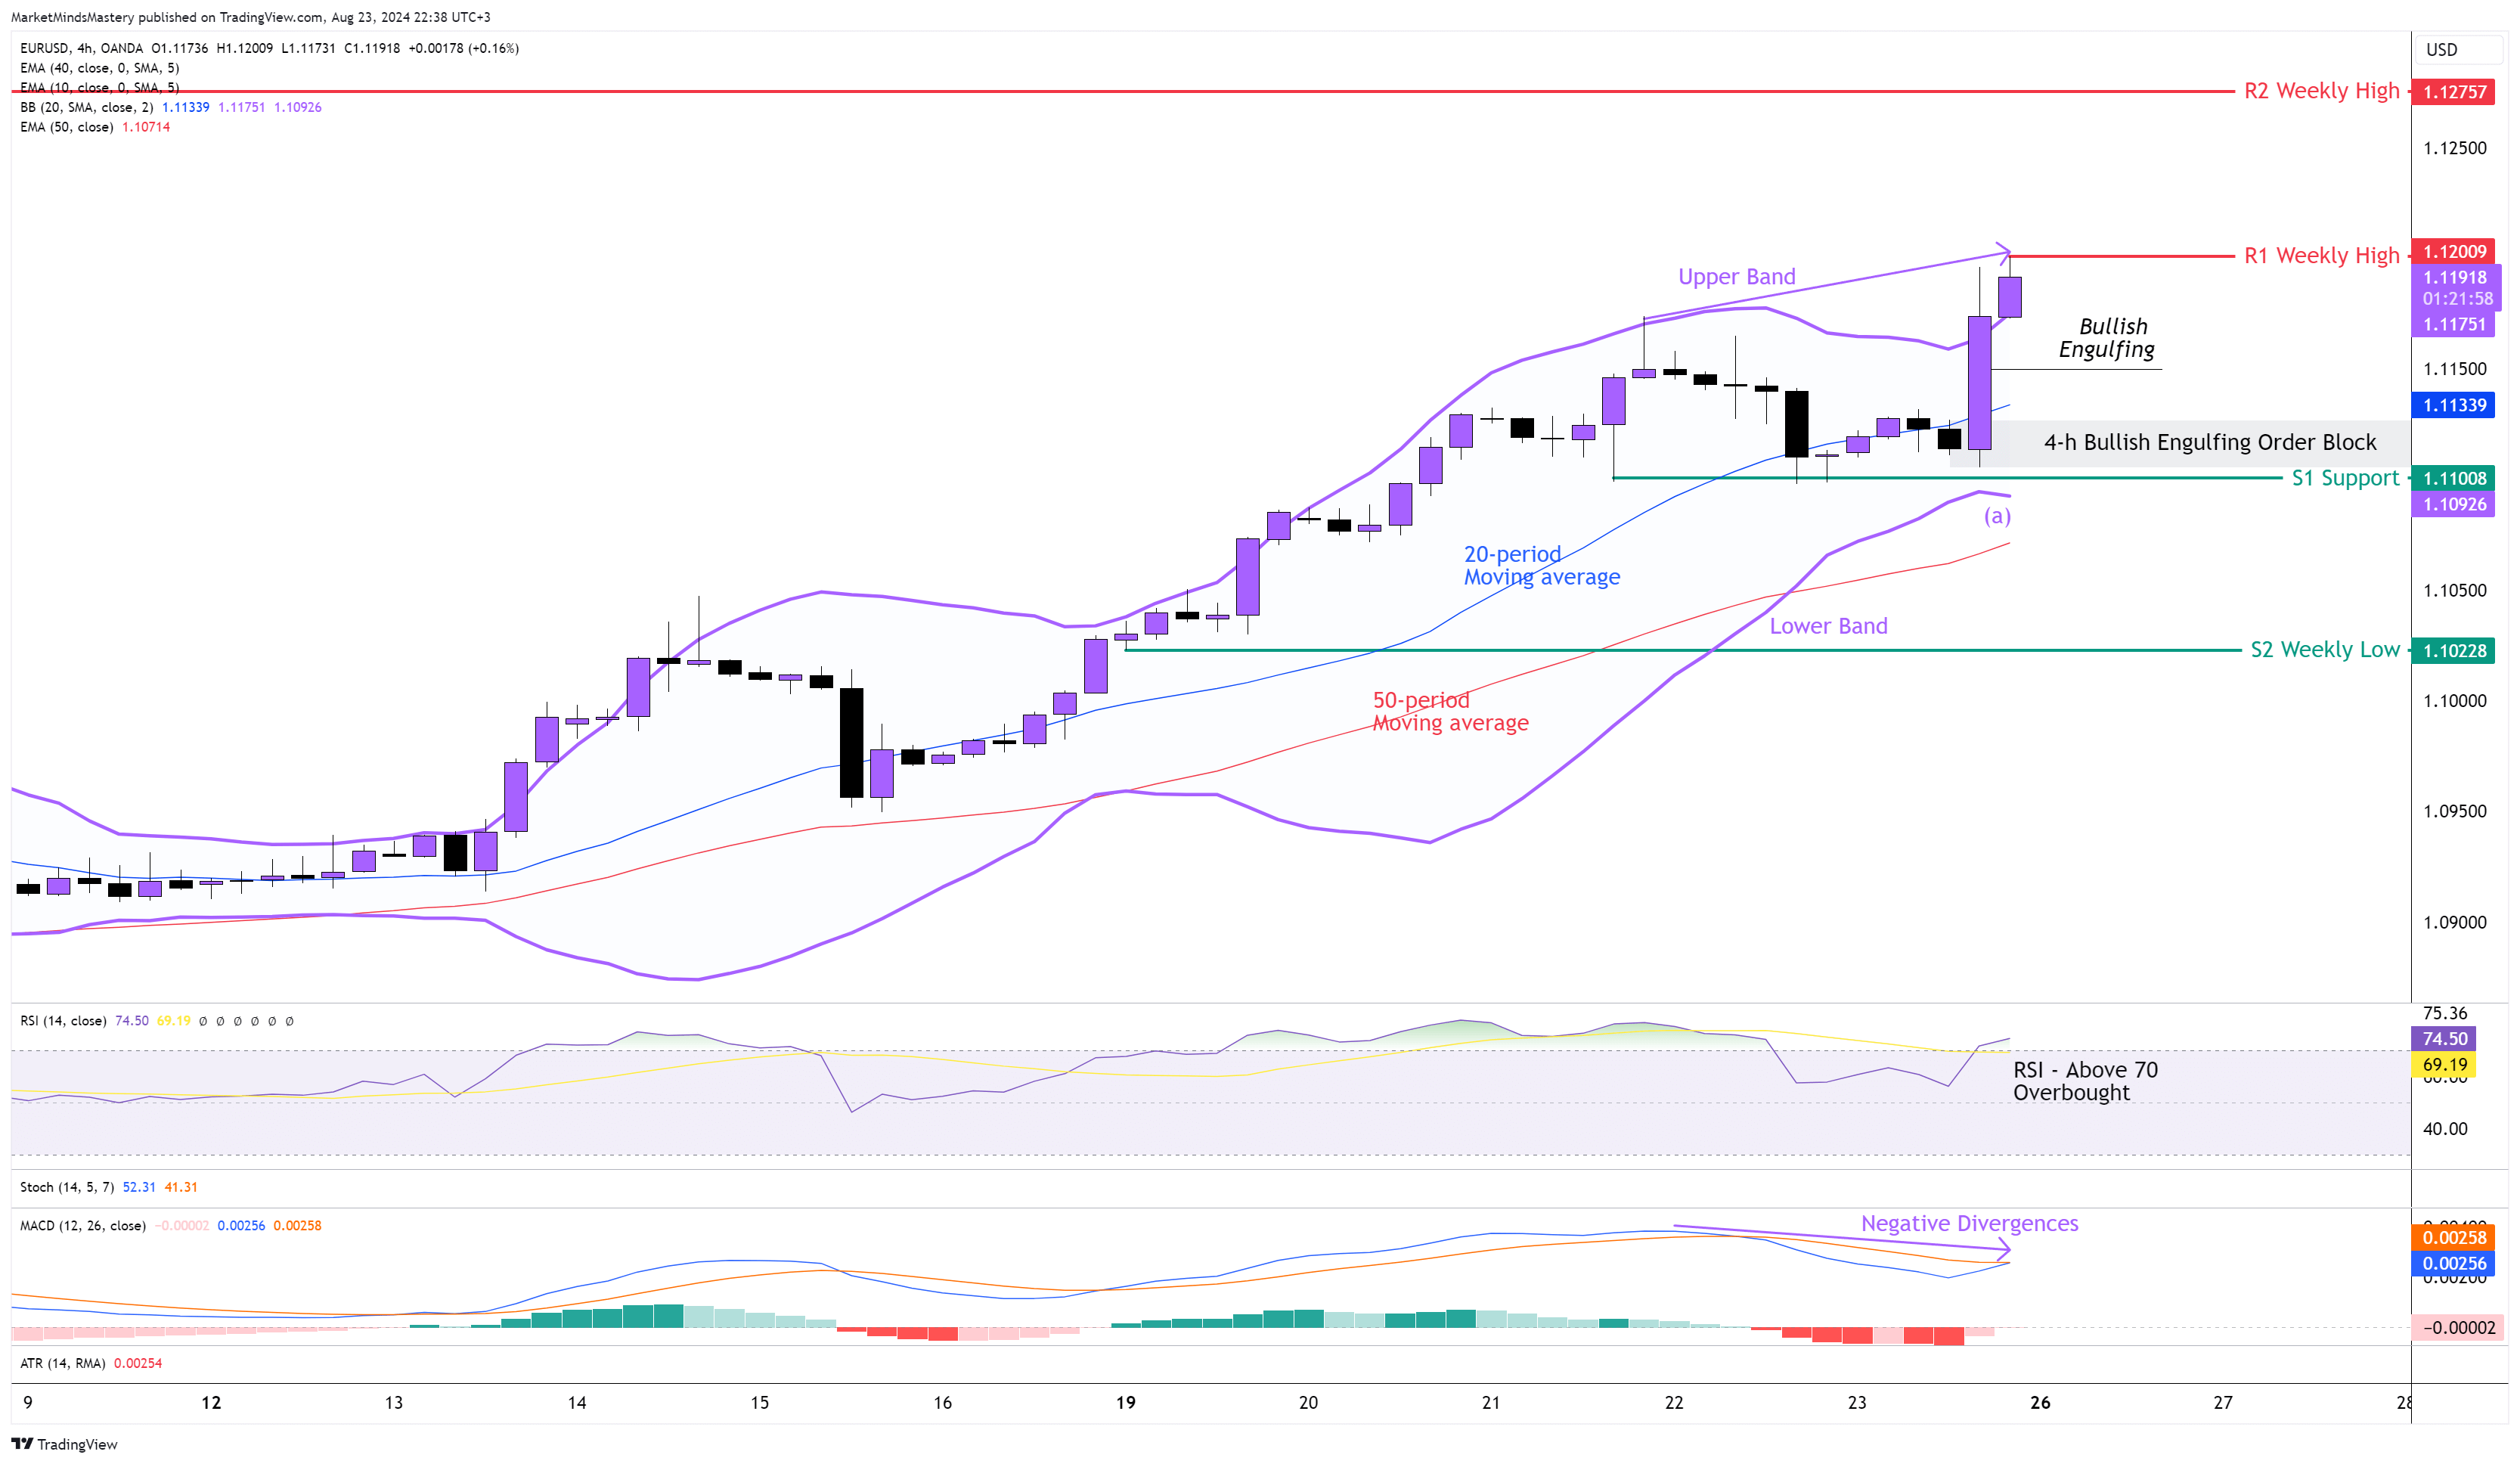
Following the US Dollar's weakness across the Board and the recent strength of the Euro, the price of the EURUSD currency pair kept moving upward last week with almost no retracement. The price consolidation within the Bollinger Band's Upper and Lower Bands ended up as a Bullish breakout last Friday during Powell's speech. That also made the weekly chart, which in our analysis we consider the primary trend, print a Bullish Marubozu candle significantly large, based on the ATR (Average True Range) indicator (not shown on the chart above). On the 4-hour chart, the price moved above the Upper Band with a Bullish Engulfing Candlestick while the Lower Band turned and pointed downwards (a). This usually validates the upside breakout. The middle line of the Bollinger Bands indicator represents the 20-period moving average, and it's above the 50-period moving average, which is bullish. The RSI line reached the number 70, which means that the Oscillator is in an Overbought condition, and this is also bullish. The MACD shows Negative Divergences after the price rose to a new high last Friday. This can set the price into a corrective phase next week. If the price keeps moving upwards, the first resistance area, R1, will be the previous week's high, around 1.12, a price level that can be attractive to traders next week. If the price penetrates the R1 and keeps increasing, the next resistance area, R2, will be around 1.12757.
On the other hand, if the price declines and moves downward, the first support area, S1, will be 1.11. This level is significant because the Order Block developed there last week coexists with the Lower Band. If the price manages to penetrate the S1 and go through, the next support area, S2, will be around 1.10228, which is the previous week's low.
GBP USD 4H
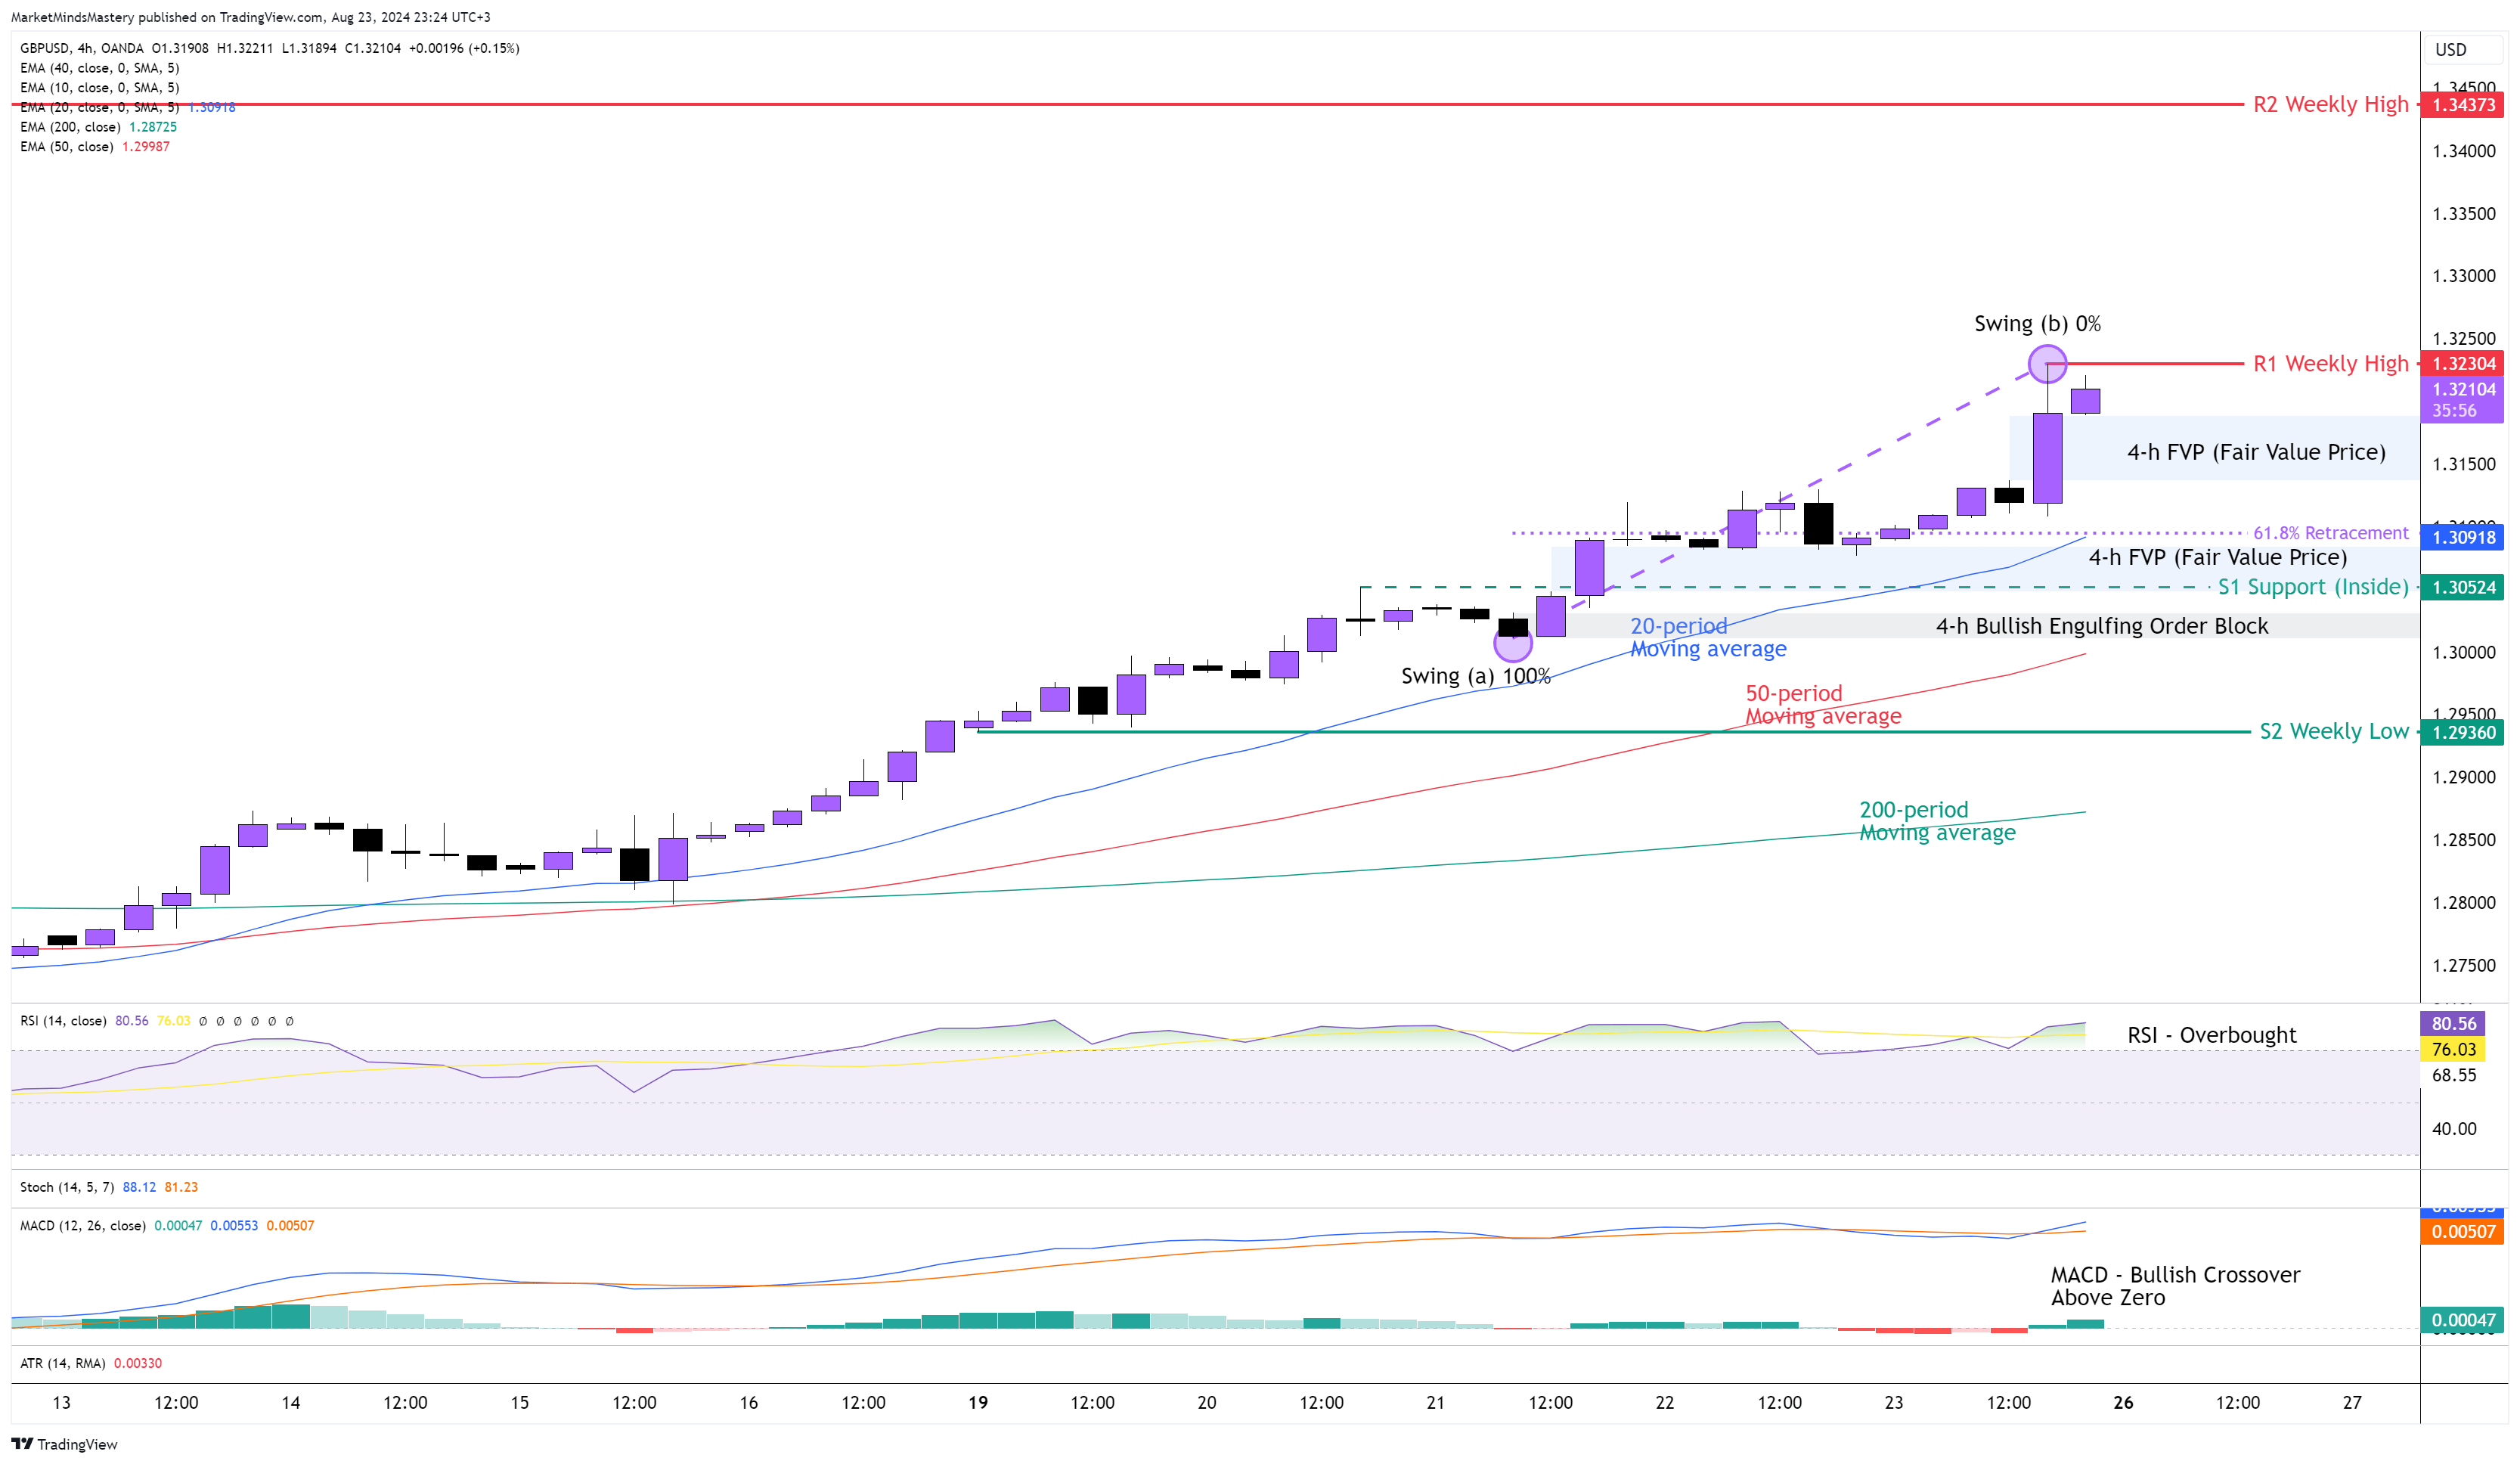
Sterling's strength was noticeable last week. The Long Bullish Marubozu candle printed on the weekly chart signified the significant strength in the GBPUSD pair. Every trader first observes that the GBPUSD currency pair is Overbought, as per the RSI Oscillator, which has remained above 70 since last week. The 20-period moving average is above the 50-period, and the 50-period is above the 200-period moving average. The MACD is above its Zero Line, and recently, the MACD Line (Blue) crossed above the Signal Line (Orange), which is a bullish indication. As the trend in this 4-hour time frame is up, as per the Dow Theory, the price is expected to continue moving upwards until a major swing low breaks. Using the Fibonacci retracement tool to measure the potential retracement, front the swing low (a) to the swing high (b), the Golden ratio 61.8% lays approximately around the S1 inside support, the 20-period moving average and the FVG (Fair Value Price).
Starting Monday, if the price continues moving upwards, the first resistance area, R1, will be around 1.32304, which happens to be the previous week's high. If the price penetrates the R1 and keeps increasing, the next resistance area, R2, will be approximately 1.34373, which is an old weekly high. Oppositely, if the price starts a corrective phase and moves downwards, the first support area will be the S1 (Insides) support around 1.30524, a key level, as we just explained, because of the confluence of the factors mentioned above. A further downward move will find the next support area, S2, around 1.2936, which this is the previous week's low.
AUD USD 4H
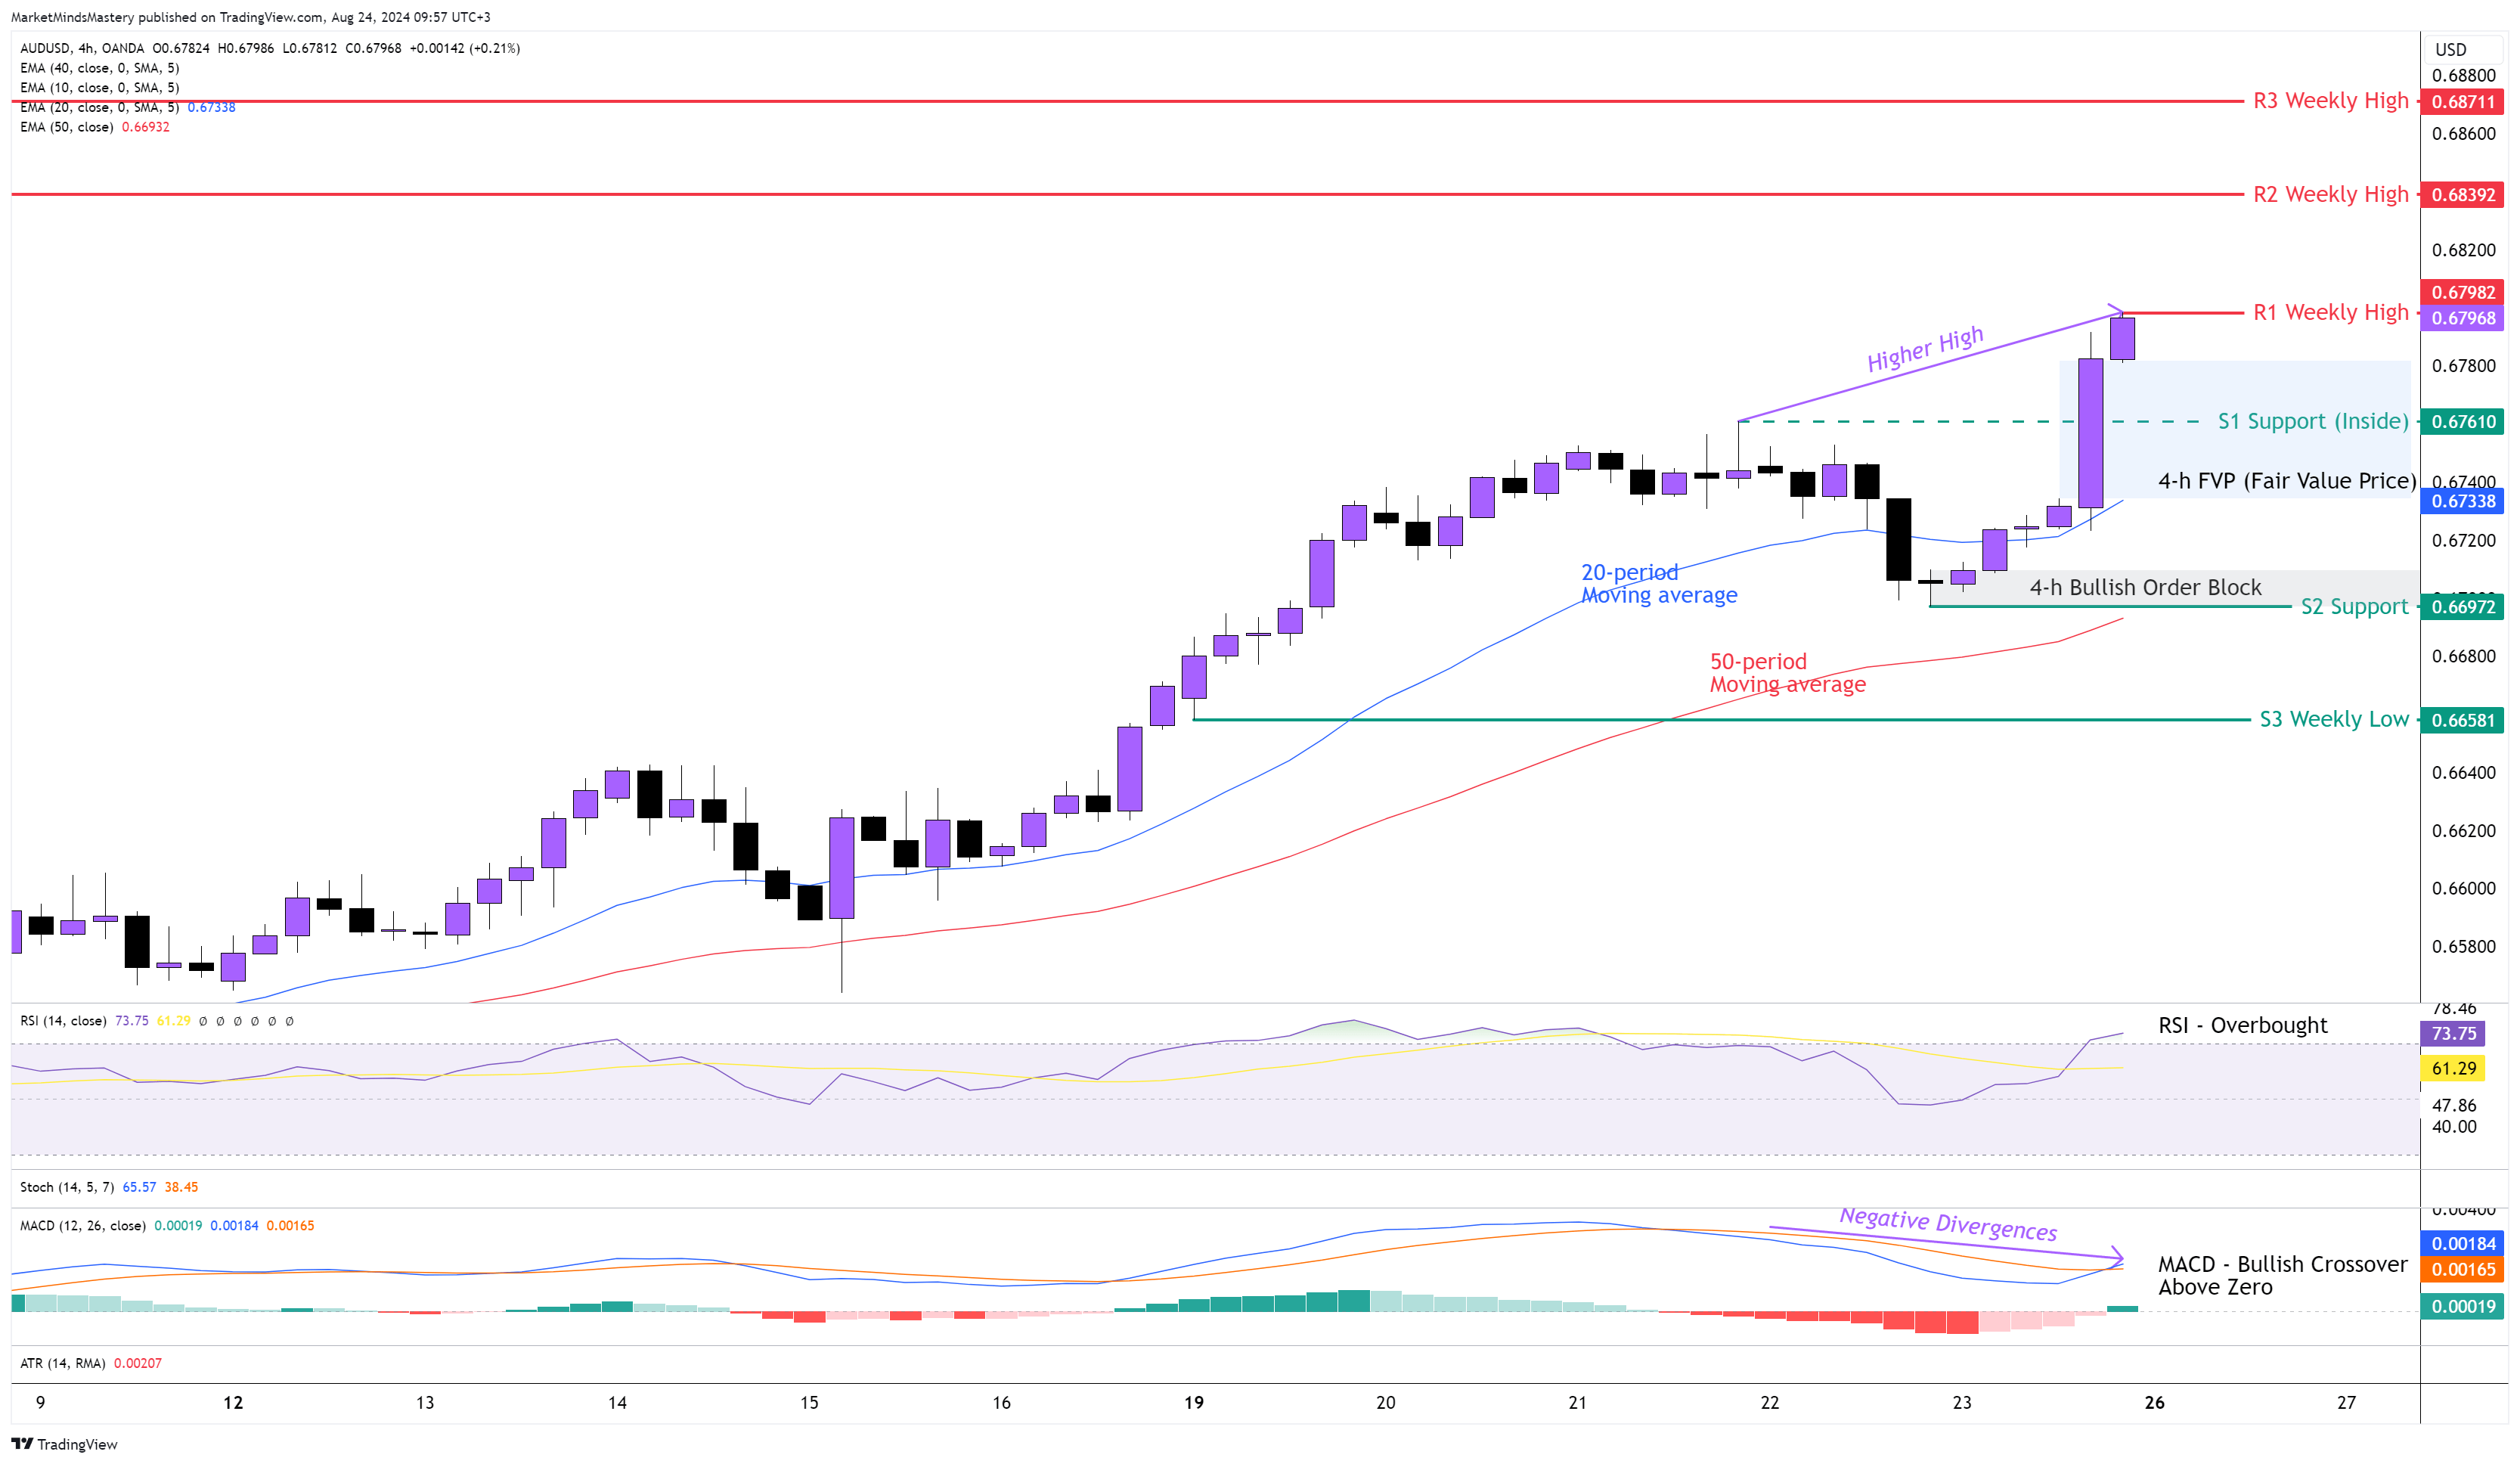
Another bullish week it ended for the Aussie last week, with the AUDUSD currency pair reaching a significant price level, the 0.68000. The price action on the weekly chart ended up being a Bullish candle with a Long Body. Last Friday, after Powell's speech, the AUSUSD pair exploded to the upside with a move of approximately 700 points (70 pips), which was almost four times more than the pair's ATR (Average True Range) at that time. As per the trend analysis using moving averages, the 20-period is above the 50-period, and this is bullish. The RSI is above the 70 area, which means that the market is Overbought. As per the swing analysis, the price created a higher low and a higher high formation, but the MACD didn't follow with a new high and showed Negative Divergences. This first means the price might enter a corrective phase. As there is no swing high or confirmed price action reversal, we can't use the Fibonacci retracement tool to project the levels of retracements. However, if the price enters a retracement phase, which means it will move against the prevailing trend, which is downwards, the first support area, S1, will be inside support, around 0.67610. In the same area, an FVP (Fair Value Price) was created last Friday. If the price penetrates the S1 and declines further, the next support area, S2, will be around 0.67000. Last Thursday, a Bullish Order Block was created in this area, which can add more significance to the price level. If the price penetrates the S2 and moves lower, then we will see a break of an important swing low in the chart, and the uptrend will end.
On the contrary, if the price keeps moving upwards, the first resistance area, R1, will be the previous week's high around 0.68000, only 4 pips below the weekly candle's close. If the price breaks through the R1 level and keeps moving upwards, the next resistance area, R2, will be around 0.68392. If a further upward move occurs, the next resistance area, R3, will be approximately 0.68711.
USD JPY 4H
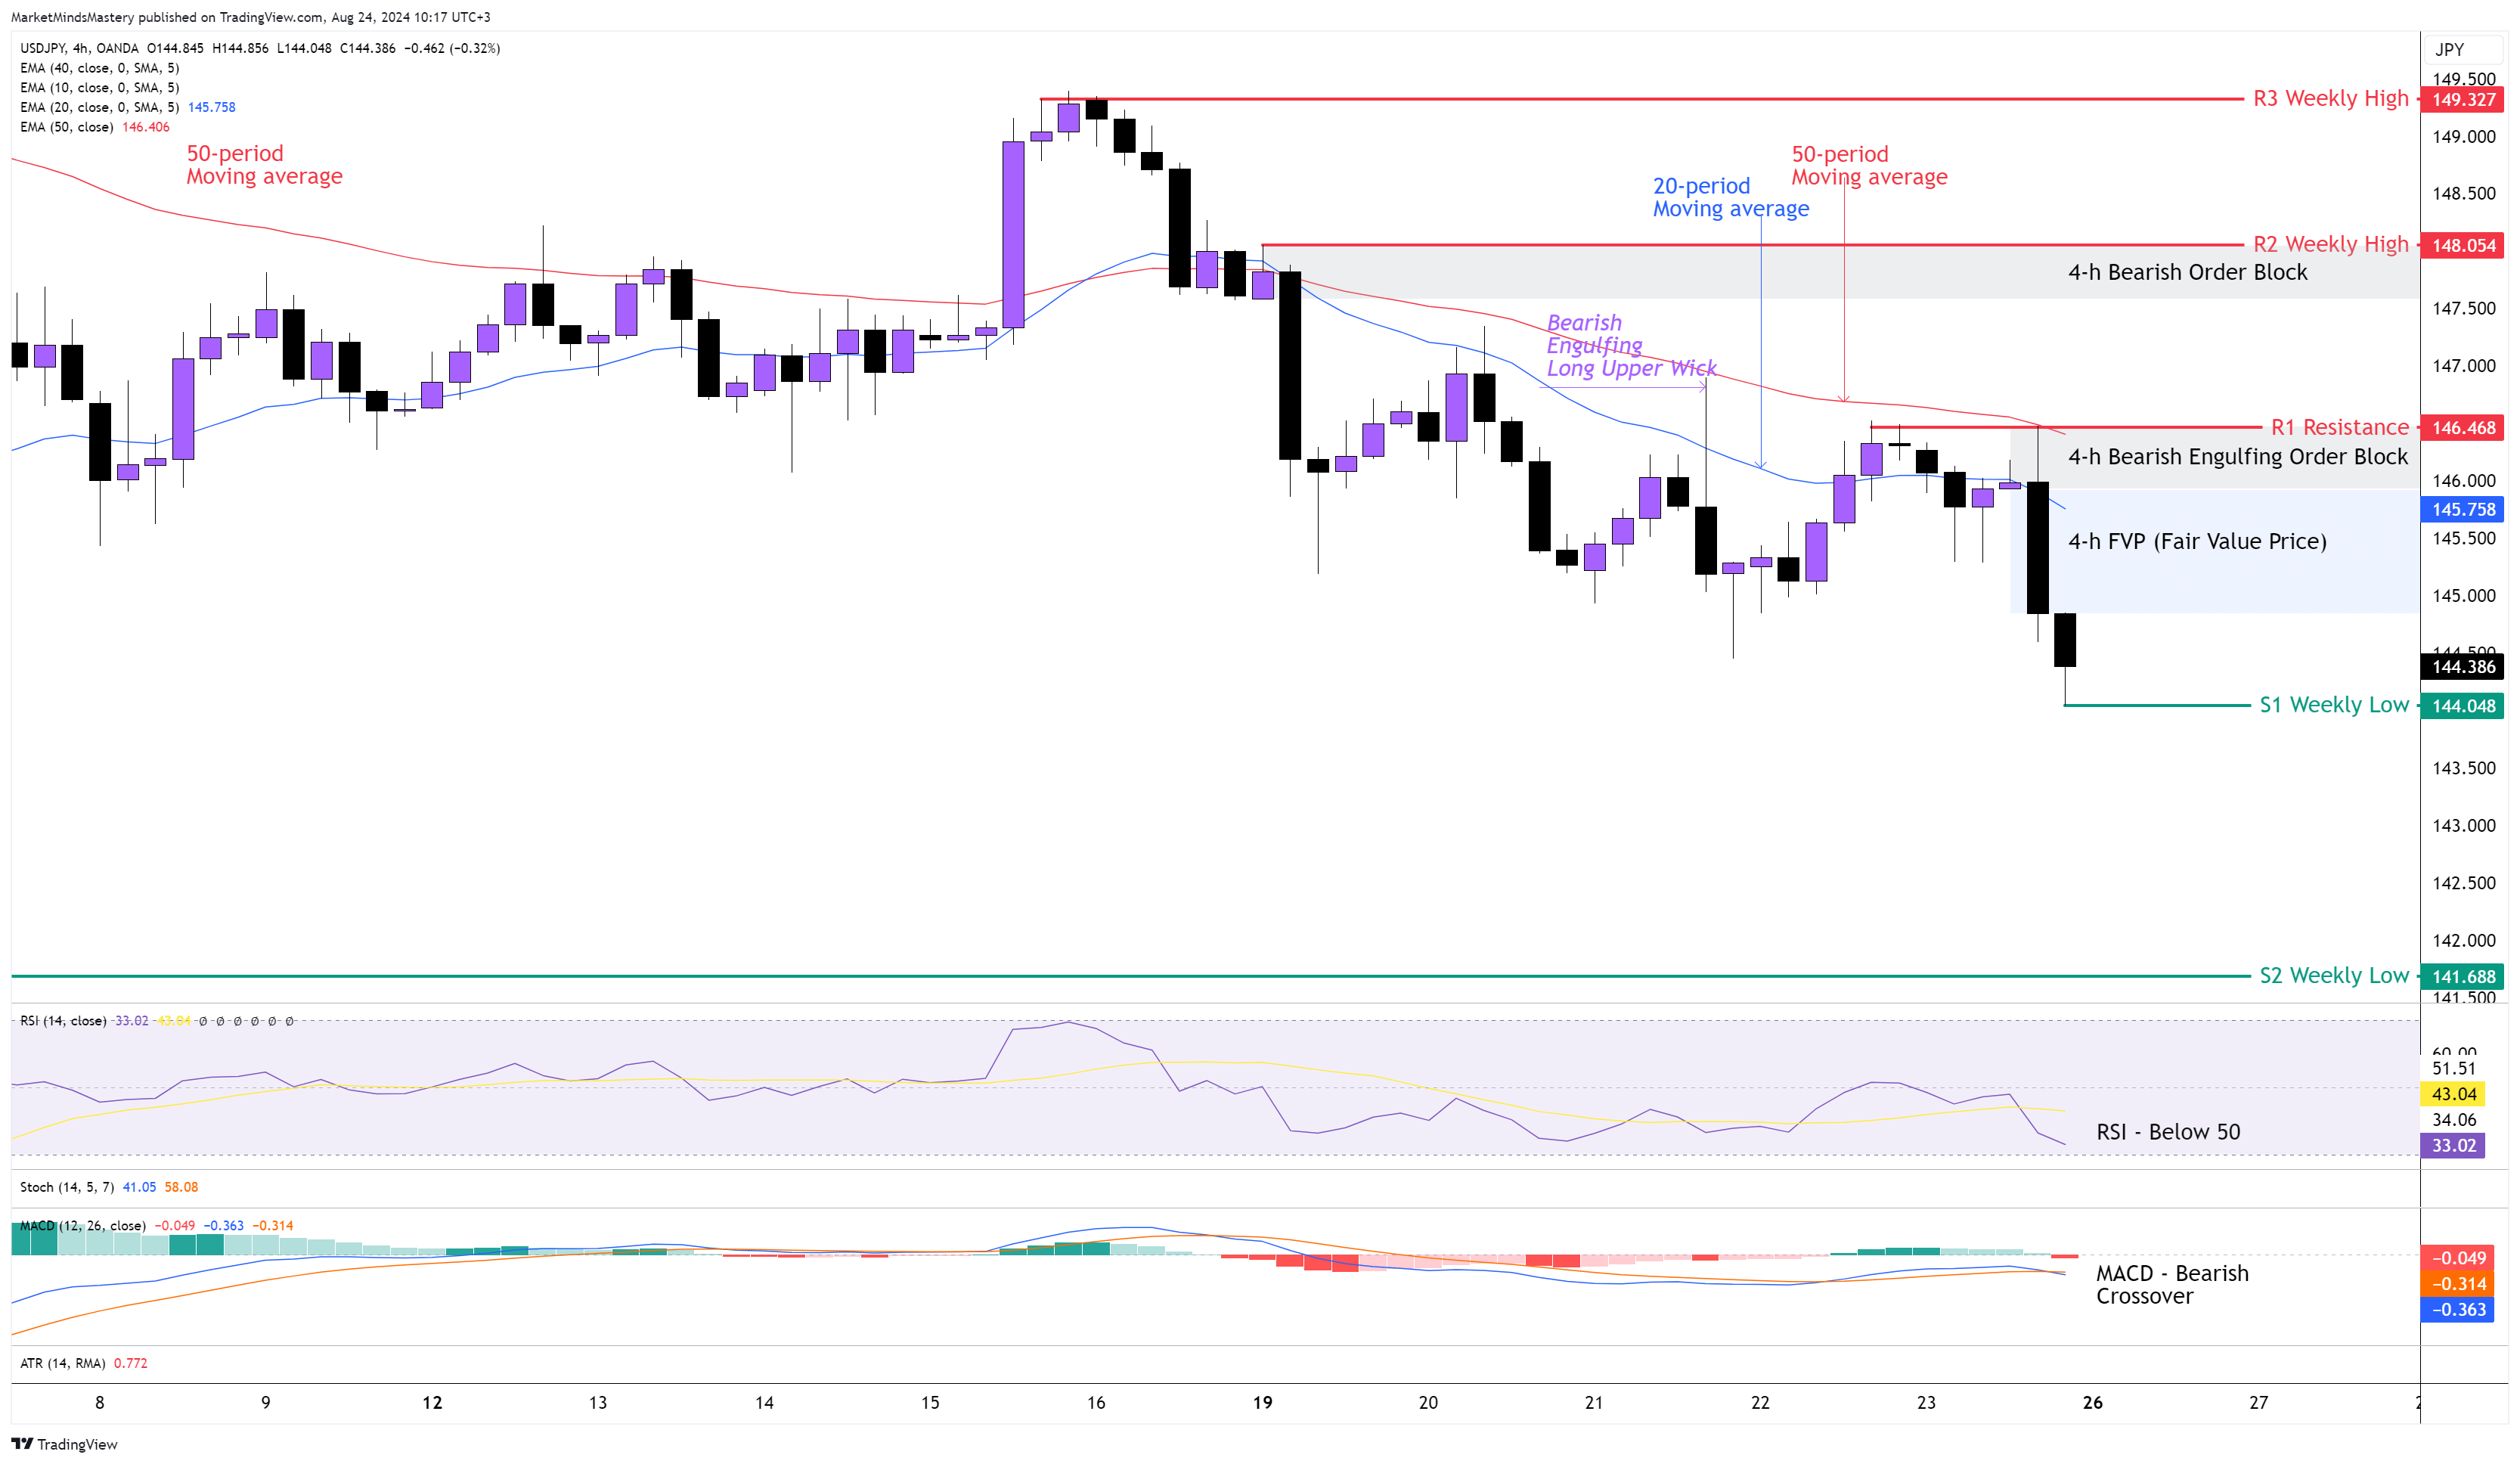
Following the previous week's Market Outlook, the price moved in the direction of the primary trend. (weekly chart). The US Dollar's weakness and the Bullish strength of the Japanese Yen were the factors that led this currency pair to move downwards. The 20-period moving average is below the 50-period, and this is bearish. The RSI Oscillator is below the middle line of 50, and the MACD is below its zero line, which has bearish implications.
As per the Swing Analysis and market structure, the price made a lower low and lower high formation, creating a downtrend in the 4-hour chart. Therefore, if the price continues moving downwards, the first support area, S1, will be approximately 144.048, which was the previous week's low. Weekly lows usually are significant levels of support for day traders. If the price penetrates the S1 and keeps lowering, the next support area, S2, will be around 141.688, which is an older weekly low. Oppositely, if the price bounces off and moves upwards, the first resistance area, R1, will be 146.46. This price level can be significant because it consists of the horizontal resistance level, both the 20-period and the 50-period moving averages, a Bearish Engulfing Order Block and an FVP (Fair Value Price). If the price penetrates the R1 and keeps increasing, it will change the market structure, and the downtrend will end. Hence, the next level of resistance, R2, will be 148.054, which is the previous week's high.
USD CHF 4H
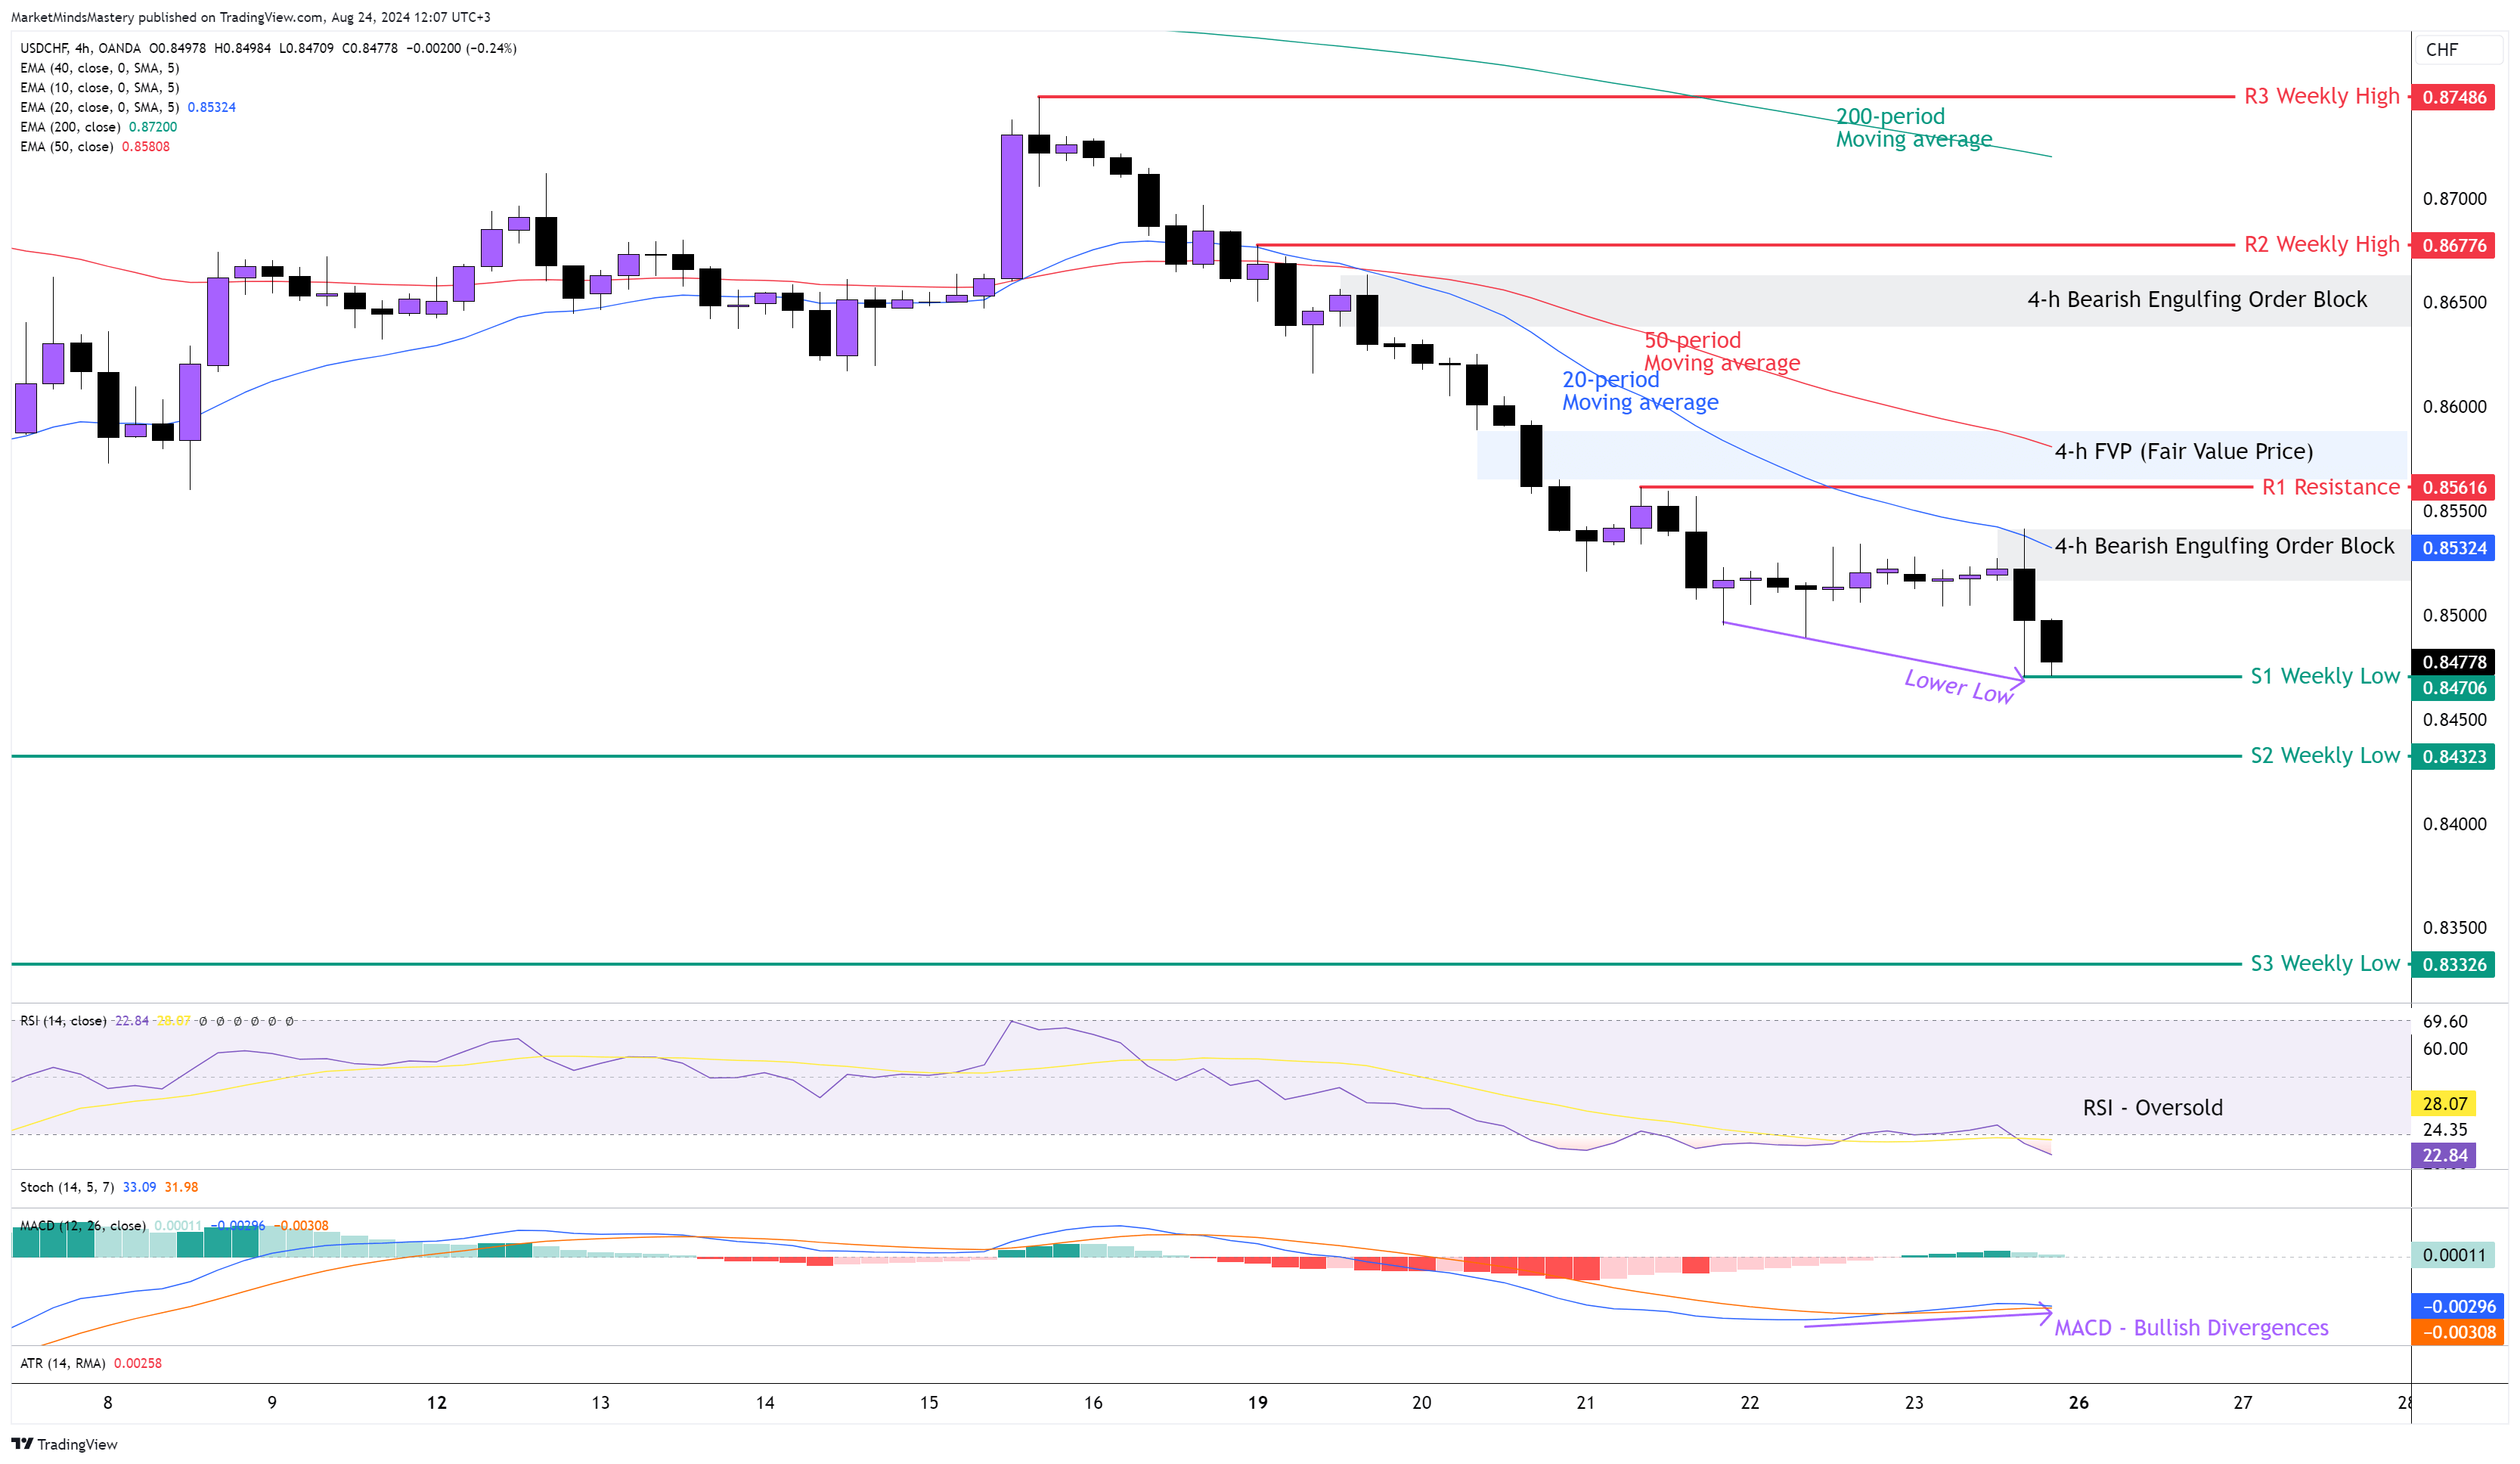
Following the established downtrend of the primary charts, the price of the USDCHF declined last week, creating a Bearish Marubozu candle on the weekly chart. Looking at the 4-hour chart, the price follows the move with a series of lower highs and lower lows. The 20-period is below the 50-period moving average, and this is bearish. The 50-period is below the 200-period moving average. The RSI Oscillator is in an Oversold condition, showing the notable imbalance between buy and sell orders in the market. The MACD is below its zero line. However, last Friday, a Bullish Crossover was created as the MACD Line (Blue) crossed above its Signal Line (Orange). Also, it created a Bullish or Positive Divergence as it was unable to register a new lower low and follow the downward momentum of the price. Hence, starting Monday, if the price keeps moving downwards, the first support area, S1, will be the previous week's low, around 0.84706. If the price penetrates the S1 and keeps lowering, the next support area, S2, will be an older weekly low price close to the 0.84323 level.
On the other hand, if the price enters a retracement phase, which means it will move upwards, the first resistance area, R1, will be approximately 0.85616. A Bearish Engulfing Order Block formed around 0.85400 last Friday, and it can be used as an additional resistance. If the price penetrates the R1 and keeps moving upwards, the next resistance area, R2, will be the previous week's high, approximately 0.86776. On the chart, we also marked the FVP (Fair Value Price) created last Tuesday and left unmitigated.
GBP JPY 4H
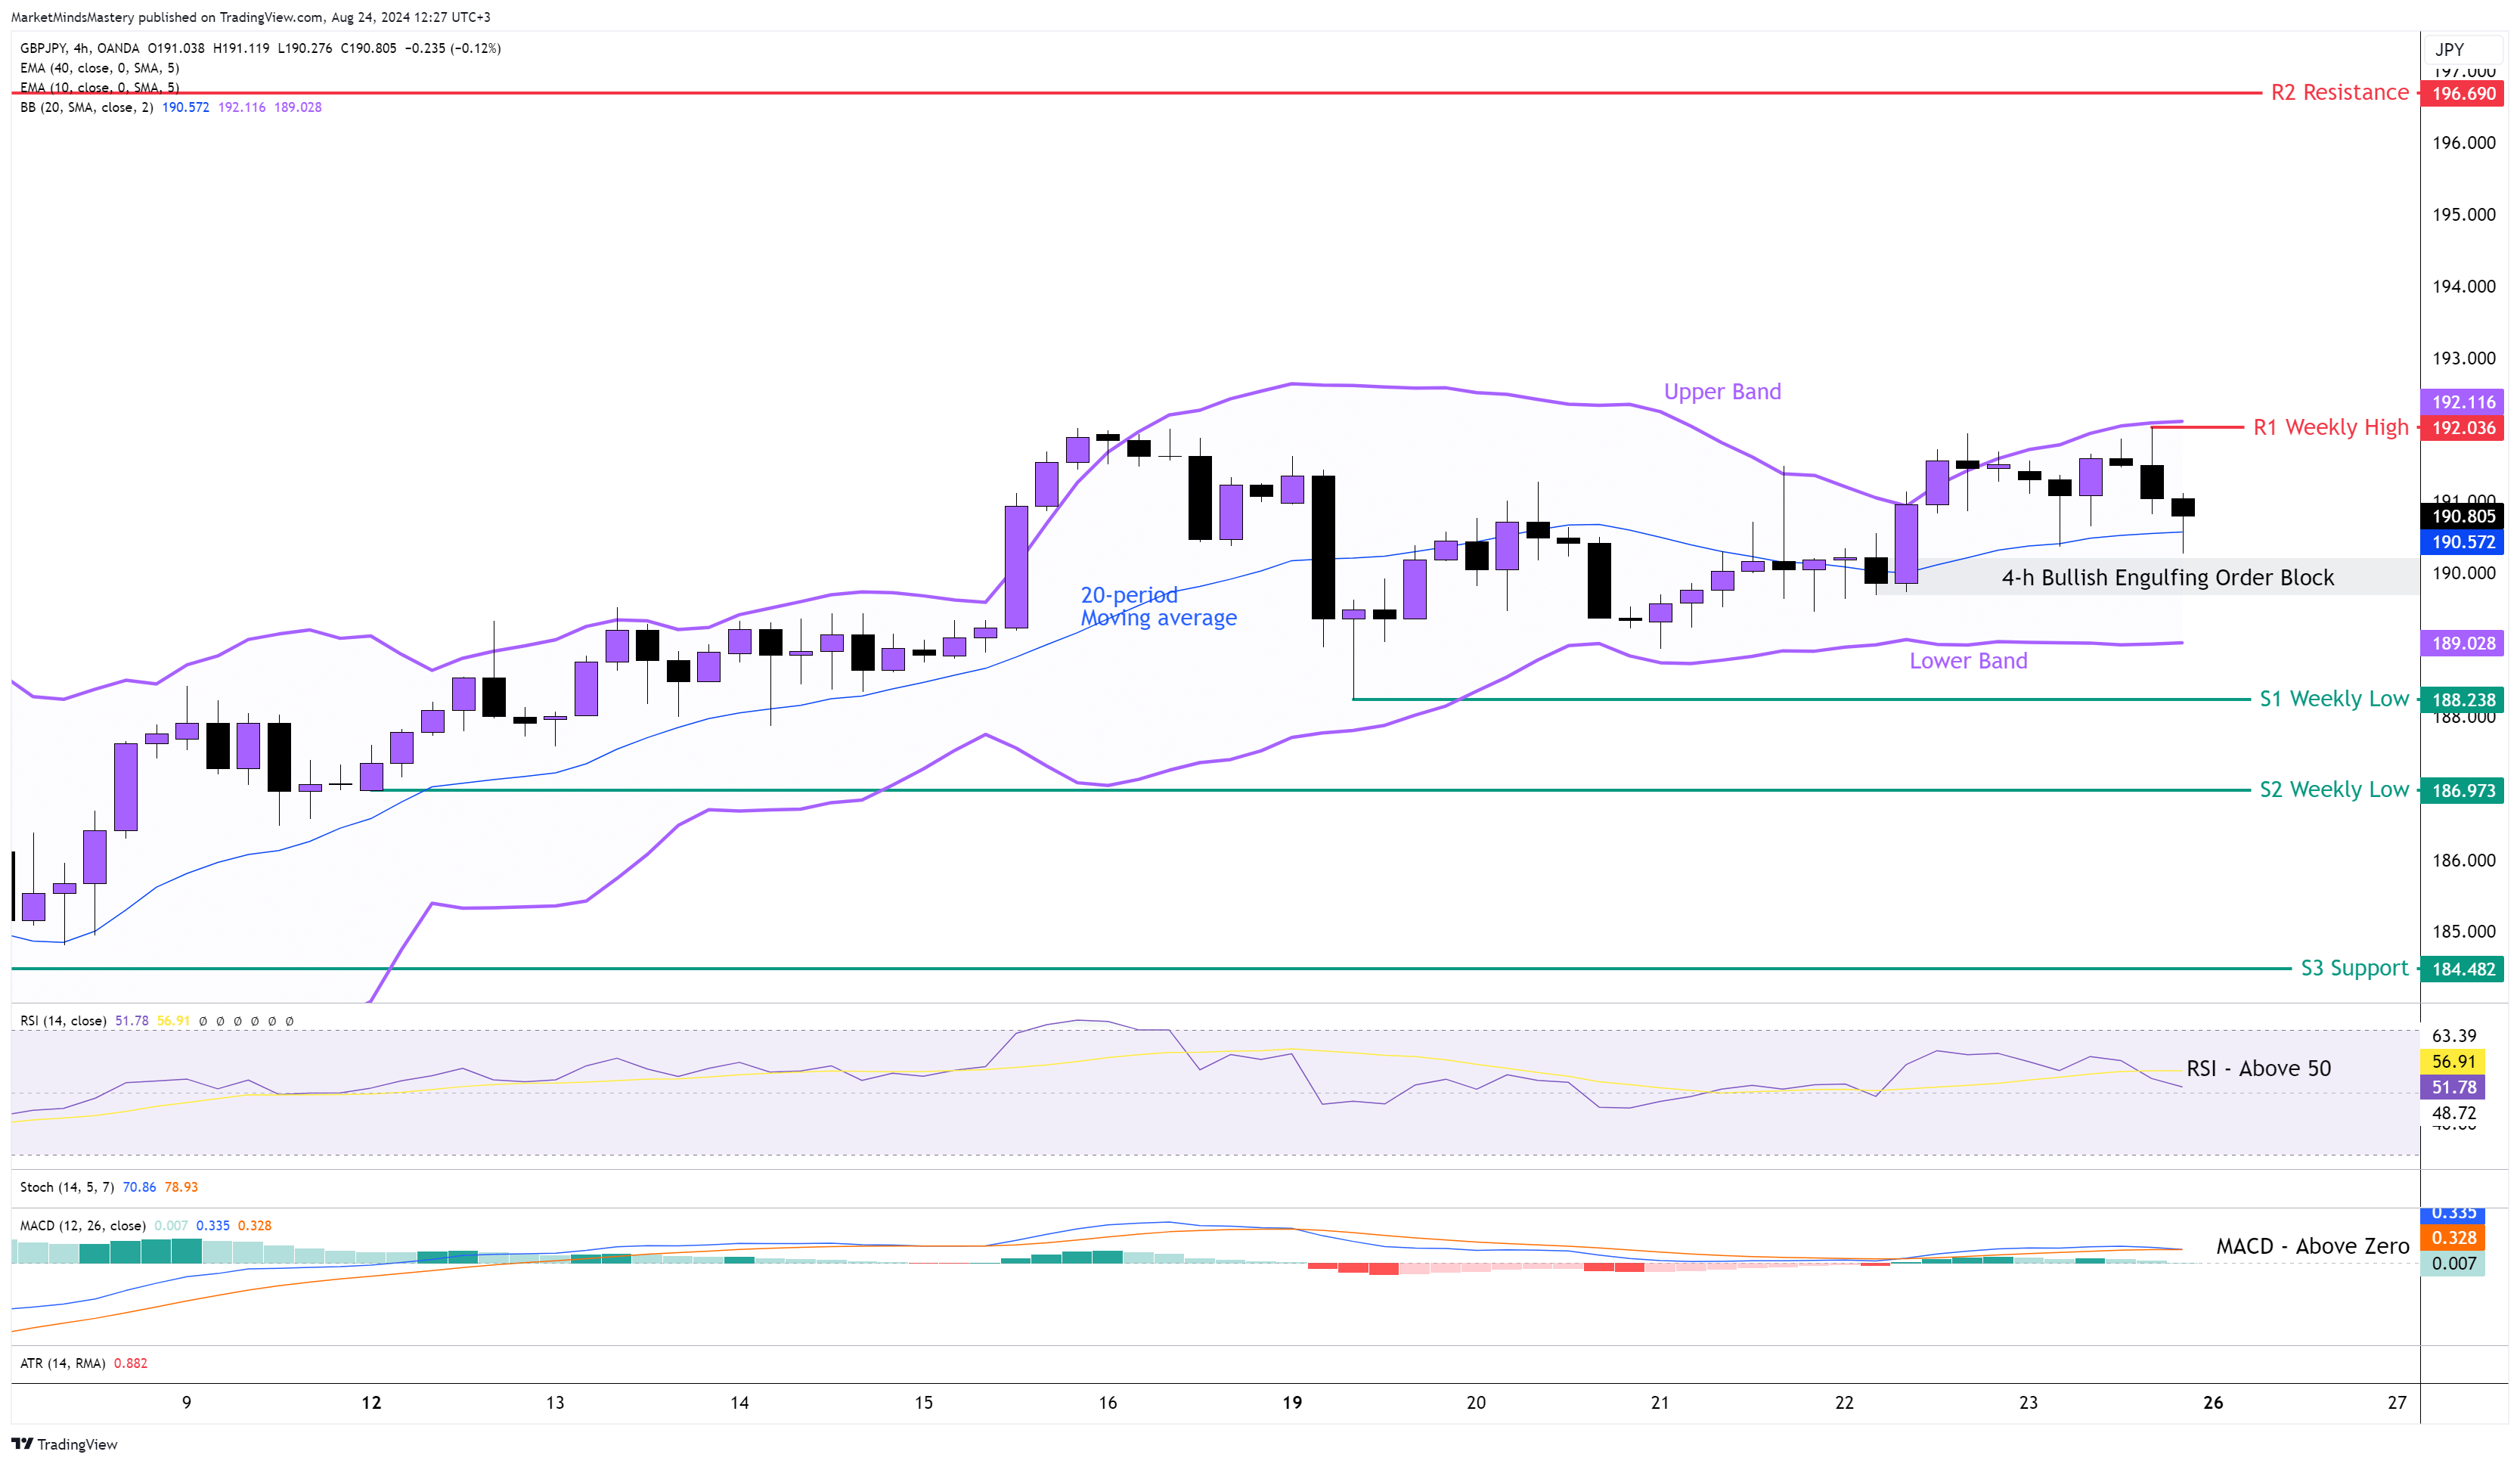
The Sterling was one of the strongest currencies last week, along with the Japanese Yen. Therefore, the price of the GBPJPY didn't move significantly, and the weekly chart ended with the Doji Inside candle, a price action that meant market indecision. Therefore, the 4-hour chart shows the sideways move (because of the doji weekly candle) in more detail. The Upper and Lower Bands of the Bollinger Band indicator are flat and pointing parallel to each other. The market stopped from making higher highs and higher lows. On the chart, we marked the Bullish Engulfing Order Block created on the 4-hour chart last Thursday around the 190 level. The RSI is above the middle line of 50, which is bullish. The MACD is above its zero line, which is also a bullish indication.
Additionally, MACD's Histogram is on the positive side of the chart, and this indicates that the price is rising. Currently, the price is above the 20-period moving average, which is the middle line of the Bollinger Band indicator. Therefore, starting Monday, if the price moves upwards, the first resistance area, R1, will be 192.036, which is the previous week's high. In case the price penetrates the R1 and keeps moving upwards, the next resistance area, R2, will be around 196.690. On the other hand, if the price is rejected and moves downward, the first support area, S1, will be around 188.238, which is the previous week's low. A further move to the downside will find the next support area, S2, being an older weekly low price of around 186.97.
GOLD 4H
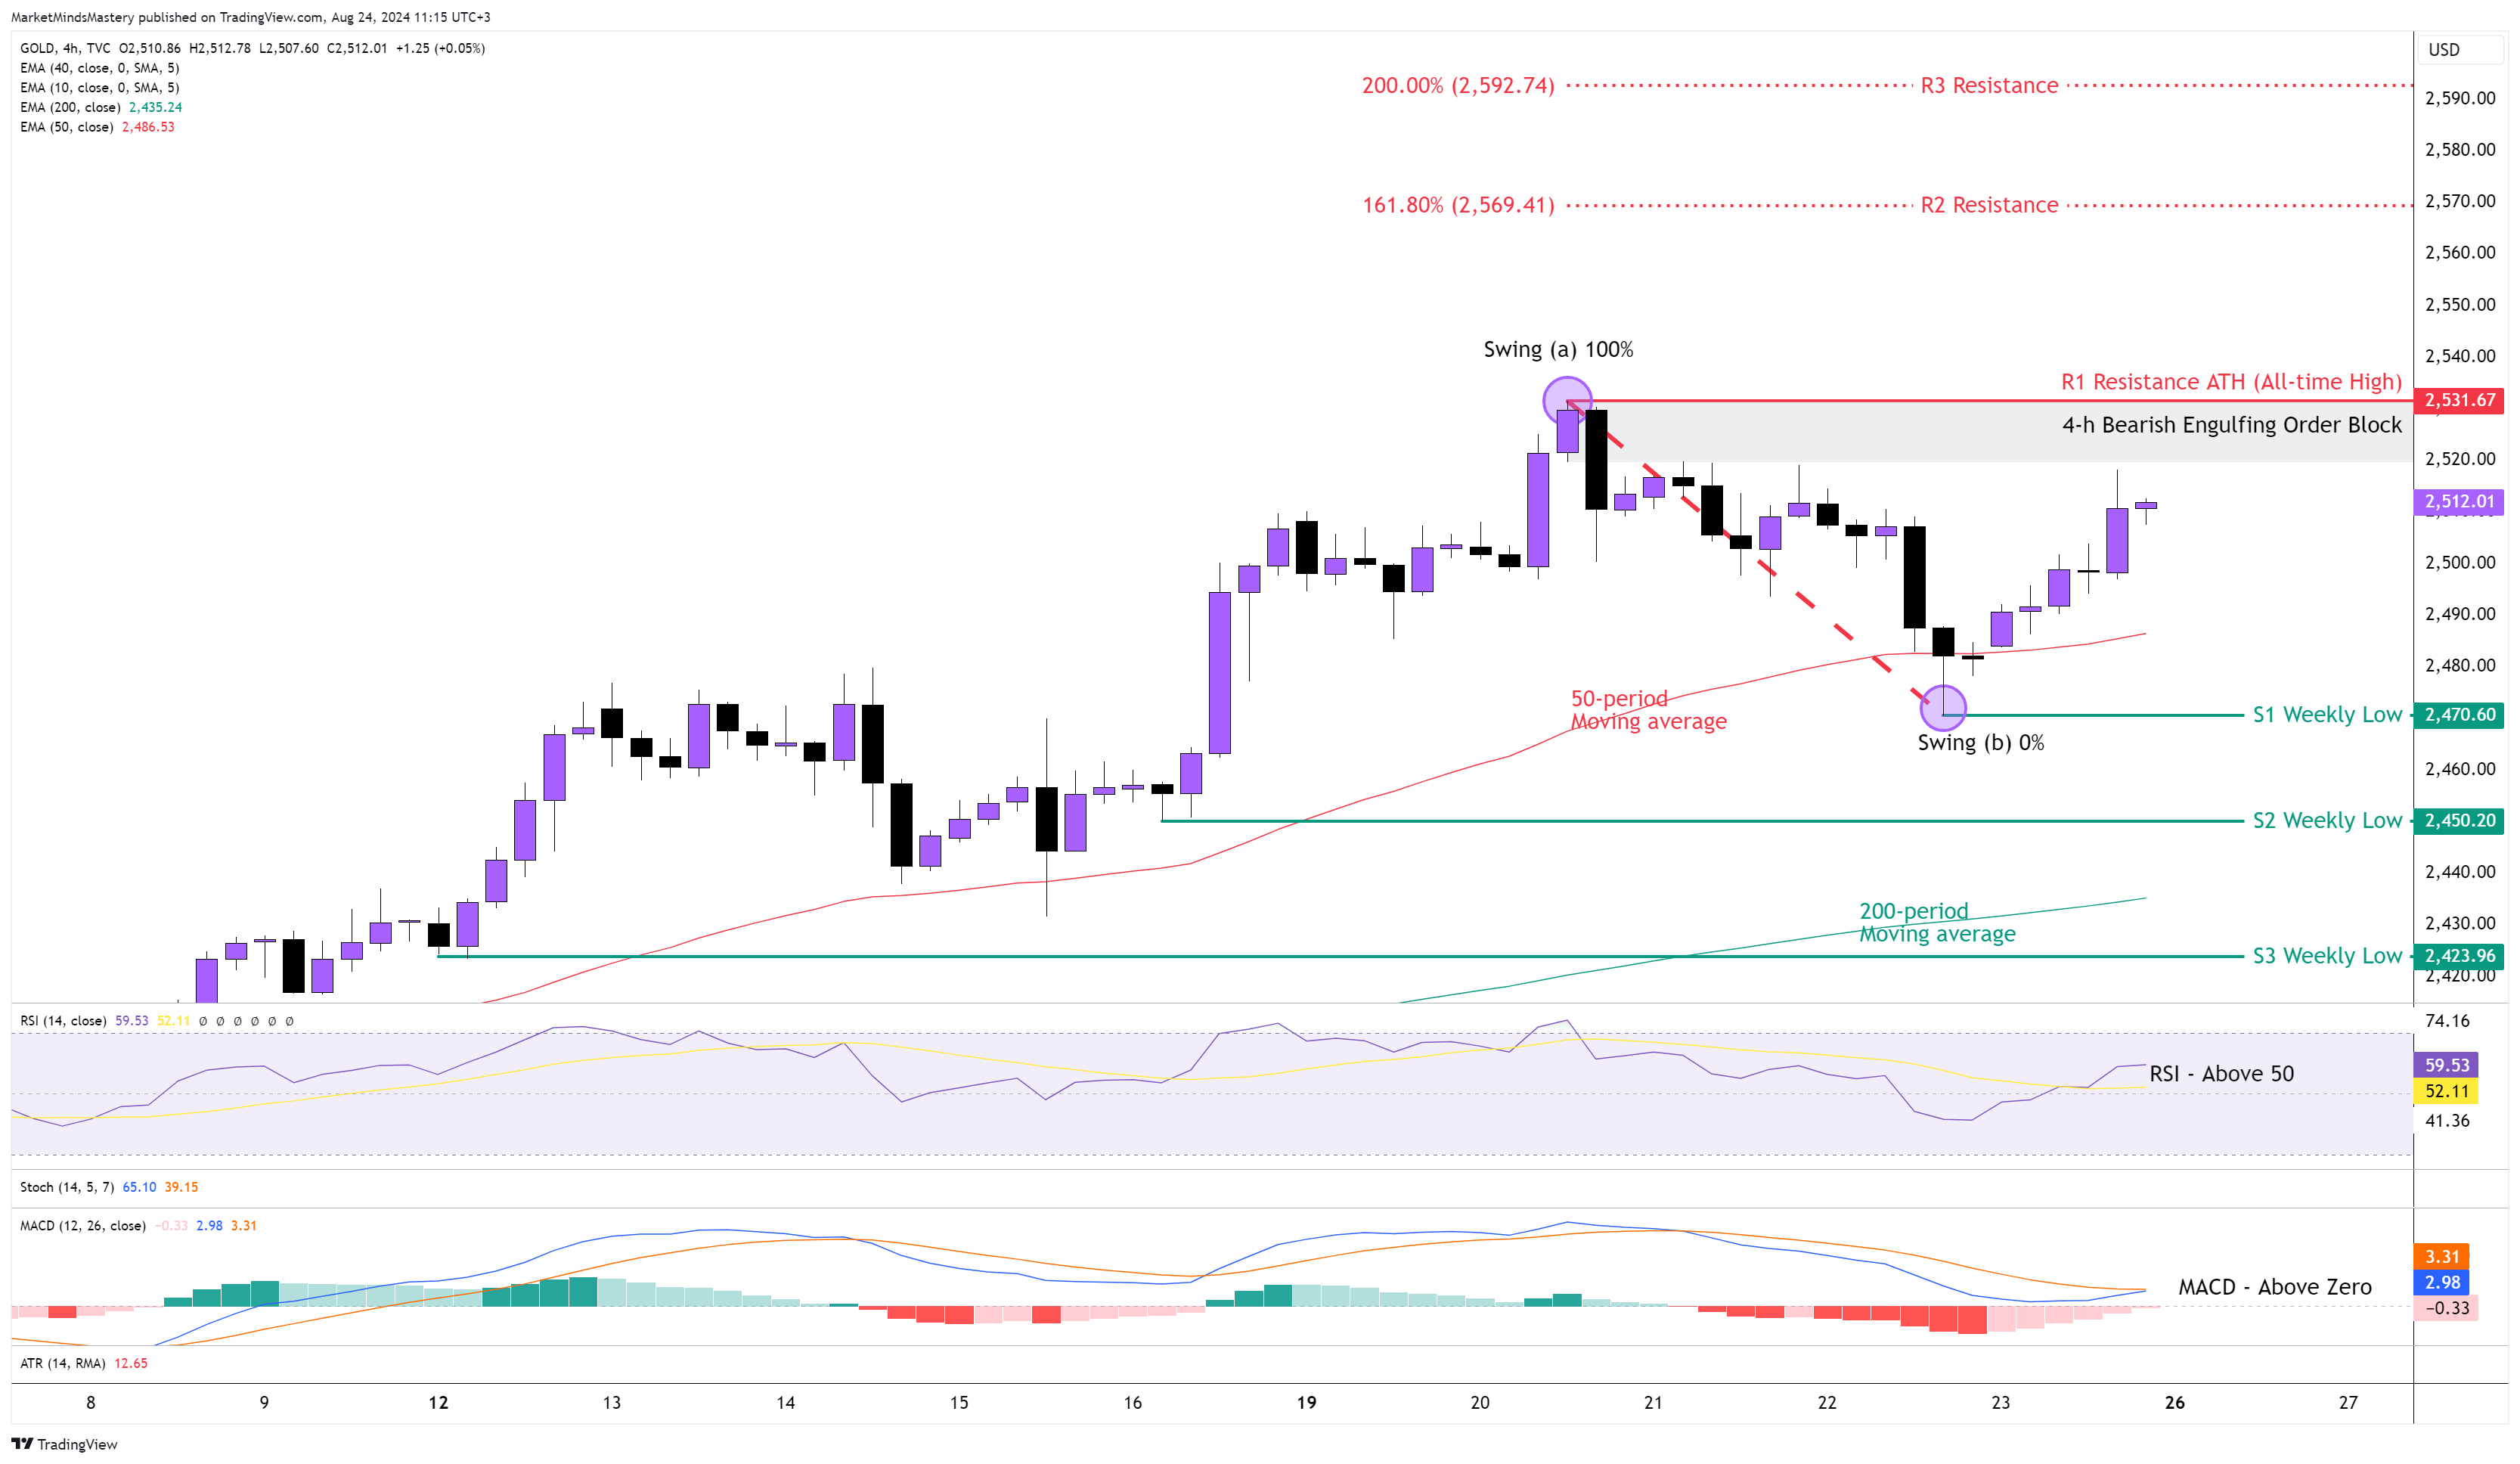
The price moves on the Gold market occurred almost accurately, as we pointed out in the previous week's market analysis. The 200% Fibonacci Extention was the highest price level the price reached, creating a new All-time High around $2530. Afterwards, the price declined and moved downwards until the Inside support and the FVP (Fair Value Price) we marked on the previous week's chart, then bounced off and set the price where it is currently. The 50-period is above the 200-period moving average. The price is above the 50-period, and it is bullish. The RSI is above its middle line of 50, and this is also bullish. The MACD is above its zero line. The MACD's Histogram approaches the zero line. As the price created an ATH and the weekly price action is a Long-legged Doji candle, if the price, starting Monday, continues moving upwards, the first resistance area will be the ATH around $2530. At the same level, last week, the price created a Bearish Engulfing Order Block, and this can add significantly to the resistance level. In case the price penetrates R1 and keeps increasing, the following resistance areas, R2 and R3, will be projected using the Fibonacci Extension tool, which will be around $2569 and $2592, respectively.
On the contrary, if the long-legged doji candle forces the price to decline, the first support area, S1, will be the previous week's low, around $2470. This price level is also the recent swing low (turning point) in the market, and if the price penetrates it, it will change the current market structure of the Gold market. In that case, the next support level, S2, will be the $2450, which is an old weekly low.
USOIL 4H
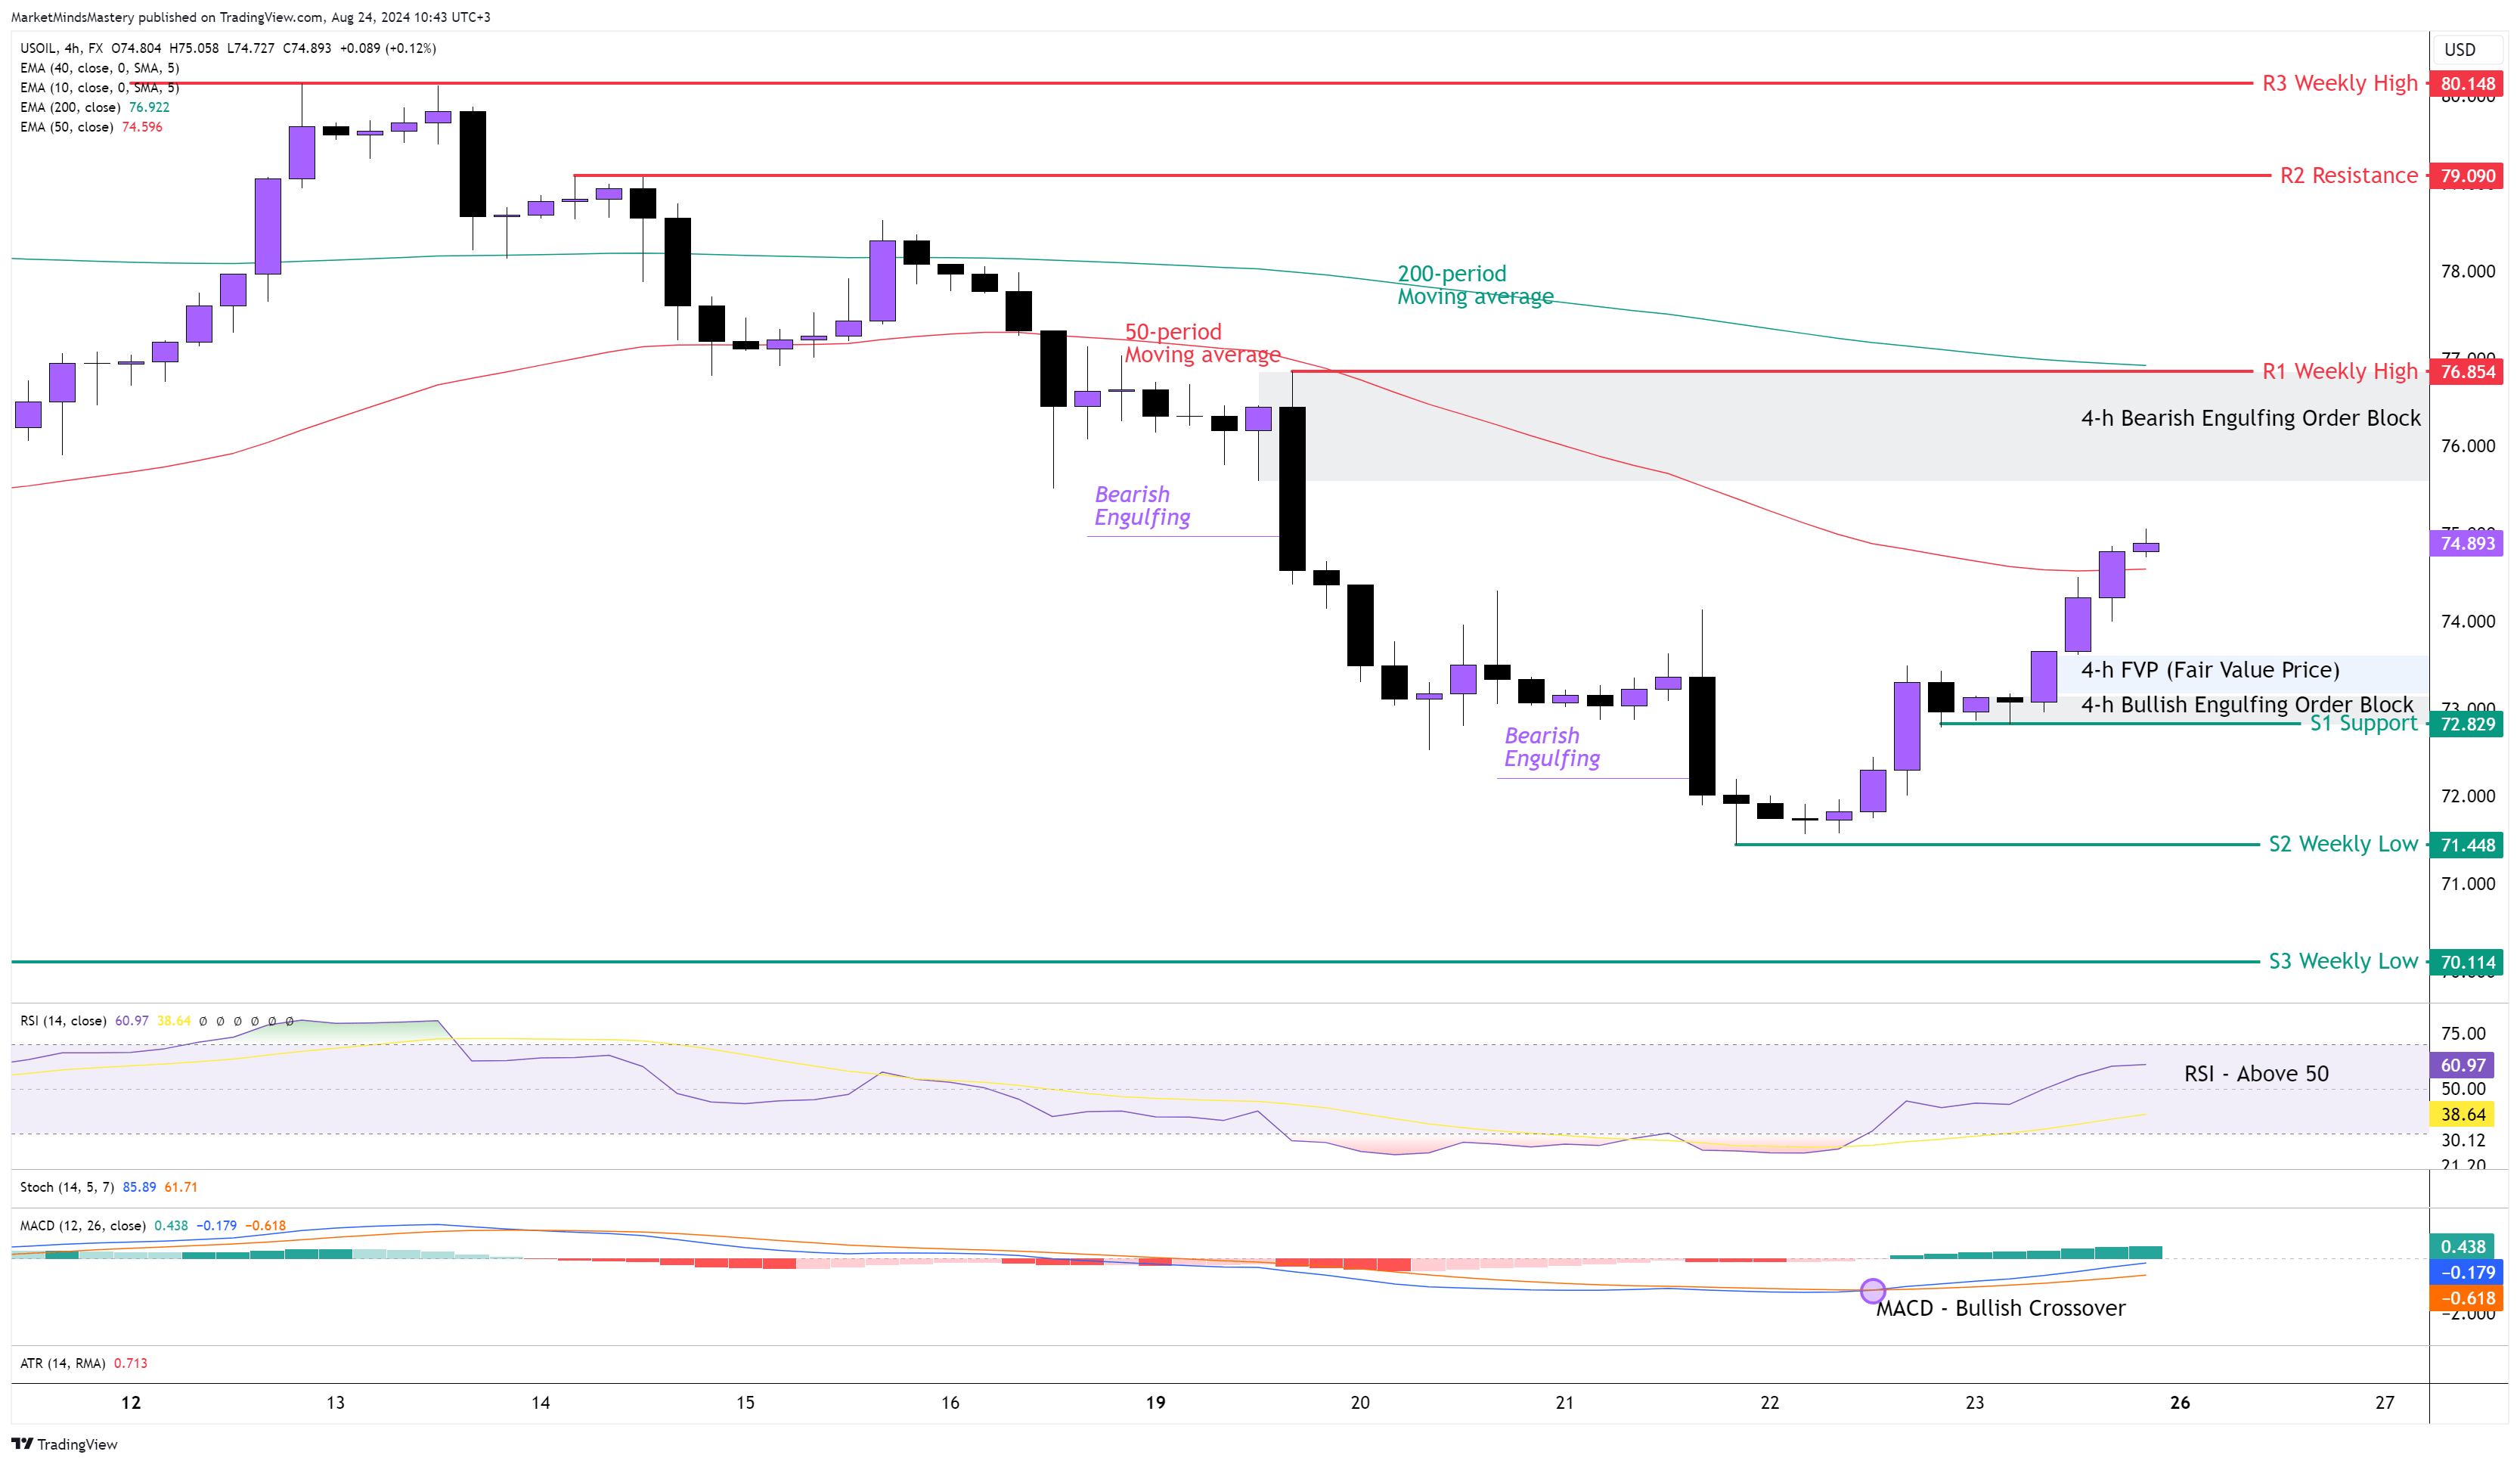
Following the previous week's market analysis, the price moved as expected until the $71.65 level, where it created a False Break Out (that was more obvious on the small time frames), where it bounced off last Thursday, and the last two trading days were moving upwards. The weekly chart (primary trend) is not well defined as the price action moves within a small trading range. On the 4-hour chart, the 50-period moving average is below the 200-period, and this is bearish. The MACD is below its zero line, and the MACD Line (Blue) crosses above the Signal Line (Orange), which is known as a Bullish Crossover. The RSI is above its middle line of 50, and it has bullish implications. Around the $76 price level, a Bearish Engulfing Order Block and around the $73 Bullish Engulfing Order Block formed last week. They usually make the price level significant when they coexist with horizontal levels of support or resistance.
Starting Monday, if the price keeps increasing, the first level of resistance will be the previous week's high, around $76.85. If the price penetrates the R1 and keeps moving upwards, the next resistance area, R2, will be $79. If the price increases further, the next resistance level, R3, will be around $80.14, which is an old weekly high.
On the other hand, if the price declines and moves downwards, the first support area, S1, will be around $72.82. As shown in the chart above, the 4-h Bullish Engulfing Order Block and the FVP (Fair Value Price) can add more significance to this support level. If the price penetrates the S1 and keeps lowering, the next support area, S2, will be the previous week's low, around $71.44. A further move to the downside finds the S3 support level being around $70.11.
BTC USD 4H
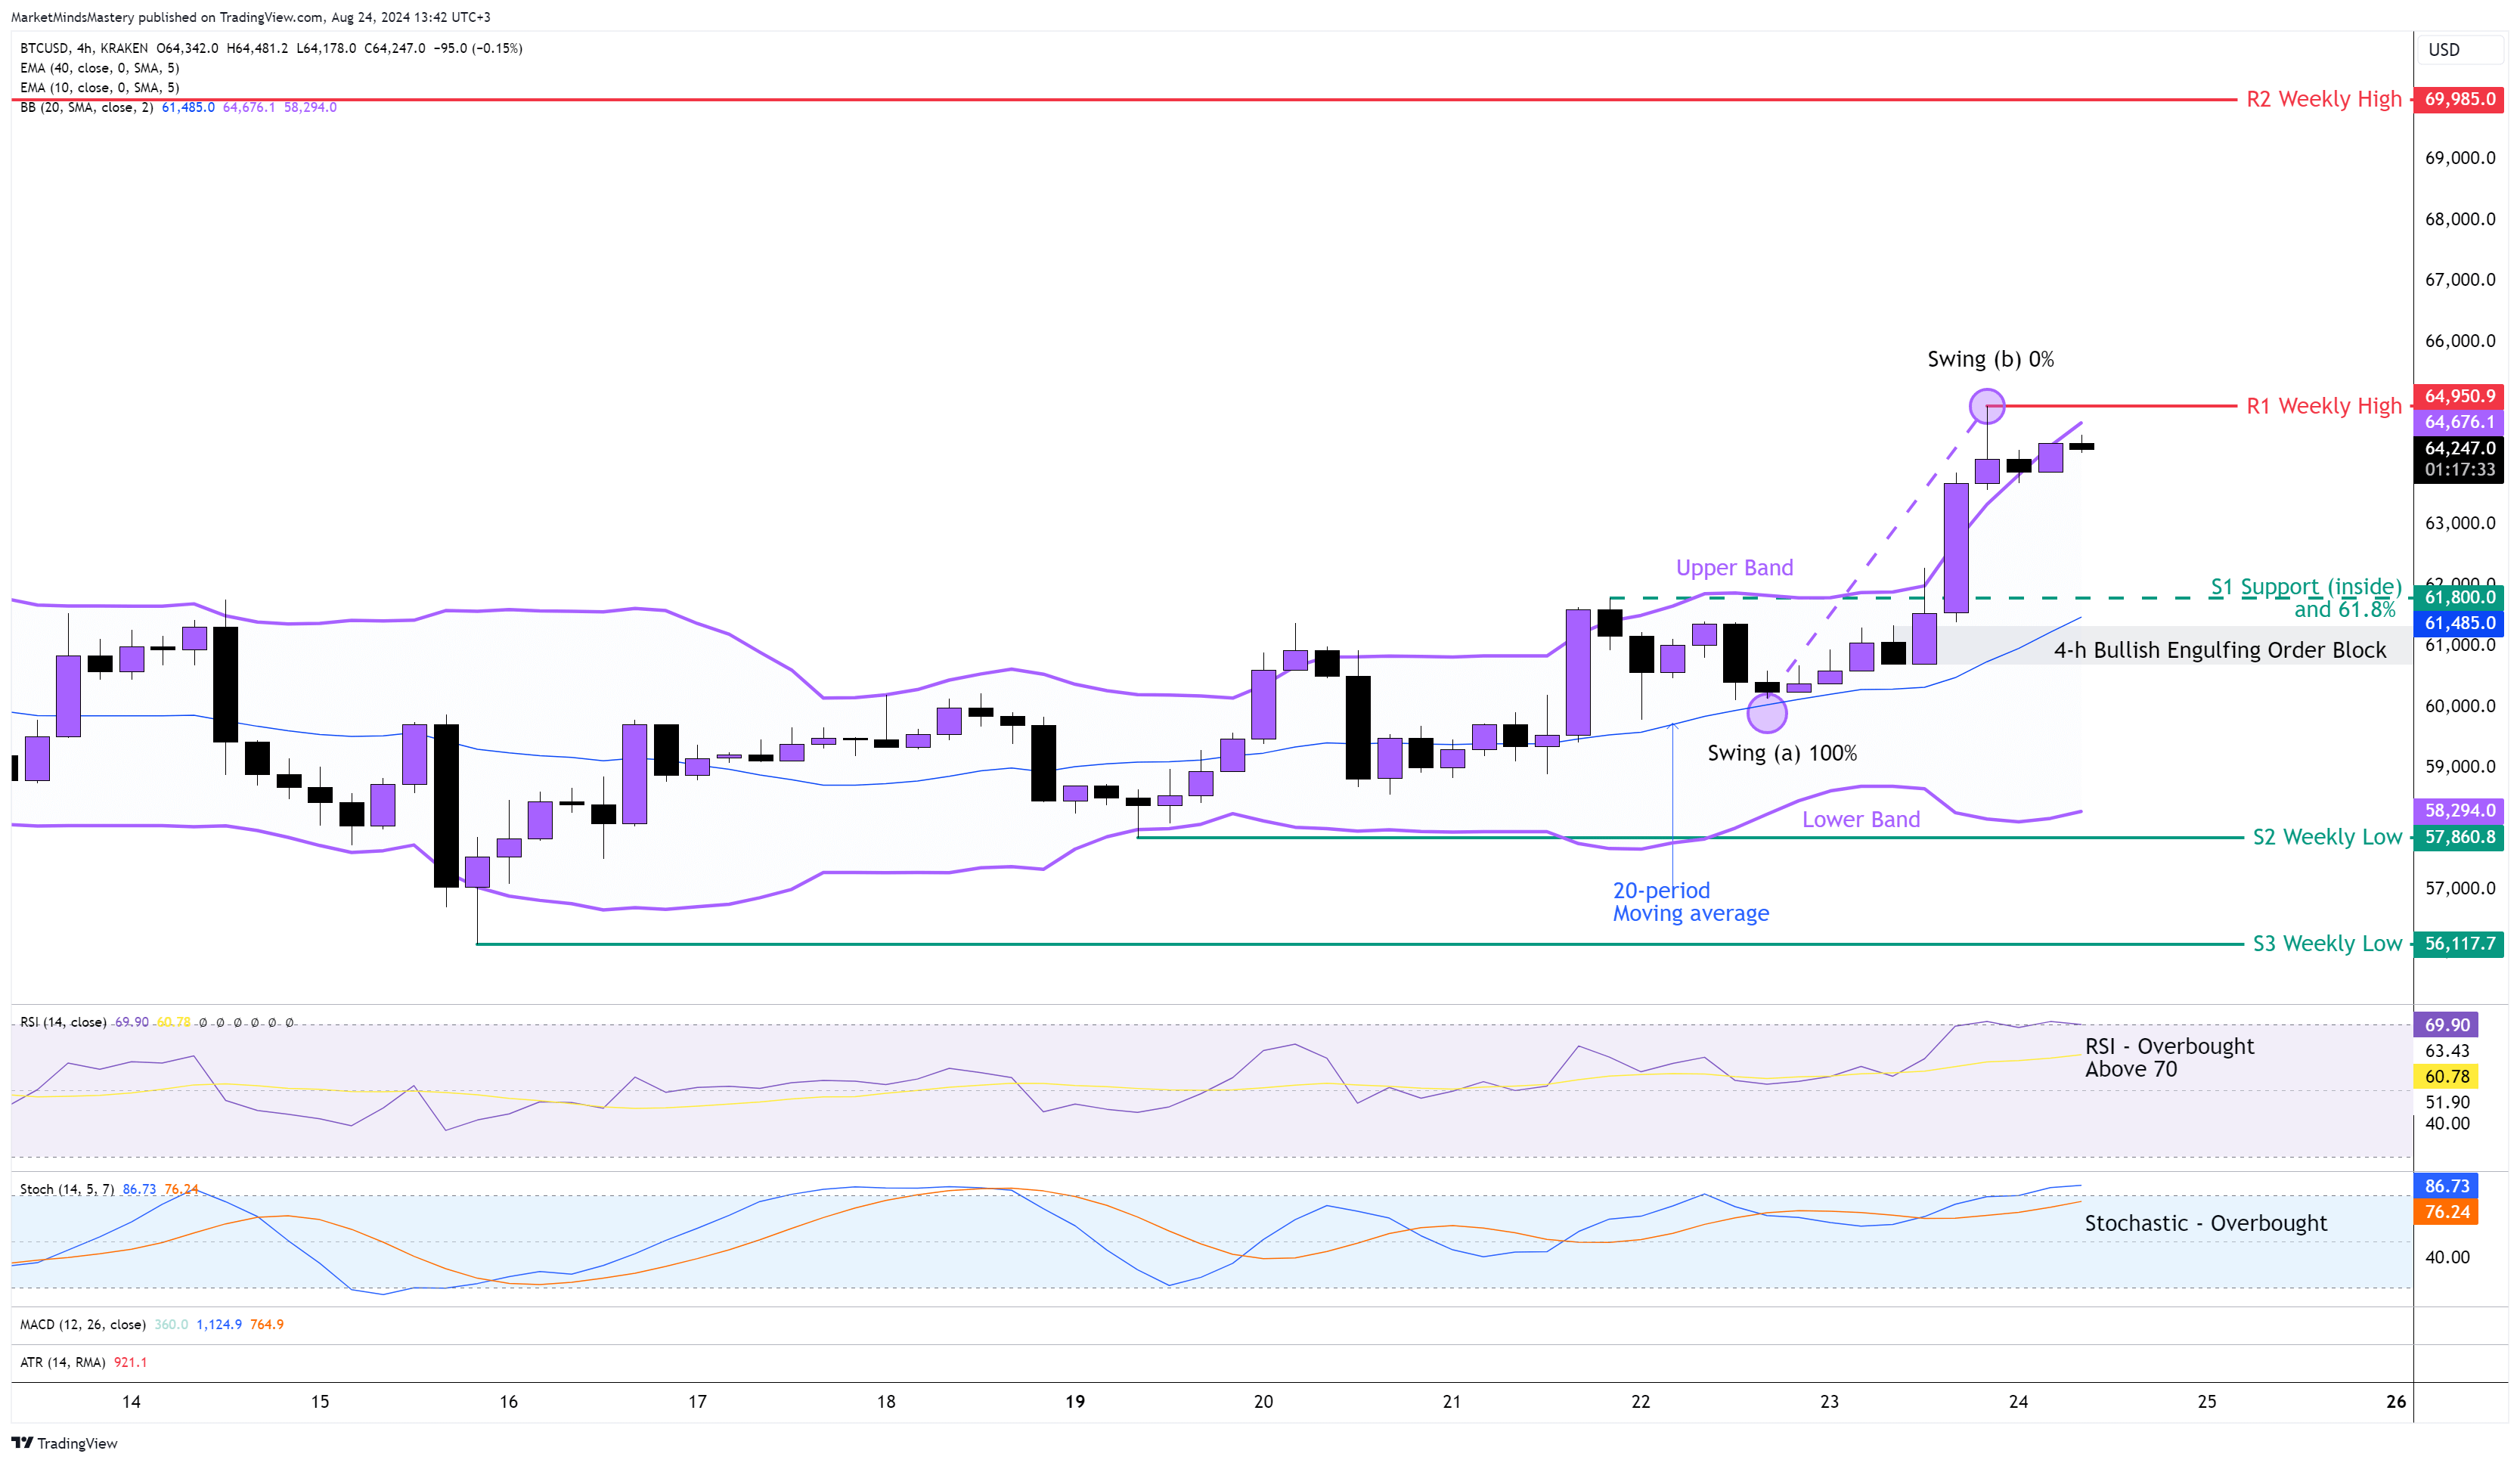
Following the US dollar's weakness, Bitcoin was among the attractive assets that investors and traders were willing to buy, lifting the price of the BTCUSD above $61000. The price on the 4-hour chart created a series of higher highs and higher lows. Only last Friday, the price penetrated the Upper Band of the Bollinger Band indicator, showing the expansion of the market's volatility during the New York trading session. The price has since created what we call "Walking the Bands", as it is interacting with the Upper Band. When the breakout occurred above $61000, the price created a Bullish Engulfing Order Block. The RSI is above the 70 area and puts the Oscillator in an Overbought condition, pointing to the bullish strength in this market. Also, the Stochastic Oscillator is in an Overbought condition as it crosses above its upper boundary, which is 80. As for the Lower Band of the Bollinger Band indicator, it is pointing upwards, which is a sign of luck of market bullish momentum. Hence, if the price is rejected and moves downwards, the first support area, S1, will be an Inside support around $61800. The same price level coexists with the Golden Ratio of the Fibonacci numbers, which is the 61.8% retracement, measuring from the swing low at point (a) until the swing high at point (b). In case the price declines and moves further downwards, the next support area, S2, will be the previous week's low, around $57860. If the price at some point bounces from a level of support and moves upwards, the first resistance area, R1, will be around $64950. If the price goes through R1 and keeps moving upwards, the next resistance, R2, will be the area around $69985, which is an old weekly high level.
SP 500 4H
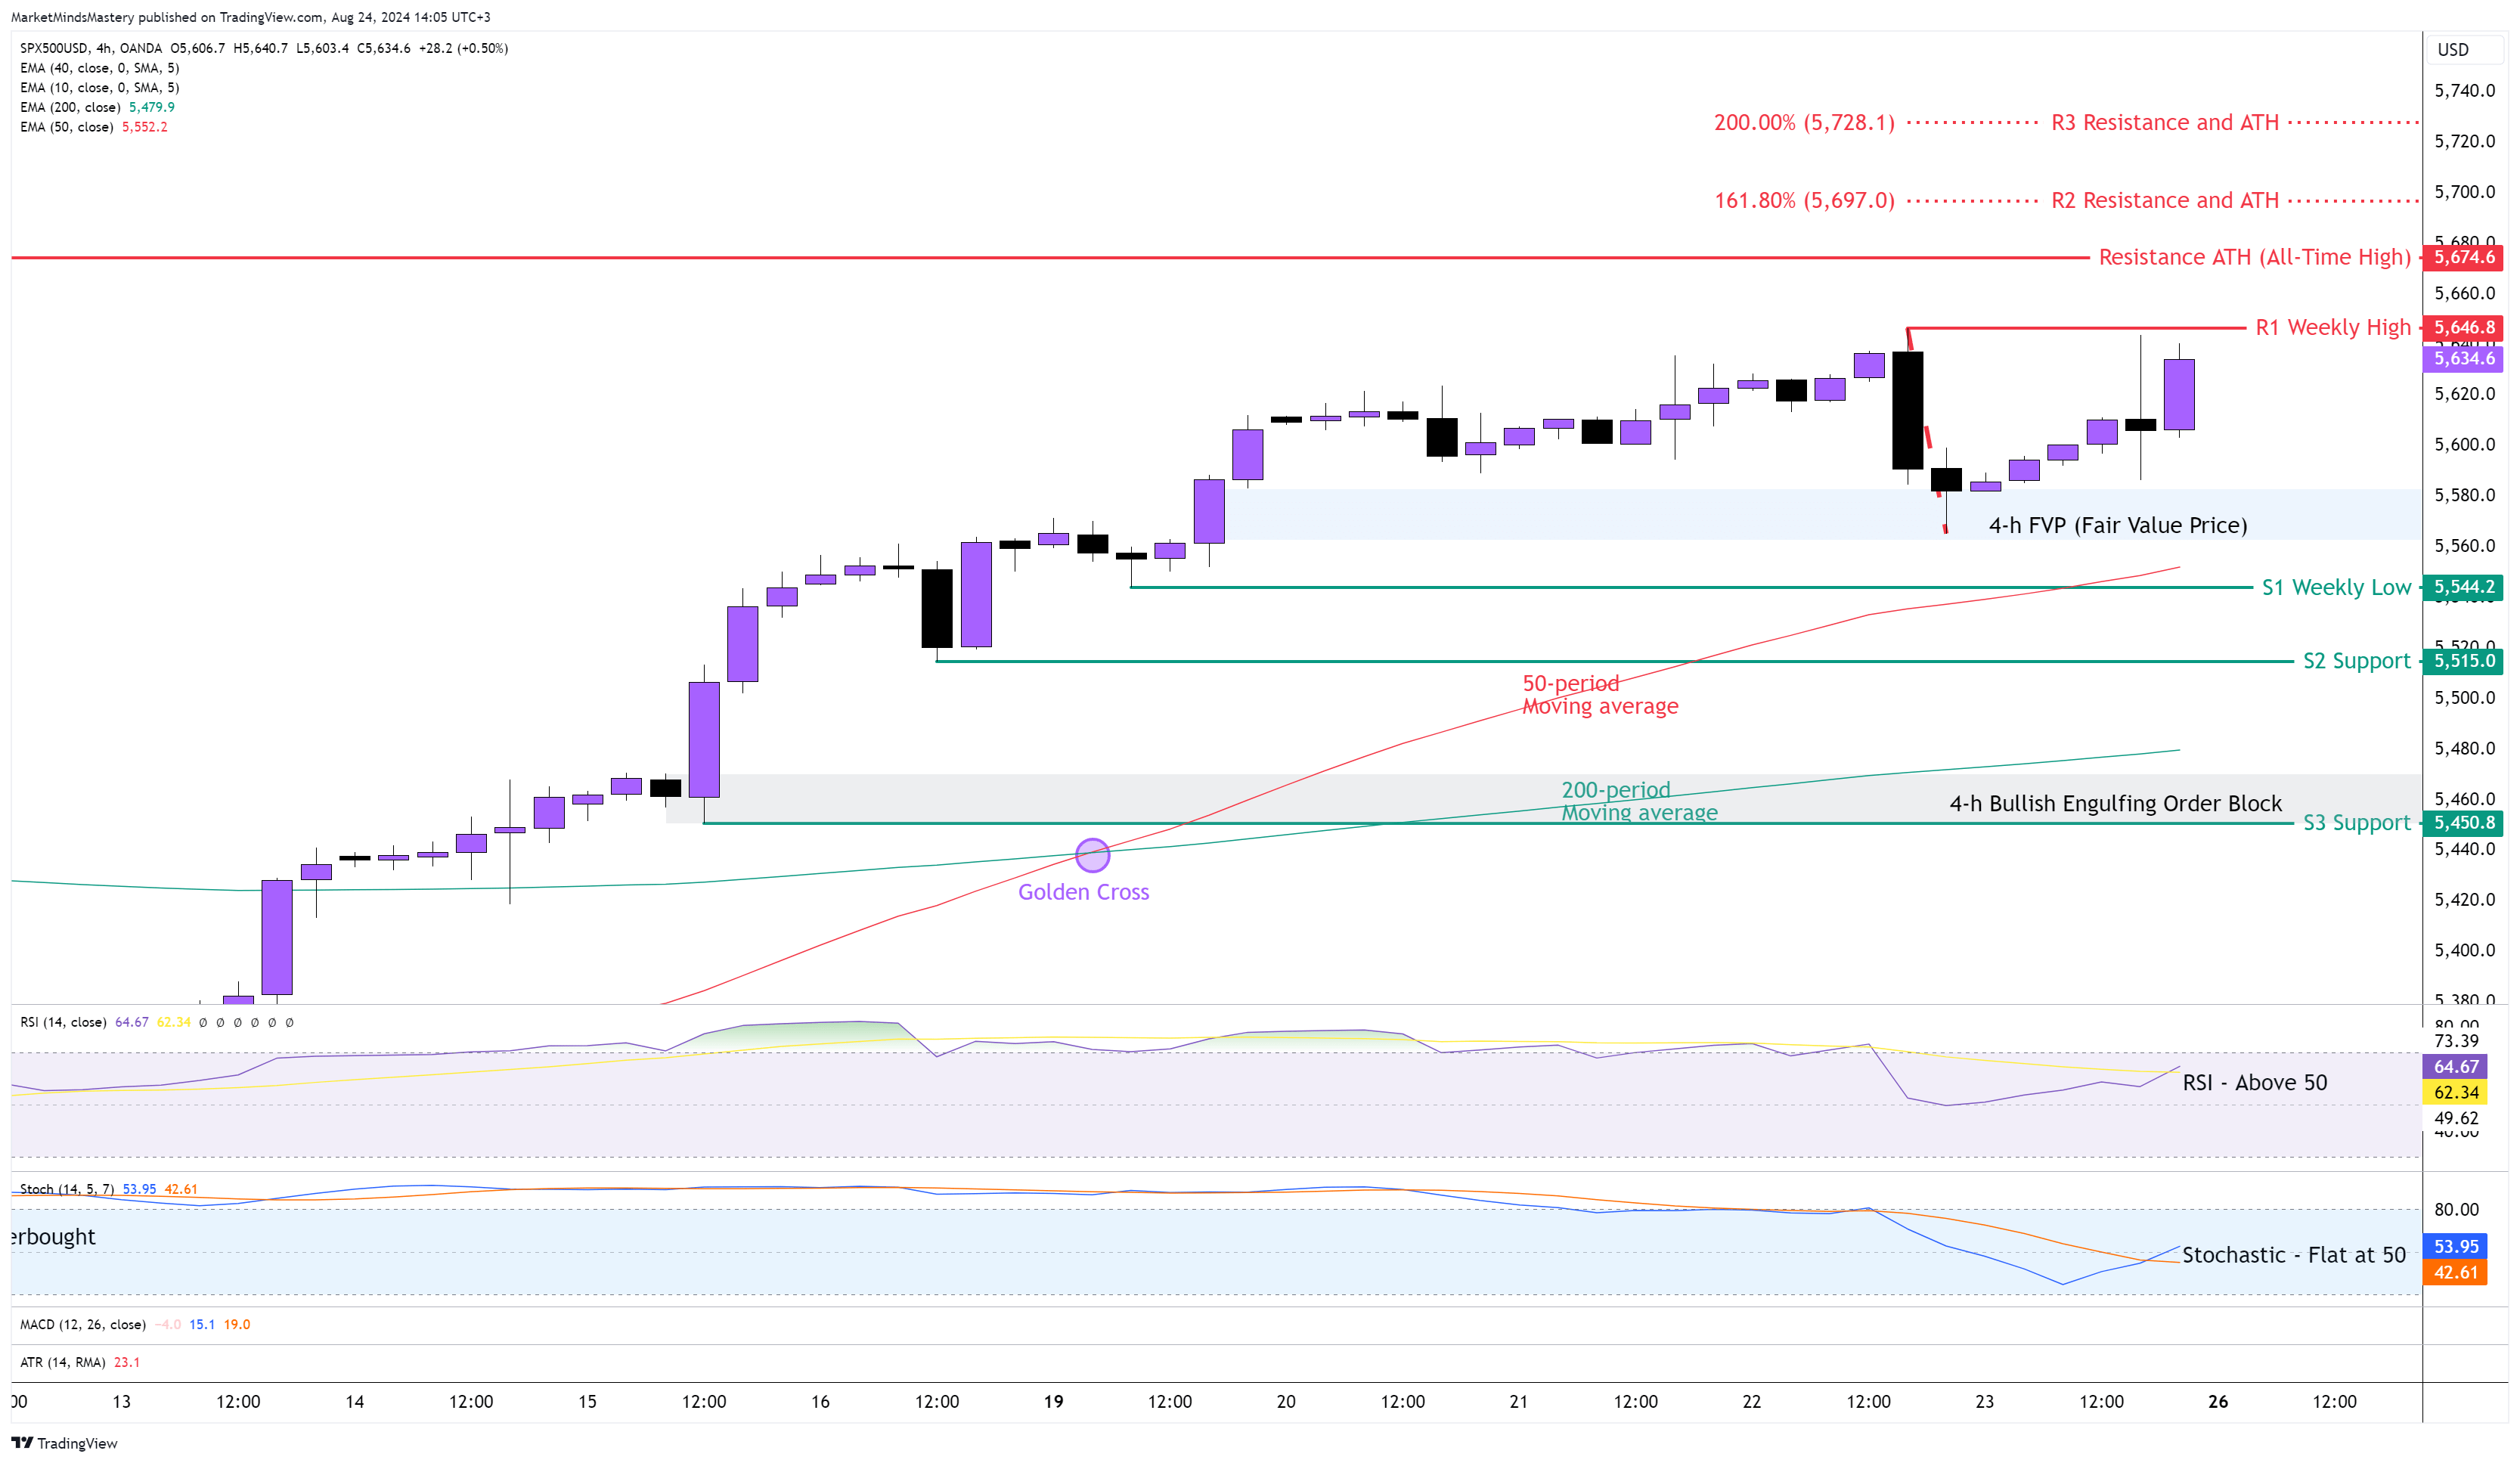
Last week, the price of the SP500 kept moving upward as expected because the primary trend was up, and the leading weekly candle was a Bullish Marubozu, as we mentioned in the previous week's market outlook. As the bullish upward move continued, the price on the 4-hour chart created a series of higher highs and higher lows.
Last Monday, the 50-period crossed above the 200-period moving average, known as the Golden Cross. The RSI Oscillator is above 50, indicating bullishness. The Stochastic is at its midlevel of 50. Last Monday, an FVP (Fair Value Price) was created, and on Tuesday, the price successfully bounced off from it and moved upwards around the $5570 price level. Starting Monday, if the price continues moving upward, the first resistance area, R1, will be the previous week's high, around $56546. If the price goes through it and keeps increasing, the next resistance level will be the ATH (All-Time High) at $5674.
In case the price keeps increasing the next ATH will be predicted by using the Fibonacci Extension tool of 161.8%, around $5700, and the 200%, around $5728. Oppositely, if the price is rejected and moves downwards, the first support area, S1, will be the previous week's low, around $5544. A further downward move will find the next support area, S2, around $5515 and the following support level, S3, at approximately $5450.
US 30, 4H
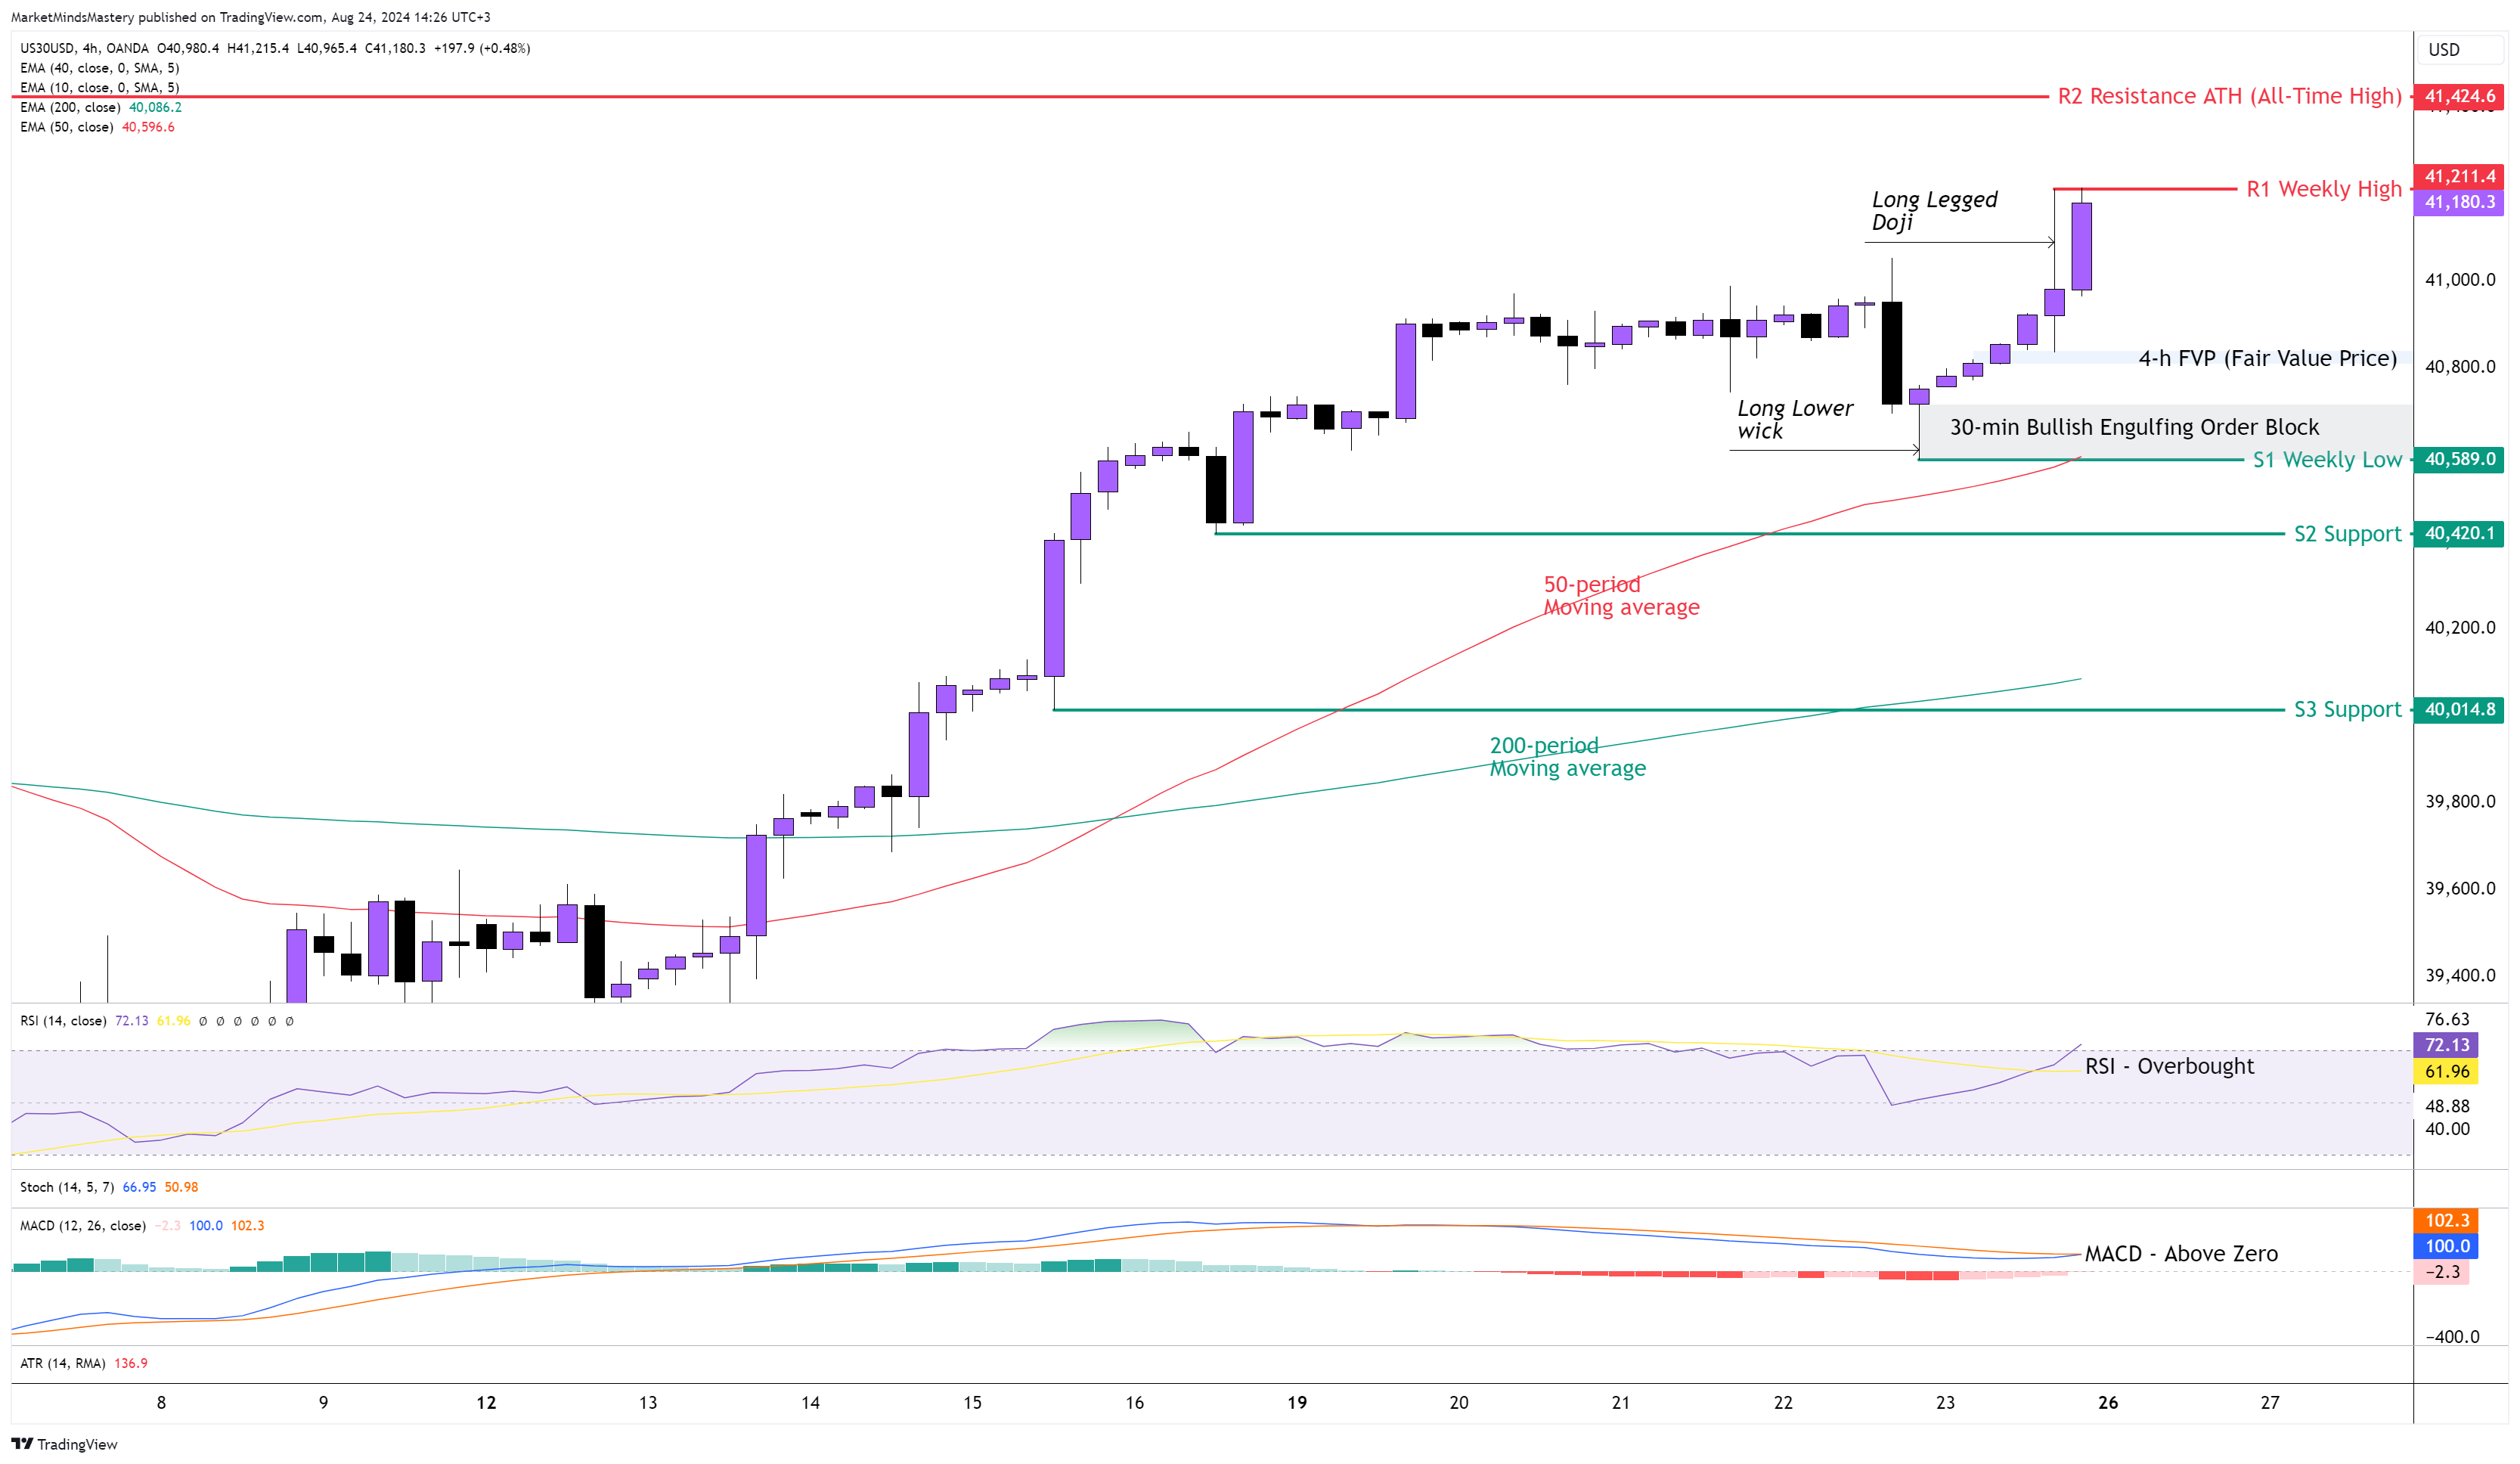
Following the price action on the weekly chart and the overall trend direction from the previous week, the price kept moving upwards, creating a new higher high on the weekly chart. The candlestick pattern printed was a Bullish Marubozu candle. On the 4-hour chart, the 50-period moving average is above the 200-period moving average, which has bullish implications. Last Friday, after Powell's speech, the price rallied, and the RSI Oscillator entered its Overbought area, magnifying the US30's strength. The MACD, on the other hand, is above the zero line, which has bullish implications. Last Thursday, the market created a swing low point around $40590, printing a Long Lower Wick candle, which has bullish implications. That area is marked by a Bullish Engulfing Order Blcok, as shown in the chart above.
Additionally, an FVP (Fair Value Price) was created around $40800. Starting Monday, if the price keeps moving upwards, the first resistance area, R1, will be the previous week's high, around $41211. If the price surpasses the R1, the next resistance area, R2, will be the ATH (All-Time High) at approximately $41424.
Conversely, if the price is rejected and moves downwards, the first support area, S1, will be the previous week's low, around $40589. This level coexists with the Bullish Engulfing Order Block and the 50-period moving average, which can act as a dynamic resistance for the price. In case the price penetrates the S1 support and declines more, the next support area, S2, will be around $40420. If the price goes through the S2, the next support level, S3, is approximately 440014.
GER 30, 4H
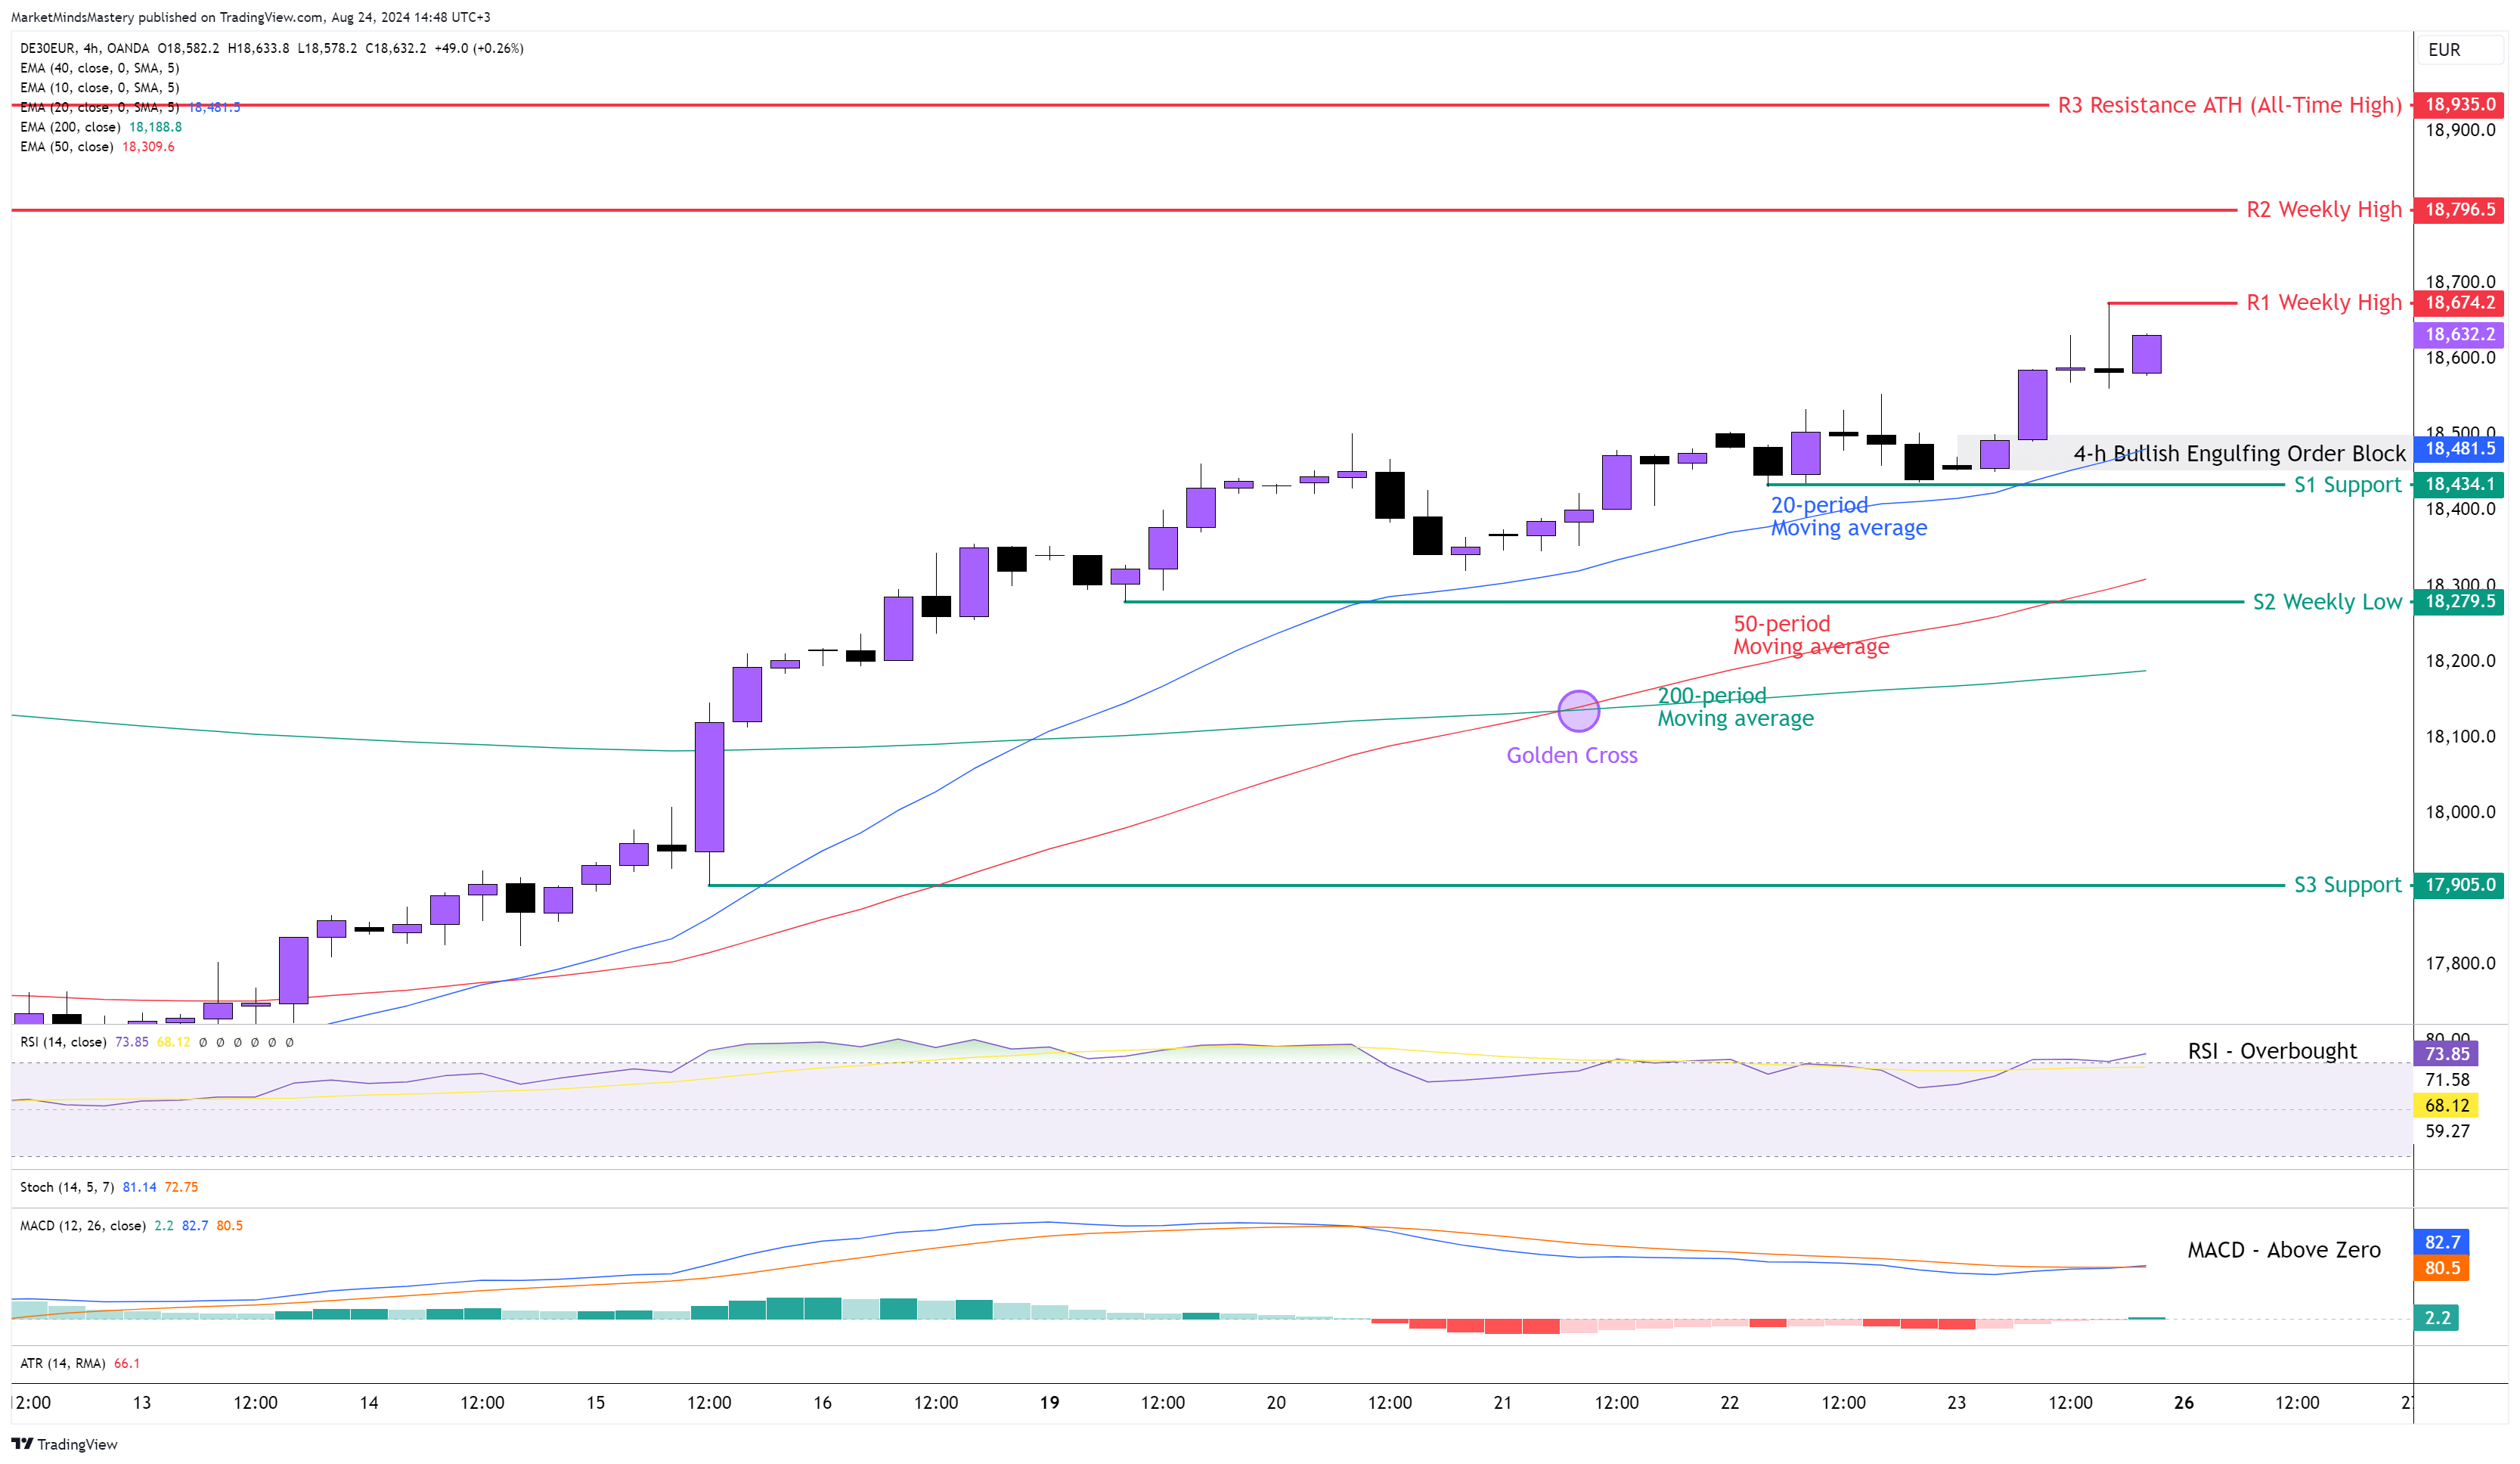
Last week, the German Indicie kept moving upwards as expected. The price on the weekly chart was a Bullish candle. On the 4-hour chart, the price kept its higher high and higher low formation. Last week, around the 18500 price level, the market created a Bullish Engulfing Order Block. The 20-period is above the 50-period moving average, and this has bullish implications.
Additionally, the 50-period crossed above the 200-period moving average known as the "Golden Cross". The RSI Oscillator is in an Overbought condition after the price moved upward last Friday. The MACD is above its zero line, and this has bullish implications. Although the MACD Line (Blue) and the Signal Line (Orange) are not separated from each other, it generally has bullish implications. The MACD's Histogram is positive, and this confirms the upward price move. In case the price continues to move upwards, the first resistance area, R1, will be the previous week's high around 18674. If the price penetrates the R1 and keeps increasing, the next resistance area, R2, will have an old weekly high price of approximately 18796. A further upward move will find the R3 resistance being the ATH (All-Time High) at 18935.
On the other hand, if the price declines and moves downwards, the first support area, S1, will be approximately 18434. This level coexists with the 4-h Bullish Engulfing Order Block and the 20-period moving average. If the price penetrates the S1 and keeps lowering, the next support level, S2, will be the previous week's low, around 18279.
.png)